Embed Size (px)
Citation preview
1
Melanie StopferIBM Software [email protected]
Help Me, Help You - Remote DRDA
Connections to DB2 z/OS me
Title:
Help Me, Help You - remote DRDA connections to DB2 z/OS
Abstract:Do you want to better understand and tune your remote DRDA connections to DB2 z/OS? Are you looking for tips to make your life easier? Melanie will present analogies and insider advice to help improve performance, availability, reliability, and usability. The goal is to provide you with an arsenal of tips you can use in various remote DRDA distributed to DB2 z/OS situations. Come learn new DB2 Connect and JDBC Universal Driver tips and tricks that you need to know.
Objectives:Conquering JDBC Universal DriversMonitoring remote DRDA to DB2 z/OS connectionsPerformance ConsiderationsConnection Concentrator vs. Connection PoolingTuning Considerations.
2
• Enhancements to DRDA clients• Conquering JDBC Universal Drivers• Monitoring remote DRDA to DB2 z/OS
connections• Performance Considerations• Connection Concentrator vs. Connection
Pooling• Tuning Considerations
Objectives
2
The above objectives will be covered.
3
DB2 9.5 FP3: JDBC license file added to DB2 Connect & DB2 Database Enterprise Developer Edition Activation CDs• JDBC license file, db2cc_license_ciusz.jar, can be retrieved from all
DB2 Connect and DB2 Database Enterprise Developer Edition Activation CDs.
• In previous releases, file could only be retrieved from full install images of DB2 Connect products. This change allows those who require only the JDBC license file to easily locate and extract file for use in their application environment.
• Along with this change, a DB2 Connect Personal Edition Activation CD was introduced. CD contains licenses for DB2 Connect Personal Edition as well as db2cc_license_ciusz.jar license file.
• Any new and updated Activation CDs may be obtained through Passport Advantage.
3
DB2 9.5 FP3: JDBC license file added to DB2 Connect and DB2 Database Enterprise Developer Edition Activation CDs
The JDBC license file, db2cc_license_ciusz.jar, may be found on all DB2 Connect and DB2 Database Enterprise Developer Edition Activation CDs.
4
DB2 9.5 FP3: New IBM Data Server Driver for ODBC, CLI, OLE, .NET Client
• New IBM Data Server Driver for ODBC, CLI, and .NET client simplifies access to DB2 z/OS servers from Windows-based applications that use the ODBC driver, CLI driver, OLE DB driver, or IBM Data Server Provider for .NET. – Full Sysplex Support extended to IBM Data Server
Clients and non-Java data server drivers• Transaction-level load balancing• Automatic client reroute with seamless
failover for CLI and .NET applications • XA support for some
Transaction Managers available in the client 4
New DB2 driver simplifies deployment (Windows)The new IBM Data Server Driver for ODBC, CLI, and .NET makes it easier to provide access to DB2 servers from Windows-based applications that use the ODBC driver, CLI driver, OLE DB driver, or IBM Data Server Provider for .NET.
The new IBM Data Server Driver for ODBC, CLI, and .NET simplifies application deployment on Windows platforms. This driver, which has a small footprint, is designed to be redistributed by independent software vendors (ISVs) and to be used for application distribution in mass deployment scenarios typical of large enterprises.
Driver registration and configuration during installation and driver unregistration during uninstallation are handled automatically by the DB2 installation program.
This driver has been updated in Fix Pack 3 to include OLE DB support, application header files for open source drivers and configuration enhancements.
For Linux and UNIX operating systems, you can still get the IBM Data Server Driver for ODBC and CLI, in a tar format.
5
IBM Data Server Driver for ODBC and CLI
Prior to DB2 9.5 FP3, DB2 Connect Enterprise Edition required for Sysplex Support
Target database: DB2zOS
DB2 for z/OSDBM1
DB2 for z/OSDBM2
SYSPLEX
Which is better DBM1 or DBM2?
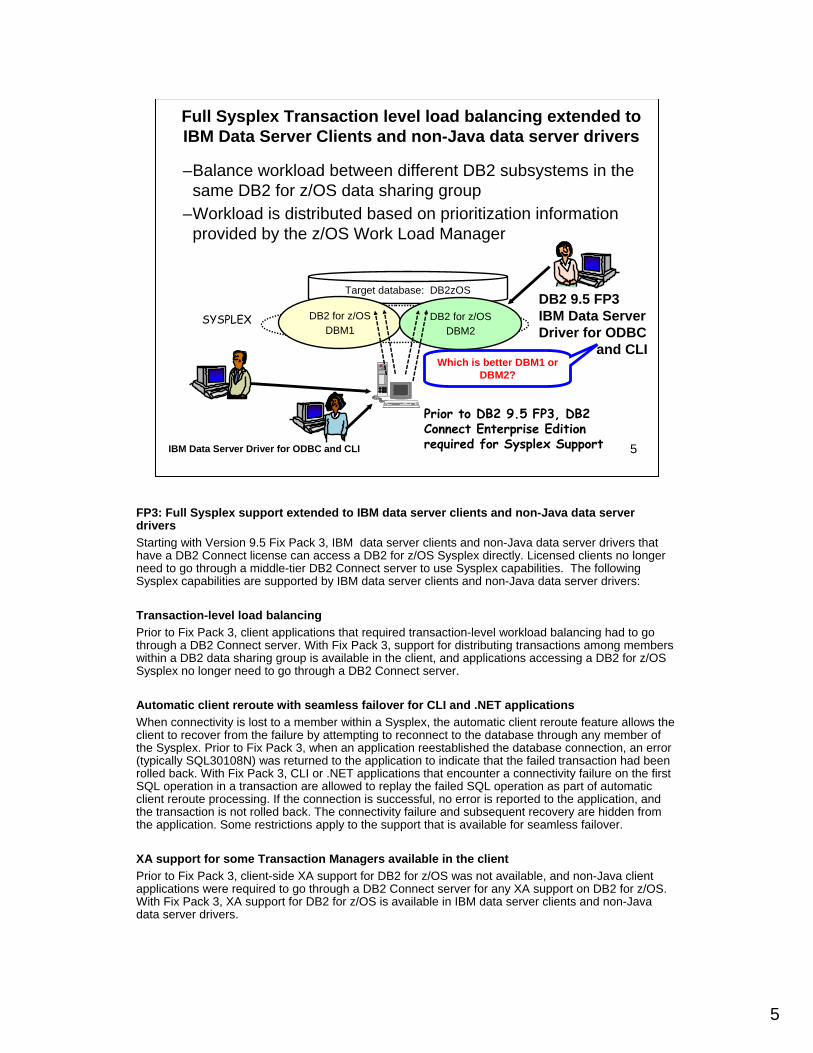
Full Sysplex Transaction level load balancing extended to IBM Data Server Clients and non-Java data server drivers
–Balance workload between different DB2 subsystems in thesame DB2 for z/OS data sharing group
–Workload is distributed based on prioritization information provided by the z/OS Work Load Manager
DB2 9.5 FP3 IBM Data Server Driver for ODBC
and CLI
5
FP3: Full Sysplex support extended to IBM data server clients and non-Java data server driversStarting with Version 9.5 Fix Pack 3, IBM data server clients and non-Java data server drivers that have a DB2 Connect license can access a DB2 for z/OS Sysplex directly. Licensed clients no longer need to go through a middle-tier DB2 Connect server to use Sysplex capabilities. The following Sysplex capabilities are supported by IBM data server clients and non-Java data server drivers:
Transaction-level load balancing Prior to Fix Pack 3, client applications that required transaction-level workload balancing had to go through a DB2 Connect server. With Fix Pack 3, support for distributing transactions among members within a DB2 data sharing group is available in the client, and applications accessing a DB2 for z/OS Sysplex no longer need to go through a DB2 Connect server.
Automatic client reroute with seamless failover for CLI and .NET applications When connectivity is lost to a member within a Sysplex, the automatic client reroute feature allows the client to recover from the failure by attempting to reconnect to the database through any member of the Sysplex. Prior to Fix Pack 3, when an application reestablished the database connection, an error (typically SQL30108N) was returned to the application to indicate that the failed transaction had been rolled back. With Fix Pack 3, CLI or .NET applications that encounter a connectivity failure on the first SQL operation in a transaction are allowed to replay the failed SQL operation as part of automatic client reroute processing. If the connection is successful, no error is reported to the application, and the transaction is not rolled back. The connectivity failure and subsequent recovery are hidden from the application. Some restrictions apply to the support that is available for seamless failover.
XA support for some Transaction Managers available in the clientPrior to Fix Pack 3, client-side XA support for DB2 for z/OS was not available, and non-Java client applications were required to go through a DB2 Connect server for any XA support on DB2 for z/OS. With Fix Pack 3, XA support for DB2 for z/OS is available in IBM data server clients and non-Java data server drivers.

6
1. I cannot connectusing this route ...
Prior to DB2 9.5 FP3 IBM Data Server Driver for ODBC and CLI required DB2 Connect Enterprise Edition
DB2zOSDB2 for z/OS
DBM1 DB2 for z/OSDBM2
SYSPLEX
2. Try an alternateaddress !
• When connectivity lost to member within Sysplex, automatic client reroute feature allows client to recover from failure by attempting to reconnect to database through any member of the Sysplex.
• Prior to DB2 9.5 FP3, when application reestablished database connection, an error (SQL30108N) was returned to application indicating failed tx rolled back.
• With DB2 9.5 FP3, CLI or .NET applications with connectivity failure on first SQL operation in tx replay failed SQL operation as part of automatic client reroute. If connection successful, transaction replays, and no error reported to application, and tx is not rolled back. Connectivity failure and subsequent recovery are hidden from application.
DB2 9.5 FP3 IBM Data Server Driver for ODBC and CLI – CLI or.NET application
Automatic Client Reroute with Seamless Failover for CLI and .NET applications
6
Automatic client reroute with seamless failover for CLI and .NETapplications When connectivity is lost to a member within a Sysplex, the automatic client reroute feature allows the client to recover from the failure by attempting to reconnect to the database through any member of the Sysplex. Prior to Fix Pack 3, when an application reestablished the database connection, an error (typically SQL30108N) was returned to the application to indicate that the failed transaction had been rolled back. With Fix Pack 3, CLI or .NET applications that encounter a connectivity failure on the first SQL operation in a transaction are allowed to replay the failed SQL operation as part of automatic client reroute processing. If the connection is successful, no error is reported to the application, and the transaction is not rolled back. The connectivity failure and subsequent recovery are hidden from the application. Some restrictions apply to the support that is available for seamless failover.
7
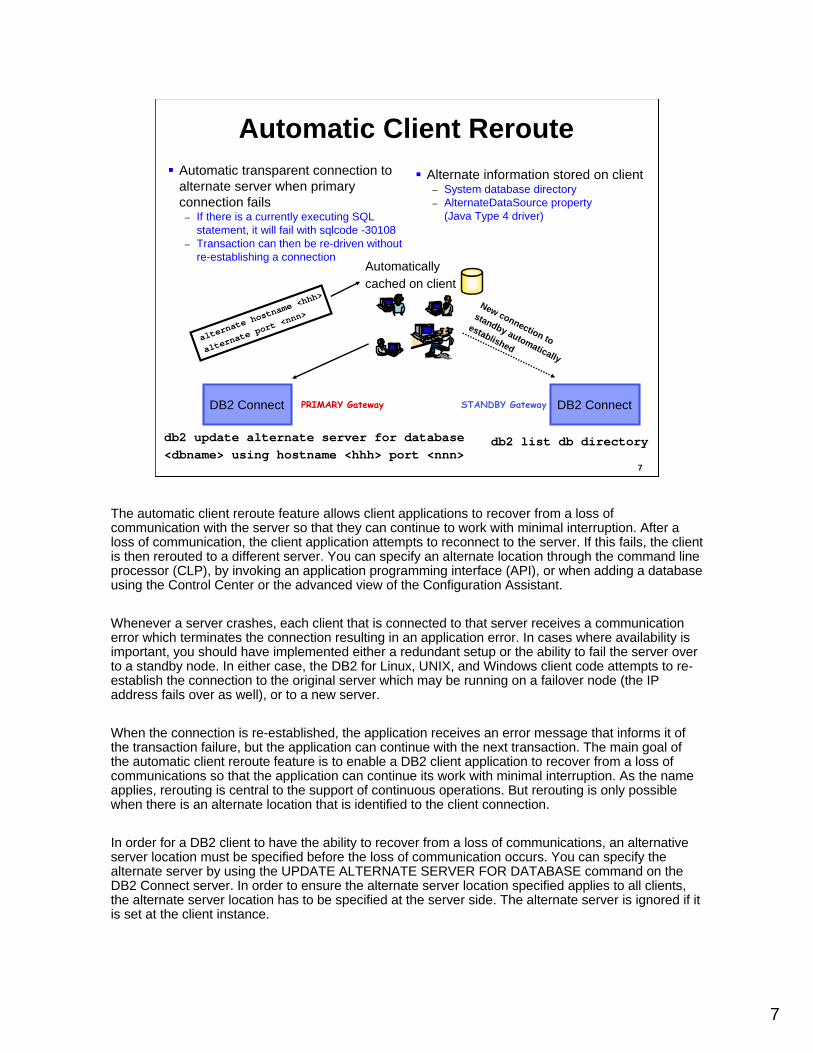
Automatic transparent connection toalternate server when primaryconnection fails
– If there is a currently executing SQLstatement, it will fail with sqlcode -30108
– Transaction can then be re-driven withoutre-establishing a connection
Alternate information stored on client– System database directory– AlternateDataSource property
(Java Type 4 driver)
db2 update alternate server for database<dbname> using hostname <hhh> port <nnn>
DB2 Connect DB2 ConnectPRIMARY Gateway STANDBY Gateway
Automaticallycached on client
altern
ate ho
stname
<hhh>
altern
ate po
rt <nn
n>New connection to
standby automatically
established
db2 list db directory
Automatic Client Reroute
7
The automatic client reroute feature allows client applications to recover from a loss of communication with the server so that they can continue to work with minimal interruption. After a loss of communication, the client application attempts to reconnect to the server. If this fails, the client is then rerouted to a different server. You can specify an alternate location through the command line processor (CLP), by invoking an application programming interface (API), or when adding a database using the Control Center or the advanced view of the Configuration Assistant.
Whenever a server crashes, each client that is connected to that server receives a communication error which terminates the connection resulting in an application error. In cases where availability is important, you should have implemented either a redundant setup or the ability to fail the server over to a standby node. In either case, the DB2 for Linux, UNIX, and Windows client code attempts to re-establish the connection to the original server which may be running on a failover node (the IP address fails over as well), or to a new server.
When the connection is re-established, the application receives an error message that informs it of the transaction failure, but the application can continue with the next transaction. The main goal of the automatic client reroute feature is to enable a DB2 client application to recover from a loss of communications so that the application can continue its work with minimal interruption. As the name applies, rerouting is central to the support of continuous operations. But rerouting is only possible when there is an alternate location that is identified to the client connection.
In order for a DB2 client to have the ability to recover from a loss of communications, an alternative server location must be specified before the loss of communication occurs. You can specify the alternate server by using the UPDATE ALTERNATE SERVER FOR DATABASE command on the DB2 Connect server. In order to ensure the alternate server location specified applies to all clients, the alternate server location has to be specified at the server side. The alternate server is ignored if it is set at the client instance.
8
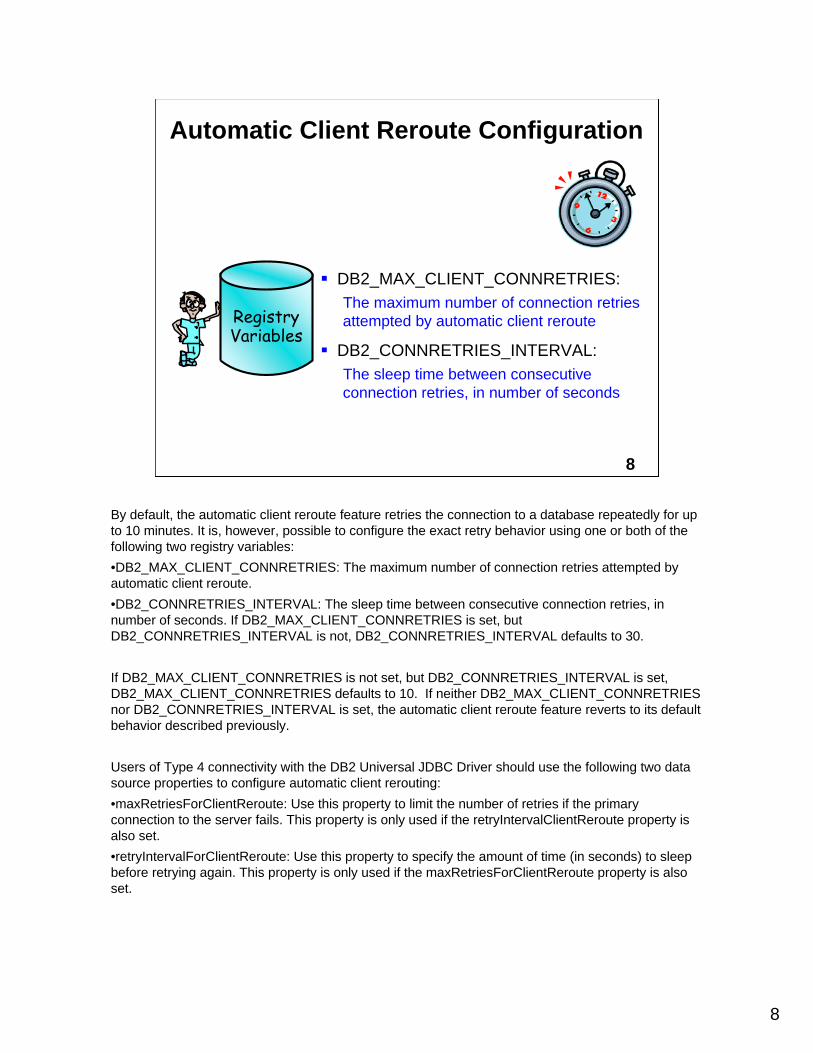
DB2_MAX_CLIENT_CONNRETRIES: The maximum number of connection retries attempted by automatic client reroute
DB2_CONNRETRIES_INTERVAL: The sleep time between consecutiveconnection retries, in number of seconds
RegistryVariables
Automatic Client Reroute Configuration
8
By default, the automatic client reroute feature retries the connection to a database repeatedly for up to 10 minutes. It is, however, possible to configure the exact retry behavior using one or both of the following two registry variables:•DB2_MAX_CLIENT_CONNRETRIES: The maximum number of connection retries attempted by automatic client reroute.•DB2_CONNRETRIES_INTERVAL: The sleep time between consecutive connection retries, in number of seconds. If DB2_MAX_CLIENT_CONNRETRIES is set, but DB2_CONNRETRIES_INTERVAL is not, DB2_CONNRETRIES_INTERVAL defaults to 30.
If DB2_MAX_CLIENT_CONNRETRIES is not set, but DB2_CONNRETRIES_INTERVAL is set, DB2_MAX_CLIENT_CONNRETRIES defaults to 10. If neither DB2_MAX_CLIENT_CONNRETRIES nor DB2_CONNRETRIES_INTERVAL is set, the automatic client reroute feature reverts to its default behavior described previously.
Users of Type 4 connectivity with the DB2 Universal JDBC Driver should use the following two data source properties to configure automatic client rerouting:•maxRetriesForClientReroute: Use this property to limit the number of retries if the primary connection to the server fails. This property is only used if the retryIntervalClientReroute property is also set.•retryIntervalForClientReroute: Use this property to specify the amount of time (in seconds) to sleep before retrying again. This property is only used if the maxRetriesForClientReroute property is also set.
9
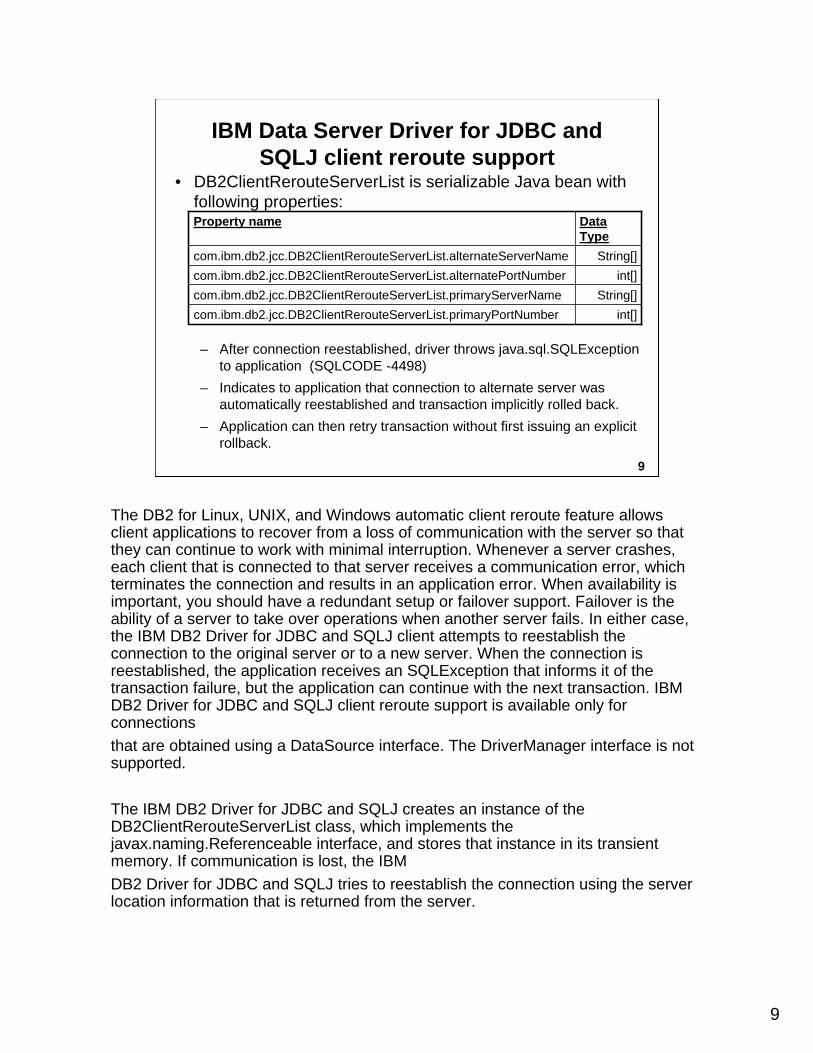
• DB2ClientRerouteServerList is serializable Java bean with following properties:
– After connection reestablished, driver throws java.sql.SQLExceptionto application (SQLCODE -4498)
– Indicates to application that connection to alternate server wasautomatically reestablished and transaction implicitly rolled back.
– Application can then retry transaction without first issuing an explicit rollback.
int[]com.ibm.db2.jcc.DB2ClientRerouteServerList.primaryPortNumberString[]com.ibm.db2.jcc.DB2ClientRerouteServerList.primaryServerName
int[]com.ibm.db2.jcc.DB2ClientRerouteServerList.alternatePortNumberString[]com.ibm.db2.jcc.DB2ClientRerouteServerList.alternateServerName
Data Type
Property name
9
IBM Data Server Driver for JDBC and SQLJ client reroute support
The DB2 for Linux, UNIX, and Windows automatic client reroute feature allows client applications to recover from a loss of communication with the server so that they can continue to work with minimal interruption. Whenever a server crashes, each client that is connected to that server receives a communication error, which terminates the connection and results in an application error. When availability is important, you should have a redundant setup or failover support. Failover is the ability of a server to take over operations when another server fails. In either case, the IBM DB2 Driver for JDBC and SQLJ client attempts to reestablish the connection to the original server or to a new server. When the connection is reestablished, the application receives an SQLException that informs it of the transaction failure, but the application can continue with the next transaction. IBM DB2 Driver for JDBC and SQLJ client reroute support is available only for connectionsthat are obtained using a DataSource interface. The DriverManager interface is not supported.
The IBM DB2 Driver for JDBC and SQLJ creates an instance of the DB2ClientRerouteServerList class, which implements the javax.naming.Referenceable interface, and stores that instance in its transient memory. If communication is lost, the IBMDB2 Driver for JDBC and SQLJ tries to reestablish the connection using the server location information that is returned from the server.
10
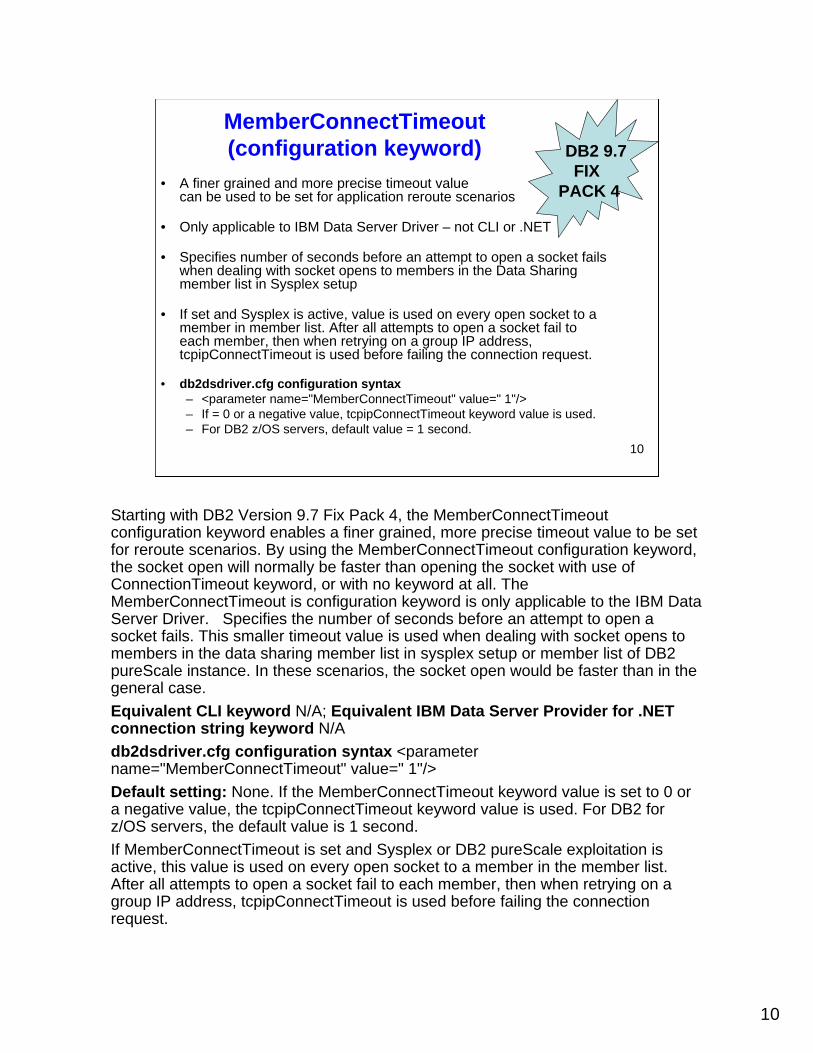
• A finer grained and more precise timeout value can be used to be set for application reroute scenarios
• Only applicable to IBM Data Server Driver – not CLI or .NET
• Specifies number of seconds before an attempt to open a socket fails when dealing with socket opens to members in the Data Sharing member list in Sysplex setup
• If set and Sysplex is active, value is used on every open socket to a member in member list. After all attempts to open a socket fail to each member, then when retrying on a group IP address, tcpipConnectTimeout is used before failing the connection request.
• db2dsdriver.cfg configuration syntax – <parameter name="MemberConnectTimeout" value=" 1"/> – If = 0 or a negative value, tcpipConnectTimeout keyword value is used. – For DB2 z/OS servers, default value = 1 second.
MemberConnectTimeout(configuration keyword) DB2 9.7
FIX PACK 4
10
Starting with DB2 Version 9.7 Fix Pack 4, the MemberConnectTimeoutconfiguration keyword enables a finer grained, more precise timeout value to be set for reroute scenarios. By using the MemberConnectTimeout configuration keyword, the socket open will normally be faster than opening the socket with use of ConnectionTimeout keyword, or with no keyword at all. The MemberConnectTimeout is configuration keyword is only applicable to the IBM Data Server Driver. Specifies the number of seconds before an attempt to open a socket fails. This smaller timeout value is used when dealing with socket opens to members in the data sharing member list in sysplex setup or member list of DB2 pureScale instance. In these scenarios, the socket open would be faster than in the general case.Equivalent CLI keyword N/A; Equivalent IBM Data Server Provider for .NET connection string keyword N/A db2dsdriver.cfg configuration syntax <parameter name="MemberConnectTimeout" value=" 1"/> Default setting: None. If the MemberConnectTimeout keyword value is set to 0 or a negative value, the tcpipConnectTimeout keyword value is used. For DB2 for z/OS servers, the default value is 1 second. If MemberConnectTimeout is set and Sysplex or DB2 pureScale exploitation is active, this value is used on every open socket to a member in the member list. After all attempts to open a socket fail to each member, then when retrying on a group IP address, tcpipConnectTimeout is used before failing the connection request.
11
DB2 ConnectDB2 Connect
Connect
ClientClient
ActiveAgent
InactiveAgent
IdleAgent
Thread
Thread
DBM CFGDBM CFG
NUM_POOLAGENTS>0
DB2 for z/OSDB2 for z/OS
Connection Pooling
11
DEACTIVATE
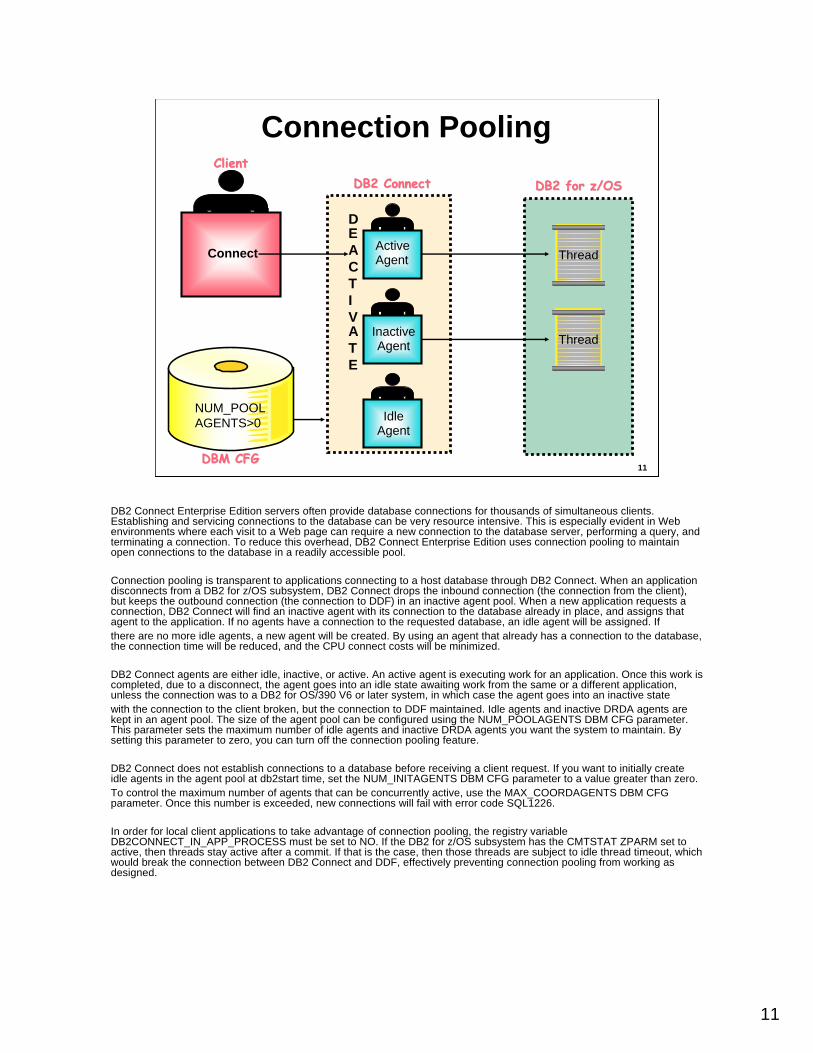
DB2 Connect Enterprise Edition servers often provide database connections for thousands of simultaneous clients. Establishing and servicing connections to the database can be very resource intensive. This is especially evident in Web environments where each visit to a Web page can require a new connection to the database server, performing a query, and terminating a connection. To reduce this overhead, DB2 Connect Enterprise Edition uses connection pooling to maintain open connections to the database in a readily accessible pool.
Connection pooling is transparent to applications connecting to a host database through DB2 Connect. When an application disconnects from a DB2 for z/OS subsystem, DB2 Connect drops the inbound connection (the connection from the client), but keeps the outbound connection (the connection to DDF) in an inactive agent pool. When a new application requests a connection, DB2 Connect will find an inactive agent with its connection to the database already in place, and assigns that agent to the application. If no agents have a connection to the requested database, an idle agent will be assigned. Ifthere are no more idle agents, a new agent will be created. By using an agent that already has a connection to the database, the connection time will be reduced, and the CPU connect costs will be minimized.
DB2 Connect agents are either idle, inactive, or active. An active agent is executing work for an application. Once this work iscompleted, due to a disconnect, the agent goes into an idle state awaiting work from the same or a different application, unless the connection was to a DB2 for OS/390 V6 or later system, in which case the agent goes into an inactive statewith the connection to the client broken, but the connection to DDF maintained. Idle agents and inactive DRDA agents are kept in an agent pool. The size of the agent pool can be configured using the NUM_POOLAGENTS DBM CFG parameter. This parameter sets the maximum number of idle agents and inactive DRDA agents you want the system to maintain. By setting this parameter to zero, you can turn off the connection pooling feature.
DB2 Connect does not establish connections to a database before receiving a client request. If you want to initially create idle agents in the agent pool at db2start time, set the NUM_INITAGENTS DBM CFG parameter to a value greater than zero.To control the maximum number of agents that can be concurrently active, use the MAX_COORDAGENTS DBM CFG parameter. Once this number is exceeded, new connections will fail with error code SQL1226.
In order for local client applications to take advantage of connection pooling, the registry variable DB2CONNECT_IN_APP_PROCESS must be set to NO. If the DB2 for z/OS subsystem has the CMTSTAT ZPARM set to active, then threads stay active after a commit. If that is the case, then those threads are subject to idle thread timeout, which would break the connection between DB2 Connect and DDF, effectively preventing connection pooling from working as designed.
12
DB2 ConnectDB2 Connect
CONNECT
ClientClient
Thread
Thread
DBM CFGDBM CFG
MAX_CONNECTIONS >MAX_COORDAGENTS
LogicalAgent
WorkerAgent
WorkerAgent
Thread
DB2 for z/OSDB2 for z/OS
Connection Concentrator
12
COMM IT
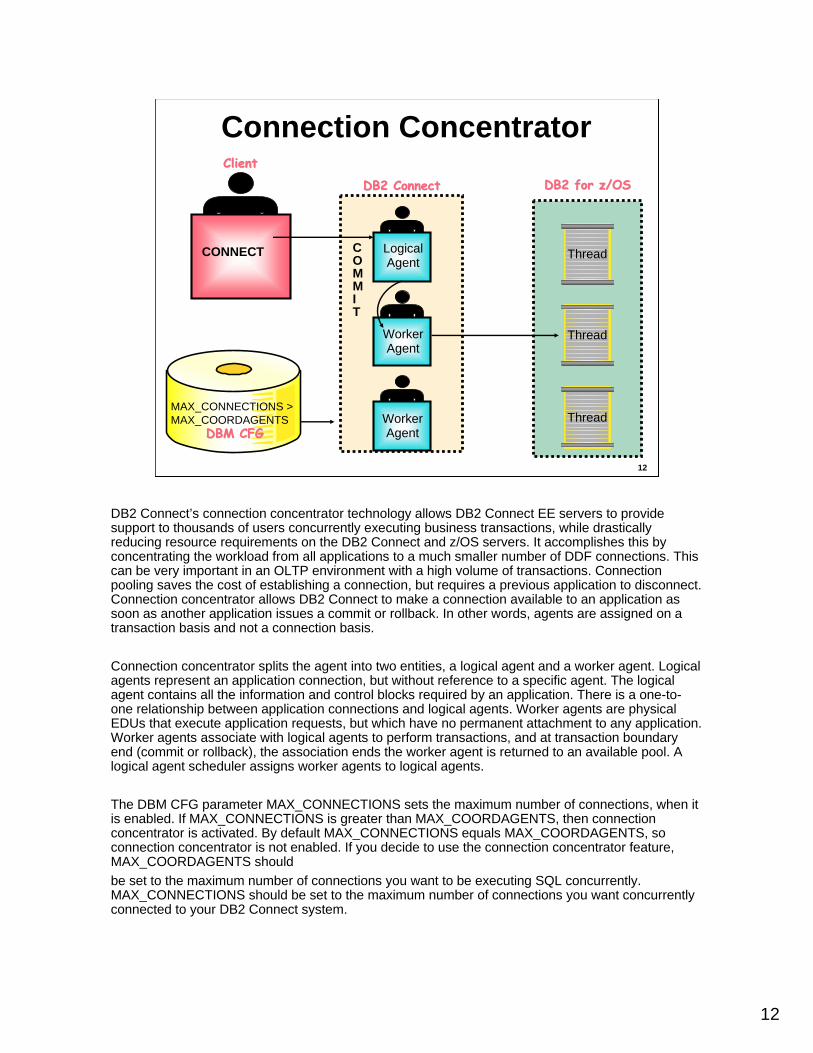
DB2 Connect’s connection concentrator technology allows DB2 Connect EE servers to provide support to thousands of users concurrently executing business transactions, while drastically reducing resource requirements on the DB2 Connect and z/OS servers. It accomplishes this by concentrating the workload from all applications to a much smaller number of DDF connections. This can be very important in an OLTP environment with a high volume of transactions. Connection pooling saves the cost of establishing a connection, but requires a previous application to disconnect. Connection concentrator allows DB2 Connect to make a connection available to an application as soon as another application issues a commit or rollback. In other words, agents are assigned on a transaction basis and not a connection basis.
Connection concentrator splits the agent into two entities, a logical agent and a worker agent. Logical agents represent an application connection, but without reference to a specific agent. The logical agent contains all the information and control blocks required by an application. There is a one-to-one relationship between application connections and logical agents. Worker agents are physical EDUs that execute application requests, but which have no permanent attachment to any application. Worker agents associate with logical agents to perform transactions, and at transaction boundary end (commit or rollback), the association ends the worker agent is returned to an available pool. A logical agent scheduler assigns worker agents to logical agents.
The DBM CFG parameter MAX_CONNECTIONS sets the maximum number of connections, when it is enabled. If MAX_CONNECTIONS is greater than MAX_COORDAGENTS, then connection concentrator is activated. By default MAX_CONNECTIONS equals MAX_COORDAGENTS, so connection concentrator is not enabled. If you decide to use the connection concentrator feature, MAX_COORDAGENTS shouldbe set to the maximum number of connections you want to be executing SQL concurrently. MAX_CONNECTIONS should be set to the maximum number of connections you want concurrently connected to your DB2 Connect system.

13
© Copyright IBM Corporation 2006
Connection Pooling versus Connection Concentrator
Connection Pooling– Is associated with the allocation and deallocation of agents – Decides if the agent can stay or not when the connection
disconnects – Acts upon connections and disconnections– Helps reduce the overhead of creating and terminating
database agents
Connection Concentrator – Is associated with context switching of agents – Decides which application the agents service when the transaction ends – Acts upon transaction boundaries (commit and rollback)– Helps reduce resources each agent allocates when connection is idle
Must connection pooling be ON with concentrator enabled? YES
Must FEDERATED be OFF with concentrator enabled? YES13
Connection concentrator needs connection pooling to be enabled in order to exploit its functionality. With connection concentrator enabled, upon reaching transaction boundaries, the db2agent is free and ready to service other requests. If there are no incoming requests to be serviced, dispatcher will determine whether this agent can stay or not. This is whenpooling comes into play. If pooling is disabled, then this agent will be terminated because no idle agent can stay when pooling is off. If pooling is on, and if keeping this agent will not exceed the num_poolagents limit, then this agent will be kept. It will wait to service the next request. If pooling is on, and if keeping this agent exceeds the num_poolagents limit, then this agent will be terminated.
The potential problem with having pooling disabled and concentrator enabled is that agents get terminated upon reaching a transaction boundary. The majority of agents will be terminated when a transaction ends. New agents always need to be allocated when a transaction starts. This will create a large overhead of allocation and deallocation of agents upon reaching transaction boundaries, which defeats the purpose of the connection concentrator. The federated parameter cannot be enabled with the connection concentrator on. You must specify Federated=NO in the database manager configuration if you want to use the concentrator.
14
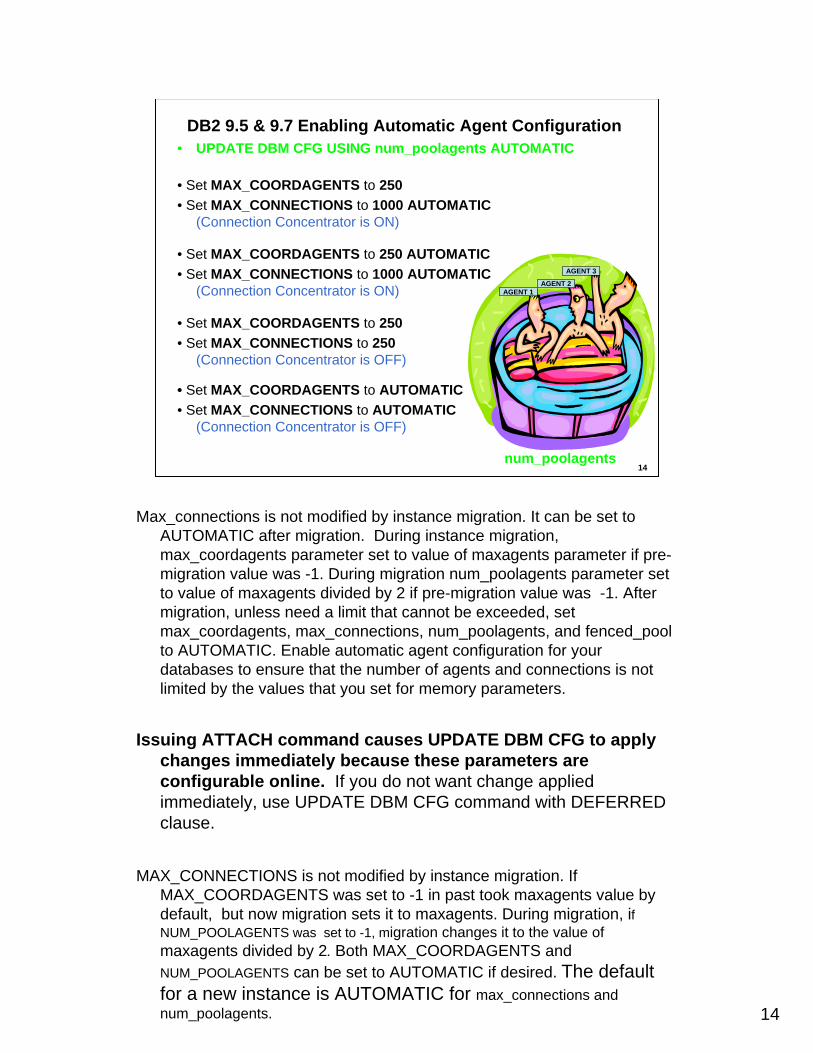
DB2 9.5 & 9.7 Enabling Automatic Agent Configuration• UPDATE DBM CFG USING num_poolagents AUTOMATIC
• Set MAX_COORDAGENTS to 250• Set MAX_CONNECTIONS to 1000 AUTOMATIC
(Connection Concentrator is ON)
• Set MAX_COORDAGENTS to 250 AUTOMATIC• Set MAX_CONNECTIONS to 1000 AUTOMATIC
(Connection Concentrator is ON)
• Set MAX_COORDAGENTS to 250 • Set MAX_CONNECTIONS to 250
(Connection Concentrator is OFF)
• Set MAX_COORDAGENTS to AUTOMATIC• Set MAX_CONNECTIONS to AUTOMATIC
(Connection Concentrator is OFF)
num_poolagents
AGENT 1AGENT 2
AGENT 3
14
Max_connections is not modified by instance migration. It can be set to AUTOMATIC after migration. During instance migration, max_coordagents parameter set to value of maxagents parameter if pre-migration value was -1. During migration num_poolagents parameter set to value of maxagents divided by 2 if pre-migration value was -1. After migration, unless need a limit that cannot be exceeded, set max_coordagents, max_connections, num_poolagents, and fenced_pool to AUTOMATIC. Enable automatic agent configuration for your databases to ensure that the number of agents and connections is not limited by the values that you set for memory parameters.
Issuing ATTACH command causes UPDATE DBM CFG to apply changes immediately because these parameters are configurable online. If you do not want change applied immediately, use UPDATE DBM CFG command with DEFERRED clause.
MAX_CONNECTIONS is not modified by instance migration. If MAX_COORDAGENTS was set to -1 in past took maxagents value by default, but now migration sets it to maxagents. During migration, if NUM_POOLAGENTS was set to -1, migration changes it to the value of maxagents divided by 2. Both MAX_COORDAGENTS and NUM_POOLAGENTS can be set to AUTOMATIC if desired. The default for a new instance is AUTOMATIC for max_connections and num_poolagents.
15
For Reference Only Student Notes
The new maximum value for max_coordagents, num_initagents, and num_initfenced is 64K.
• Set MAX_COORDAGENTS to AUTOMATIC. Set MAX_CONNECTIONS to AUTOMATIC (connection concentrator is OFF). If a system has an average of 1000 connected users but there are never more than 250 concurrent transactions. • Set MAX_COORDAGENTS to 250. Set MAX_CONNECTIONS to 1000 AUTOMATIC (connection concentrator is ON). In a system that could have 1000s of connections and you want to set a ratio of 250 concurrent transactions for each 1000 connections.
• Set MAX_COORDAGENTS to 250 AUTOMATIC. Set MAX_CONNECTIONS to 1000 AUTOMATIC (connection concentrator is ON). If a system should never have more than 250 connected users but there are system resources to support the 250 concurrent transactions.
• Set MAX_COORDAGENTS to 250. Set MAX_CONNECTIONS to 250 (connection concentrator is OFF).
16
Application?Network?
Client System?What type of Client?
DB2 Connect?LUW System?
DRDA?TCP/IP?
DDF?VTAM?
z/OS System?DB2 Subsystem?
UNIX System Services?RACF?
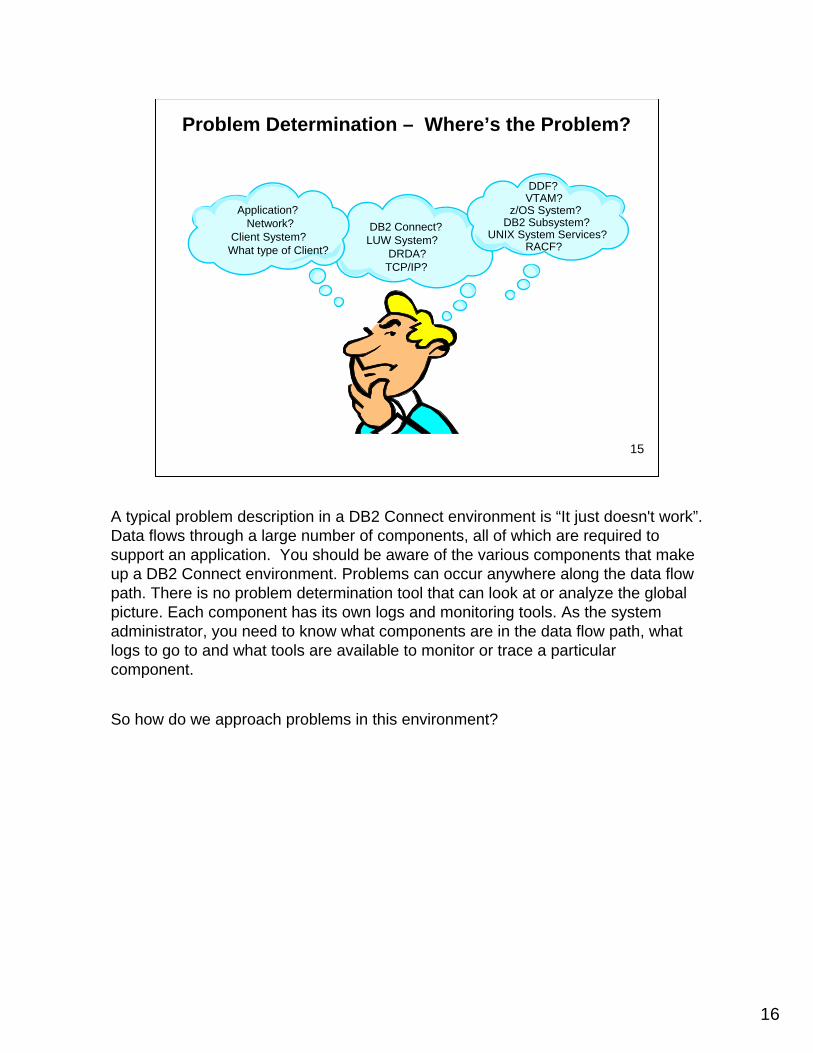
Problem Determination – Where’s the Problem?
15
A typical problem description in a DB2 Connect environment is “It just doesn't work”. Data flows through a large number of components, all of which are required to support an application. You should be aware of the various components that make up a DB2 Connect environment. Problems can occur anywhere along the data flow path. There is no problem determination tool that can look at or analyze the global picture. Each component has its own logs and monitoring tools. As the system administrator, you need to know what components are in the data flow path, what logs to go to and what tools are available to monitor or trace a particular component.
So how do we approach problems in this environment?
17
Monitoring and Flow Summary
DB2
TCP/IP
USS
DDF
thread
TCP/IP
TCP/IP
Agent
TCP/IP
Application
ODBC
DB2
RUN
TIME
DB2
CLI/JCC
Client DB2 Connect z/OS
db2 ping
jcctraceclitrace(In Appli-cation)
jcctraceclitrace (In DB2)
Class 1 Elapsed - Class 2 Nonnested Elapsed
Class 1 Elapsed
pingsnapshot
db2drdatsnapshot
Class 1Nonnested
CPU -Class 2
NonnestedCPU
Class 2Non-nestedElapsednetwork analyzer network analyzer
ping
snapshot
16
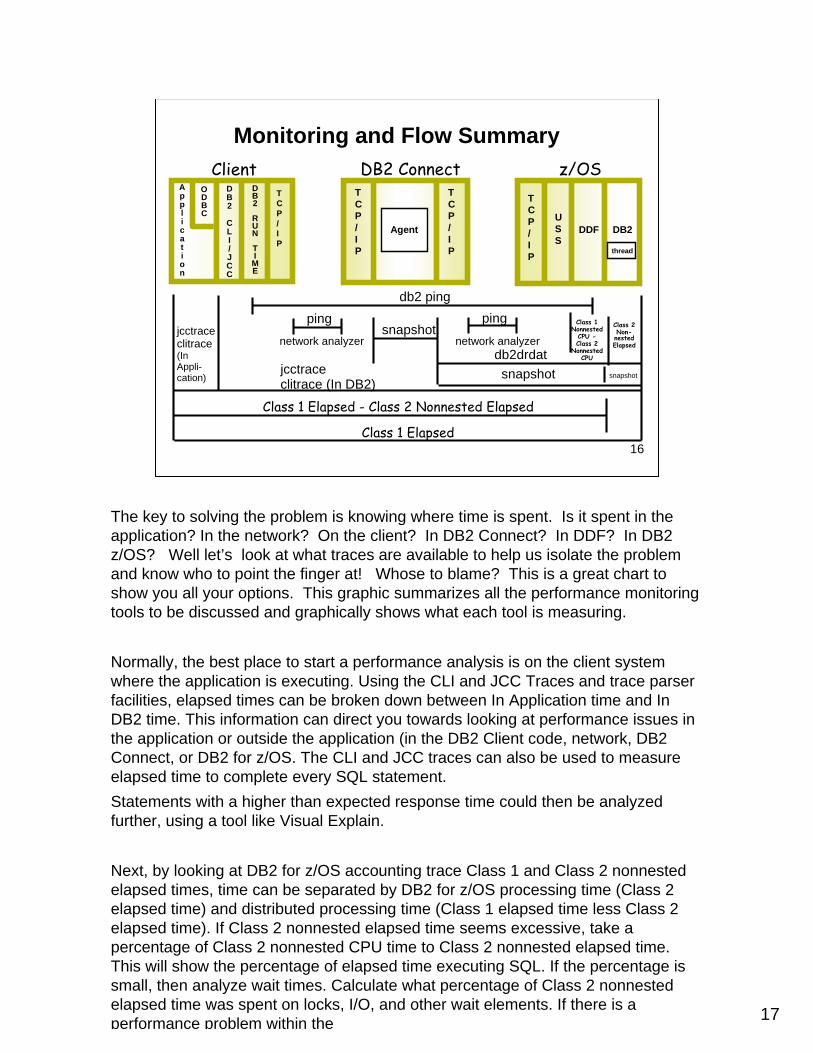
The key to solving the problem is knowing where time is spent. Is it spent in the application? In the network? On the client? In DB2 Connect? In DDF? In DB2 z/OS? Well let’s look at what traces are available to help us isolate the problem and know who to point the finger at! Whose to blame? This is a great chart to show you all your options. This graphic summarizes all the performance monitoring tools to be discussed and graphically shows what each tool is measuring.
Normally, the best place to start a performance analysis is on the client system where the application is executing. Using the CLI and JCC Traces and trace parser facilities, elapsed times can be broken down between In Application time and In DB2 time. This information can direct you towards looking at performance issues in the application or outside the application (in the DB2 Client code, network, DB2 Connect, or DB2 for z/OS. The CLI and JCC traces can also be used to measure elapsed time to complete every SQL statement.Statements with a higher than expected response time could then be analyzed further, using a tool like Visual Explain.
Next, by looking at DB2 for z/OS accounting trace Class 1 and Class 2 nonnested elapsed times, time can be separated by DB2 for z/OS processing time (Class 2 elapsed time) and distributed processing time (Class 1 elapsed time less Class 2 elapsed time). If Class 2 nonnested elapsed time seems excessive, take a percentage of Class 2 nonnested CPU time to Class 2 nonnested elapsed time. This will show the percentage of elapsed time executing SQL. If the percentage is small, then analyze wait times. Calculate what percentage of Class 2 nonnested elapsed time was spent on locks, I/O, and other wait elements. If there is a performance problem within the
18
For Reference Only Student Notes
DB2 server, this will normally identify where the problem is located.
If DB2 server processing time is not an issue, then the distributed parts of the flow must be analyzed. Using the TCP/IP ping command or a network analyzer, an estimate can be made for network delay times. If the ping command is used, make sure appropriate transmission block sizes are used with ping. Most network times are measured in milliseconds. Ideally, network delays should be no more than 5 milliseconds.
Time spent in DDF can be computed by subtracting accounting Class 2 nonnested CPU time from accounting Class 1 nonnested CPU time. This would normally be a very small percentage of total elapsed time (DB2 for z/OS Class 1 elapsed time).
Time spent in DB2 Connect can be determined either by using the DB2 Connect Snapshot facility or a network analyzer trace. DB2 Connect time will normally be less than 5 milliseconds. If not, then collect system resource usage statistics on CPU, memory, and TCP/IP. The DB2 Connect Snapshot can also be used to obtain the elapsed time spent In DB2, excluding DB2 Connect and client to DB2 Connect network delays.
The db2 ping command may be used to test the network response time of the underlying connectivity between a client and a database server where DB2 Connect is used to establish the connection. The command is issued at the client system and the elapsed time returned is for the connection between the client and a DRDA server database via DB2 Connect.
19
db2cli.ini
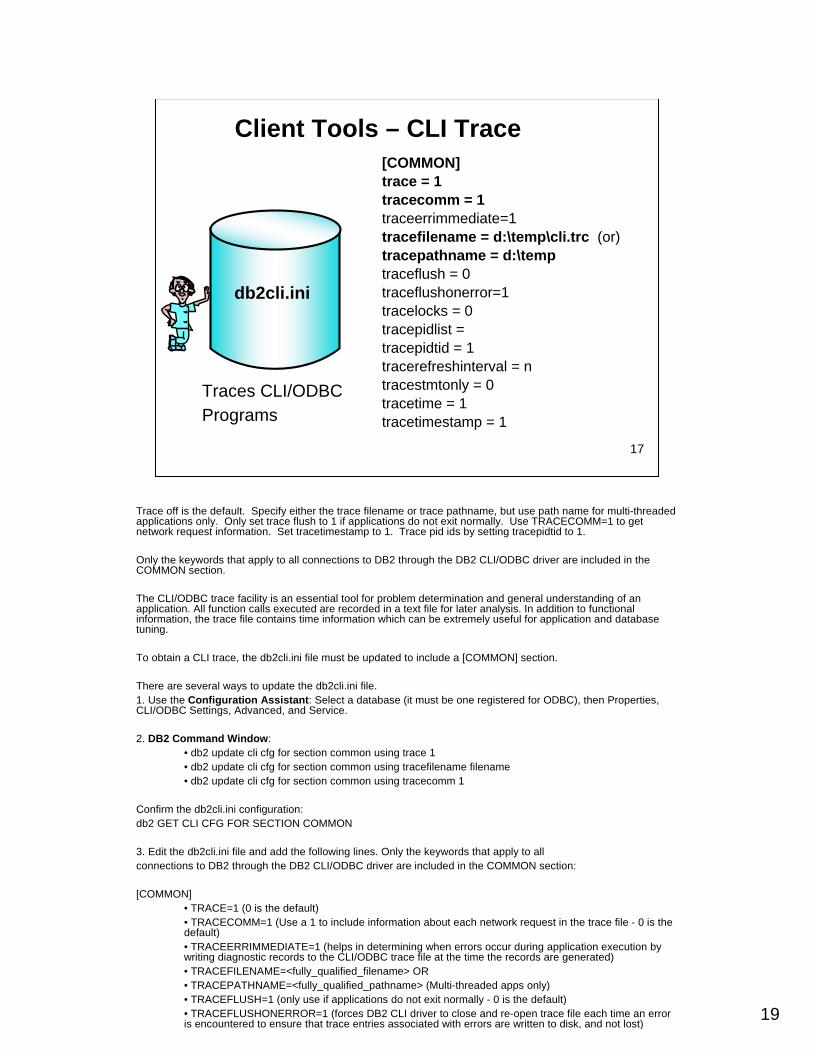
[COMMON]trace = 1tracecomm = 1traceerrimmediate=1tracefilename = d:\temp\cli.trc (or)tracepathname = d:\temptraceflush = 0traceflushonerror=1tracelocks = 0tracepidlist =tracepidtid = 1tracerefreshinterval = ntracestmtonly = 0tracetime = 1tracetimestamp = 1
Traces CLI/ODBC Programs
Client Tools – CLI Trace
17
Trace off is the default. Specify either the trace filename or trace pathname, but use path name for multi-threaded applications only. Only set trace flush to 1 if applications do not exit normally. Use TRACECOMM=1 to get network request information. Set tracetimestamp to 1. Trace pid ids by setting tracepidtid to 1.
Only the keywords that apply to all connections to DB2 through the DB2 CLI/ODBC driver are included in the COMMON section.
The CLI/ODBC trace facility is an essential tool for problem determination and general understanding of an application. All function calls executed are recorded in a text file for later analysis. In addition to functional information, the trace file contains time information which can be extremely useful for application and database tuning.
To obtain a CLI trace, the db2cli.ini file must be updated to include a [COMMON] section.
There are several ways to update the db2cli.ini file.1. Use the Configuration Assistant: Select a database (it must be one registered for ODBC), then Properties, CLI/ODBC Settings, Advanced, and Service.
2. DB2 Command Window:• db2 update cli cfg for section common using trace 1• db2 update cli cfg for section common using tracefilename filename• db2 update cli cfg for section common using tracecomm 1
Confirm the db2cli.ini configuration:db2 GET CLI CFG FOR SECTION COMMON
3. Edit the db2cli.ini file and add the following lines. Only the keywords that apply to allconnections to DB2 through the DB2 CLI/ODBC driver are included in the COMMON section:
[COMMON]• TRACE=1 (0 is the default)• TRACECOMM=1 (Use a 1 to include information about each network request in the trace file - 0 is the default)• TRACEERRIMMEDIATE=1 (helps in determining when errors occur during application execution by writing diagnostic records to the CLI/ODBC trace file at the time the records are generated)• TRACEFILENAME=<fully_qualified_filename> OR• TRACEPATHNAME=<fully_qualified_pathname> (Multi-threaded apps only)• TRACEFLUSH=1 (only use if applications do not exit normally - 0 is the default)• TRACEFLUSHONERROR=1 (forces DB2 CLI driver to close and re-open trace file each time an error is encountered to ensure that trace entries associated with errors are written to disk, and not lost)
20
For Reference Only Student Notes
• TRACELOCKS=0 (or let it default to this)• TRACEPIDLIST= (let it default to trace all process IDs)• TRACEPIDTID=0 (1 to collect process and thread ids in trace - 0 is the default)• TRACEREFRESHINTERVAL=0 (or let it default to this)• TRACESTMTONLY=0 (or let it default to this)• TRACETIME=1 (or let it default to this)• TRACETIMESTAMP=1 (0 is the default)• DisableMultiThread - Use this setting for multithreaded applications that require serialized behavior. 0 (default) is enabled; 1 is disabled.
The DB2 Legacy JDBC Driver is based on the DB2 Call Level Interface (CLI) layer and allows for JDBC or CLI tracing through changes in the CLI configuration. The connection to the database occurs through a native database interface; in this case, DB2 uses CLI. The JDBC layer sits on top of CLI, and CLI is the native component that communicates with the database server. The newer DB2 Universal JDBC Driver is not based on the DB2 CLI layer, so the CLI trace facilities are no longer available for JDBC type 4 and type 2 drivers. Instead the DB2 Universal JDBC Driver offers trace facilities by setting certain driver properties.
As entries in the file db2cli.ini are only read when a database connection is first established, changes to the db2cli.ini file have no impact on existing database connections.
The following options may be used in the COMMON section to trace DB2 Legacy JDBC Driver programs (not Type 4 or Type 2 JDBC Drivers).
• JDBCTrace - Controls whether or not other DB2 JDBC tracing keywords have any effect on program execution. 0 (default) disables and 1 enables the DB2 JDBC trace facility.• JDBCTraceFlush - Specifies how often trace information is written to the DB2 JDBC trace log file. By default, it is set to 0 and each DB2 JDBC trace log file is kept open until the traced application or thread terminates normally. If the application terminates abnormally, some trace information that was not written to the trace log file may be lost.• JDBCTracePathName=<fully_qualified_trace_path_name> - This is a directory to which all DB2 JDBC trace information is written. The DB2 JDBC trace facility attempts to generate a new trace log file each time a JDBC application is executed using the CLI-based Legacy Type 2 JDBC Driver. If the application is multithreaded, a separate trace log file will be generated for each thread. A concatenation of the application process ID, the thread sequence number, and a thread-identifying string are automatically used to name trace log files. There is no default path name to which DB2 JDBC trace output log files are written.
Trace data is appended to any existing trace files.

21
Client Tools – CLI Trace OutputSQLPrepare( hStmt=1:6, pszSqlStr="SELECT A.BRANCH_ID, B.BRANCH_NAME, COUNT(*),SUM(A.BALANCE) FROM ACCT A, BRANCH B WHERE A.BRANCH_ID = B.BRANCH_ID GROUP BYA.BRANCH_ID, B.BRANCH_NAME", cbSqlStr=-3 )
---> Time elapsed - +0.000000E+000 seconds( StmtOut="SELECT A.BRANCH_ID, B.BRANCH_NAME, COUNT(*), SUM(A.BALANCE) FROM ACCTA, BRANCH B WHERE A.BRANCH_ID = B.BRANCH_ID GROUP BY A.BRANCH_ID, B.BRANCH_NAMEFOR FETCH ONLY" )
SQLPrepare ( )<--- SQL_SUCCESS Time elapsed - +0.000000E+000 seconds
SQLExecute (hStmt=1:6 )---> Time elapsed - +0.000000E+000 secondssqlccsend( ulBytes - 436 )sqlccsend( Handle - 12744784 )sqlccsend( ) - rc - 0, time elapsed - +0.000000E+000 secondssqlccrecv( )sqlccrecv( ulBytes - 163 ) - rc - 0, time elapsed - +4.000000E-002
SQLExecute ( )<--- SQL_ERROR Time elapsed - +4.000000E-002 seconds
SQLFreeStmt ( hStmt=1:6, fOption=SQL_CLOSE )---> Time elapsed - +0.000000E+000 seconds
( Unretrieved error message="SQL0206N "A.BRANCH_ID" is not a colum in an inserted table, updated table, or any table identified in a FROM clause or is not a valid transition variable for the subject table of a trigger.SQLSTATE=42703" )( COMMIT=0
sqlccsend( ulBytes - 196 )sqlccsend( Handle - 12744784 )sqlccsend( ) - rc - 0, time elapsed - +0.000000E+000 sqlccrecv( )sqlccrecv( ulBytes - 27 ) - rc - 0, time elapsed - +3.000000E-002
18
The .002 negative means move decimal place two to the left so 4.0 -002 seconds is .04 seconds or 4 milliseconds. There was deferred prepare turned on by default. The execute had an error so didn’t take long to run the statement.
The DB2 Run-Time Client CLI driver writes trace records when it is entered and when it exits, to reflect the activity just completed. In the above graphic, the SQLPrepare entered into the CLI driver. You can tell entry records by the ---> symbol on the Time elapsed line.
The second entry for SQLPrepare was the exit from the CLI driver. The <--- symbol represents an exit from the CLI driver. The Time elapsed is the time spent in DB2 to process the SQLPrepare call. The in DB2 time includes the time in the CLI Driver, the DB2 Run-Time Client, the entire communication infrastructure between client and the database server, time spent on the DB2 Connect Server, and the time spent in the DB2 for z/OS subsystem.
The second SQLExecute record shows an SQL error occurred during execution of the SQL statement.
The line, SQLFreeStmt, shows the SQL error, SQL0206N, and a description of the error. The COMMIT statement flows because autocommit is on by default.
The trace example was captured using TRACECOMM=1. What was added to the trace were the lines in the entry record for SQLExecute following the “Time elapsed” line. By specifying TRACECOMM=1, you can:
1. Find out when a client-to-server communication occurs, either locally or over the network. Many CLI functions are processed completely on the client and therefore do not represent a performance problem.2. Find out the number of bytes sent and received in each communication.3. Break down CLI call elapsed times into their CLI and their communications components.
The CLI trace information provides you with several timings:• The time between SQL requests• The time to process the send and get a confirmation back• The time from the end of the send to the end of the receive• The total time spent "in DB2"
Two CLI keywords allow you to timestamp each record and to also include process and thread IDs.
• TraceTimeStamp adds a timestamp to the beginning of each line. There are three formats available, with the default value being 0 (off).
1. =1 [<number of seconds since 01/01/1970>.<microseconds>-<formatted timestamp>]2. =2 [<number of seconds since 01/01/1970>]3. =3 [<formatted timestamp>]
• TracePidTid causes each line to begin with the process ID and thread ID of the application thread issuing the CLI call.
22
For Reference Only Student Notes
What to look for during the analysis:• Get a breakdown of time spent in the application versus time spent “in DB2”• Find out how long CLI calls are taking and which ones are the most expensive• Find the longest intervals of execution, in either the application or “in DB2”• Find the number of CLI calls and of what types• Find out how much data is transferred to or from the server• Study the timing relationship between multiple threads in an application
23
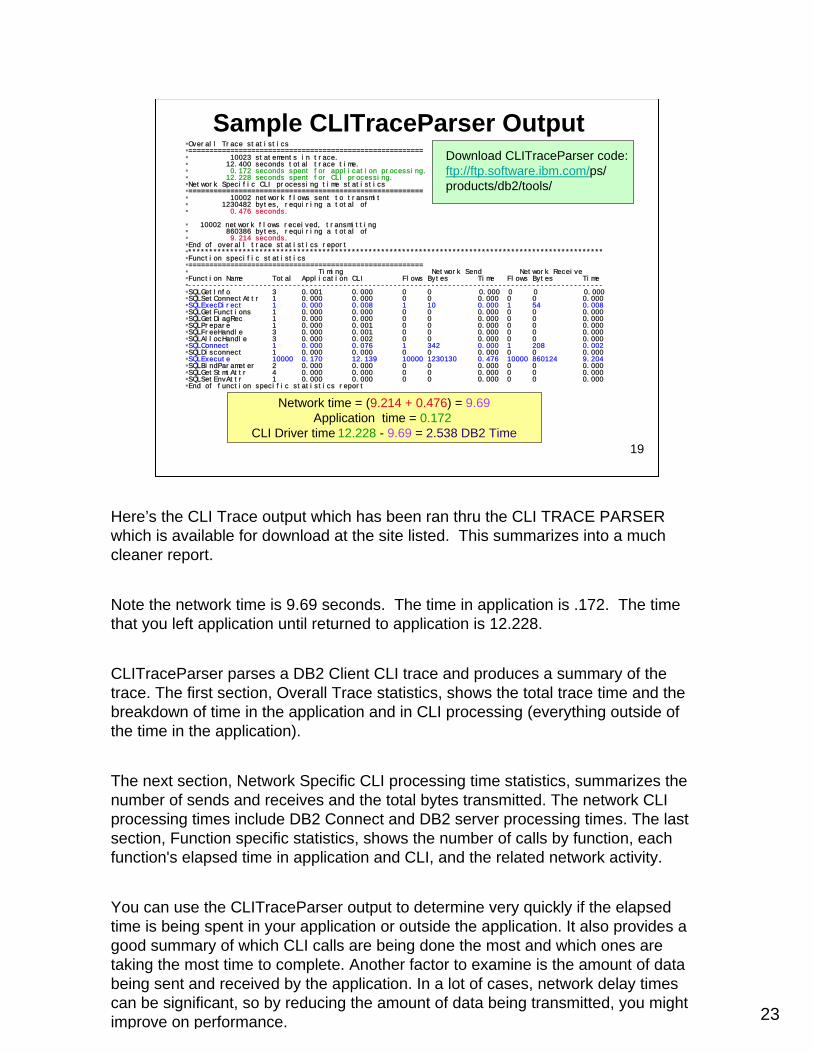
Sample CLITraceParser OutputOverall Trace statistics========================================================
10023 statements in trace.12.400 seconds total trace time.0.172 seconds spent for application processing.12.228 seconds spent for CLI processing.
Network Specific CLI processing time statistics========================================================
10002 network flows sent to transmit 1230482 bytes, requiring a total of0.476 seconds.
10002 network flows received, transmitting 860386 bytes, requiring a total of9.214 seconds.
End of overall trace statistics report***************************************************************************************************Function specific statistics========================================================
Timing Network Send Network ReceiveFunction Name Total Application CLI Flows Bytes Time Flows Bytes Time---------------------------------------------------------------------------------------------------SQLGetInfo 3 0.001 0.000 0 0 0.000 0 0 0.000SQLSetConnectAttr 1 0.000 0.000 0 0 0.000 0 0 0.000SQLExecDirect 1 0.000 0.008 1 10 0.000 1 54 0.008SQLGetFunctions 1 0.000 0.000 0 0 0.000 0 0 0.000SQLGetDiagRec 1 0.000 0.000 0 0 0.000 0 0 0.000SQLPrepare 1 0.000 0.001 0 0 0.000 0 0 0.000SQLFreeHandle 3 0.000 0.001 0 0 0.000 0 0 0.000SQLAllocHandle 3 0.000 0.002 0 0 0.000 0 0 0.000SQLConnect 1 0.000 0.076 1 342 0.000 1 208 0.002SQLDisconnect 1 0.000 0.000 0 0 0.000 0 0 0.000SQLExecute 10000 0.170 12.139 10000 1230130 0.476 10000 860124 9.204SQLBindParameter 2 0.000 0.000 0 0 0.000 0 0 0.000SQLGetStmtAttr 4 0.000 0.000 0 0 0.000 0 0 0.000SQLSetEnvAttr 1 0.000 0.000 0 0 0.000 0 0 0.000End of function specific statistics report
Network time = (9.214 + 0.476) = 9.69Application time = 0.172
CLI Driver time 12.228 - 9.69 = 2.538 DB2 Time
Download CLITraceParser code: ftp://ftp.software.ibm.com/ps/products/db2/tools/
19
Here’s the CLI Trace output which has been ran thru the CLI TRACE PARSER which is available for download at the site listed. This summarizes into a much cleaner report.
Note the network time is 9.69 seconds. The time in application is .172. The time that you left application until returned to application is 12.228.
CLITraceParser parses a DB2 Client CLI trace and produces a summary of the trace. The first section, Overall Trace statistics, shows the total trace time and the breakdown of time in the application and in CLI processing (everything outside of the time in the application).
The next section, Network Specific CLI processing time statistics, summarizes the number of sends and receives and the total bytes transmitted. The network CLI processing times include DB2 Connect and DB2 server processing times. The last section, Function specific statistics, shows the number of calls by function, each function's elapsed time in application and CLI, and the related network activity.
You can use the CLITraceParser output to determine very quickly if the elapsed time is being spent in your application or outside the application. It also provides a good summary of which CLI calls are being done the most and which ones are taking the most time to complete. Another factor to examine is the amount of data being sent and received by the application. In a lot of cases, network delay times can be significant, so by reducing the amount of data being transmitted, you might improve on performance.
24
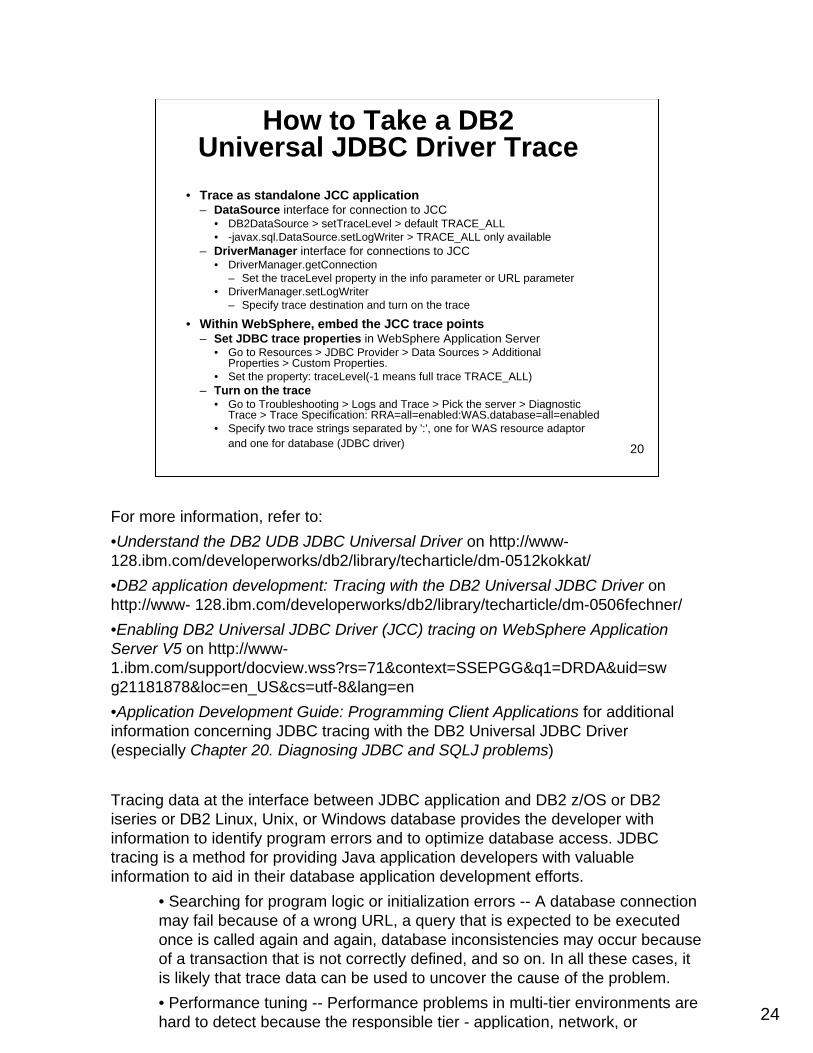
How to Take a DB2 Universal JDBC Driver Trace
• Trace as standalone JCC application – DataSource interface for connection to JCC
• DB2DataSource > setTraceLevel > default TRACE_ALL • -javax.sql.DataSource.setLogWriter > TRACE_ALL only available
– DriverManager interface for connections to JCC• DriverManager.getConnection
– Set the traceLevel property in the info parameter or URL parameter• DriverManager.setLogWriter
– Specify trace destination and turn on the trace
• Within WebSphere, embed the JCC trace points – Set JDBC trace properties in WebSphere Application Server
• Go to Resources > JDBC Provider > Data Sources > AdditionalProperties > Custom Properties.
• Set the property: traceLevel(-1 means full trace TRACE_ALL) – Turn on the trace
• Go to Troubleshooting > Logs and Trace > Pick the server > DiagnosticTrace > Trace Specification: RRA=all=enabled:WAS.database=all=enabled
• Specify two trace strings separated by ':', one for WAS resource adaptorand one for database (JDBC driver) 20
For more information, refer to:•Understand the DB2 UDB JDBC Universal Driver on http://www-128.ibm.com/developerworks/db2/library/techarticle/dm-0512kokkat/•DB2 application development: Tracing with the DB2 Universal JDBC Driver on http://www- 128.ibm.com/developerworks/db2/library/techarticle/dm-0506fechner/•Enabling DB2 Universal JDBC Driver (JCC) tracing on WebSphere Application Server V5 on http://www-1.ibm.com/support/docview.wss?rs=71&context=SSEPGG&q1=DRDA&uid=sw g21181878&loc=en_US&cs=utf-8&lang=en•Application Development Guide: Programming Client Applications for additional information concerning JDBC tracing with the DB2 Universal JDBC Driver (especially Chapter 20. Diagnosing JDBC and SQLJ problems)
Tracing data at the interface between JDBC application and DB2 z/OS or DB2 iseries or DB2 Linux, Unix, or Windows database provides the developer with information to identify program errors and to optimize database access. JDBC tracing is a method for providing Java application developers with valuable information to aid in their database application development efforts.
• Searching for program logic or initialization errors -- A database connection may fail because of a wrong URL, a query that is expected to be executed once is called again and again, database inconsistencies may occur because of a transaction that is not correctly defined, and so on. In all these cases, it is likely that trace data can be used to uncover the cause of the problem.• Performance tuning -- Performance problems in multi-tier environments are hard to detect because the responsible tier - application, network, or

25
For Reference Only, Student Notes
database - has to be determined first. By analyzing the entry/exit timestamps of function calls in the trace data stream, you can identify which tier is causing the performance problems.• Understanding third party software -- When you're using third party software, problem determination is often difficult as source code is not available. Therefore trace information may be helpful to better understand how third party software implements the database interface.
How to take a DB2 Universal JDBC driver traceThere are a couple of different ways to implement the JCC trace. A DRDA trace looks similar to a JCC trace. The buffers of a DRDA trace are captured in a JCC trace -- remember, the JCC uses DRDA to communicate with the server.
There are two approaches you can take when tracing a JCC problem. Depending on the environment, you can either:• Trace it as a standalone JCC application• Within WebSphere, embed the JCC trace points
Tracing JCC as a standalone applicationWhen tracing the JCC component as a standalone application, you need to consider the type of connection that exists with the DB2 Universal JDBC driver.
• DataSource interfaceWhen the DataSource interface is used for database access, the trace properties can be set through methods of this interface. All DataSource classes of the DB2 Universal JDBC Driver inherit from the base class DB2BaseDataSource which also defines theproperties for tracing.
There are two ways to enable the tracing when using the DataSource interface for connection to JCC:•- DB2DataSource > setTraceLevel > default TRACE_ALL--javax.sql.DataSource.setLogWriter > TRACE_ALL only available
For any of the trace options there are other trace parameters besides the TRACE_ALL property that you can use. Depending on what you want to trace, you can enable the JCC trace to only trace the following properties:
DB2 JDBC trace constants
Integer Valuecom.ibm.db2.jcc.DB2BaseDataSource.TRACE_NONE
0com.ibm.db2.jcc.DB2BaseDataSource.TRACE_CONNECTION_CALLS
1com.ibm.db2.jcc.DB2BaseDataSource.TRACE_STATEMENT_CALLS
2com.ibm.db2.jcc.DB2BaseDataSource.TRACE_RESULT_SET_CALLS
4
26
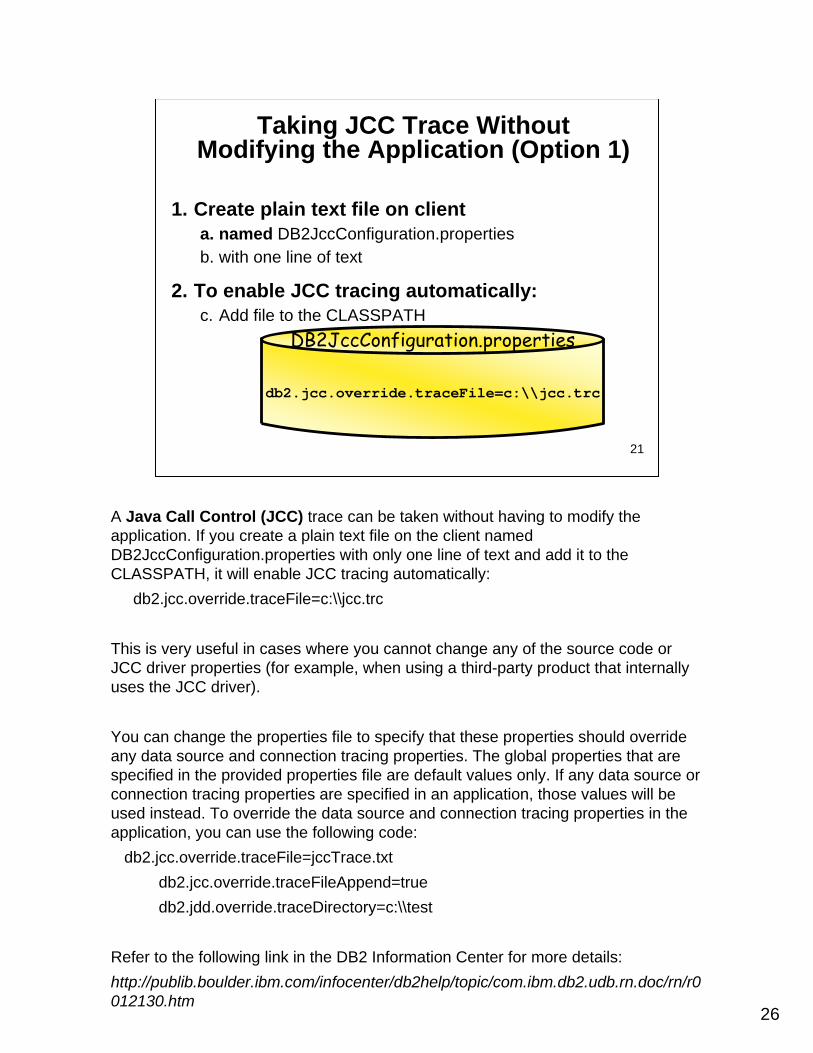
Taking JCC Trace Without Modifying the Application (Option 1)
DB2JccConfiguration.properties
db2.jcc.override.traceFile=c:\\jcc.trc
1. Create plain text file on client a. named DB2JccConfiguration.properties b. with one line of text
2. To enable JCC tracing automatically:c. Add file to the CLASSPATH
21
A Java Call Control (JCC) trace can be taken without having to modify the application. If you create a plain text file on the client namedDB2JccConfiguration.properties with only one line of text and add it to the CLASSPATH, it will enable JCC tracing automatically:
db2.jcc.override.traceFile=c:\\jcc.trc
This is very useful in cases where you cannot change any of the source code or JCC driver properties (for example, when using a third-party product that internally uses the JCC driver).
You can change the properties file to specify that these properties should override any data source and connection tracing properties. The global properties that are specified in the provided properties file are default values only. If any data source or connection tracing properties are specified in an application, those values will be used instead. To override the data source and connection tracing properties in the application, you can use the following code:
db2.jcc.override.traceFile=jccTrace.txtdb2.jcc.override.traceFileAppend=truedb2.jdd.override.traceDirectory=c:\\test
Refer to the following link in the DB2 Information Center for more details:http://publib.boulder.ibm.com/infocenter/db2help/topic/com.ibm.db2.udb.rn.doc/rn/r0012130.htm
27
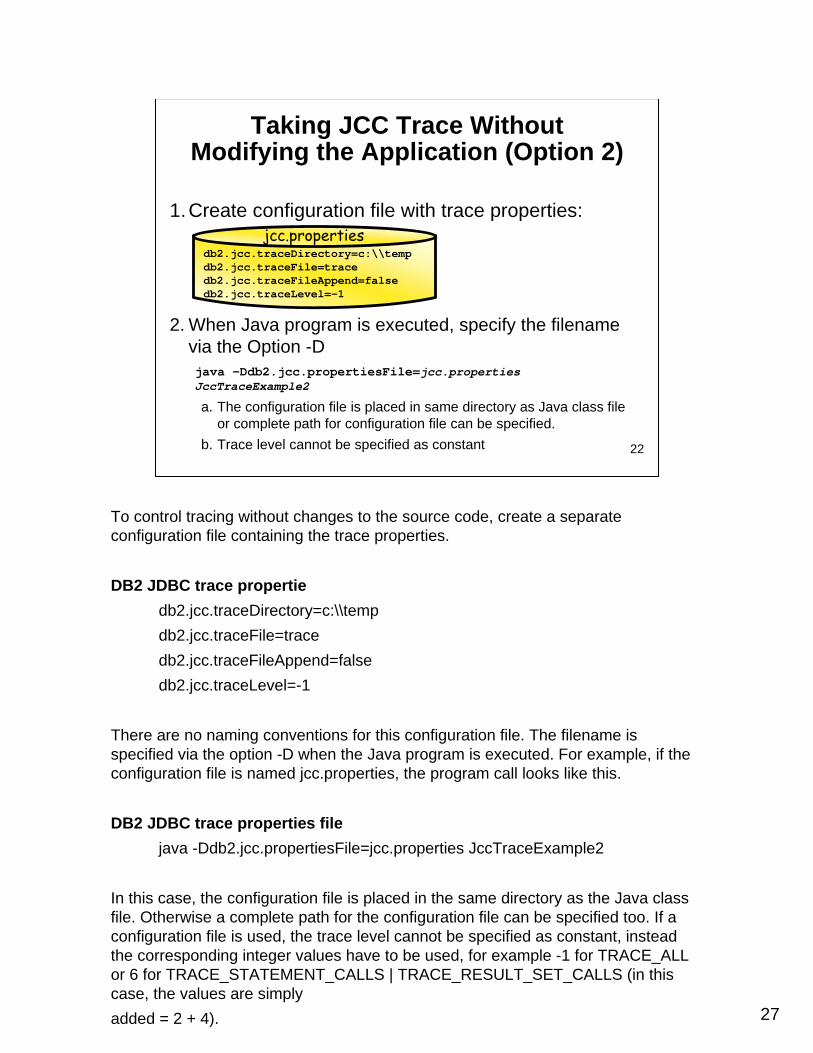
1.Create configuration file with trace properties:
2. When Java program is executed, specify the filename via the Option -Djava -Ddb2.jcc.propertiesFile=jcc.properties JccTraceExample2
a. The configuration file is placed in same directory as Java class fileor complete path for configuration file can be specified.
b. Trace level cannot be specified as constant
Taking JCC Trace Without Modifying the Application (Option 2)
db2.jcc.traceDirectory=c:\\tempdb2.jcc.traceFile=tracedb2.jcc.traceFileAppend=falsedb2.jcc.traceLevel=-1
jcc.properties
22
To control tracing without changes to the source code, create a separate configuration file containing the trace properties.
DB2 JDBC trace propertiedb2.jcc.traceDirectory=c:\\tempdb2.jcc.traceFile=tracedb2.jcc.traceFileAppend=falsedb2.jcc.traceLevel=-1
There are no naming conventions for this configuration file. The filename is specified via the option -D when the Java program is executed. For example, if the configuration file is named jcc.properties, the program call looks like this.
DB2 JDBC trace properties filejava -Ddb2.jcc.propertiesFile=jcc.properties JccTraceExample2
In this case, the configuration file is placed in the same directory as the Java class file. Otherwise a complete path for the configuration file can be specified too. If a configuration file is used, the trace level cannot be specified as constant, instead the corresponding integer values have to be used, for example -1 for TRACE_ALL or 6 for TRACE_STATEMENT_CALLS | TRACE_RESULT_SET_CALLS (in thiscase, the values are simplyadded = 2 + 4).
28
Reference Only – Student Notes
Because the properties in the configuration file are not restricted to a certain data source, they automatically refer to all data sources. If a trace directory is specified as well as a trace file, a trace file according to the following pattern is created for each database connection: <trace directory>\<trace file>_global_<sequential number>. For the sample program, a trace file c:\temp\trace_global_0 is created. Remove the traceDirectory property if you want all connections to write the trace information to the same file. If the traceDirectory property is specified, each connection will have its own trace file.
If trace properties are specified in the source code and in the configuration file too, then the properties defined in the source code are used. To force usage of the trace properties in the configuration file, the trace properties in the configuration file have to be specified with the addition override.
Example for overriding of trace propertiesdb2.jcc.override.traceDirectory=c:\\tempdb2.jcc.override.traceFile=tracedb2.jcc.override.traceFileAppend=falsedb2.jcc.override.traceLevel=-1
29
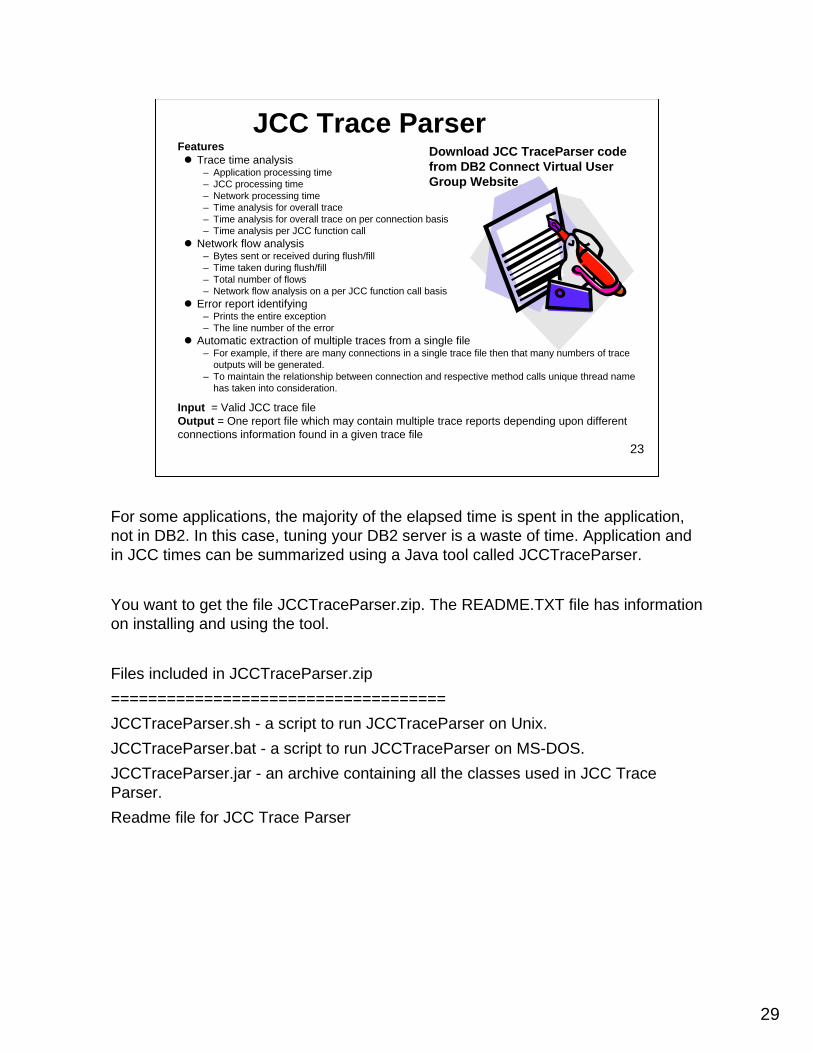
FeaturesTrace time analysis
– Application processing time– JCC processing time– Network processing time– Time analysis for overall trace– Time analysis for overall trace on per connection basis– Time analysis per JCC function call
Network flow analysis– Bytes sent or received during flush/fill– Time taken during flush/fill– Total number of flows– Network flow analysis on a per JCC function call basis
Error report identifying– Prints the entire exception– The line number of the error
Automatic extraction of multiple traces from a single file– For example, if there are many connections in a single trace file then that many numbers of trace
outputs will be generated.– To maintain the relationship between connection and respective method calls unique thread name
has taken into consideration.
Input = Valid JCC trace file Output = One report file which may contain multiple trace reports depending upon different connections information found in a given trace file
JCC Trace ParserDownload JCC TraceParser codefrom DB2 Connect Virtual User Group Website
23
For some applications, the majority of the elapsed time is spent in the application, not in DB2. In this case, tuning your DB2 server is a waste of time. Application and in JCC times can be summarized using a Java tool called JCCTraceParser.
You want to get the file JCCTraceParser.zip. The README.TXT file has information on installing and using the tool.
Files included in JCCTraceParser.zip====================================JCCTraceParser.sh - a script to run JCCTraceParser on Unix.JCCTraceParser.bat - a script to run JCCTraceParser on MS-DOS.JCCTraceParser.jar - an archive containing all the classes used in JCC Trace Parser.Readme file for JCC Trace Parser
30
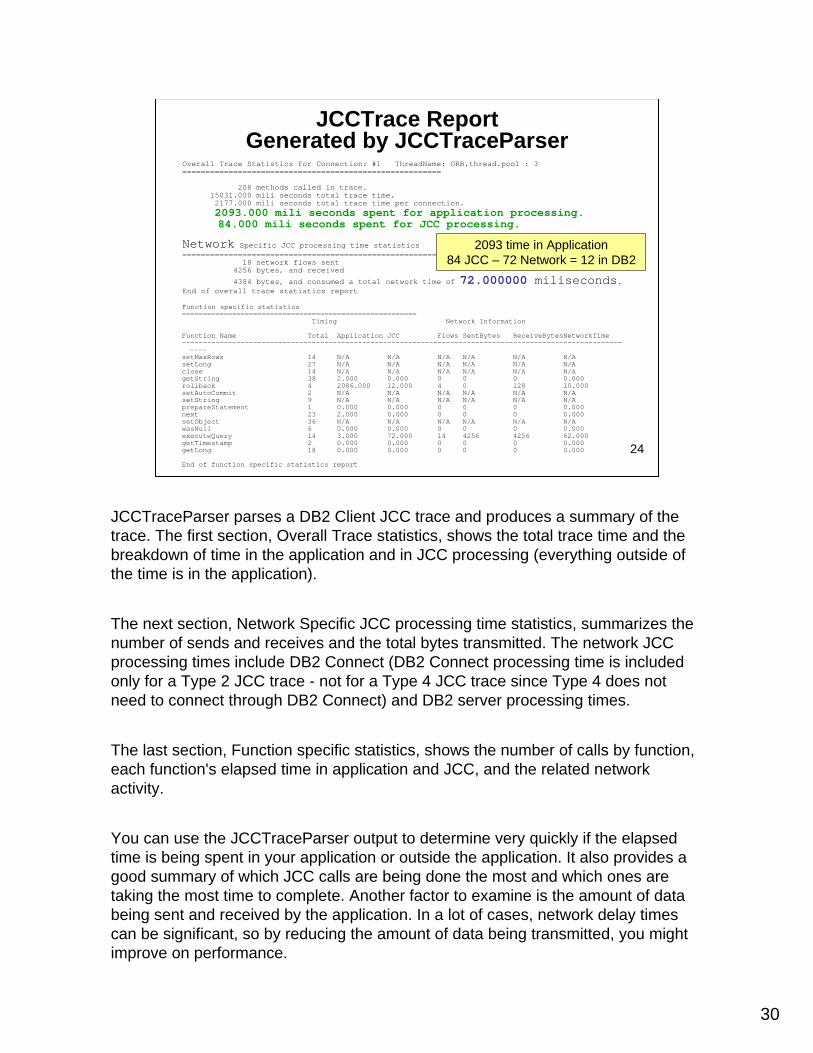
JCCTrace Report Generated by JCCTraceParser
Overall Trace Statistics for Connection: #1 ThreadName: ORB.thread.pool : 3========================================================
208 methods called in trace.15031.000 mili seconds total trace time.2177.000 mili seconds total trace time per connection.2093.000 mili seconds spent for application processing.84.000 mili seconds spent for JCC processing.
Network Specific JCC processing time statistics========================================================
18 network flows sent 4256 bytes, and received
4384 bytes, and consumed a total network time of 72.000000 miliseconds.End of overall trace statistics report
Function specific statistics========================================================
Timing Network Information
Function Name Total Application JCC Flows SentBytes ReceiveBytesNetworkTime-------------------------------------------------------------------------------------------------------------
setMaxRows 14 N/A N/A N/A N/A N/A N/A setLong 27 N/A N/A N/A N/A N/A N/A close 14 N/A N/A N/A N/A N/A N/A getString 38 2.000 0.000 0 0 0 0.000 rollback 4 2086.000 12.000 4 0 128 10.000 setAutoCommit 2 N/A N/A N/A N/A N/A N/A setString 9 N/A N/A N/A N/A N/A N/A prepareStatement 1 0.000 0.000 0 0 0 0.000 next 23 2.000 0.000 0 0 0 0.000 setObject 36 N/A N/A N/A N/A N/A N/A wasNull 6 0.000 0.000 0 0 0 0.000 executeQuery 14 3.000 72.000 14 4256 4256 62.000 getTimestamp 2 0.000 0.000 0 0 0 0.000 getLong 18 0.000 0.000 0 0 0 0.000
End of function specific statistics report
2093 time in Application84 JCC – 72 Network = 12 in DB2
24
JCCTraceParser parses a DB2 Client JCC trace and produces a summary of the trace. The first section, Overall Trace statistics, shows the total trace time and the breakdown of time in the application and in JCC processing (everything outside of the time is in the application).
The next section, Network Specific JCC processing time statistics, summarizes the number of sends and receives and the total bytes transmitted. The network JCC processing times include DB2 Connect (DB2 Connect processing time is included only for a Type 2 JCC trace - not for a Type 4 JCC trace since Type 4 does not need to connect through DB2 Connect) and DB2 server processing times.
The last section, Function specific statistics, shows the number of calls by function, each function's elapsed time in application and JCC, and the related network activity.
You can use the JCCTraceParser output to determine very quickly if the elapsed time is being spent in your application or outside the application. It also provides a good summary of which JCC calls are being done the most and which ones are taking the most time to complete. Another factor to examine is the amount of data being sent and received by the application. In a lot of cases, network delay times can be significant, so by reducing the amount of data being transmitted, you might improve on performance.
31
DB2 ServerUniv. Driver SQLJ/JDBCJava App.
prepareStatement/executeUpdate
executeUpdate
executeUpdate
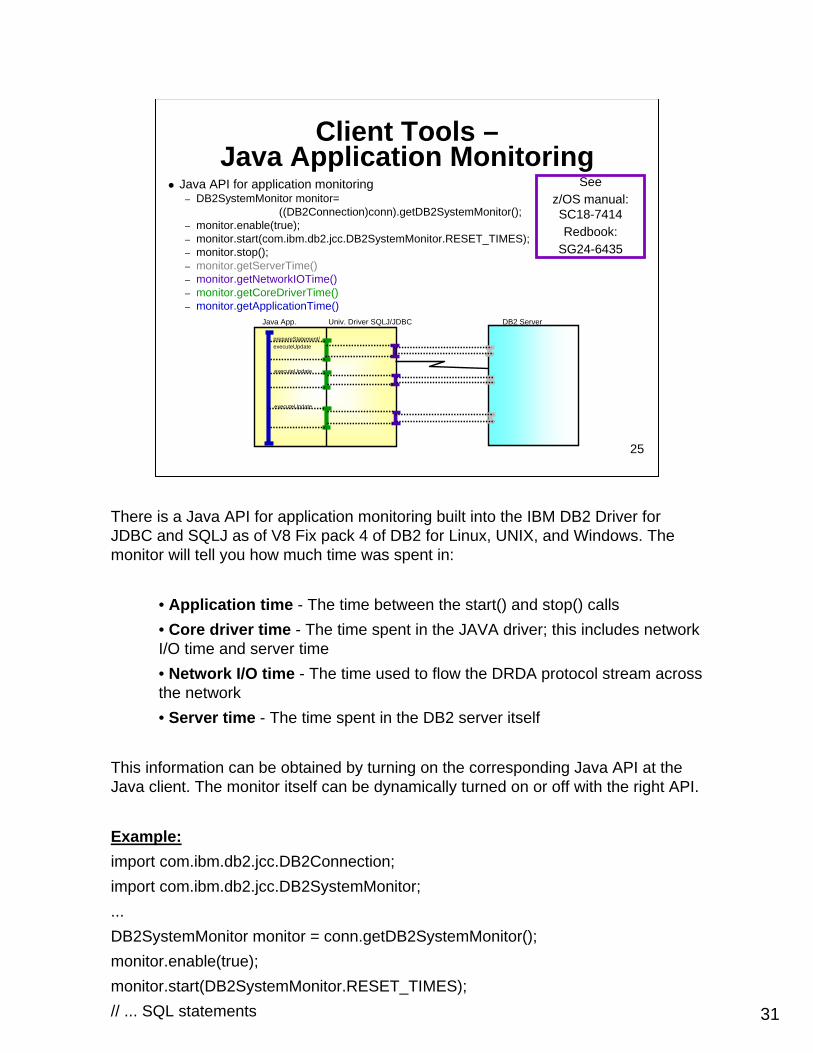
Java API for application monitoring– DB2SystemMonitor monitor=
((DB2Connection)conn).getDB2SystemMonitor();– monitor.enable(true);– monitor.start(com.ibm.db2.jcc.DB2SystemMonitor.RESET_TIMES);– monitor.stop();– monitor.getServerTime()– monitor.getNetworkIOTime()– monitor.getCoreDriverTime()– monitor.getApplicationTime()
See z/OS manual: SC18-7414Redbook:
SG24-6435
Client Tools –Java Application Monitoring
25
There is a Java API for application monitoring built into the IBM DB2 Driver for JDBC and SQLJ as of V8 Fix pack 4 of DB2 for Linux, UNIX, and Windows. The monitor will tell you how much time was spent in:
• Application time - The time between the start() and stop() calls• Core driver time - The time spent in the JAVA driver; this includes network I/O time and server time• Network I/O time - The time used to flow the DRDA protocol stream across the network • Server time - The time spent in the DB2 server itself
This information can be obtained by turning on the corresponding Java API at the Java client. The monitor itself can be dynamically turned on or off with the right API.
Example:import com.ibm.db2.jcc.DB2Connection;import com.ibm.db2.jcc.DB2SystemMonitor;...DB2SystemMonitor monitor = conn.getDB2SystemMonitor();monitor.enable(true);monitor.start(DB2SystemMonitor.RESET_TIMES);// ... SQL statements
32
Reference Only – Student Notes
monitor.stop();System.out.println("Server time: " + monitor.getServerTimeMicros());System.out.println("Network I/O time: " + monitor.getNetworkIOTimeMicros());System.out.println("Core driver time: " + monitor.getCoreDriverTimeMicros());System.out.println("Application time (ms): " +monitor.getApplicationTimeMillis());
You can choose to either reset or to accumulate times when starting the monitoring, usingDB2SystemMonitor.RESET_TIMES, or DB2SystemMonitor.ACCUMULATE_TIMES on the monitor.start() method, respectively.
Note that the various getTime() methods may throw an SQLException if the driver cannot provide the information requested.
One of the biggest benefits of this is that it gives the application person a tool to use to do monitoring and problem determination, without having to constantly call the DB2 server or network support staff. The application person can immediately see where the elapsed time is being spent. If the problem is in the application, then it can be fixed without ever bothering the server or network support team. If it shows the problem is in the network or at the server, then a call to the support staff is warranted.
The collected information that is reported from the DB2 for z/OS server is based on normal data collected for class 1, 2, and 3 accounting trace records at the DB2 for z/OS server, so there is no overhead there.
For further information on the Java Universal Driver Monitor, see the manual DB2 Universal Database for z/OS Application Programming Guide and Reference for JAVA Version 8 - SC18-7414, or the Redbook DB2 z/OS Ready for JAVA - SG24-6435.
33
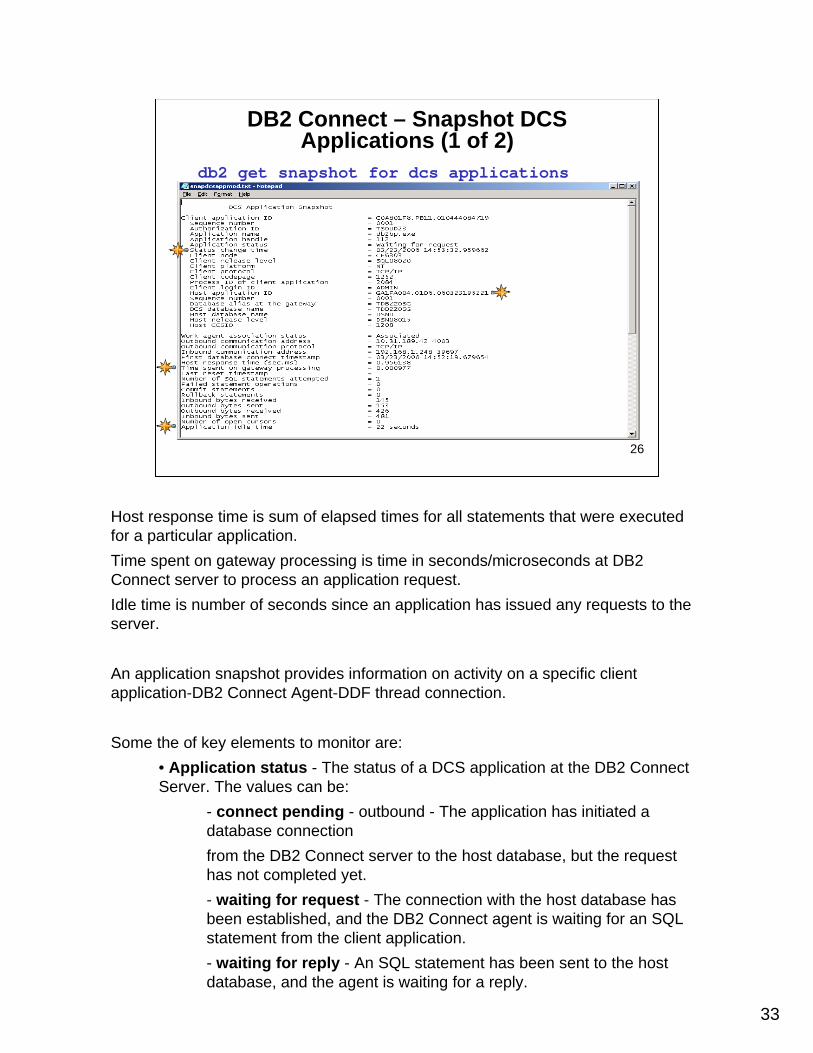
db2 get snapshot for dcs applications
DB2 Connect – Snapshot DCS Applications (1 of 2)
26
Host response time is sum of elapsed times for all statements that were executed for a particular application. Time spent on gateway processing is time in seconds/microseconds at DB2 Connect server to process an application request. Idle time is number of seconds since an application has issued any requests to the server.
An application snapshot provides information on activity on a specific client application-DB2 Connect Agent-DDF thread connection.
Some the of key elements to monitor are:• Application status - The status of a DCS application at the DB2 Connect Server. The values can be:
- connect pending - outbound - The application has initiated a database connectionfrom the DB2 Connect server to the host database, but the request has not completed yet.- waiting for request - The connection with the host database has been established, and the DB2 Connect agent is waiting for an SQL statement from the client application.- waiting for reply - An SQL statement has been sent to the host database, and the agent is waiting for a reply.
34
Reference Only – Student Notes
• Work agent association status - In a connection concentrator environment, this value shows which applications currently have associated agents.• Host response time - The sum of the elapsed times for all the statements that were executed for a particular application. Use this element with Outbound Number of Bytes Sent and Outbound Number of Bytes Received to calculate the outbound response time (transfer rate): ((outbound bytes sent + outbound bytes received) / host response time).• Time spent on gateway processing - The time in seconds and microseconds at the DB2 Connect server to process an application request (since the connection was established). At the application level, this is the cumulative time spent processing requests. At the statement level, this is the time to process the last SQL statement. This element can be used to determine how much time is spent within the DB2 Connect server. An average time per SQL statement can be calculated using the formula: (Time spent on gateway processing / number of SQL statements attempted).• Failed statement operations - The number of SQL statements that were attempted, but failed. This count includes all SQL statements that received a negative SQLCODE.Performance can be affected by having to handle failed SQL statements.• Inbound bytes received - The number of bytes received by the DB2 Connect server from the client, excluding communication protocol overhead. Use this to measure throughput from the client to the DB2 Connect server.• Outbound bytes sent - The number of bytes sent by the DB2 Connect server to the host, excluding communication protocol overhead. Use this to measure throughput from the DB2 Connect server to the host.• Outbound bytes received - The number of bytes received by the DB2 Connect server from the host, excluding communication protocol overhead. Use this to measure throughput from the host to the DB2 Connect server.• Inbound bytes sent - The number of bytes sent by the DB2 Connect server to the client, excluding communication protocol overhead. Use this to measure throughput from the DB2 Connect server to the client.• Application idle time - Number of seconds since an application has issued any requests to the server. This includes applications that have not terminated a transaction, for example not issued a commit or rollback. This information can be used to determine if an application has been idle for some number of seconds and you might want to force off the application.
If the UOW and STATEMENT monitor switches are not on, the information on this page is all you will see in the snapshot report.
This report can be obtained for all DCS applications, all DCS applications connected to a specific database, or for a specific application.
35
© Copyright IBM Corporation 2006
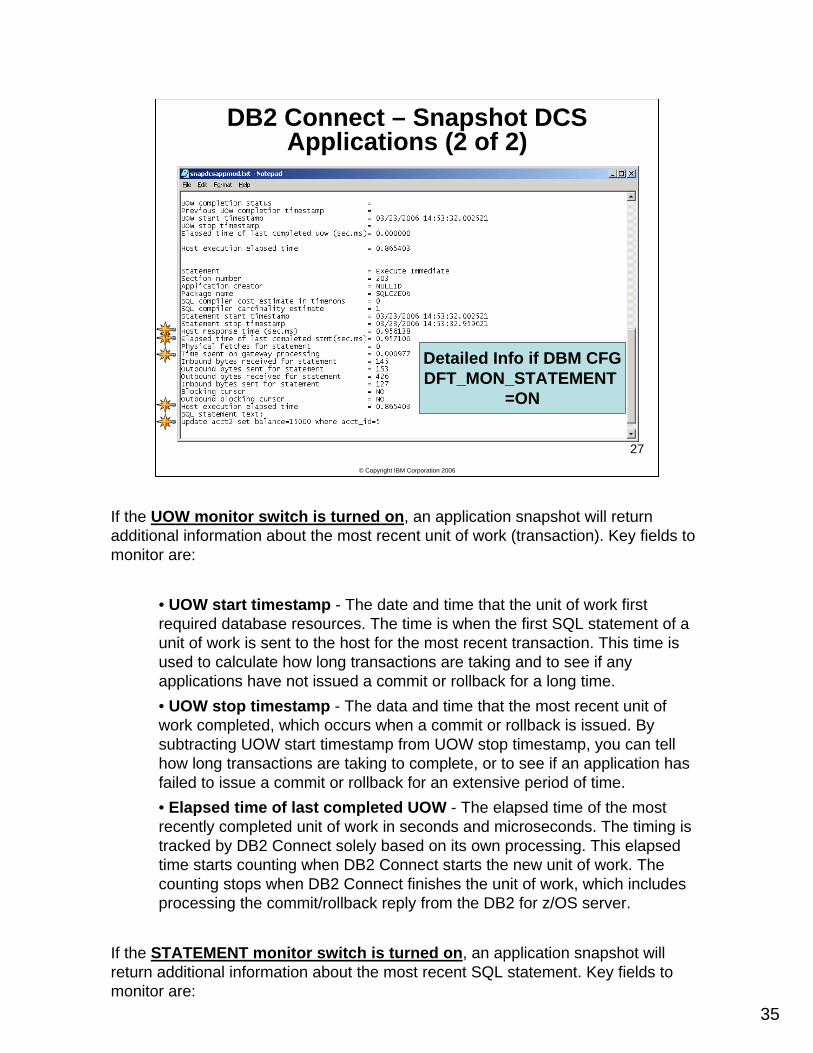
DB2 Connect – Snapshot DCS Applications (2 of 2)
27
Detailed Info if DBM CFGDFT_MON_STATEMENT
=ON
If the UOW monitor switch is turned on, an application snapshot will return additional information about the most recent unit of work (transaction). Key fields to monitor are:
• UOW start timestamp - The date and time that the unit of work first required database resources. The time is when the first SQL statement of a unit of work is sent to the host for the most recent transaction. This time is used to calculate how long transactions are taking and to see if any applications have not issued a commit or rollback for a long time. • UOW stop timestamp - The data and time that the most recent unit of work completed, which occurs when a commit or rollback is issued. By subtracting UOW start timestamp from UOW stop timestamp, you can tell how long transactions are taking to complete, or to see if an application has failed to issue a commit or rollback for an extensive period of time.• Elapsed time of last completed UOW - The elapsed time of the most recently completed unit of work in seconds and microseconds. The timing is tracked by DB2 Connect solely based on its own processing. This elapsed time starts counting when DB2 Connect starts the new unit of work. The counting stops when DB2 Connect finishes the unit of work, which includes processing the commit/rollback reply from the DB2 for z/OS server.
If the STATEMENT monitor switch is turned on, an application snapshot will return additional information about the most recent SQL statement. Key fields to monitor are:

36
Reference Only, Student Notes
• Statement - The statement operation currently being processed or most recently processed (if none currently running). Use this to determine the kind of SQL operation the statistics are for. • Statement start timestamp - The date and time the SQL statement was sent to the host for processing.• Statement stop timestamp - The date and time the SQL statement response was received at the DB2 Connect server. Use with the Statement start timestamp to determine how long SQL statements are taking to execute.• Host response time - At the statement level, this is the elapsed time between the time that the statement was sent from the DB2 Connect server to the host for processing and the time when the result was received from the host. The network elapsed time can be obtained by subtracting the "Host execution elapsed time" element from this element.• Elapsed time of last completed stmt (sec.ms) - The total time that was spent executing a particular statement, including "Host response time" and DB2 Connect processing time.• Time spent on gateway processing - The time in seconds and microseconds spent at the DB2 Connect Server processing the most recent SQL statement. Used to determine what portion of the overall SQL processing time is due to DB2 Connect, including fetch time.• Inbound/Outbound bytes sent/received - The number of bytes of data sent/received from/to the client and to/from the host at the DB2 Connect server for the most recent SQL request. Use to determine a transfer rate for the SQL statement, along with Host response time.• Blocking cursor - This element indicates if the statement being executed is using a blocking cursor.• Outbound blocking cursor - This element indicates whether blocking is used for data transfer from the DRDA server to the DB2 Connect gateway for a particular query.• Host execution elapsed time - At the DCS statement level, this is the elapsed time spent processing an SQL request on a host database server. This value is reported by the host database server. In contrast to the Host response time element, this element does not include the network elapsed time between DB2 Connect and the host database server. Subtract this element from the Host response time element to calculate the network elapsed time between DB2 Connect and the host database server. • Host execution elapsed time - At the UOW level, this value represents the sum of the host execution times for the processing of all statements that were executed in a particular UOW. The host execution times are reported by the host database server. This element applies only to DB2 for z/OS database servers. It includes only host database server processing time, and does not include the network elapsed time between DB2 Connect and the host database server.
37
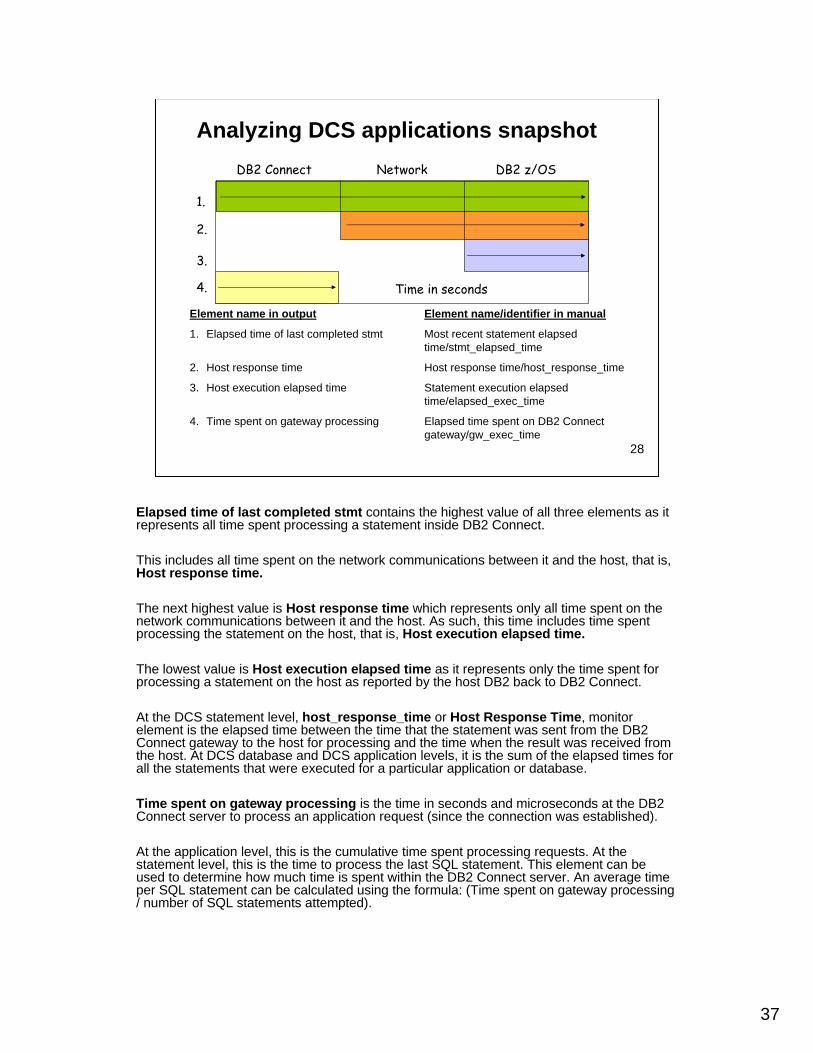
DB2 z/OSDB2 Connect Network
4.
1.
2.
Time in seconds
Element name in output
1. Elapsed time of last completed stmt
2. Host response time
3. Host execution elapsed time
4. Time spent on gateway processing
Element name/identifier in manual
Most recent statement elapsedtime/stmt_elapsed_time
Host response time/host_response_time
Statement execution elapsedtime/elapsed_exec_time
Elapsed time spent on DB2 Connectgateway/gw_exec_time
Analyzing DCS applications snapshot
3.
28
Elapsed time of last completed stmt contains the highest value of all three elements as it represents all time spent processing a statement inside DB2 Connect.
This includes all time spent on the network communications between it and the host, that is, Host response time.
The next highest value is Host response time which represents only all time spent on the network communications between it and the host. As such, this time includes time spent processing the statement on the host, that is, Host execution elapsed time.
The lowest value is Host execution elapsed time as it represents only the time spent for processing a statement on the host as reported by the host DB2 back to DB2 Connect.
At the DCS statement level, host_response_time or Host Response Time, monitor element is the elapsed time between the time that the statement was sent from the DB2 Connect gateway to the host for processing and the time when the result was received from the host. At DCS database and DCS application levels, it is the sum of the elapsed times for all the statements that were executed for a particular application or database.
Time spent on gateway processing is the time in seconds and microseconds at the DB2 Connect server to process an application request (since the connection was established).
At the application level, this is the cumulative time spent processing requests. At the statement level, this is the time to process the last SQL statement. This element can be used to determine how much time is spent within the DB2 Connect server. An average time per SQL statement can be calculated using the formula: (Time spent on gateway processing / number of SQL statements attempted).
38
Display Thread Detail
29
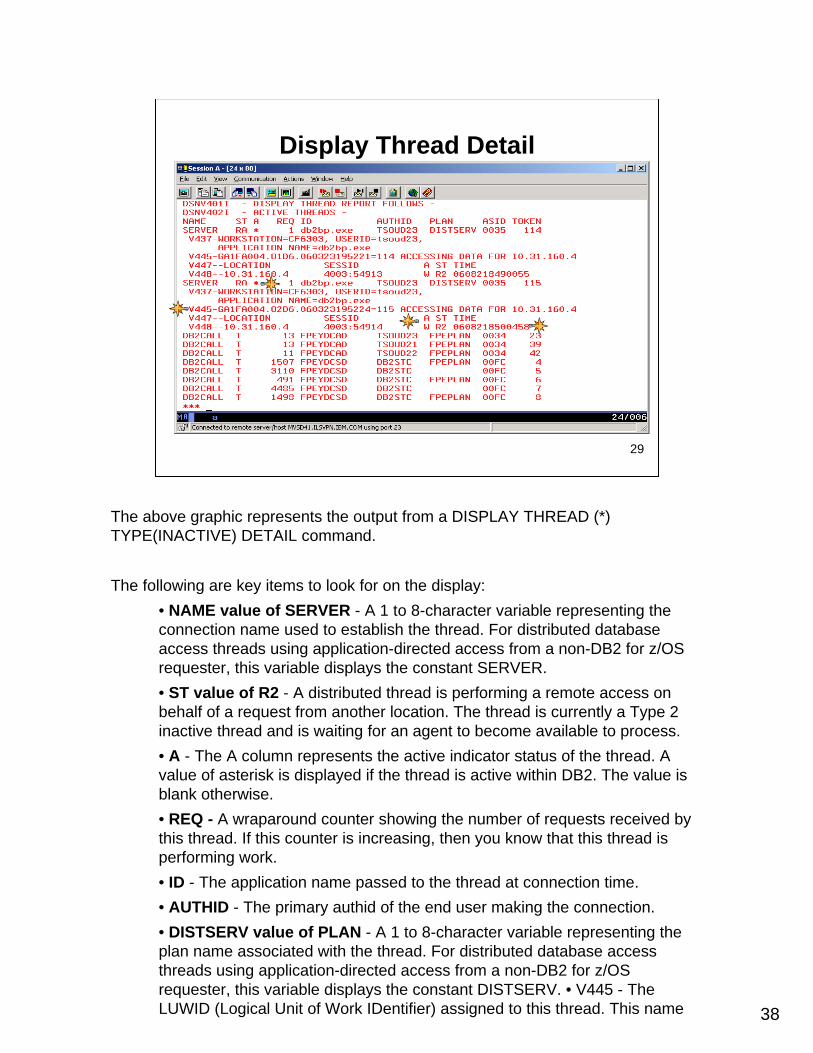
The above graphic represents the output from a DISPLAY THREAD (*) TYPE(INACTIVE) DETAIL command.
The following are key items to look for on the display:• NAME value of SERVER - A 1 to 8-character variable representing the connection name used to establish the thread. For distributed database access threads using application-directed access from a non-DB2 for z/OS requester, this variable displays the constant SERVER.• ST value of R2 - A distributed thread is performing a remote access on behalf of a request from another location. The thread is currently a Type 2 inactive thread and is waiting for an agent to become available to process.• A - The A column represents the active indicator status of the thread. A value of asterisk is displayed if the thread is active within DB2. The value is blank otherwise.• REQ - A wraparound counter showing the number of requests received bythis thread. If this counter is increasing, then you know that this thread is performing work.• ID - The application name passed to the thread at connection time.• AUTHID - The primary authid of the end user making the connection.• DISTSERV value of PLAN - A 1 to 8-character variable representing the plan name associated with the thread. For distributed database access threads using application-directed access from a non-DB2 for z/OS requester, this variable displays the constant DISTSERV. • V445 - The LUWID (Logical Unit of Work IDentifier) assigned to this thread. This name
39
Reference only, Student Notes
appears as the Host Application ID value on a DB2 LIST DCS APPLICATIONS display. This identifier is generated when the application connects to the DRDA server database. It is used to connect the DB2 Connect server to the DRDA server. It is composed of a three part name. The first part is normally the IP address (in hex) of the DB2 Connect machine, but depending on your network security configuration, this may be the IP address (in hex) of a firewall between the DB2 Connect server and the host.
The second part of the name is usually the port number (in hex) of the agent running on the DB2 Connect machine, but depending on your network security configuration, this may be the port number (in hex) being used on a firewall between the DB2 Connect server and the host. When converted to decimal, this port number should match the port number specified to the right of the colon under the SESSID column. If the port number was generated on a Windows machine, then it will be in a byte reversed format in the LUWID. The third part of the LUWID is referred to as the Application instance. This is a unique identifier for the instance of this application. It is normally, but not always, a date/timestamp of when the DB2 Connect agent established the connection with the host. When the real hex versions of the IP address or port number specified in the LUWID begin with 0-9, they are changed at LUWID creation time to the letters G-P respectively. For example, 0 is mapped to G, 1 is mapped to H,and so on. So when interpreting the LUWID, if the hex version of the IP address or port number displayed start with G-P, you must convert them back to 0-9 respectively to obtain the real hex version of the IP address or port number, and then convert the real hex value to decimal.• LOCATION - This will normally be the IPADDRESS of the DB2 Connect server.However, depending on your network security configuration, the LOCATION specified may be the IP address of a firewall between the DB2 Connect server and host.• SESSID - For TCP/IP, this is the TCP port number used by DDF for this DB2 for z/OS subsystem followed by the TCP port number being used by the DB2 Connect agent.However, depending on your network security configuration, the port number specified to the right of the colon may be the port number used by a firewall between the DB2 Connect server and host.• A - If the value in this column, which is next to the SESSID column, is a V, then the conversation is active within TCP/IP; if a W, then the conversation in suspended in DB2 for z/OS waiting for TCP/IP notification that the function is complete, otherwise blank.• ST - This column, which is next to the TIME column, is the status of the conversation. If R, either receiving a request or waiting for a request. If S, either sending a response or preparing to send a response. The second character indicates the type of protocol being used. A 1 indicates private protocol, single-phase commit. A 2 indicates DRDA protocol, single-phase commit. A 3 indicates private protocol, two-phase commit. The 4 indicates DRDA protocol, two-phase commit. Since a DB2 Connect to DDF connection (thread) must use DRDA, then only a 2 or 4 is possible.• TIME - The time stamp (yydddhhmmssth) of the last message sent or received on the conversation. This field can be used to see if the thread is performing any work.
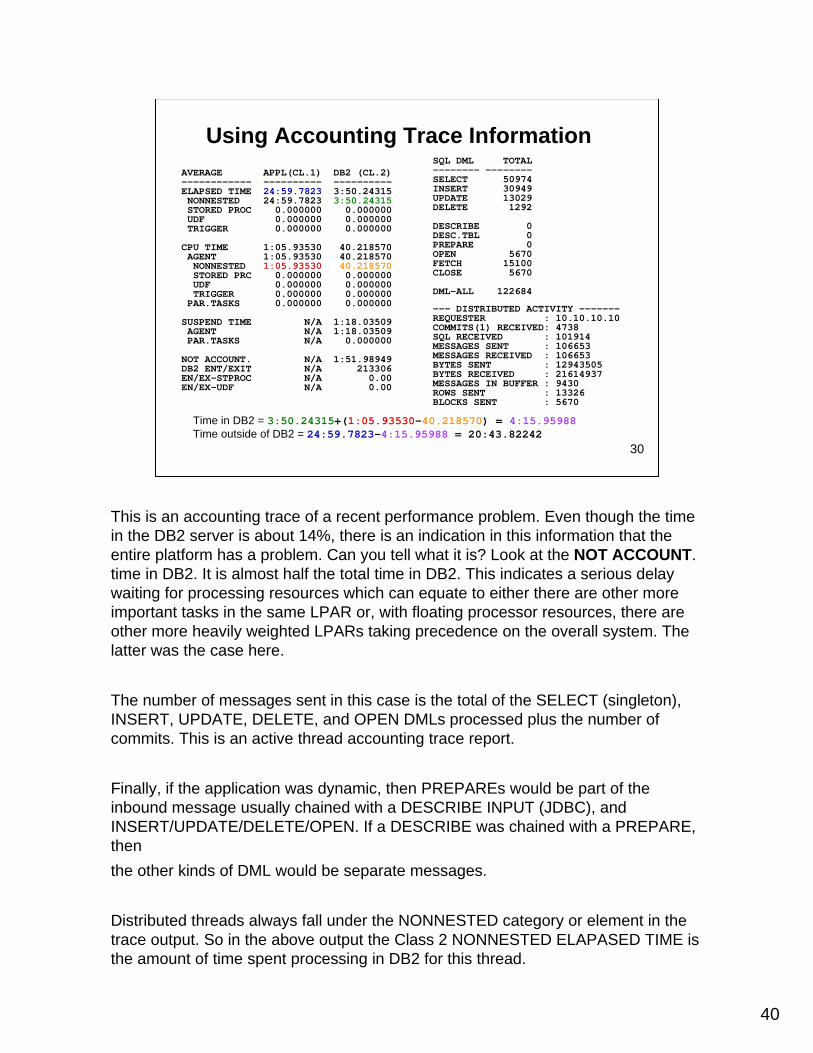
40
AVERAGE APPL(CL.1) DB2 (CL.2)------------ ---------- ----------ELAPSED TIME 24:59.7823 3:50.24315NONNESTED 24:59.7823 3:50.24315STORED PROC 0.000000 0.000000UDF 0.000000 0.000000TRIGGER 0.000000 0.000000
CPU TIME 1:05.93530 40.218570AGENT 1:05.93530 40.218570NONNESTED 1:05.93530 40.218570STORED PRC 0.000000 0.000000UDF 0.000000 0.000000TRIGGER 0.000000 0.000000PAR.TASKS 0.000000 0.000000
SUSPEND TIME N/A 1:18.03509AGENT N/A 1:18.03509PAR.TASKS N/A 0.000000
NOT ACCOUNT. N/A 1:51.98949DB2 ENT/EXIT N/A 213306EN/EX-STPROC N/A 0.00EN/EX-UDF N/A 0.00
SQL DML TOTAL-------- --------SELECT 50974INSERT 30949UPDATE 13029DELETE 1292
DESCRIBE 0DESC.TBL 0PREPARE 0OPEN 5670FETCH 15100CLOSE 5670
DML-ALL 122684
Time in DB2 = 3:50.24315+(1:05.93530-40.218570) = 4:15.95988Time outside of DB2 = 24:59.7823-4:15.95988 = 20:43.82242
--- DISTRIBUTED ACTIVITY -------REQUESTER : 10.10.10.10COMMITS(1) RECEIVED: 4738SQL RECEIVED : 101914MESSAGES SENT : 106653MESSAGES RECEIVED : 106653BYTES SENT : 12943505BYTES RECEIVED : 21614937MESSAGES IN BUFFER : 9430ROWS SENT : 13326BLOCKS SENT : 5670
Using Accounting Trace Information
30
This is an accounting trace of a recent performance problem. Even though the time in the DB2 server is about 14%, there is an indication in this information that the entire platform has a problem. Can you tell what it is? Look at the NOT ACCOUNT. time in DB2. It is almost half the total time in DB2. This indicates a serious delay waiting for processing resources which can equate to either there are other more important tasks in the same LPAR or, with floating processor resources, there are other more heavily weighted LPARs taking precedence on the overall system. The latter was the case here.
The number of messages sent in this case is the total of the SELECT (singleton), INSERT, UPDATE, DELETE, and OPEN DMLs processed plus the number of commits. This is an active thread accounting trace report.
Finally, if the application was dynamic, then PREPAREs would be part of the inbound message usually chained with a DESCRIBE INPUT (JDBC), and INSERT/UPDATE/DELETE/OPEN. If a DESCRIBE was chained with a PREPARE, thenthe other kinds of DML would be separate messages.
Distributed threads always fall under the NONNESTED category or element in the trace output. So in the above output the Class 2 NONNESTED ELAPASED TIME is the amount of time spent processing in DB2 for this thread.

41
Reference Only Student Notes
The Class 1 NONNESTED CPU TIME minus the CLASS 2 NONNESTED CPU TIME shows the amount of time spent in DDF. So the calculation of the amount of time spent in DB2 is the amount of time spent processing (Class 2 NONNESTED ELAPSED) plus the amount of time spent in DDF (Class 1 NONNESTED CPU TIME minus the CLASS 2 NONNESTED CPU TIME). The time spent outside of DB2 is calculated by taking the Class 1 ELAPSED TIME and subtracting the time spent in DB2.
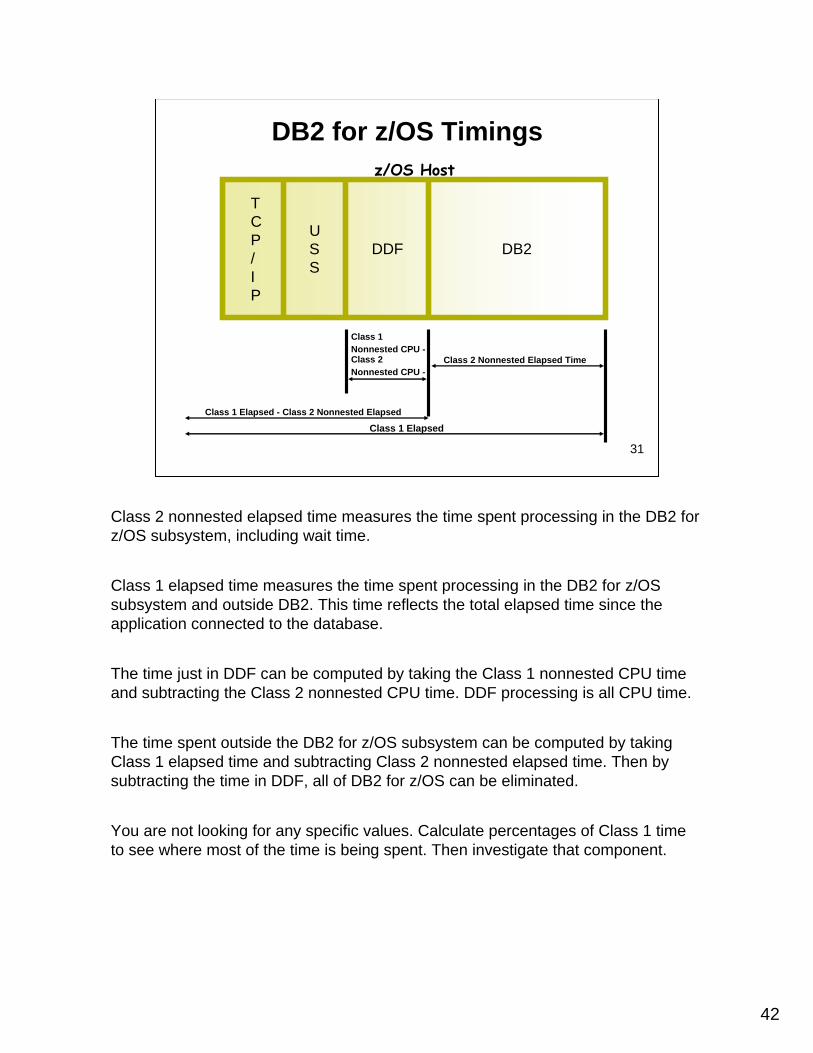
42
z/OS Host
DB2
TCP/IP
USS
DDF
Class 1Nonnested CPU -Class 2Nonnested CPU -
Class 1 Elapsed - Class 2 Nonnested Elapsed
Class 1 Elapsed
Class 2 Nonnested Elapsed Time
DB2 for z/OS Timings
31
Class 2 nonnested elapsed time measures the time spent processing in the DB2 for z/OS subsystem, including wait time.
Class 1 elapsed time measures the time spent processing in the DB2 for z/OS subsystem and outside DB2. This time reflects the total elapsed time since the application connected to the database.
The time just in DDF can be computed by taking the Class 1 nonnested CPU time and subtracting the Class 2 nonnested CPU time. DDF processing is all CPU time.
The time spent outside the DB2 for z/OS subsystem can be computed by taking Class 1 elapsed time and subtracting Class 2 nonnested elapsed time. Then by subtracting the time in DDF, all of DB2 for z/OS can be eliminated.
You are not looking for any specific values. Calculate percentages of Class 1 time to see where most of the time is being spent. Then investigate that component.
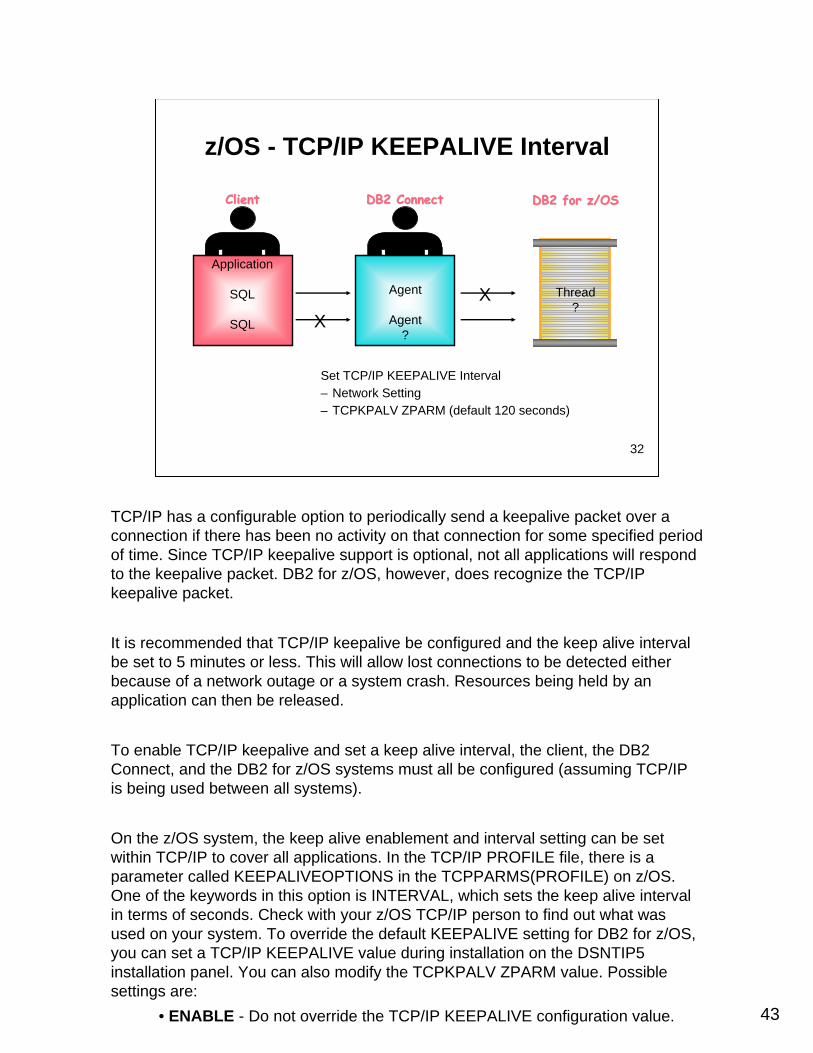
43
DB2 ConnectDB2 Connect
Application
SQL
SQL
ClientClient
Agent
Agent?
Thread?
XX
DB2 for z/OSDB2 for z/OS
Set TCP/IP KEEPALIVE Interval– Network Setting– TCPKPALV ZPARM (default 120 seconds)
z/OS - TCP/IP KEEPALIVE Interval
32
TCP/IP has a configurable option to periodically send a keepalive packet over a connection if there has been no activity on that connection for some specified period of time. Since TCP/IP keepalive support is optional, not all applications will respond to the keepalive packet. DB2 for z/OS, however, does recognize the TCP/IP keepalive packet.
It is recommended that TCP/IP keepalive be configured and the keep alive interval be set to 5 minutes or less. This will allow lost connections to be detected either because of a network outage or a system crash. Resources being held by an application can then be released.
To enable TCP/IP keepalive and set a keep alive interval, the client, the DB2 Connect, and the DB2 for z/OS systems must all be configured (assuming TCP/IP is being used between all systems).
On the z/OS system, the keep alive enablement and interval setting can be set within TCP/IP to cover all applications. In the TCP/IP PROFILE file, there is a parameter called KEEPALIVEOPTIONS in the TCPPARMS(PROFILE) on z/OS. One of the keywords in this option is INTERVAL, which sets the keep alive interval in terms of seconds. Check with your z/OS TCP/IP person to find out what was used on your system. To override the default KEEPALIVE setting for DB2 for z/OS, you can set a TCP/IP KEEPALIVE value during installation on the DSNTIP5 installation panel. You can also modify the TCPKPALV ZPARM value. Possible settings are:
• ENABLE - Do not override the TCP/IP KEEPALIVE configuration value.
44
Reference Only Student Notes
120 is the default in V8.• DISABLE - Disable KEEPALIVE probing for this subsystem.• 1-65534 - Override the TCP/IP KEEPALIVE configuration value with the number of seconds entered. The default in V8 is 120 seconds; the V7 default is ENABLE. The default value was changed to 120 in V8. This number should be set close to or equal to the IDLE THREAD TIMEOUT value. Avoid using very small values. KEEPALIVE works by sending KEEPALIVE packets over the network, thus increasing network traffic, without sending any production information. A value between 3 to 5 minutes would be an acceptable number.
On a Windows system, set the SessionKeepAlive registry value to a value in the range of 3 to 5 minutes. The default is 3,600,000 seconds.
On AIX, the TCP/IP KEEPALIVE interval is specified by the network option tcp_keepintvl. Use the no command to set this value (must be done by the rootuser).
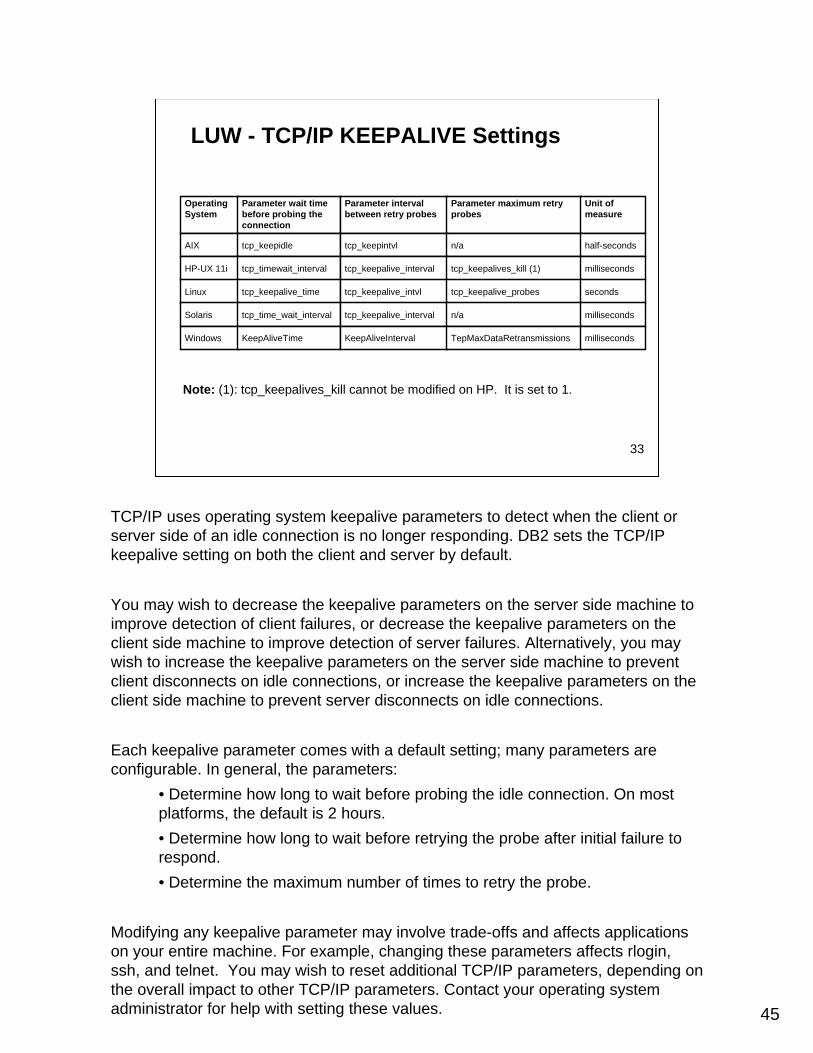
45
Operating System
Parameter wait time before probing the connection
Parameter interval between retry probes
Parameter maximum retry probes
Unit of measure
AIX tcp_keepidle tcp_keepintvl n/a half-seconds
HP-UX 11i tcp_timewait_interval tcp_keepalive_interval tcp_keepalives_kill (1) milliseconds
Linux tcp_keepalive_time tcp_keepalive_intvl tcp_keepalive_probes seconds
Solaris tcp_time_wait_interval tcp_keepalive_interval n/a milliseconds
Windows KeepAliveTime KeepAliveInterval TepMaxDataRetransmissions milliseconds
Note: (1): tcp_keepalives_kill cannot be modified on HP. It is set to 1.
LUW - TCP/IP KEEPALIVE Settings
33
TCP/IP uses operating system keepalive parameters to detect when the client or server side of an idle connection is no longer responding. DB2 sets the TCP/IP keepalive setting on both the client and server by default.
You may wish to decrease the keepalive parameters on the server side machine to improve detection of client failures, or decrease the keepalive parameters on the client side machine to improve detection of server failures. Alternatively, you may wish to increase the keepalive parameters on the server side machine to prevent client disconnects on idle connections, or increase the keepalive parameters on the client side machine to prevent server disconnects on idle connections.
Each keepalive parameter comes with a default setting; many parameters are configurable. In general, the parameters:
• Determine how long to wait before probing the idle connection. On most platforms, the default is 2 hours.• Determine how long to wait before retrying the probe after initial failure to respond.• Determine the maximum number of times to retry the probe.
Modifying any keepalive parameter may involve trade-offs and affects applications on your entire machine. For example, changing these parameters affects rlogin, ssh, and telnet. You may wish to reset additional TCP/IP parameters, depending on the overall impact to other TCP/IP parameters. Contact your operating system administrator for help with setting these values.
46
Reference Only: Student Notes
Displaying and modifying keepalive valuesFollow these steps to modify the values.1. Log in as root (or as an Administrator on Windows).2. Run help on the network tuning parameter or use the man pages on UNIX systems.
Platform Operating System CommandAIX no -aHP-UX 11i ndd -h supportedLinux sysctl -hSun Solaris ndd /dev/tcp \?Windows From the Start menu, choose Run and enter Regedit. Choose Help from the Tool Bar.
3. Display current settings. .Platform Operating System CommandAIX no -o<tcp_parameter>HP-UX 11i ndd -get /dev/tcp <tcp_parameter>Linux sysctl net.ipv4.<tcp_parameter>Sun Solaris ndd -get /dev/tcp <tcp_parameter>Windows From the Start menu, choose Run and enter Regedit to view the parameter located in the Registry file. If the parameter does not exist, it may be added using the EDIT button on the
toolbar. HKEY_LOCAL_MACHINE\System\CurrentControlSet\Services\Tcpip\Parameters
4. Display the range of available settings.
Platform Operating System CommandAIX This option is not available.HP-UX 11i ndd -h <tcp_parameter>Linux This option is not available.Sun Solaris This option is not available.Windows From the Start menu, choose Run and enter Regentry.hlp and choose network services and choose TCP/IP Transport Entries.
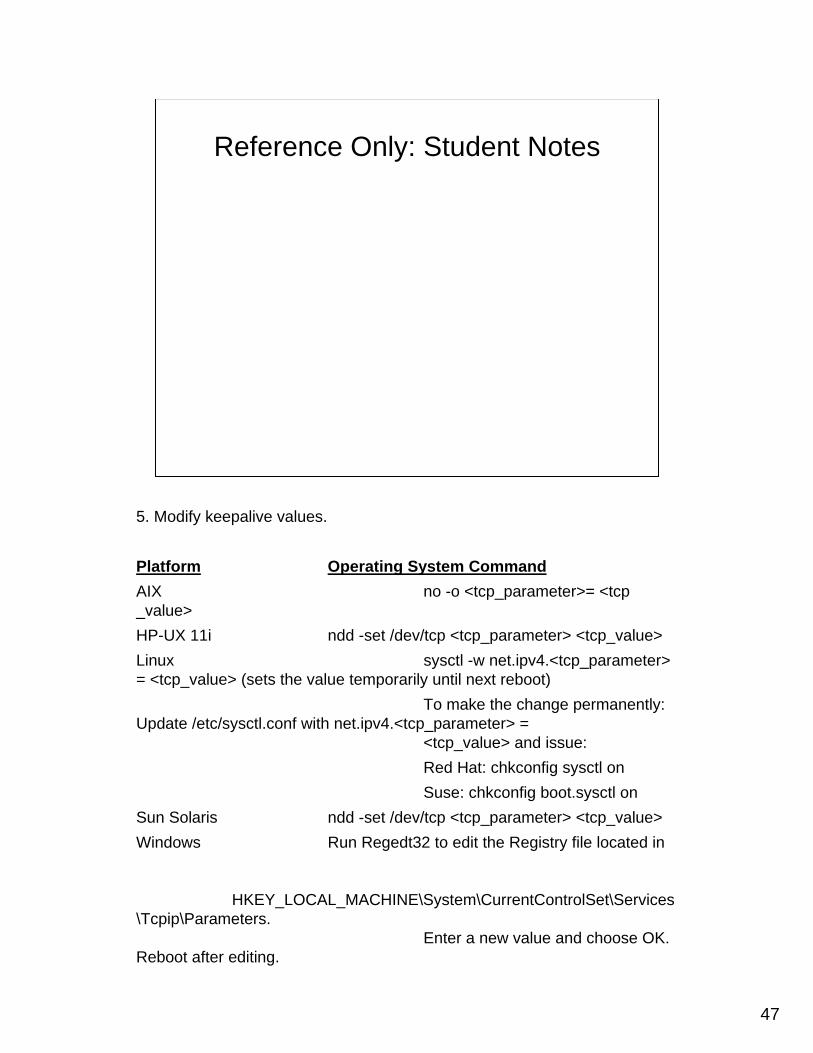
47
Reference Only: Student Notes
5. Modify keepalive values.
Platform Operating System CommandAIX no -o <tcp_parameter>= <tcp_value>HP-UX 11i ndd -set /dev/tcp <tcp_parameter> <tcp_value>Linux sysctl -w net.ipv4.<tcp_parameter> = <tcp_value> (sets the value temporarily until next reboot)
To make the change permanently: Update /etc/sysctl.conf with net.ipv4.<tcp_parameter> =
<tcp_value> and issue:Red Hat: chkconfig sysctl onSuse: chkconfig boot.sysctl on
Sun Solaris ndd -set /dev/tcp <tcp_parameter> <tcp_value>Windows Run Regedt32 to edit the Registry file located in
HKEY_LOCAL_MACHINE\System\CurrentControlSet\Services\Tcpip\Parameters.
Enter a new value and choose OK. Reboot after editing.
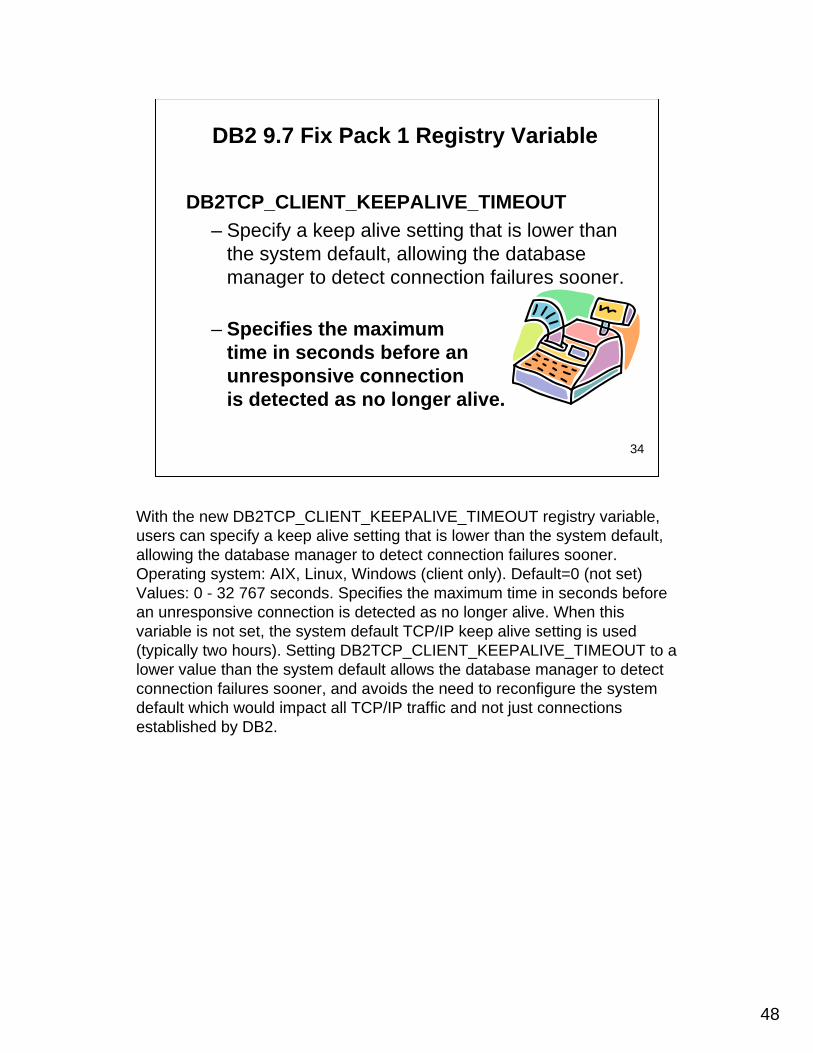
48
DB2 9.7 Fix Pack 1 Registry Variable
DB2TCP_CLIENT_KEEPALIVE_TIMEOUT– Specify a keep alive setting that is lower than
the system default, allowing the database manager to detect connection failures sooner.
– Specifies the maximum time in seconds before an unresponsive connection is detected as no longer alive.
34
With the new DB2TCP_CLIENT_KEEPALIVE_TIMEOUT registry variable, users can specify a keep alive setting that is lower than the system default, allowing the database manager to detect connection failures sooner. Operating system: AIX, Linux, Windows (client only). Default=0 (not set) Values: 0 - 32 767 seconds. Specifies the maximum time in seconds before an unresponsive connection is detected as no longer alive. When this variable is not set, the system default TCP/IP keep alive setting is used (typically two hours). Setting DB2TCP_CLIENT_KEEPALIVE_TIMEOUT to a lower value than the system default allows the database manager to detect connection failures sooner, and avoids the need to reconfigure the system default which would impact all TCP/IP traffic and not just connections established by DB2.
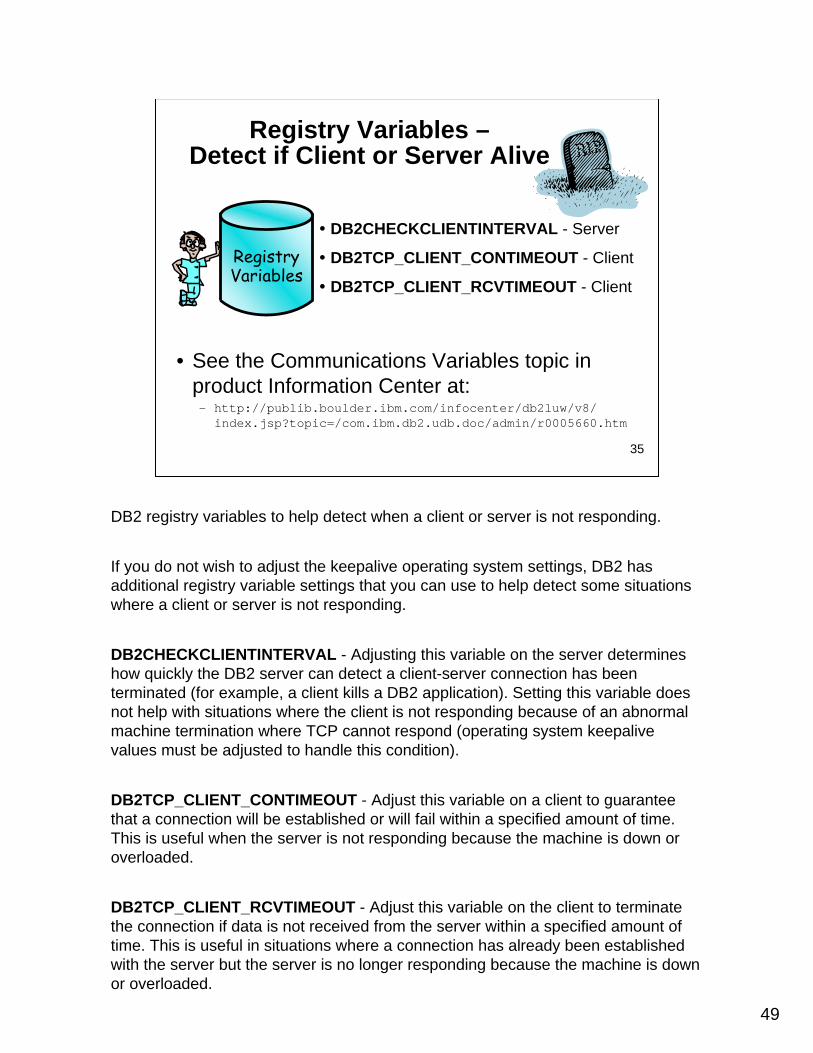
49
RegistryVariables
DB2CHECKCLIENTINTERVAL - Server
DB2TCP_CLIENT_CONTIMEOUT - Client
DB2TCP_CLIENT_RCVTIMEOUT - Client
Registry Variables –Detect if Client or Server Alive
• See the Communications Variables topic in product Information Center at:– http://publib.boulder.ibm.com/infocenter/db2luw/v8/
index.jsp?topic=/com.ibm.db2.udb.doc/admin/r0005660.htm
35
DB2 registry variables to help detect when a client or server is not responding.
If you do not wish to adjust the keepalive operating system settings, DB2 has additional registry variable settings that you can use to help detect some situations where a client or server is not responding.
DB2CHECKCLIENTINTERVAL - Adjusting this variable on the server determines how quickly the DB2 server can detect a client-server connection has been terminated (for example, a client kills a DB2 application). Setting this variable does not help with situations where the client is not responding because of an abnormal machine termination where TCP cannot respond (operating system keepalive values must be adjusted to handle this condition).
DB2TCP_CLIENT_CONTIMEOUT - Adjust this variable on a client to guarantee that a connection will be established or will fail within a specified amount of time. This is useful when the server is not responding because the machine is down or overloaded.
DB2TCP_CLIENT_RCVTIMEOUT - Adjust this variable on the client to terminate the connection if data is not received from the server within a specified amount of time. This is useful in situations where a connection has already been established with the server but the server is no longer responding because the machine is down or overloaded.

50
Reference Only - Student Notes
For additional details on these registry variables, see the Communications variables topic in the product Information Center at http://publib.boulder.ibm.com/infocenter/db2luw/v8/index.jsp?topic=/com.ibm.db2.udb.doc/admin/r0005660.htm
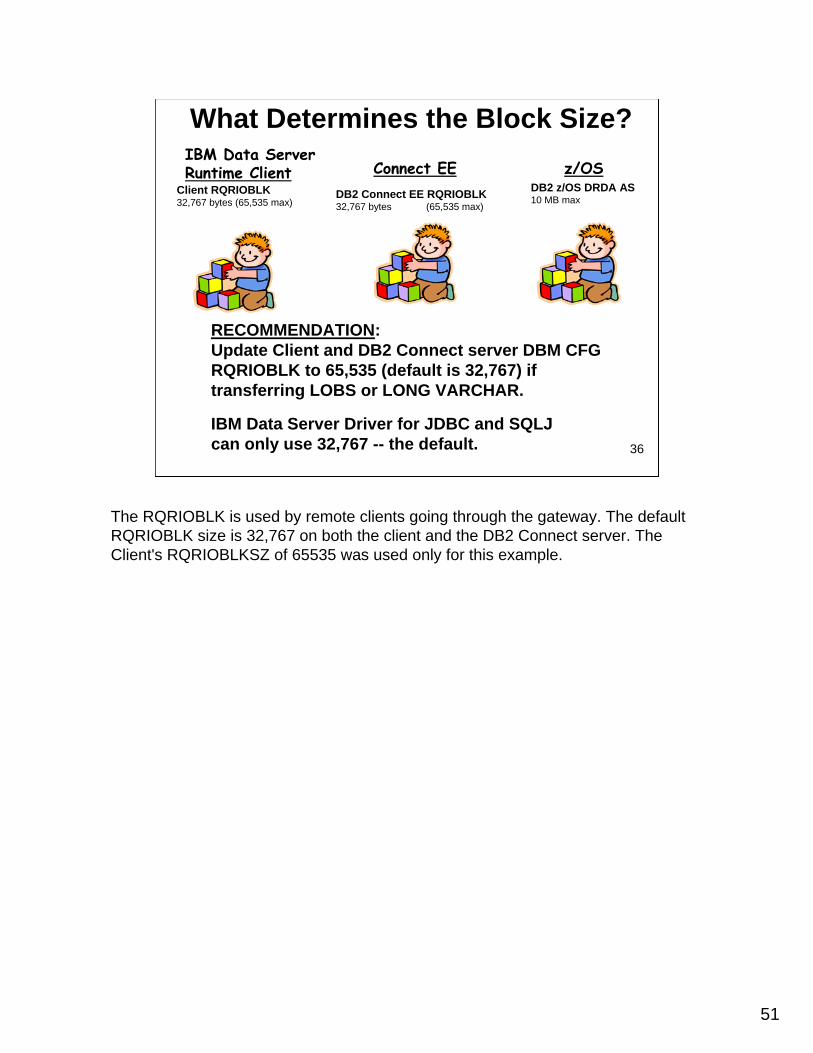
51
Client RQRIOBLK32,767 bytes (65,535 max)
DB2 Connect EE RQRIOBLK32,767 bytes (65,535 max)
DB2 z/OS DRDA AS10 MB max
IBM Data ServerRuntime Client Connect EE z/OS
What Determines the Block Size?
RECOMMENDATION: Update Client and DB2 Connect server DBM CFG RQRIOBLK to 65,535 (default is 32,767) if transferring LOBS or LONG VARCHAR.
IBM Data Server Driver for JDBC and SQLJ can only use 32,767 -- the default. 36
The RQRIOBLK is used by remote clients going through the gateway. The default RQRIOBLK size is 32,767 on both the client and the DB2 Connect server. The Client's RQRIOBLKSZ of 65535 was used only for this example.
52
For additional information, see http://www.ibm.com/software/data/education/• CL600 Connecting DB2 for LUW to DB2 for z/OS - ImplementationThis course is designed for DB2 database and system administrators responsible for implementation and management of connectivity between applications running on distributed platforms like Microsoft Windows, Linux and UNIX based systems and DB2 for z/OS database servers. Through lectures and lab exercises, students will learn how to configure a DB2 for z/OS subsystem as a Distributed Relational Database Architecture (DRDA) server. Students will learn about alternative methods to implement application connectivity including using IBM Data Server drivers, a DB2 Data Server client or a DB2 Connect server.
• SG24-6952 DB2 9 for z/OS: Distributed Functionswww.ibm.com/redbooks
• CL312 DB2 9.7 LUW Transition
• CUSTOMIZED education toMeet Your Needs
Melanie StopferIBM Software Group
For additional information, see http://www.ibm.com/software/data/education/for course CL600 Implementing DB2 Connect and Client Connections to DB2 for z/OS.
BioMelanie Stopfer is a Consulting Learning Specialist and Developer for IBM Software Group. As a Certified DB2 9.7 Advanced Technical Expert and Certified Learning Facilitation Specialist, she has provided hands-on in-depth technical support to customers specializing in both data warehouse and transaction systems. She has worked with development labs and worldwide customers to provide DB2 solutions since 1988. In 2009, Melanie was the first DB2 LUW speaker to be inducted into the IDUG Speaker Hall of Fame and was also selected as Best Overall Speaker at IDUG NA in 2009 and 2008, Top Ten Speaker at IDUG NA 2010, 2009, 2008, 2007, and IDUG Europe 2010, 2009, 2008 and 2007. She has received numerous awards for development of DB2 recovery, administration, performance, and database upgrade and migration best practice solutions.