Embed Size (px)
Citation preview
Pageoph, Vol. 115 (1977), Birkhfiuser Verlag, Basel 1 11 1
Hemispheric Simulation of the Asian Summer Monsoon
B y DOtJGLaS A. ABBOTT ~)
Abstract - A three-level, fl-plane, filtered model is used to simulate the Northern Hemisphere summer monsoon. A time-averaged initial state, devoid of sub-planetary scale waves, is integrated through 30 days on a 5 ~ latitude-longitude grid. Day 25 through day 30 integrations are then repeated on a 2.5 ~ grid. The planetary-scale waves are forced by time-independent, spatially varying diabatic heating. Energy is ex- tracted via internal and surface frictional processes. Orography is excluded to simplify synoptic-scale energy sources.
During integration the model energy first increases, but stabilizes near day 10. Subsequent flow patterns closely resemble the hemisphere summer monsoon. Climatological features remain quasi-stationary. At 200 mb high pressure dominates the land area, large-scale troughs are found over the Atlantic and Pacific Oceans, the easterly jet forms south of Asia, and subtropical jets develop in the westerlies. At 800 mb subtropical highs dominate the oceans and the monsoon trough develops over the Asian land mass. The planetary scales at all levels develop a realistic cellular structure from the passage of transient synoptic-scale features, e.g., a baroclinic cyclone track develops near 55~ and westward propagating waves form in the easterlies.
Barotropic redistribution of kinetic energy is examined over a iow-latitude zonal strip using a Fourier wave-space. In contrast to higher latitudes where the zonal flow and both longer and shorter waves are fed by barotropic energy redistribution from the baroclinically unstable wavelengths, the low-latitude waves have a planetary-scale kinetic energy source. Wave numbers 1 and 2 maintain both the zonal flow and all shorter scales via barotropic transfers. Transient and standing wave processes are examined individually and in combination.
Wave energy accumulates at wave numbers 7 and 8 at 200 mb and at wave number 11 in the lower troposphere. The 800-mb waves are thermally indirect and in the mean they give energy to the zonal flow. These characteristics agree with atmospheric observation. The energy source for these waves is the three wave barotropic transfer. The implications of examining barotropic processes in a Fourier wave-space, vice the more common approach of separating the flow into a mean plus a deviation, are discussed.
Key words: Monsoon: 3 level model; Hemispheric circulation.
1. Introduct&n
I n t h e t r o p i c s a n d s u b t r o p i c s d u r i n g t he N o r t h e r n H e m i s p h e r e s u m m e r m o n t h s ,
t h e m o t i o n f ield o f t h e u p p e r t r o p o s p h e r e is d o m i n a t e d b y l a rge a m p l i t u d e , q u a s i -
s t a t i o n a r y , p l a n e t a r y w a v e s . T h e s e w a v e s a r e so p e r s i s t e n t in t h e d a i l y d a t a t h a t t h e y
a p p e a r a l m o s t u n a l t e r e d in m o n t h l y a v e r a g e d d a t a . T h e y a re v e r y p r o m i n e n t in t he
a n a l y s e s o f KRISHNAMURTI a n d RODGERS (1970) w h i c h c o n s i s t o f 2 0 0 - m b s t r e a m l i n e s
a n d i s o t a c h s f o r a z o n a l s t r i p (27 .5~ to 4 7 . 5 ~ l a t i t u d e ) d u r i n g t h e s u m m e r o f 1967.
~) Headquarters Air Weather Service, Scott AFB, IL 62225, USA.
1112 Douglas A. Abbott (Pageoph,
The analyzed data have been examined in detail by KRISHNAMURTI (1971a, b). He found that the wind field is highly rotational even at low latitudes and on any given day zonal harmofiics one and two account for nearly 80 percent of the variance of the rotational wind. These harmonics exhibit a pronounced northeast to southwest tilt in the Northern Hemisphere. Thus, they transport westerly momentum out of the tropics toward the mid-latitude westerly jets. Wave number 1 is an upper tropospheric manifestation of the outflow of the Asian monsoon whereas wave number 2 contains the 200-rob mid-oceanic troughs created by land-ocean distribution.
The characteristics of the monsoon are discussed by FLOHN (1968) whereas the oceanic troughs are described by RAMAGE (1959) and ASPLIDEN et al. (1966) respectively for the Pacific and Atlantic Oceans. These planetary-scale features contain a series of smaller scale eddies on any given day. While the zonal average Hadley cell is rather weak, local Hadley cells are prominent, particularly over and south of the Asian continent. East-west overturnings of equivalent strength emanate from the Asian monsoon outflow and sink into the oceanic troughs. These have been discussed by KRISHNAMURTI (1971a). The equatorial Walker circulation (BJERKNES et al., 1969) is a weak secondary feature compared to the higher latitude east-west vertical-plane circulations. The southward branch of the local Hadley cell produces an easterly jet south of Asia extending into Africa (KoTESWARUM, 1958). This jet lies between 10~ and 15~ with maximum speeds in excess of 75 m/sec near 150 mb. The jet can become barotropically unstable as synoptic-scale disturbances form and propagate through it. Krishnamurti found a peak in variances of the meridional wind around wave number 8 at 200 rob. This is somewhat longer than the synoptic waves characteristic of the lower troposphere. Indeed the two regimes seem to be uncoupled in the absence of vigorous organized convection.
The lower tropospheric flow regimes are comprehensively discussed by RIEHL (1954). The subtropical oceans are dominated by migratory anticyclones in the summer. These anticyclones statistically produce a zone of light wind and high pressure classically referred to as the horse latitudes. A strong tow-level temperature inversion is found over the eastern Atlantic and Pacific Oceans. The air is relatively dry above the inversion and conditionally unstable up to mid-tropospheric levels over the entire summer tropics and subtropics. The planetary scale divergence patterns associated with continent; ocean differential heating, topography, and radiative cooling help form this inversion (LAHIFF, 1971). The inversion weakens downstream (to the west) as successive cumulus penetrations add heat and moisture to the low levels. Numerical general circulation studies such as MANABE (1969) suggest that sea surface temperatures strongly regulate cumulus activity thus controlling downstream modifications of the inversion in the strong low-level easterlies which lie south of the horse latitudes. These easterlies converge into the ITCZ, a confluent wind regime which represents a meeting of the flows from the two hemispheres formed by the 'heat equator'. During the northern summer, the ITCZ exhibits large zonal asymmetries and lies between 10~ and 25~ Persistent quasi-stationary heat lows are found over
Vol. 115, 1977) Hemispheric Simulation of the Asian Summer Monsoon 1113
the subtropical continents. STRUNNING and FLOHN (1969) report that African tropical rain forests with their high evaporation rate and general cloudiness have a heat budget resembling a tropical ocean more than a continent. The arid regions to the north exhibit the highest surface temperatures and help maintain the heat lows through large earth to air sensible heat transfers. The African heat lows are generally cloud-free due to lack of moisture. Intense low-level dry convection exists in a regime of upper level, planetary scale descent. Over the Sahara desert, the surface temperature changes by 10K within 10 ~ of latitude. The atmosphere's response to this strong baroclinic zone is an easterly jet near the 700-rob level south of the ITCZ. 13URPEE (1972) found that synoptic scale easterly waves form in this region deriving their perturbation energy from barotropic and baroclinic sources. They then propagate westward through the low-level easterlies. This type of wave motion was first docu- mented by RIEHL (1945, 1948). PALMER (1951, 1952) found similar waves over the Pacific. WALLACE (1970) used time, longitude sections of satellite cloud photos to show that waves propagating off the coast of Africa may travel all the way to the west Pacific.
Even from cursory examination of daily streamline-isotach analyses, it is evident that both the upper and lower tropospheric regimes contain considerable energy in the quasi-stationary planetary scale waves (10 000 km _< wave length). These must be forced waves as free waves of this length would retrograde westward at a rapid rate. The nature of the forcing is well known. CHARNEY and ELIASSEN (1949) showed that zonal asymmetries in orography and surface friction could produce such waves. SMAGORrNSI~Y (1953) demonstrated that diabatic heating produced similar results. Later SALTZMAN and RAO (1964) showed that the best results require inclusion of all three forms of forcing.
It is shown in this work that the upper tropospheric manifestations of the summer monsoon can be reproduced in a quasi-barotropic numerical simulation. The simplicity of the model permits the isolation of barotropic energy processes.
2. Experiment design
Complete numerical simulation of the tropical general circulation is a complex problem. However, much can be learned from simple models. Scale analysis is a useful tool for isolating the physics of the dominant motions. The goal is to gain insight into barotropic energetics for the tropics.
There is no clear way to isolate the tropics from mid-latitudes. Furthermore, MAK (1969) demonstrated that events at high latitudes can exert an important influence on low latitude motions. Table 1 summarizes the scale arguments of CHARNEY (1948,1963) and BURCER (1958). It is useful to note that all vorticity equation terms form a subset of terms contained in the quasi-geostrophic vorticity equation while all divergence equation terms form a subset of the nonlinear balance equation
1114 Douglas A. Abbott (Pageoph,
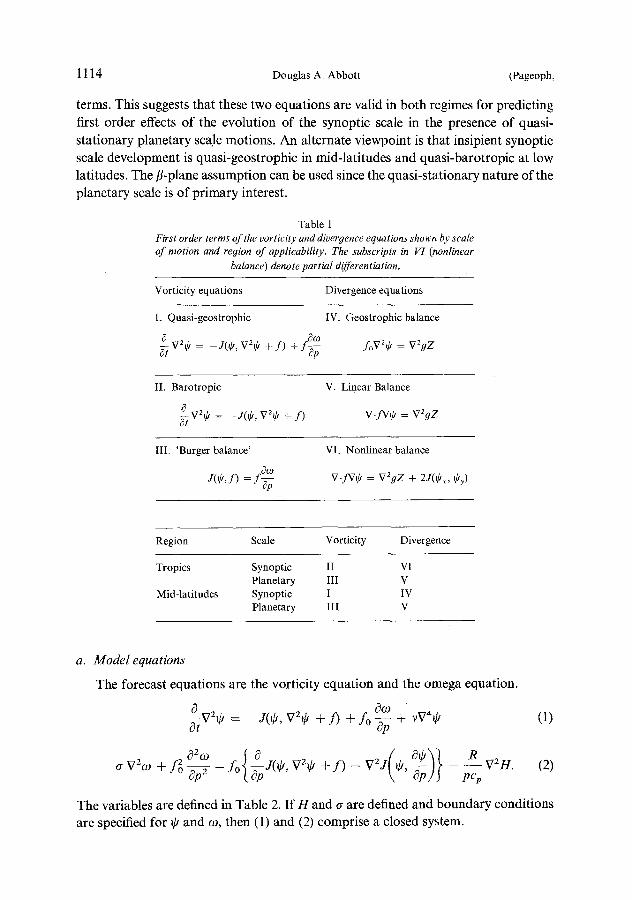
terms. This suggests that these two equations are valid in both regimes for predicting first order effects of the evolution of the synoptic scale in the presence of quasi- stationary planetary scale motions. An alternate viewpoint is that insipient synoptic scale development is quasi-geostrophic in mid-latitudes and quasi-barotropic at low latitudes. The fl-plane assumption can be used since the quasi-stationary nature of the planetary scale is of primary interest.
Table 1 First order terms of the vorticity and divergence equations shown by scale of motion and region of applicability. The subscripts in VI (nonlinear
balance) denote partial differentiation.
Vorticity equations Divergence equations
L Quasi-geostrophic IV. Geostrophic balance
V2r = -J ( f f , V2~ + f ) + f ~ - foV2~ = V2gZ cp
II. Barotropic V. Linear Balance
~7 V2~' = -JOP, V2~P + f ) V .j/V[// = V2qZ
llI. 'Burger balance' VI. Nonlinear balance
J(~9, f ) = fQ~o ~p v.fv~ = V2gZ + 2J(~., ~,y)
Region Scale Vorticity Divergence
Tropics Synoptic II VI Planetary III V
Mid -latitudes Synoptic I IV Planetary III V
a. Model equations
The forecast equations are the vorticity equation and the omega equation.
Nv 0 = -J(0, v ~ + I) + o op + vv~0 (11
~o2~ { a ( ~ 0 ) } R V~H. (2) aV2o3+fO~p2 =f~ ~p 0p'V20 + f ) - V 2 j O,~pp - p c Z
The variables are defined in Table 2. If H and a are defined and boundary conditions are specified for ~ and o~, then (1) and (2) comprise a closed system.
Vol. 115, 1 9 7 7 ) Hemispheric Simulation of the Asian Summer Monsoon 1 ! 15
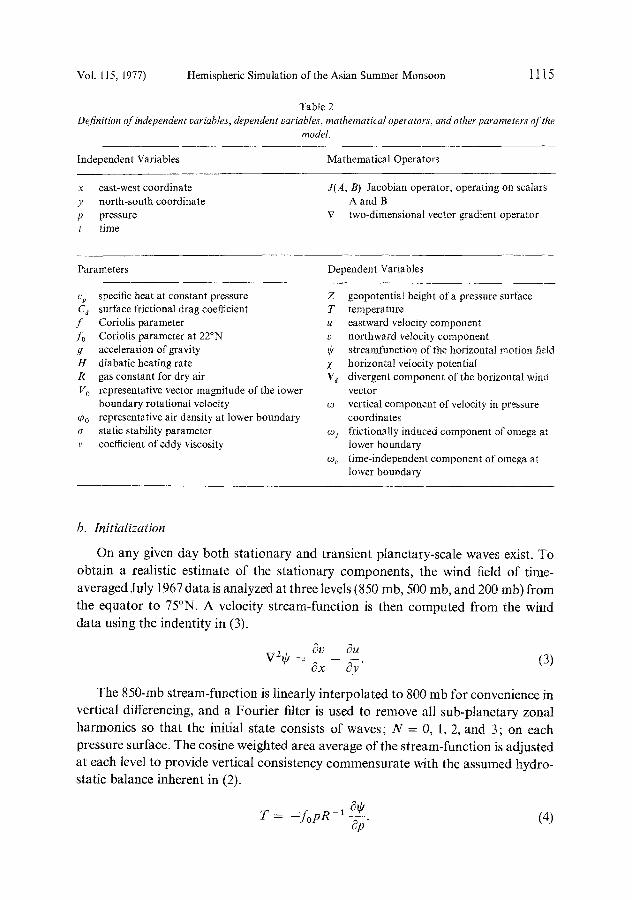
Table 2 Definition of independent variables, dependent variables, mathematical operators, and other parameters of the
model.
Independent Variables Mathematical Operators
x east-west coordinate y north-south coordinate p pressure t time
J(A, B) Jacobian operator, operating on scalars A and B
V two-dimensionalvector gradient operator
Parameters Dependent Variables
cp specific heat at constant pressure C a surface frictional drag coefficient f Coriolis parameter fo Coriolis parameter at 22~ g acceleration of gravity H diabatic heating rate R gas constant for dry air V 0 representative vector magnitude of the lower
boundary rotational velocity q)0 representative air density at lower boundary cr static stability parameter v coefficient of eddy viscosity
Z geopotential height of a pressure surface T temperature u eastward velocity component v northward velocity component r streamfunction of the horizontal motion field
horizontal velocity potential V d divergent component of the horizontal wind
vector co vertical component of velocity in pressure
coordinates co I frictionally induced component of omega at
lower boundary co~ time-independent component of omega at
lower boundary
b. Initialization
On any given day both stationary and transient planetary-scale waves exist. To obtain a realistic estimate of the stationary components, the wind field of time- averaged July 1967 data is analyzed at three levels (850 rob, 500 rob, and 200 rob) from the equator to 75~ A velocity stream-function is then computed from the wind data using the indentity in (3).
Ov c~u V2~' -- Ox ~,y' (3)
The 850-rob stream-function is linearly interpolated to 800 mb for convenience in vertical differencing, and a Fourier filter is used to remove all sub-planetary zonal harmonics so that the initial state consists of waves; N = 0, 1, 2, and 3; on each pressure surface. The cosine weighted area average of the stream-function is adjusted at each level to provide vertical consistency commensurate with the assumed hydro- static balance inherent in (2).
o0 -- - f o p R - 1 Tp" (4)
1116 Douglas A. Abbott (Pageoph,
c. Boundary conditions
The numerical model includes three levels in the vertical, each bounded laterally by the equator and 70~ A free-slip wall is imposed at 70~ On the equator the planetary waves of the initial state are assumed to be stationary for all time. Two boundary rows are needed to compute the nonlinear terms in (1). co is assumed to be zero at 50 rob, while at the lower boundary co is calculated as the sum of a frictionally induced component, col, and a planetary-scale, time-independent component, cop. Since 0 is not defined at 950 mb, the values at 800 mb are used in (5). Note that orographic forcing is omitted. Its
coy = -g(Pofo 1Cd Vo V20 (5)
inclusion would have introduced a sub-planetary scale wave source thereby con- taminating the experiment.
d. Steady, planetary scale forcing
If it is assumed that the data represent a reasonable approximation to the summer atmosphere's standing planetary Scale waves, one can then define the distribution of divergence needed to maintain these stationary waves. The vorticity time tendency and the dissipation terms are set equal to zero in (1), and residual divergence is then calculated at each grid point. Given the point value of divergence and the upper boundary condition, downward integration yields point values of co. co~ can now be calculated as a residual of co and coot. Next, the forcing which produces internal values of co can be specified. Implicit in (2) is the following form of the first law of thermo-
dynamics.
OT - J ( ~ , T ) + p a R - l c o + c ~ I H + v V 2 T . (6)
~t
Stationary waves must have an associated stationary thermal structure. The diabatic heating rate, H, is calculated from (6) as all other terms are known. The cosine weighted area average of H is subtracted from each level to prevent systematic warming or
cooling.
e. The integration
The initial state is integrated through 30 days on a 5 ~ by 5 ~ latitude-longitude grid. Day 25 is then linearly interpolated to a 2.5 ~ by 2.5 ~ grid and the last five days are reintegrated. A second-order, predictor-corrector time derivative is used (MATSUNO, 1966). Centered, second-order differences are used to approximate the linear spatial derivatives, and the nonlinear terms use the formulation suggested by ARAKAWA (1966).
Vol. 115, 1977) Hemispheric Simulation of the Asian Summer Monsoon l 117
3. Experiment results
During the numerical integration, the kinetic energy first increases, but then stabilizes at about day 10. The weak, time-averaged features of the initial state be- come obscured by transient motions on all scales and the resultant simulation closely resembles the general circulation of the Northern Hemisphere summer. Of course, the fine structure of the ITCZ is absent. Both the physics and the spatial resolution are inadequate for its representation. The 200 mb circulation patterns are particularly striking. It is of interest to compare the details of the simulated flow to those typically observed. Another interesting feature is the barotropic redistribution of kinetic energy. A comparable examination of potential energy is not undertaken since the results are predetermined to a large extent by the assumed diabatic heating. During the last few days of the experiment, mid-tropospheric synoptic scale waves develop over Africa and propagate westward. These waves are examined in some detail. A more thorough investigation of these and other features is available in ABBOTa" (1973).
a. Circulation features at 200 mb
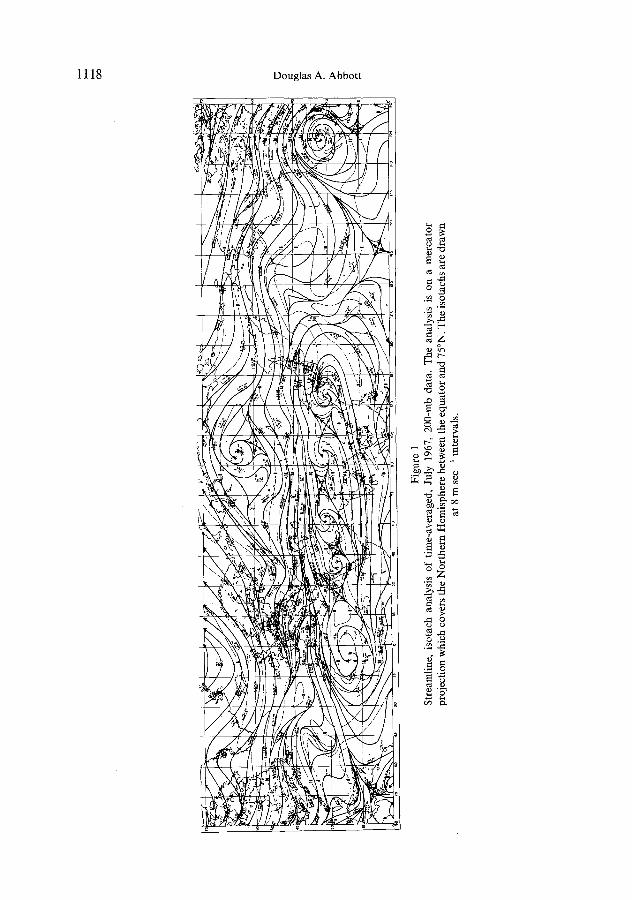
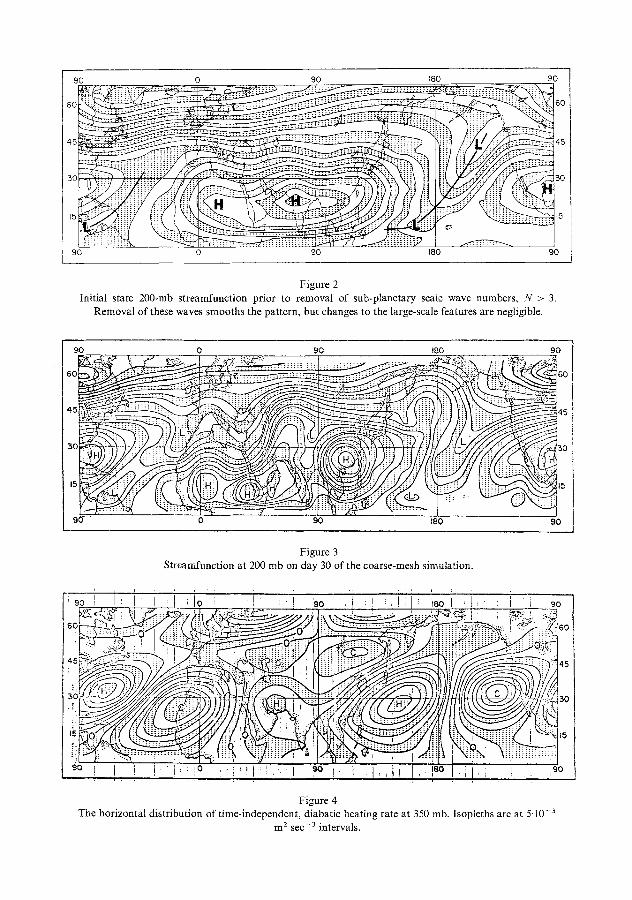
Streamline-isotach analysis of time-averaged July 1967 data is shown in Fig. 1. The large-scale features resemble the daily analyses of KRISHNAMURTI and ROD~ERS (1970), and the prominent climatological features discussed earlier are easily detected. While the analysis is rather subjective in data sparse regions, the data are surely adequate to resolve zonal harmonics, N = 1, 2, and 3. Removal of the subplanetary scale motions leaves wave patterns clearly depicting wave two with anticyclonic flow over land and cyclonic flow over the oceans. Wave 1 is evident in the dominance of the Asian high pressure zone over the Mexican zone. Wave 3 is much smaller in amplitude, but contributes to the northeast to southwest tilt of the circulations (see Fig. 2).
Day 30 of the numerical coarse-mesh integration is presented in Fig. 3, It is clear that shorter scale waves, N ='4, 5 . . . . , are again present. One could easily find a real data analogue to this numerical simulation. Wind speeds in the easterly and subtropical westerly jet streams range from 24 to 40 m sec- ~ in good agreement with observation. Worthy of mention is the fact that on any random day of the integration the mid-oceanic troughs and continental high pressure zones are found near their climatological positions. The same is true at the other levels which are not shown.
The horizontal distribution of time-independent diabatic heating at 350 mb is presented in Fig. 4. The general areas of heating and cooling are in reasonable agree- ment with results obtained from atmospheric data by BROWN (1964); however, Brown's results contain sub-planetary scale extrema. There is close correspondence between the heating pattern and the initial vertical motion field as seen in Fig. 5. The planetary scales in the model are thermally direct in agreement with KRISr~NAMURa'I (1971a).
1118 Douglas A. Abbott
90 0 90 180
. . . , . . ~
4 5 . . . . . . - . " : j . . . . . . . . . �9 . . . . . . . .
i. ii~ 15
90 0 90 180
90
60
~5
50
90
Figure 2 Initial state 200-mb streamfunction prior to removal of sub-planetary scale wave numbers, N > 3.
Removal of these waves sraooths the pattern, but changes to the large-scale features are negligible�9
9O
9O"
9 0 t80
0 90 180
9 0
6 0
~0
15
9 0
Figure 3 Streamfunction at 200 mb on day 30 of the coarse-mesh simulation.
: 9 ~ ~ i i , i ,,o , ~ ' i ':~:,9o, , i , , i ~ 9o , 7 - " ~ ~ 7 "
�9 . . . . . " " - , : : 0 ~ : . . : : . i .
eo ! I ! !:'!':i ~ :'!I'll:i..'l 9o i= I ~,'Is~ I + ,90
Figure 4 The horizontal distribution of t ime-independent, diabatic heating rate at 350 mb. Isopleths are at 5.10-3
m z sec-3 intervals.
1120 Douglas A. Abbott (Pageoph,
90 i i i, lJ,i '9,, I , , I ,'8o ! I 90
3 0 ~ 1 . : ~ : v {~iii ~ ~ ~ ~ . ' : ~ ~ ~ ! ' :~ . . . . . . . ' ........... :""" ' ~: ~ ~ ; : o ~ so
@ 3o ,, . . . .
~i .... ~..,, ..-=_.- : : . ~ . . ~t . , ~ ! i i i ' :~3~i~!!ii!ii!ii!i!iii~ii! ~
~ ', ', ,,:,:,l.'~~ ', ', ~ i ,~ ,,i,:I ,~,i,,I" .-I ~i- ~o
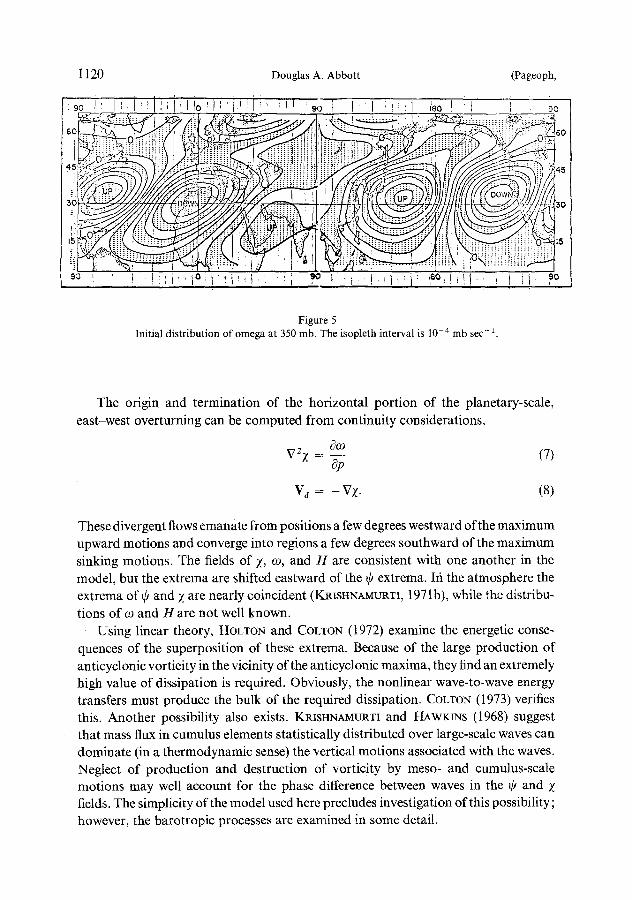
Figure 5 Initial distribution of omega at 350 mb. The isopleth interval is 10-4 mb sec-1.
The origin and termination of the horizontal portion of the planetary-scale, east-west overturning can be computed from continuity considerations.
VZz = - - (7) op
Vd -- - VZ. (8)
These divergent flows emanate from positions a few degrees westward of the maximum upward motions and converge into regions a few degrees southward of the maximum sinking motions. The fields of )~, e~, and H are consistent with one another in the model, but the extrema are shifted eastward of the 0 extrema. Ifi the atmosphere the extrema of t) and )~ are nearly coincident (KRISHNAMURTI, 1971 b), while the distribu- tions of e) and H are not well known.
Using linear theory, HOLTON and COLTON (1972) examine the energetic conse- quences of the superposition of these extrema. Because of the large production of anticyclonic vorticity in the vicinity of the anticyclonic maxima, they find an extremely high value of dissipation is required. Obviously, the nonlinear wave-to-wave energy transfers must produce the bulk of the required dissipation. COLTON (1973) verifies this. Another possibility also exists. KRISHNAMURTI and HAWKINS (1968) suggest that mass flux in cumulus elements statistically distributed over large-scale waves can dominate (in a thermodynamic sense) the vertical motions associated with the waves. Neglect of production and destruction of vorticity by meso- and cumulus-scale motions may well account for the phase difference between waves in the ~ and Z fields. The simplicity of the model used here precludes investigation of this possibility; however, the barotropic processes are examined in some detail.
Vol. 115, 1977) Hemispheric Simulation of the Asian Summer Monsoon 1 121
b. Barotropic energy conversions
A rather complete picture of mid-latitude energetics has evolved during the past two decades. Excellent survey articles are available in OORT (1964) and SALTZMAN (1970). These studies show that North of 20~ in summer, waves N = 1, 2 . . . . . 15 are all barotropically stable (wave-zonal interactions increase the energy of the zonal flow) and waves N = 2 and N = 6, 7 , . . . , 10 supply energy to both longer and shorter waves via barotropic wave-to-wave energy transfers. The energy sources are presumably thermal forcing related to land-sea distribution for wave number 2 and baroclinic instability for wave numbers 6 through 10.
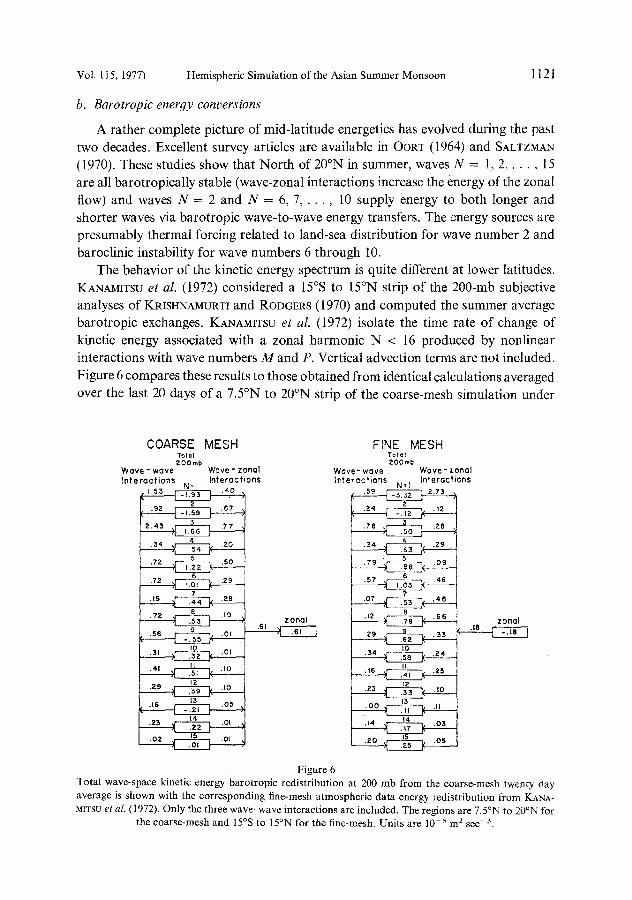
The behavior of the kinetic energy spectrum is quite different at lower latitudes. KANAM[TSU et al. (1972) considered a 15~ to 15~ strip of the 200-rob subjective analyses of KRISHNAMURTI and RODGEI~S (1970) and computed the summer average barotropic exchanges. KANAMITSU et al. (1972) isolate the time rate of change of kinetic energy associated with a zonal harmonic N < 16 produced by nonlinear interactions with wave numbers M and P. Vertical advection terms are not included. Figure 6 compares these results to those obtained from identical calculations averaged over the last 20 days of a 7.5~ to 20~ strip of the coarse-mesh simulation under
COARSE MESH Total 200mb
W a v e - wave Wove - zonal I n te rac t ions In~'eractions
N=I , " s 3 ~ .,,o ,
2.43 ~ .77._
. 3 4 . . , , ~ .20 ,
.72 ~ ,50 6 .72 ~ .29
7 ,16 ~ ,28
8 .19 ' " U-:--q ,S6 ~ .01
tO .31 tt
. 1 0 -
12 .29 ~ , .10 �9 i 1 -
13 .16
15 .02 ~ .OI
ZOnal
FINE MESH Total 20Omb
Wove- wave Wove - zonal Interactions interactions
N=I .5, ._t=-/:~- I 2.n �9 2" U : : ~ . ' 2 i " C--~.~o--] .28~ . ' 4 ~ .'9 1 .,e ~ .oe~
,07
8 .12 .66
IO ,34 ~ .24
,16 , , ~ .25
.23
. 0 0 ~ .ll
14 .14 ~ .03
:Zo~ .,.as
zonal .18
Figure 6 Total wave-space kinetic energy barotropic redistribution at 200 mb from the coarse-mesh twenty day average is shown with the corresponding fine-mesh atmospheric data energy redistribution from KANA- MGSU et al. (1972). Only the three wave-wave interactions are included. The regions are 7.5~ to 20~ for
the coarse-mesh and 15~ to 15~ for the fine-mesh. Units are 10-5 m 2 sec-3.
1122 Douglas A. Abbot t (Pageoph,
consideration here. (See Appendix I, KANAMn'SU et al. (1972) for the explicit mathe- matical form of the energy equation.) The overall agreement of the simulation and the atmospheric data indicates the importance of large scale barotropic processes at low latitudes. The primary differences are the direction of the wave number 2, zonal flow exchange and the direction of transfer of the cumulative wave, zonal flow exchange. Since the north-south slope of wave number 2 reverses in the 15~ to 15~ region (KRISHNAMURTI, 1971a), but not in the 7.5~ to 20~ region it is possible that the former difference results from the different regions considered. The results of KIDSON et al. (1969) indicate this is the case for the latter difference as both studies agree in their respective areas of applicability.
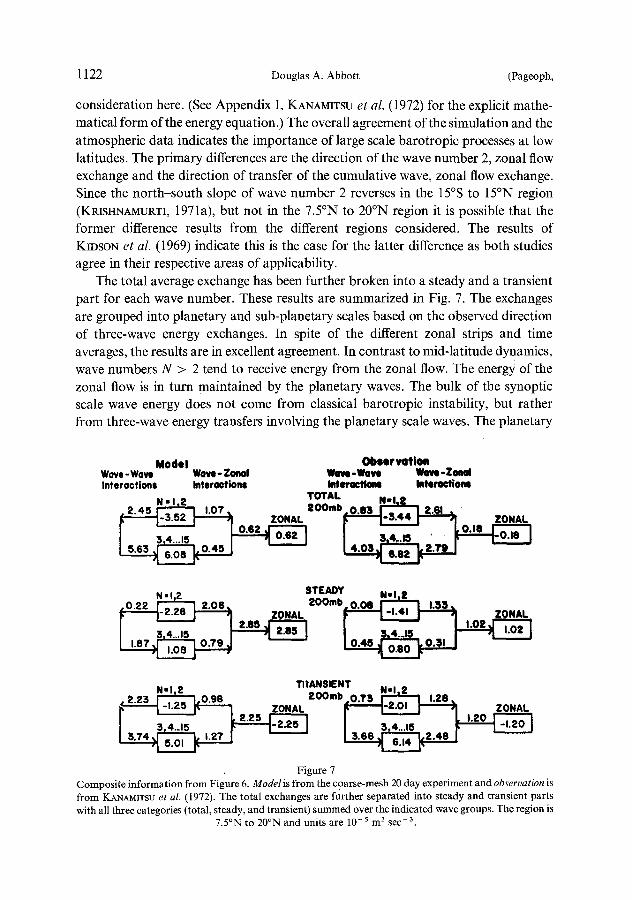
The total average exchange has been further broken into a steady and a transient part for each wave number. These results are summarized in Fig. 7. The exchanges are grouped into planetary and sub-planetary scales based on the observed direction of three-wave energy exchanges. In spite of the different zonal strips and time averages, the results are in excellent agreement. In contrast to mid-latitude dynamics, wave numbers N > 2 tend to receive energy from the zonal flow. The energy of the zonal flow is in turn maintained by the planetary waves. The bulk of the synoptic scale wave energy does not come from classical barotropic instability, but rather from three-wave energy transfers involving the planetary scale waves. The planetary
Model Observation Wove -Wave Wove - Zonal Wave -Wove Wave -Zonal Interactions Interactions Interactions interactions
N �9 I 2 TOTAL
ZONAL , O O m b ~ ZONAL
5.63 ~ N �9 I 2 STEADY N - ~ 2
.o.22 ~ 2.06. 200mo.o.oe ~ 1.3~ ~ - - - - - ~ - ~ : Y U ~ ZONAL ~ - I . ' , ~ ZONAL
' ' ~ I " I . . . . r
. . , . - TItANSIENT . . _ NnI ,Z - - - - . . NSl, ~'
�9 2 .23 r - ' z ~ - - I , o . 9 8 i:~,'umD ,O.'J'3 ~ 1 .28 , -I.z,~ ~ ZONAL ~ - ~ : . v l l ~ - - q ZONAL
Figure 7 Composite information from Figure 6. Mode l is f rom the c0arse-mesh 20 day experiment and observation is from KANAMITSU et al. (1972). The total exchanges are further separated into steady and transient parts with all three categories (total, steady, and transient) summed over the indicated wave groups. The region is
7.5~ to 20~ and units are 10 -5 m 2 see 3.
Vol. 115, 1977) Hemispheric Simulation of the Asian Summer Monsoon | 123
scale waves are in turn maintained by the thermally direct monsoonal, vertical-plane circulations. Clearly, studies using a 'local' mean wind to investigate classical barotropic instability are capturing the planetary-scale contribution via aliasing. What appears to be zonal flow to wave transfer is likely to be dominated by the aliased three-wave transfers. Of course, the results of such studies will be dependent on the distance over which the local average is computed.
c. Fine-mesh, coarse-mesh comparison
The effects of horizontal resolution in finite difference models have been addressed by MANABE et al. (1970), WELLCK et al. (1971), and others. All findings are in general agreement, a primary result being that eddy transport processes are more efficient in high resolution models and the intensity of the resultant general circulation is stronger. These effects are due to better resolution of gradients and the shift of eddy dissipation to sub-synoptic scale motions.
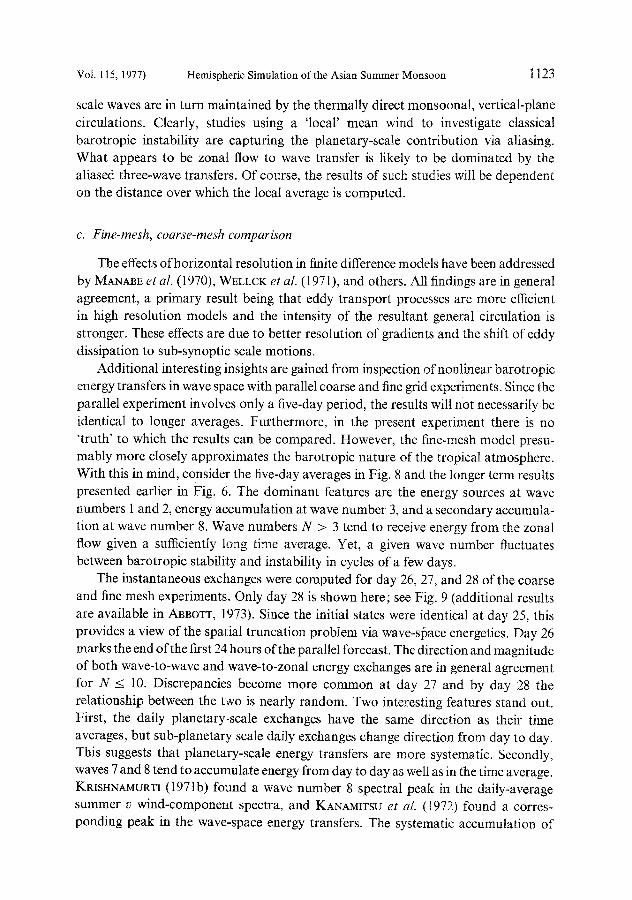
Additional interesting insights are gained from inspection of nonlinear barotropic energy transfers in wave space with parallel coarse and fine grid experiments. Since the parallel experiment involves only a five-day period, the results will not necessarily be identical to longer averages. Furthermore, in the present experiment there is no 'truth' to which the results can be compared. However, the fine-mesh model presu- mably more closely approximates the barotropic nature of the tropical atmosphere. With this in mind, consider the five-day averages in Fig. 8 and the longer term results presented earlier in Fig. 6. The dominant features are the energy sources at wave numbers 1 and 2, energy accumulation at wave number 3, and a secondary accumula- tion at wave number 8. Wave numbers N > 3 tend to receive energy from the zonal flow given a sufficiently long time average. Yet, a given wave number fluctuates between barotropic stability and instability in cycles of a few days.
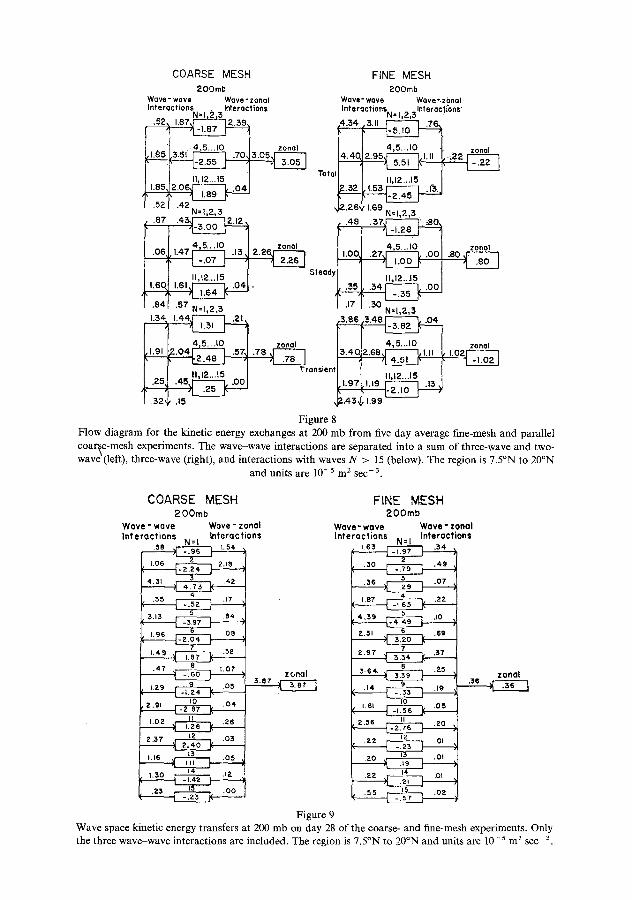
The instantaneous exchanges were computed for day 26, 27, and 28 of the coarse and fine mesh experiments. Only day 28 is shown here; see Fig. 9 (additional results are available in ABBOTT, 1973). Since the initial states were identical at day 25, this provides a view of the spatial truncation problem via wave-@ace energetics. Day 26 marks the end of the first 24 hours of the parallel forecast. The direction and magnitude of both wave-to-wave and wave-to-zonal energy exchanges are in general agreement for N _< 10. Discrepancies become more common at day 27 and by day 28 the relationship between the two is nearly random. Two interesting features stand out. First, the daily planetary-scale exchanges have the same direction as their time averages, but sub-planetary scale daily exchanges change direction from day to day. This suggests that planetary-scale energy transfers are more systematic. Secondly, waves 7 and 8 tend to accumulate energy from day to day as well as in the time average. KRISHNAMURTI (1971b) found a wave number 8 spectral peak in the daily-average summer v wind-component spectra, and KANAMITSU et al. (1972) found a corres- ponding peak in the wave-space energy transfers. The systematic accumulation of
COARSE MESH 200mb
Wave- wave Wave- zonal Interactions Ir#eroctions
N=I 2,3
l ~_ J ~ ~',b...IO I zonal
I . 5 2 1 . 4 2
FINE MESH 200rnb
Wave- wave Wave~.zbnal Interacti~ I 2 3 Interocfi'~
= �9 i
2 zonal
T o f o I ~
~],,z .26q, 1.69 N,1,2,5 N',I,2,3
I . _ _ I _ 4,b...Iu I zonal �9 . S y ~
Stead
I .841 .57 N=1,2,3 J .17 J .30 N,1,2,3
.78 zonal I "% o... Iu I zonal ~ ransienl
I .32"J/ .15 ~-.45~. 1.99
Figure Flow diagram for the kinetic energy exchanges at 200 mb from five day average fine-mesh and parallel coarse-mesh experiments. The wave-wave interactions are separated into a sum of three-wave and two- wave (left), three-wave (right), and interactions with waves N > 15 (below). The region is 7.5~ to 20~
and units are 10 -5 m 2 sec -3.
COARSE MESH 200mb
Wove - wove Wove - zonal Interactions Interactions
,,,35 ~ 84
1.96 ~ .08
i L29
2.91 ~ .04
I,O2
Z .37
l.le
1.30 14 .l~
Z 011(]1 5.87
Figure 9
FINE MESH 200mb
Wave- wave Wave - zonal interactions . I Interactions
( ~O ~ .49
5 .36 ~ .07
4 ( I.B7 ~ .22
5 4 . 3 9 ~ .10
Z.51 6 ,69
2.97 ~ .37
8 .25 3-64, ~ .~6
( . .14 ~ .19 I0
2.56 II �9 ~ .20
.2Z IZ �9 ,Of
.20
zonal
Wave space kinetic energy transfers at 200 mb on day 28 of the coarse- and fine-mesh experiments. Only the three wave-wave interactions are included. The region is 7.5~ to 20~ and units are 10 -s m 2 sec 3.
Hemispheric Simulation of the Asian Summer Monsoon ] ~ 25
energy at this w a v e n u m b e r suggests that it is a p o o r l y tuned resonant m o d e o f the
regime characterist ic o f the 200-rob tropical s u m m e r circulat ion.
d. Easterly waves
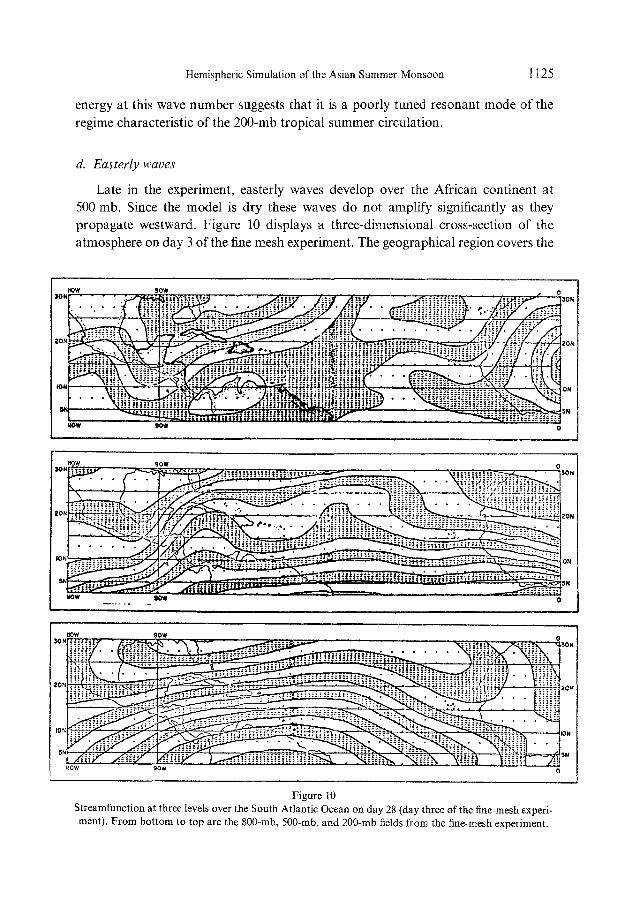
Late in the experiment, easterly waves develop over the African continent at 500 mb. Since the model is dry these waves do not amplify significantly as they propagate westward. Figure 10 displays a three-dimensional cross-section of the atmosphere on day 3 of the fine mesh experiment. The geographical region covers the
ItOW gOW
:- " .,~ii +iiii,! ~'-:-~'~ . . . . . . i,#,i:: .+?-ii::)'. i+i ' -" ..:~!ii:--~-~:--ii. ' ~ . ~ " ' "
�9 -:'-":~' '~'~'~" ' " """:'-'iiiii"i~2i:ii i i i ' - i i ' ! i i ' ' : ' , ~ - - : ~ i ~ . . . . . . " ; ' i ! i i . q ' - " + " ; . . ~ - ~ . . " + . :+;+++~++':+,~, 5+5+. +~,~,I,:: + =.+; ++ p.*.-; ~.+~+ + : : ; , + , " ; + ; . , ; ; .+ ++ ; . ; + , ; ;~ , ; . +,: ; ; ;+,; �9 - ++,~+, ++,
I ' : - - : : : : : +++ ,~ -+ ++ : . . ,:~.+'~ + . t + : . ~ = + . . . . . + : ,1: .." ,11: : + ' : t * . : : : r : $~ ,+ : ~ ; + +: ,I:, ,~- ~ = : ,~ +,. +, ,
, , . . . , . . , , . . , , . . , ++ - ,
UOW BOW 0
IIOW 9 o w 3ot~ - , ; ; :
�9 i ~ i . " ~ " . - . ~ i . V i i ' L + . "++ "++ :" ~ :-+ ~ L-" L~ ~ ~ .++ ~ +~ ~ +~ ++ .+ ++ +- . . . . . " ~ ~ : " - . . : : l . - : . . . . . . . +'"I';::::: . . . . . . . . . . . . . . . . . . . . . . . ~ . . . . . . . . .
~ �9 �9 , . . . . . + . . . . . . + . . . . . . . . ; ~
MOW . . . . . . . . ~
0 SON
2ON
;ON
0 SN
:~o m w . , , . . . . . , sow_ _ �9 . . . . . . . . . . . . . . . . o
. . . 7
Iiiiiil
,,0w ,ow" . . . . . . . . . . . . . . . . . . . ~.-q .V" 0
Figure 10 Streamfunction at three levels over the South Atlantic Ocean on day 28 (day three of the fine-mesh experi- ment). From bot tom to top are the 800-rob, 500-mb, and 200-rob fields f rom the fine-mesh experiment.
1126 Douglas A. Abbot t (Pageoph,
South Atlantic from 0 ~ to 110~ longitude and 2.5~ to 30~ latitude. At 800 mb the waves are not discernible, but the subtropical high lies along the northern boundary with the climatological col near the eastern extremity of the region. Strong easterly trade winds (blowing parallel to the stream-function isopleths) are evident. At 500 mb there are two distinct waves near the center of the region. At 200 mb the western extremity of the Asian, African anticyclone complex is at the extreme right. The mid-oceanic trough extends through the center of the region from upper right to lower left of center. A portion of the Mexican anticyclone is at the upper left and an easterly wave which has passed through the region is at the extreme left. While this atmosphere has developed from a highly artificial initial state, it is characteristic of a
typical summer day. The 500-mb waves are predominantly wave number 11. Systematic wave-to-wave
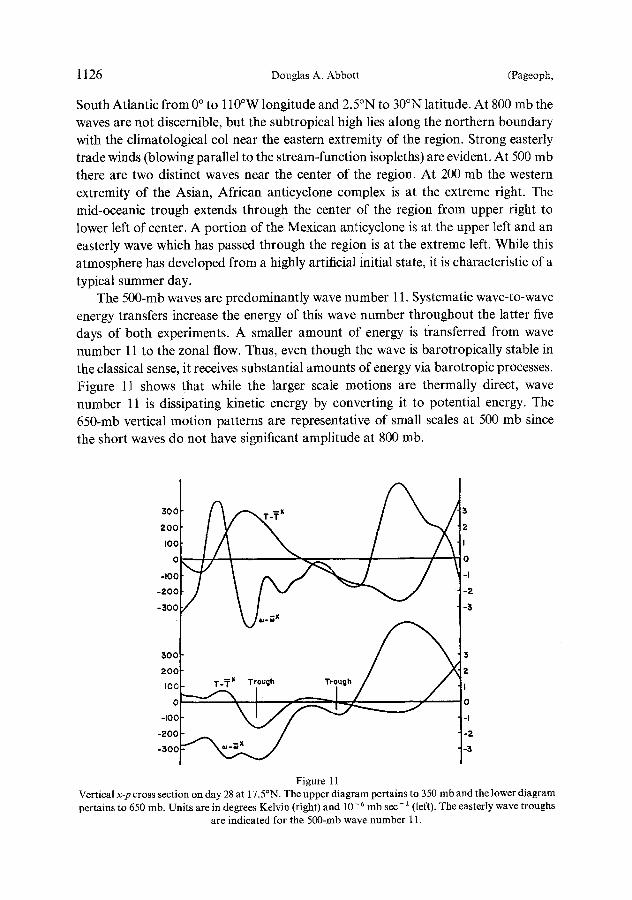
energy transfers increase the energy of this wave number throughout the latter five days of both experiments. A smaller amount of energy is transferred from wave number 11 to the zonal flow. Thus, even though the wave is barotropically stable in the classical sense, it receives substantial amounts of energy via barotropic processes. Figure 11 shows that while the larger scale motions are thermally direct, wave number 11 is dissipating kinetic energy by converting it to potential energy. The 650-mb vertical motion patterns are representative of small scales at 500 mb since the short waves do not have significant amplitude at 800 mb.
300
200
I 0 0
0
- I00
- 2 0 0
-300
30C
200
tO0
0
-I00
-200
-300
3
2
I
0
- I
- 2
3
2
|
0
-I
-2
-3
Figure 11 Vertical x-p cross section on day 28 at 17.5~ The upper diagram pertains to 350 mb and the lower diagram pertains to 650 mb. Units are i n degrees Kelvin (right) and 10-6 mb sec- 1 (left). The easterly wave troughs
are indicated for the 500-mb wave number 11.
Vol. 115, t977) Hemispheric Simulation of the Asian Summer Monsoon | 127
If due account is taken of the lack of vertical resolution it is readily seen that the behavior and structure of these waves are in good agreement with observation (RI~HL, 1954). The waves have a cold core with subsidence west of the trough axis and rising motion to the east. They are barotropically stable and they are converting kinetic energy into potential energy. An examination of the horizontal boundary flux of energy in wave-space (not shown here) reveals that wave number 11 energy is being exported from the 7.5~ to 20~ zonal strip. Thus there is no question of the local barotropic energy source.
4. Summary and conclusions
The large-scale climatology of the upper tropospheric tropical summer is shown to form via the inclusion of east-west heating in a hemispheric general circulation experiment. On the synoptic scale, the model is quasi-geostrophic at high latitudes and quasi-barotropic in the tropics. Time-independent, zonally asymmetric heating is the only important external forcing. Throughout the integration the large scale monsoon- al features maintain their climatological positions (e.g., 200-mb anticyclonic ridges remain over land areas and mid-oceanic troughs remain over the oceans, etc. The initial state contains only planetary scales; however, after the first 10 days, the planetary scales become more cellular, the cells being composed of shorter transient scales. This cellular structure is in essential agreement with the structure of the upper tropical troposphere. An easterly jet forms over the Indian Ocean at about 10~ and periodically extends into Africa. This is also in agreement with observation. Sub- tropical jet streams form on the east sides of the oceanic troughs and baroclinic cyclone tracks are seen in the westerlies near 55~ At 500 mb, a low-level easterly jet develops over Africa and easterly waves begin to propagate westward from the vicinity of Africa. Given the lack of vertical resolution in the present model, this feature also agrees with observation.
The vertical-plane, solenoidal circulation can be inferred from the vertical velocity patterns. Locally strong Hadley cells and intense east-west circulations exist. The east-west circulations are in general agreement with KRISHNAMURTI (1971 a), but the maxima are shifted somewhat eastward. The diabatic heating rate which drives the vertical circulations is in reasonable agreement with observation (BROWN, 1964).
The kinetic energy budget is examined in detail using a Fourier wave-space representation of the energy equations. Only the region from 7.5~ to 20~ is considered. Calculations (not presented) indicate the energetics of higher latitudes agree with SALTZMAN (1970). A 20-day average from the model atmosphere is com- pared to the summer average results of KaNAMITSU et al. (1972). Potential energy budgets are not examined since they are predetermined by the experiment design. The energy calculations produce a number of interesting results.
Parallel coarse and fine mesh integrations indicate the role of barotropic energetics
1 i28 Douglas A. Abbott (Pageopb,
in the known relationship between horizontal resolution and model accuracy. Where- as in the early portion of the parallel experiments the direction and magnitude of the nonlinear energy transfers are in general agreement for wave numbers N < 10. This agreement has deteriorated markedly 48 hours later. Agreement is poor from the beginning for shorter waves even though these waves are well resolved in both models. It appears that one of the major problems in short term predictability is the inability of relatively coarse grids to accurately predict nonlinear barotropic processes. When the wave-to-wave accumulation of energy on a given wave number proceeds in the wrong direction for a sufficiently long time to rival the initial wave-energy predictability is
lost. The planetary-scale asymmetries of diabatic heating have a dominant role in
creating and maintaining the observed tropical and subtropical climatological motion field. Available potential energy is created on the planetary scale. Most of this energy is baroclinically converted to kinetic energy thus maintaining the energy of the atmosphere's very long waves. This planetary-scale energy is subsequently transferred barotropically to both the zonal flow and to higher wave numbers. These transfers are the primary energy source for the observed zonal flow and for synoptic-scale eddy
motions. The barotropic kinetic energy transfers from planetary-scale motions to smaller
scales provide an alternate view of the nature of barotropic processes. Kuo (1949) shows that a necessary condition for waves to barotropically amplify at the expense of the energy of the zonal flow is the existence of a critical point in the north-south absolute vorticity distribution. This study has shown that waves can amplify baro- tropically in the absence of zonal instability. The wave-to-wave interactions are an important energy source for preferred wavelengths. The preferred wavelengths (wave numbers 7 and 8 at 200 mb and 11 at 500 rob) correspond to observed spectral peaks in the energy transfers and in the atmospheric wave energy. This mechanism appears to be the energy source for the thermally indirect, barotropically stable waves in the low-level easterlies. The source is not apparent when all waves are summed as the wave-to-wave exchange becomes identically zero. The bulk of the energy comes from the planetary scale. The planetary scale is in turn maintained by the thermally forced monsoonal circulations. Investigation of heat sources and their distribution is a goal of MONEX. Perhaps an understanding of the redistribution of potential energy in
wave-space will be forthcoming.
Acknowledgements
The author is indebted to Prof. T. N. Krishnamurti for his advice and guidance and to Dr. M. Kanamitsu for the computer program which calculates wave-to-wave energy transfers. Financial support for this work was received at Florida State University by the Atmospheric Science Section of the National Science Foundation,
Vol. 115, 1 9 7 7 ) Hemispheric Simulation of the Asian Summer Monsoon 1 ! 29
Grant GA 17822; the Department of Defense THEMIS Contract No. DAAB-07- 69-C4)062; the U.S. Naval Oceanographic Office Contract No. N62306-70~- 0451 ; and the Air Force Institute of Technology. Computer support was provided by the National Center for Atmospheric Research (sponsored by National Science Foundation).
REFERENCES
ABBOTT, D. A. (1973), Scale interactions o f forced quasi-stationary planetary waves at low latitudes, PhD Dissertation, Dept. of Meteorology, Florida State University, 155 pp.
ARAKAWA, A. (1966), Computational design for long term numerical integration of fluid motion, Computa- tional Physics, 1, 119-145.
ASPLIDEN, C. I., DEAN, A. G. and LANDERS, H. (1966), Satellite study, tropicalNorth Atlantic, 1968, Report No. 66-4, Florida State University.
BJERKNES, J. (1969), Atmospheric teleconnectionsfrom the equatorial Pacific, Mon. Wea. Rev. 97, 163-172. BROWN, J. A. (1964), A diagnostic study of tropospheric diabatic heating and the generation of available
potential energy, Tellus 16, 371-388. BURGER, A. P. (1958), Scale considerations of planetary motions of the atmosphere, Tellus 10, 195~05. BURPEE, R. W. (1972), The origin and structure of easterly waves in the lower troposphere of North/{fi'iea,
J. Atmos. Sci. 29, 77-90. CHARNEY, J. G. (1948), On the scale of atmospheric motions, Geophys. Publ. 17, 17 pp. CrtARNEY, J. G. (1963), A note on large-scale motions in the tropics, J. Atmos. Sci. 20, 607-609. CHARNEY, J. G. and ELIASSEN, A. (1949), A numerical method for predicting the perturbations of the middle
latitude westerlies, Tellus 1, 38-54. COLTON, D. E. (1973), Barotropic scale interactions in the tropical upper troposphere during the northern
summer, 3. Atmos. Sci. 30, t287 t302. FLO~, H. (1968), Contributions to a meteorology of the Tibetan highlands, Atmos. Sci. Paper No. 130,
Colorado State Univ., Fort Collins. HOLTON, J. R. and COLTON, D. E. (1972), A diagnostic study of the vorticity balance at 200 mb in the tropics
during the northern summer, J. Atmos. Sci. 29, 1124 1128. KANAMITSU, M., KRISHNAMURTI, T. N. and DEPRADINE, C. (1972), On scale interaction in the tropics during
northern summer, J. Atmos. Sci. 29, 698-706. K~DSON, J. W., VINCENT, D. G. and NEWELL, R. E. (1969), Observational studies of general circulation of the
tropics." Long term mean values, Quart. J. Roy. Meteor. Soc. 95, 258-287. KOTESWARtJM, P. (1958), The easterly jet stream in the tropics, Tellus 10, 43-57. KRISHNAMURTI, T~ N. (1971 a), Tropical east-west circulations during the northern summer, J. Atmos. Sci.
28, 1342-1347. KR~SrlNAMtrRTI, T. N. (1971 b), Observational studies of the tropical upper tropospheric motion field during
the Northern Hemisphere summer, J. Appl. Meteor. 10, 1066-t096. KRISHNAMUI1TI, T. N. and HAWKINS, R. S. (1970), Mid-tropospheric cyclones of the southwest monsoon, J.
Appl. Meteor. 9, 440M58. KRISHNAMURTI, T. N. and RODGERS, E. B. (1970), 200-mb wind field June, July, and August, 1967, Report
No. 76-2, Dept. of Meteorology, Florida State University, 114 pp. Kuo, H. L. (1949), Dynamic instability of two-dimensional non-divergent flow in a barotropic atmosphere, J.
Meteor. 6, 105-122. LAI-IIFF, L. N. (1971), A numerical study of a subtropical marine stable layer, PhD Dissertation, Dept. of
Meteorology, Florida State University. LORENZ, E. N. (1955), Available potential energy and the maintenance of the general circulation, Tellus 7,
157-167. LORENZ, E. N. (1972), Barotropic instability of Rossby wave motions, J. Atmos. Sci. 29, 258-264. MAK, M. K. (1969), Laterally driven stochastic motions in the tropics, J. Atmos. Sci. 29, 41-63.
1130 Douglas A. Abbott
MANABE, S. (1969), The atmospheric circulation and the hydrology of the earth's surface, Mon. Wea. Rev. 97, 739-774.
MANABE, S., SMAGORINSKY, J., LEITH, J. L. Jr., and STONE, H. M. (1970), Simulated climatology ofageneral circulation model with a hydrologic cycle: IIL Effects of increased horizontal computational resolution, Mon. Wea. Rev. 98, 175-212.
MATSUNO, T. (1966), Numerical integrations of the primitive equations by a simulated backward difference method, J. Meteor. Soc. Japan 44, 76-84.
OORT, A. H. (1964), On estimates of the atmospheric energy cycle, Mon. Wea. Rev. 92, 483493. PADRO, J. (1973), A spectral model for CISK-barotropic energy sources for tropical waves, Quart. J. Roy.
Meteor. Soc. 99, 468~479. PALMER, C. E., Tropical meteorology, in Compendium of Meteorology (Am. Met. Soc. 1951), pp. 859-880. PALMER, C. E. (1952), Tropical meteorology, Quart. J. Roy. Meteor. Soc. 82, 123-164. RAMAGE, C. S. (1959), Hurricane development, J. Meteor. 16, 227-237. RrEHL, H. (1945), Waves in the easterlies and the polar front in the tropics, Dept. of Meteorology, Univ. of
Chicago Misc. Rept. 17, 79 pp. RIEI-IL, H. (1948), On the formation of typhoons, J. Meteor. 5, 247-264. RIEHL, H., Tropical Meteorology, McGraw-Hill (New York, 1954), 392 pp. SALTZMAN, B. (1957), Equations governing the energetics of the large scales of atmospheric turbulence in the
domain of wave number, J. Meteor. 14, 513 523. SALTZMAN, B. (1970), Large-scale atmospheric energetics in the wave-number domain, Rev. Geophys.
Space Phys. 8, 289-302. SALTZMAN~ B. and SANKAR RAO, M. (1964), Final Report. General Circulation Research, U.S.W.B.
Contract No. CWB-10763. S~',AGORrNSKV, J. (1953), The dynamical influence of large scale heat sources and sinks on the quasi-stationary
mean motions of the atmosphere, Quart. J. Roy. Meteor. Soc. 79, 342-366. STRUNING, J. O. and FLOHY, H. (1969), Investigations on the atmosphere circulation about Africa, Meteorolo-
gisches Institut der Universitat Bonn, 55 pp. (Heft 10). WALLACE, J. M. (1970), Time-longitudinal sections of tropical cloudiness (Dec. 1966-Nov. 1967). Dept. of
Atmos. Sci., Univ. of Washington, ESSA, National Satellite Center, ESSA Technical Report N E s c 56. WELLCK, R. E., KASAnARA, A., WASI4rNGTON, W. M. and DESANTO, G. (1971), Effect of horizontal resolution
in a finite-differenee model of the general circulation, Mon. Wea. Rev. 99, 673-683. YANG, C. H. (1967), Nonlinear aspects of the large-scale motion in the atmosphere, Sci. Report No. 08759-1,
Dept. of Meteorology and Oceanography, Univ. of Michigan, Ann Arbor.
(Received 15th June 1977)