Embed Size (px)
Citation preview
Hemodialysis Adequacy GoalHemodialysis Adequacy Goal
≥95% f h di l i ti t• ≥95% of hemodialysis patient population achieve Kt/V Daugirdas II ≥1 2≥1.2
• ≥95% of hemodialysis patient population achieve URR ≥65%

National CPM Data Collection % Patients with Kt/V ≥ 1.2
4th Quarter 2007100
70
80
90
40
50
60
& p
atie
nts
20
30
40
17 5 2 10 11 13 15 US 3 6 7 12 18 1 4 8 9 14 16Kt/V 87 89 90 90 90 91 91 91 92 92 92 92 92 93 93 93 93 93 93
0
10

Percentage of HD Patients with Reported Kt/V >= 1 2
90%100%
Percentage of HD Patients with Reported Kt/V >= 1.2 by State and Network 9/10 for Selected Collection Periods
60%70%80%90%
ient
s
20%30%40%50%
% p
at
4Q96 4Q98 4Q00 4Q02 4Q03 4Q05 4Q06 4Q07 4Q08IL 66% 78% 82% 88% 91% 92% 93% 93% 93%
0%10%
% % % % % % % % %IN 76% 86% 89% 92% 93% 95% 94% 94% 94%KY 64% 78% 86% 91% 89% 93% 94% 94% 94%OH 71% 84% 87% 90% 91% 92% 93% 94% 94%Net 9/10 70% 82% 86% 90% 91% 93% 93% 94% 94%

National CPM Data Collection % Patients with URR ≥ 65%
4th Quarter 2007
100
70
80
90
50
60
70
patie
nts
20
30
40%
17 5 10 2 7 18 3 9 11 13 15 US 1 4 6 8 12 14 16URR 83 85 87 88 88 88 89 89 89 89 89 89 90 90 90 90 90 90 90
0
10
U 83 85 87 88 88 88 89 89 89 89 89 89 90 90 90 90 90 90 90

Anemia Management GoalAnemia Management GoalGoal has been replaced by –p y
“A Statement on the Use of ESA in CKD Patients Requiring Dialysis”Patients Requiring Dialysis
Developed by the Medical Review Board
http://www.therenalnetwork.org/qi/anemiaMRB6.07.php
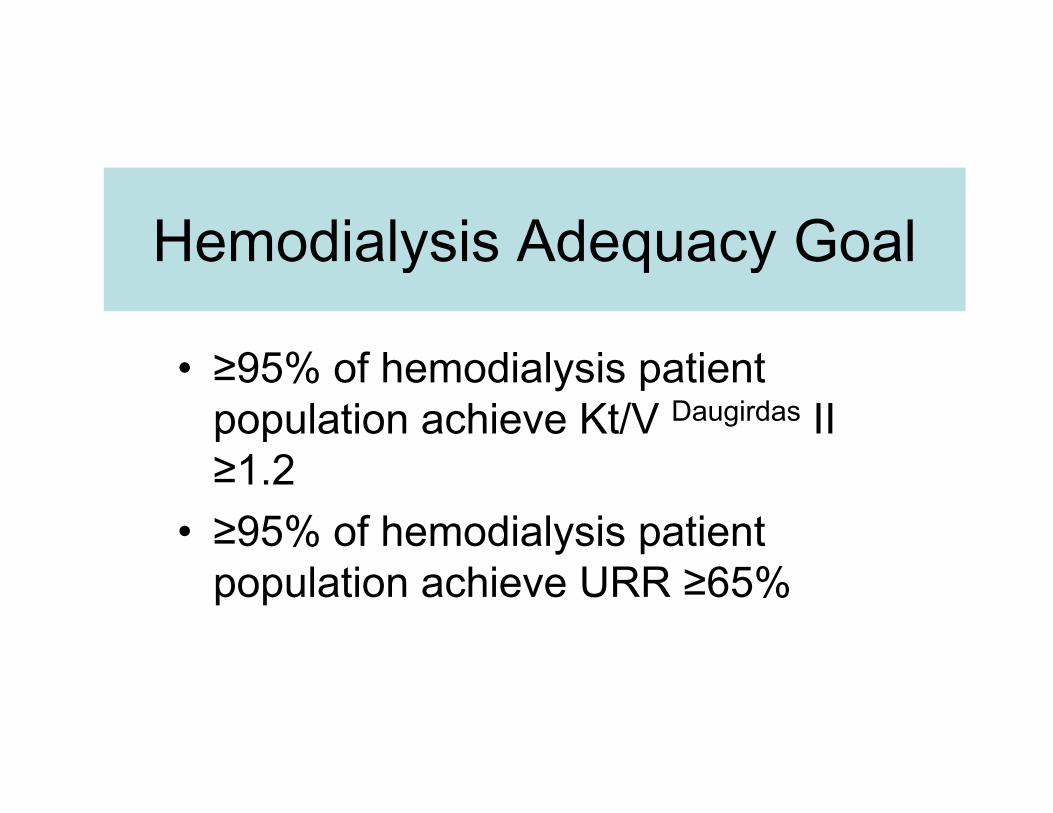
National CPM Data Collection% Pts with mean Hgb ≥ 11g/dl% ts t ea gb g/d
4th Quarter 2007
100
70
80
90
100
40
50
60
70
% p
atie
nts
10
20
30
40%
2 4 8 9 13 5 6 10 11 12 16 US 3 7 15 17 18 1 14Hgb ≥ 11 g/dL 77 80 80 80 80 81 81 81 82 82 82 82 83 83 83 84 84 85 86
0
10
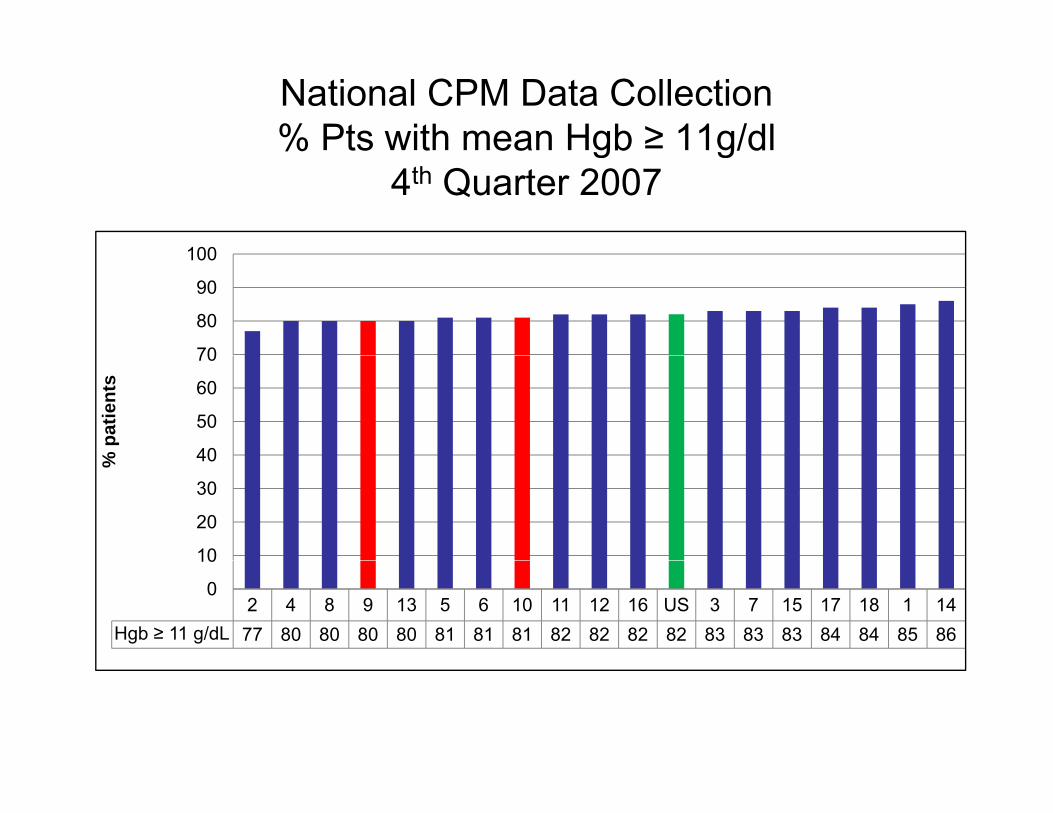
National CPM Data Collection% Pts with mean Hgb 10-12% ts t ea gb 0
4th Quarter 2007
50
60
30
40
patie
nts
10
20
% p
6 13 7 11 8 9 12 5 14 US 10 18 3 15 16 17 1 2 4Hgb 10-12 45 45 46 46 48 48 48 49 50 50 51 51 52 52 53 53 54 54 56
0
gg/dL^^ 45 45 46 46 48 48 48 49 50 50 51 51 52 52 53 53 54 54 56

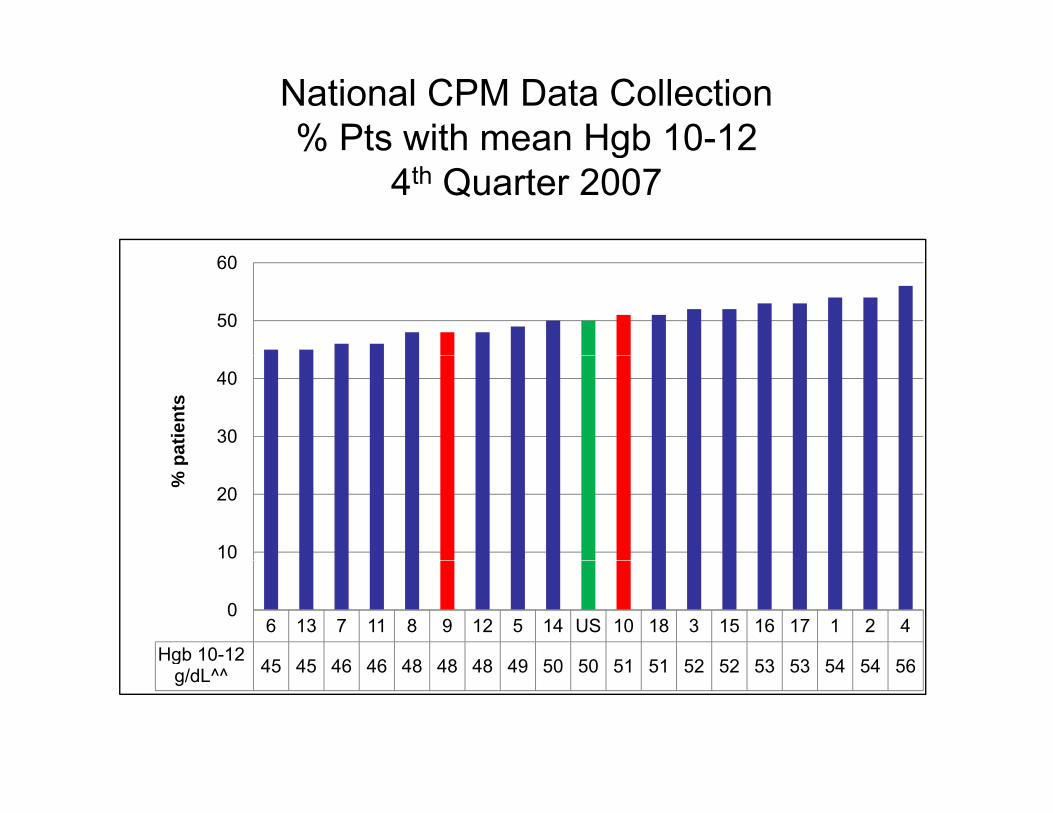
National CPM Data Collection% Pts with mean Hgb <10g/dl% ts t ea gb 0g/d
4th Quarter 20079
7
8
4
5
6
% p
atie
nts
1
2
3
17 1 15 18 3 4 6 7 10 14 16 US 5 12 13 8 9 11 2Hgb < 10
g/dL 3 4 4 4 5 5 5 5 5 5 5 5 6 6 6 7 7 7 8
0
1
g/dL

Percentage of HD Patients with HGB>= 11 gm/dL by State and Network 9/10 for Selected Collection Periods
90%100%
50%60%70%80%90%
atie
nts
10%20%30%40%50%
% p
a
4Q98 4Q00 4Q02 4Q04 4Q05 4Q06 4Q07 4Q08
IL 55% 73% 79% 83% 81% 82% 80% 76%
0%
IN 61% 75% 81% 84% 81% 82% 80% 74%KY 57% 73% 79% 82% 81% 83% 80% 74%OH 59% 70% 77% 83% 83% 83% 80% 75%Net 9/10 58% 72% 79% 83% 82% 83% 80% 75%

Percentage of PD Patients with HGB >= 11 gm/dL by State and Network 9/10 for Selected Collection Periods
90%100%
50%60%70%80%
ient
s
10%20%30%40%50%
% p
at
S-D 99 S-D 01 S-D 02 O-D 04 O-D 05 O-D 06 O-D 07 O-D 08IL 65% 71% 76% 77% 75% 77% 73% 72%
0%10%
IN 70% 78% 79% 78% 78% 77% 77% 70%KY 68% 76% 77% 84% 78% 83% 76% 73%OH 68% 71% 74% 79% 77% 78% 76% 74%Net 9/10 68% 73% 76% 79% 77% 78% 75% 72%

National CPM Data Collection% Pts with mean TSAT ≥ 20%% ts t ea S 0%
4th Quarter 200786
82
84
86
76
78
80
patie
nts
70
72
74% p
16 4 12 17 2 8 15 9 10 US 1 11 14 3 6 13 5 7 1866
68
70
TSAT ≥ 20% 73 75 76 77 78 78 78 79 79 80 81 81 81 82 83 83 84 84 84
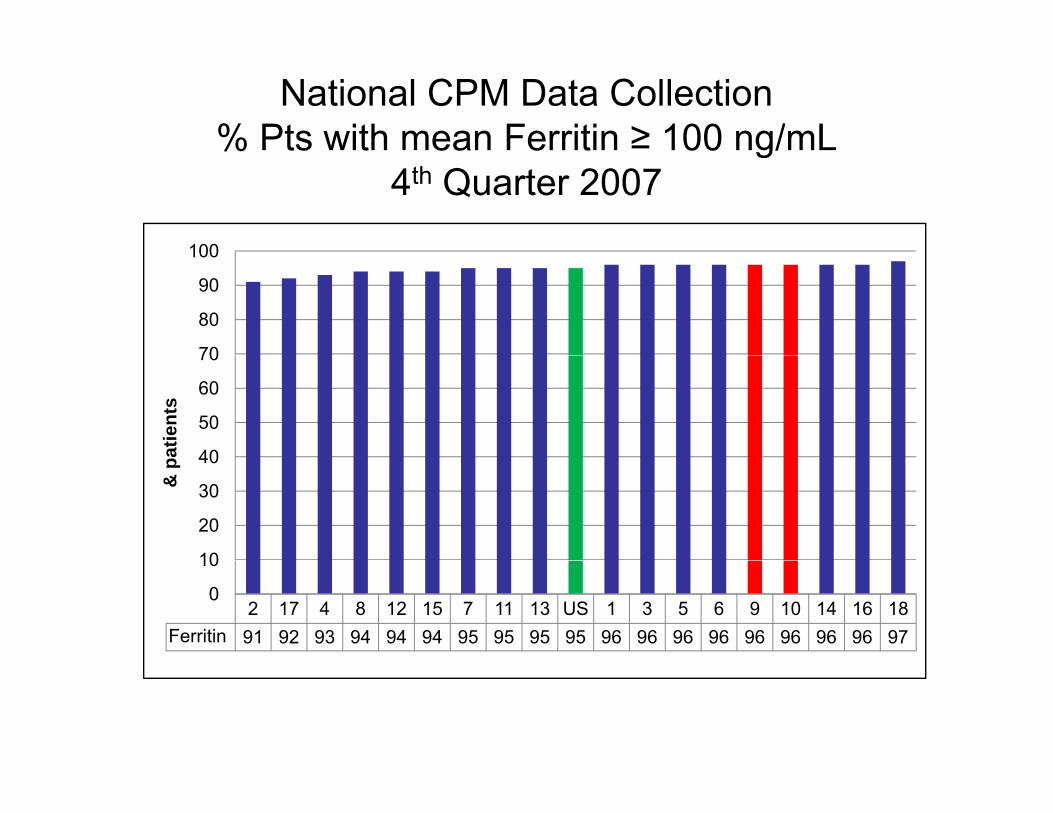
National CPM Data Collection% Pts with mean Ferritin ≥ 100 ng/mL% ts t ea e t 00 g/
4th Quarter 2007
100
70
80
90
100
40
50
60
70
atie
nts
10
20
30
40
& p
2 17 4 8 12 15 7 11 13 US 1 3 5 6 9 10 14 16 18Ferritin 91 92 93 94 94 94 95 95 95 95 96 96 96 96 96 96 96 96 97
0
10

Nutrition GoalNutrition Goal• All patients will have serum p
albumin measured and evaluated each month.
• A stabilized serum albumin equal to or greater than the lower limit ofto or greater than the lower limit of the normal range (approximately 3.5g/dl for bromcresol green)
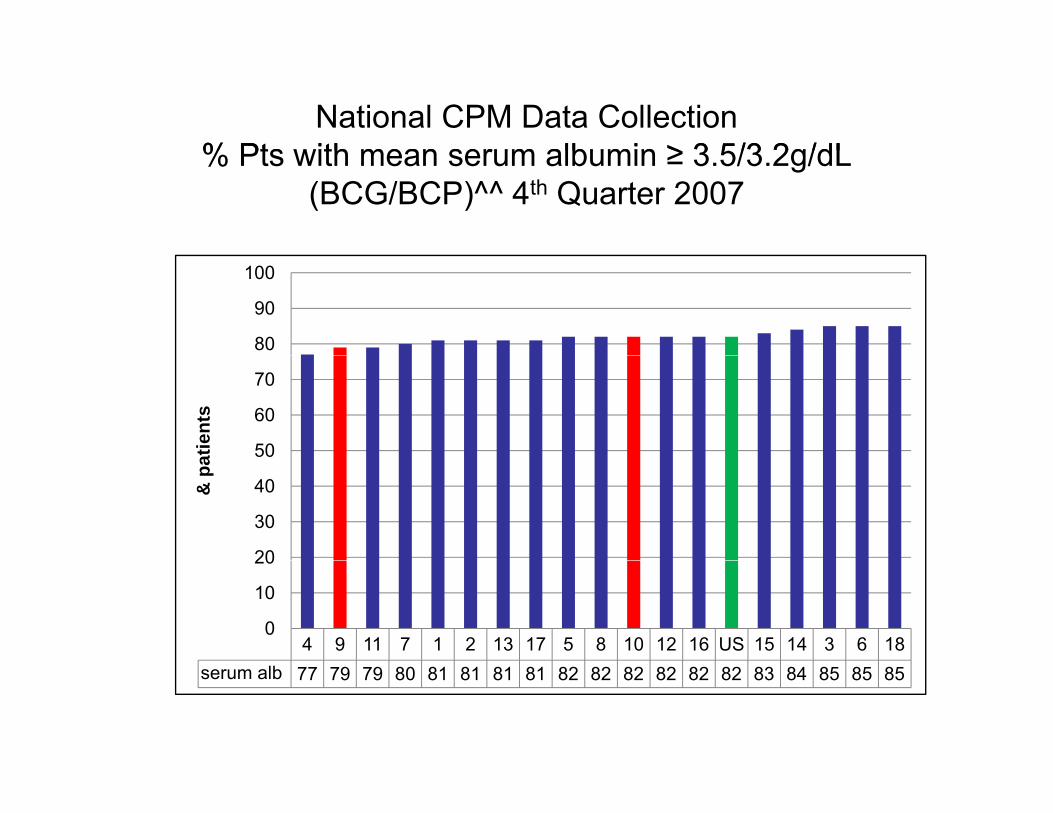
National CPM Data Collection% Pts with mean serum albumin ≥ 3 5/3 2g/dL% Pts with mean serum albumin ≥ 3.5/3.2g/dL
(BCG/BCP)^^ 4th Quarter 2007
80
90
100
50
60
70
atie
nts
20
30
40& p
a
4 9 11 7 1 2 13 17 5 8 10 12 16 US 15 14 3 6 180
10
20
serum alb 77 79 79 80 81 81 81 81 82 82 82 82 82 82 83 84 85 85 85

Percentage of HD Patients with Average Albumin >= 3.5 gm/dL by State and Network for Selected Collection Periods
80%
90%
100%
50%
60%
70%
atie
nts
20%
30%
40%% p
a
4Q96 4Q98 4Q00 4Q02 4Q04 4Q05 4Q06 4Q07 4Q08
IL 76% 82% 82% 83% 85% 81% 81% 81% 81%
0%
10%
% % % % % % % % %IN 82% 83% 78% 82% 80% 78% 78% 79% 78%KY 81% 80% 77% 80% 80% 75% 75% 79% 78%OH 79% 79% 77% 80% 83% 78% 79% 80% 79%N t9/10 9% 81% 9% 81% 83% 9% 9% 80% 9%Net 9/10 79% 81% 79% 81% 83% 79% 79% 80% 79%
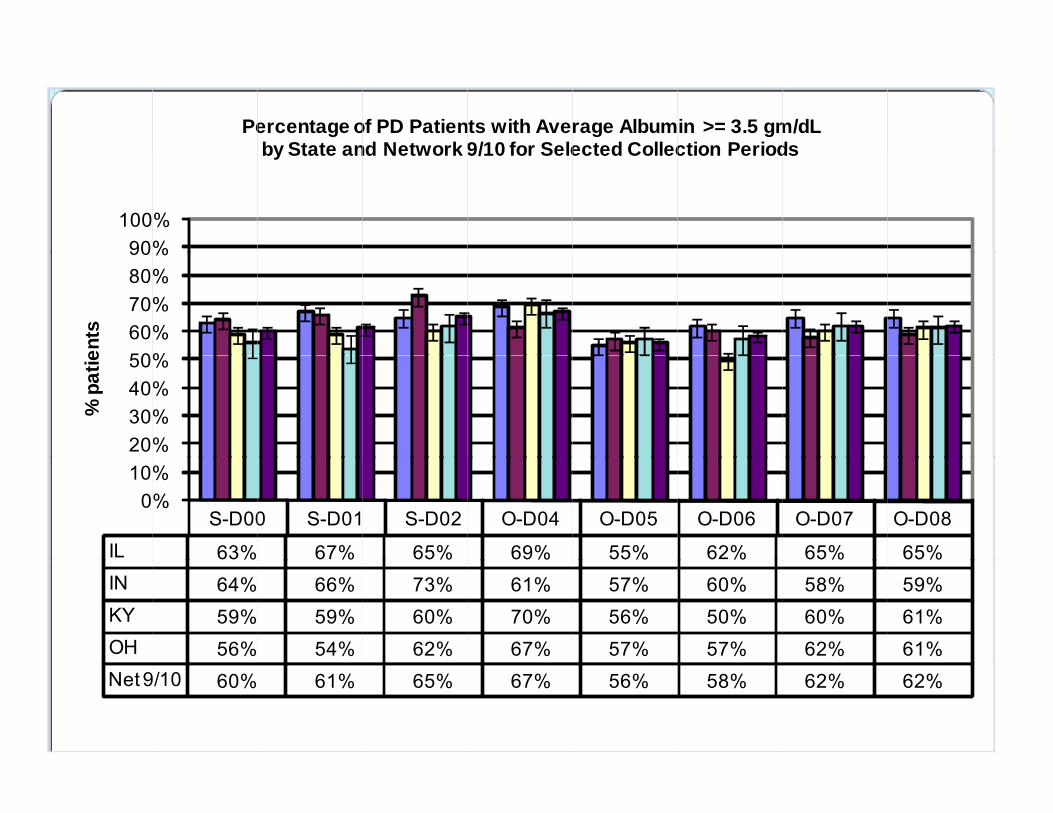
Percentage of PD Patients with Average Albumin >= 3.5 gm/dL by State and Network 9/10 for Selected Collection Periods
90%100%
by State and Network 9/10 for Selected Collection Periods
50%60%70%80%90%
ents
20%30%40%50%
% p
atie
S-D00 S-D01 S-D02 O-D04 O-D05 O-D06 O-D07 O-D08IL 63% 67% 65% 69% 55% 62% 65% 65%
0%10%
IN 64% 66% 73% 61% 57% 60% 58% 59%KY 59% 59% 60% 70% 56% 50% 60% 61%OH 56% 54% 62% 67% 57% 57% 62% 61%Net 9/10 60% 61% 65% 67% 56% 58% 62% 62%

Mineral Metabolism Goals
• All patients measured for calcium &• All patients measured for calcium & phosphorus every month≥ 75% f ti t ill h C /PO• ≥ 75% of patients will have a Ca/PO4product of < 55 mg2/dL2
• All patients will be measured for “intact” PTH quarterly
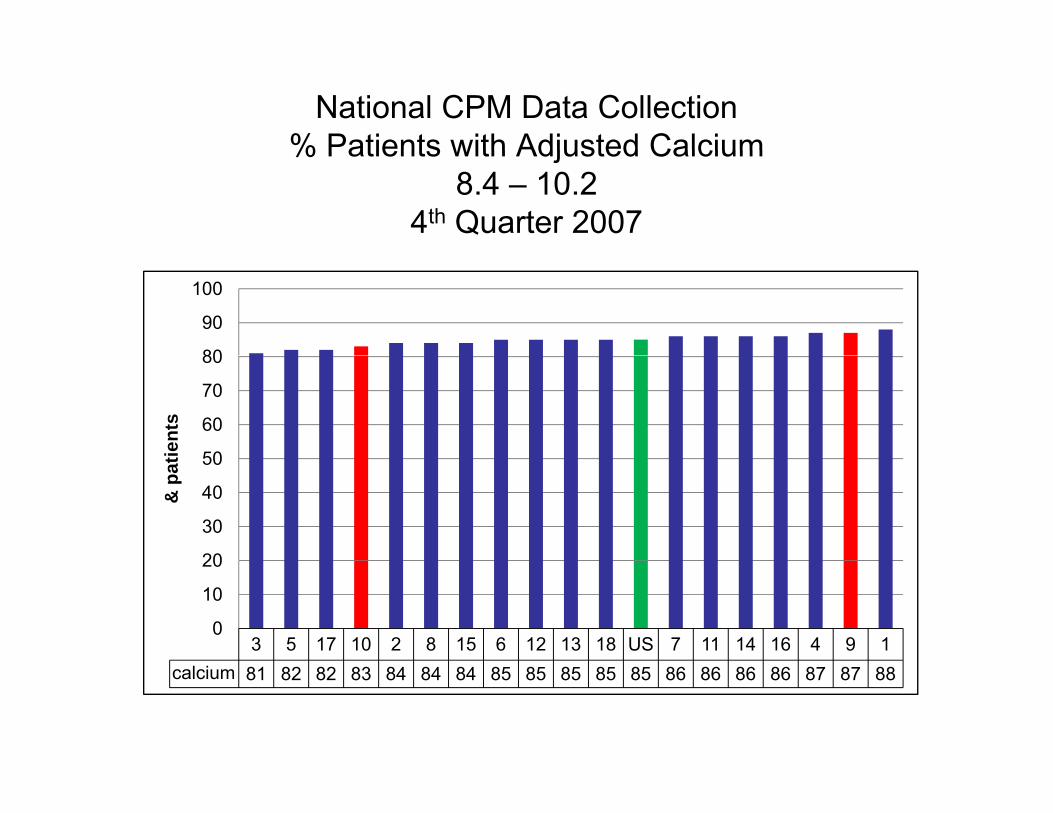
National CPM Data Collection % Patients with Adjusted Calcium% Patients with Adjusted Calcium
8.4 – 10.24th Quarter 2007
80
90
100
50
60
70
80
tient
s
20
30
40
50
& p
at
3 5 17 10 2 8 15 6 12 13 18 US 7 11 14 16 4 9 10
10
20
calcium 81 82 82 83 84 84 84 85 85 85 85 85 86 86 86 86 87 87 88

National CPM Data Collection % Patients with Mean Phosphorus p
3.5 – 5.54th Quarter 2007
60
70
40
50
ents
10
20
30
% p
atie
6 7 16 5 8 13 17 9 11 US 3 15 10 12 1 18 2 4 14phosphorus 45 48 49 50 51 51 51 52 52 52 53 53 54 54 55 55 56 57 58
0
10
p p 45 48 49 50 51 51 51 52 52 52 53 53 54 54 55 55 56 57 58
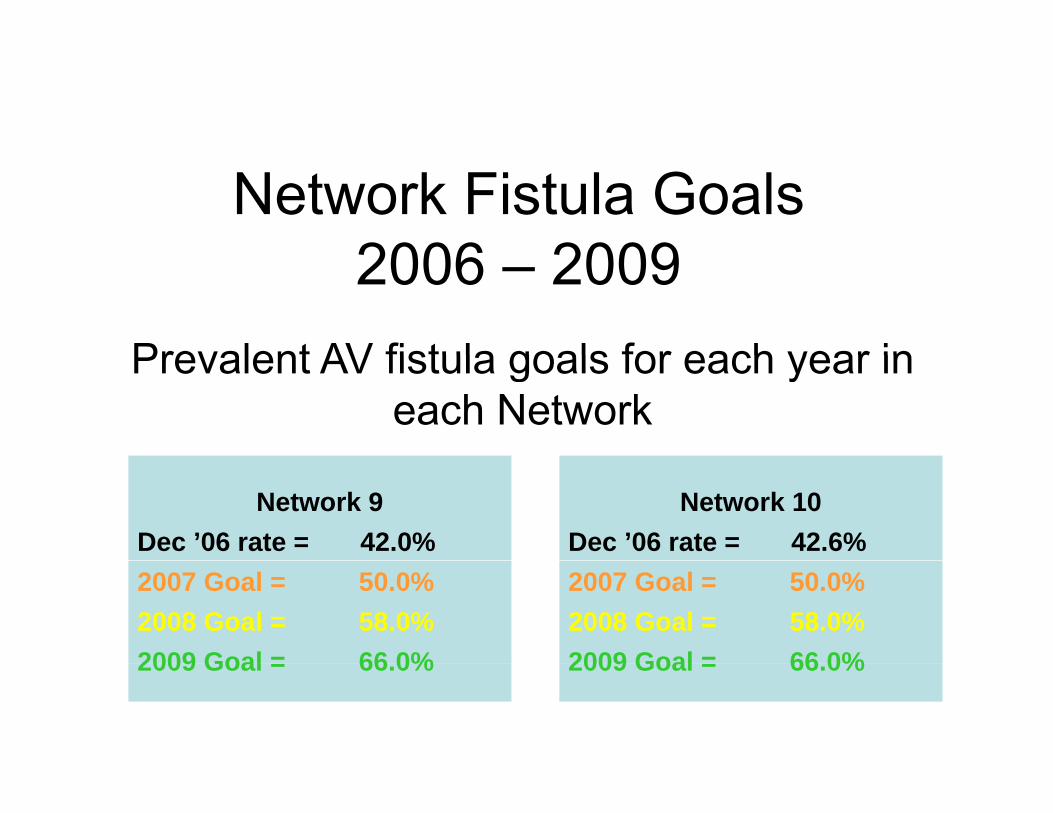
Network Fistula Goals2006 20092006 – 2009
Prevalent AV fistula goals for each year inPrevalent AV fistula goals for each year in each Network
Network 9Dec ’06 rate = 42.0%
Network 10Dec ’06 rate = 42.6%
2007 Goal = 50.0%2008 Goal = 58.0%2009 Goal = 66 0%
2007 Goal = 50.0%2008 Goal = 58.0%2009 Goal = 66 0%2009 Goal = 66.0% 2009 Goal = 66.0%
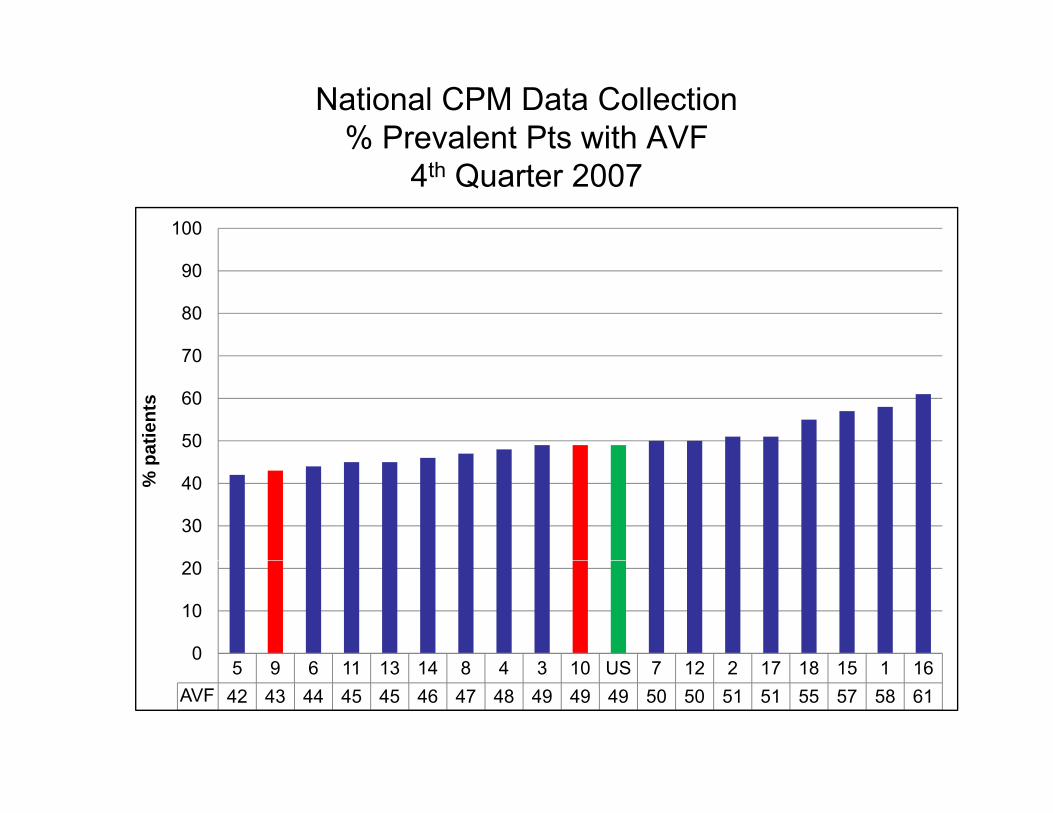
National CPM Data Collection% Prevalent Pts with AVF
4th Quarter 2007100
70
80
90
50
60
70
patie
nts
30
40% p
5 9 6 11 13 14 8 4 3 10 US 7 12 2 17 18 15 1 160
10
20
5 9 6 11 13 14 8 4 3 10 US 7 12 2 17 18 15 1 16AVF 42 43 44 45 45 46 47 48 49 49 49 50 50 51 51 55 57 58 61

National CPM Data Collection% Prevalent Pts with Catheter
4th Quarter 2007
50
35
40
45
50
25
30
35
patie
nts
10
15
20%
14 18 16 1 6 8 15 17 US 2 3 4 11 12 13 7 9 10 5catheter 21 21 23 24 24 25 27 27 27 28 28 28 31 31 31 32 32 32 34
0
5
cat ete 21 21 23 24 24 25 27 27 27 28 28 28 31 31 31 32 32 32 34

National CPM Data Collection% Prevalent Pts with Catheter > 90 Daysy
4th Quarter 2007
50
35
40
45
20
25
30
35
% p
atie
nts
10
15
20%
14 16 17 18 1 6 8 4 US 2 3 9 12 15 7 10 11 13 5catheter 17 17 17 17 18 19 19 21 21 23 23 23 23 23 24 25 25 25 28
0
5
8 9 9 3 3 3 3 3 5 5 5 8
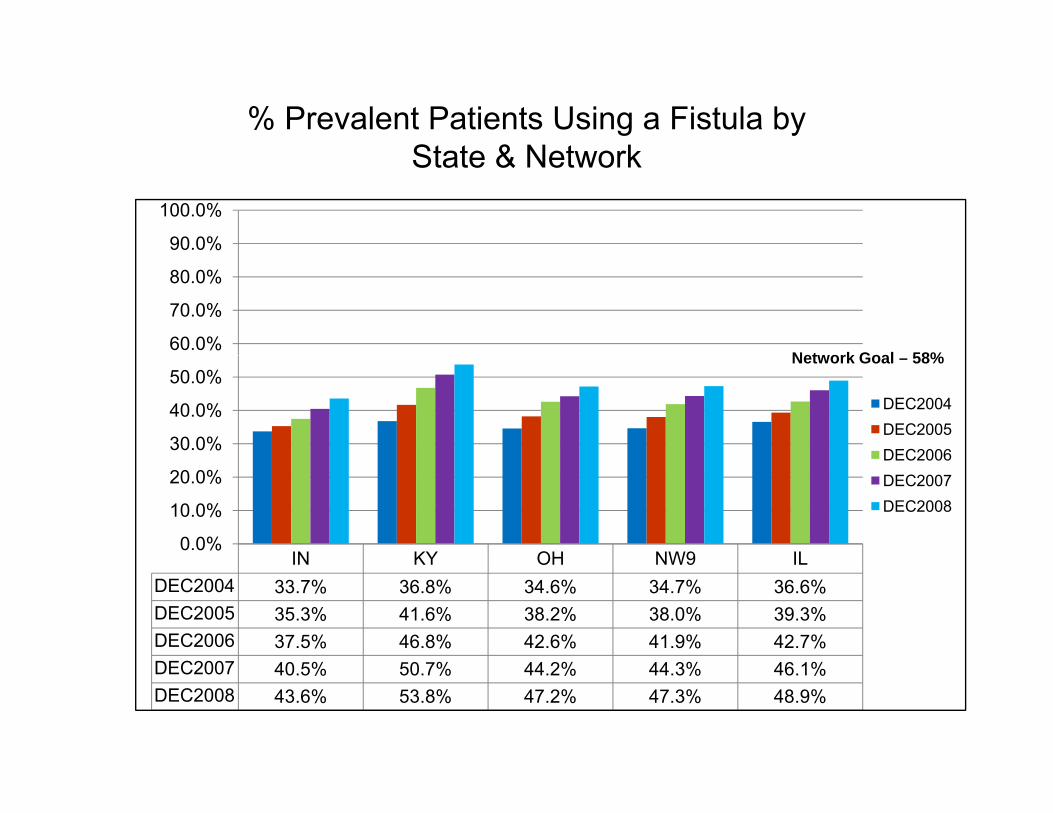
% Prevalent Patients Using a Fistula by St t & N t kState & Network
90.0%
100.0%
60.0%
70.0%
80.0%
Network Goal 58%
30.0%
40.0%
50.0%DEC2004DEC2005DEC2006
Network Goal – 58%
IN KY OH NW9 IL0.0%
10.0%
20.0%DEC2006DEC2007DEC2008
IN KY OH NW9 ILDEC2004 33.7% 36.8% 34.6% 34.7% 36.6%DEC2005 35.3% 41.6% 38.2% 38.0% 39.3%DEC2006 37.5% 46.8% 42.6% 41.9% 42.7%DEC2007 40 5% 50 7% 44 2% 44 3% 46 1%DEC2007 40.5% 50.7% 44.2% 44.3% 46.1%DEC2008 43.6% 53.8% 47.2% 47.3% 48.9%

% Prevalent Patients Using a Catheterb St t & N t kby State & Network
50.0%
30 0%35.0%40.0%45.0%
15.0%20.0%25.0%30.0%
DEC2004DEC2005DEC2006
IN KY OH NW9 IL0.0%5.0%
10.0%DEC2006DEC2007DEC2008
DEC2004 32.1% 30.8% 34.7% 33.3% 30.5%DEC2005 34.5% 29.1% 35.0% 33.9% 31.9%DEC2006 35.7% 27.3% 32.2% 32.4% 31.9%DEC2007 34 3% 26 6% 32 1% 31 7% 31 7%DEC2007 34.3% 26.6% 32.1% 31.7% 31.7%DEC2008 33.7% 24.7% 29.9% 30.1% 30.7%