Embed Size (px)
Citation preview
High Quality Growth At Sensible Prices
FOR INSTITUTIONAL INVESTOR USE ONLY / NOT FOR PUBLIC VIEWING OR DISTRIBUTION
Emerging Markets Equity
November 3, 2011
Henderson-WessendorfFoundation
FOR INSTITUTIONAL INVESTOR USE ONLY / NOT FOR PUBLIC VIEWING OR DISTRIBUTION
Representing Vontobel Asset Management, Inc.
Business Address:
Vontobel Asset Management, Inc.
1540 Broadway, 38th Floor
New York, NY 10036
(212) 415-7000
www.vusa.com
Page 2
Amit Mukadam, DirectorInstitutional Clients – North America

FOR INSTITUTIONAL INVESTOR USE ONLY / NOT FOR PUBLIC VIEWING OR DISTRIBUTION
Content
Page 3
Part I: Firm Overview
Part II: Investment Approach and Team
Part III: Portfolio Characteristics
Part IV: Performance and Competitive Standing
Part V: Appendix

FOR INSTITUTIONAL INVESTOR USE ONLY / NOT FOR PUBLIC VIEWING OR DISTRIBUTION
What Sets Us Apart?
Page 4
Organizational stability and independence Strong investment culture and incentives designed for
long term talent retention
Focused Focused on long-only global equity investing
Bottom-up, fundamental approach focused on high
quality growth at sensible prices
Seasoned 22 investment professionals averaging 18 years industry
experience
Key players with combined 100 years at Vontobel
Manager tenure (since 1994)
Disciplined Performance consistent with philosophy and process
Alpha generated from bottom-up fundamental research
Key
Ben
efit
s
FOR INSTITUTIONAL INVESTOR USE ONLY / NOT FOR PUBLIC VIEWING OR DISTRIBUTION
About Vontobel
Page 5
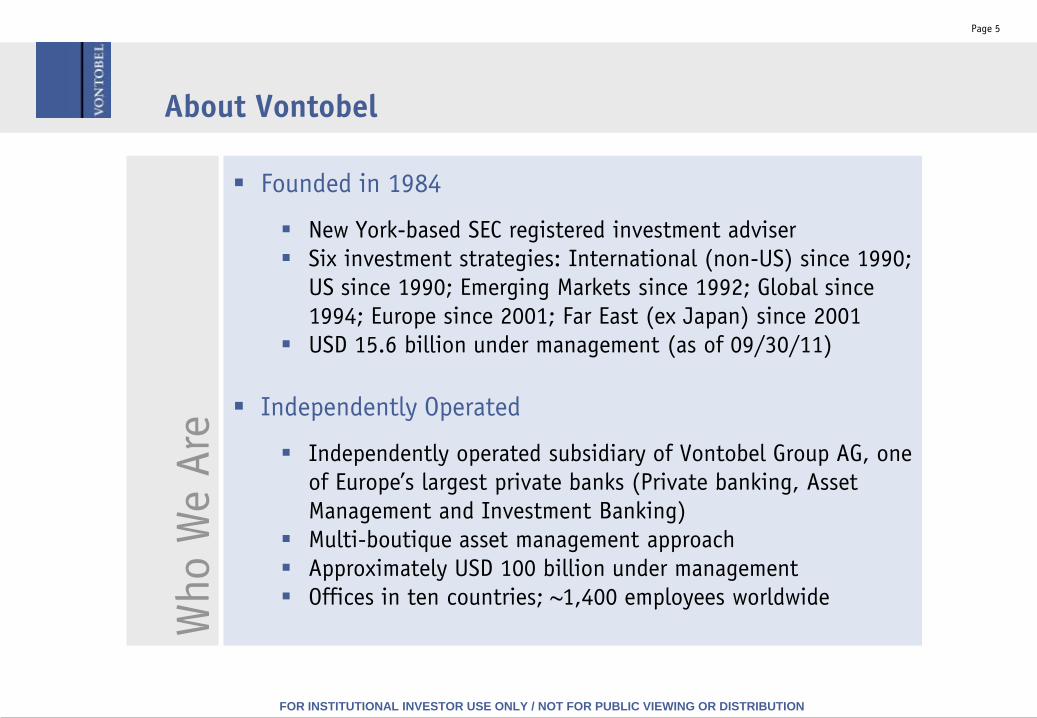
Founded in 1984
New York-based SEC registered investment adviser
Six investment strategies: International (non-US) since 1990;
US since 1990; Emerging Markets since 1992; Global since
1994; Europe since 2001; Far East (ex Japan) since 2001
USD 15.6 billion under management (as of 09/30/11)
Independently Operated
Independently operated subsidiary of Vontobel Group AG, one
of Europe’s largest private banks (Private banking, Asset
Management and Investment Banking)
Multi-boutique asset management approach
Approximately USD 100 billion under management
Offices in ten countries; ~1,400 employees worldwide
Who W
e Are
FOR INSTITUTIONAL INVESTOR USE ONLY / NOT FOR PUBLIC VIEWING OR DISTRIBUTION
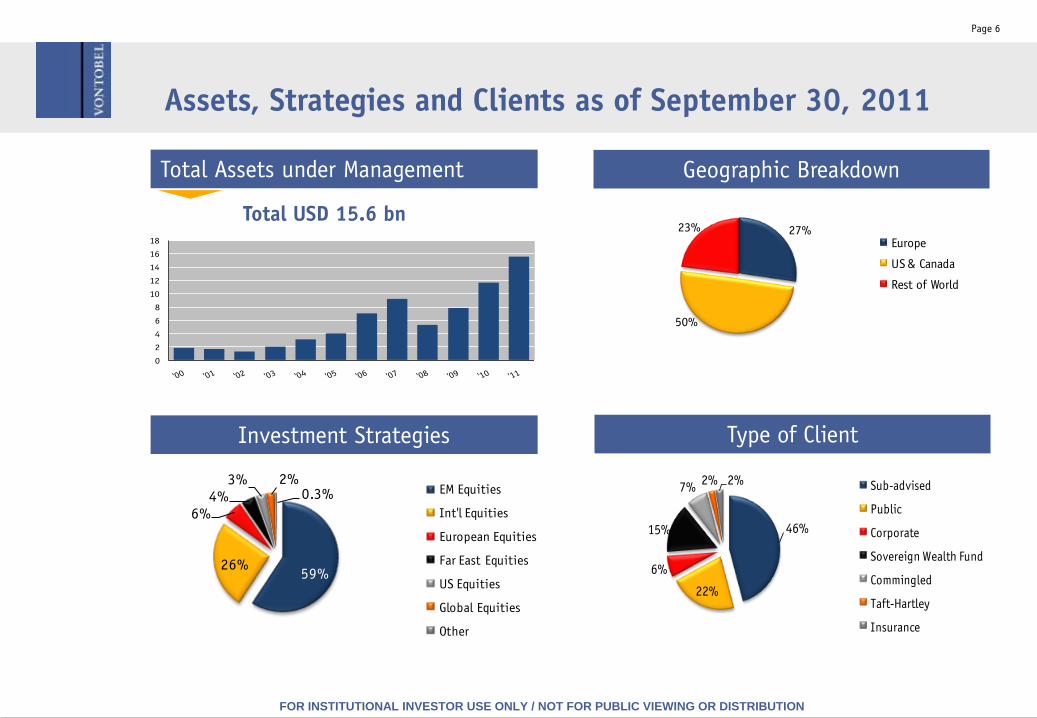
Assets, Strategies and Clients as of September 30, 2011
Page 6
Investment Strategies
Geographic Breakdown
27%
50%
23%
Europe
US & Canada
Rest of World
Type of Client
46%
22%
6%
15%
7%2% 2% Sub-advised
Public
Corporate
Sovereign Wealth Fund
Commingled
Taft-Hartley
Insurance
59%26%
6%4%
3% 2%0.3% EM Equities
Int'l Equities
European Equities
Far East Equities
US Equities
Global Equities
Other
Total Assets under Management
Total USD 15.6 bn
0
2
4
6
8
10
12
14
16
18

FOR INSTITUTIONAL INVESTOR USE ONLY / NOT FOR PUBLIC VIEWING OR DISTRIBUTION
Content
Page 7
Part I: Firm Overview
Part II: Investment Approach and Team
Part III: Portfolio Characteristics
Part IV: Performance and Competitive Standing
Part V: Appendix

FOR INSTITUTIONAL INVESTOR USE ONLY / NOT FOR PUBLIC VIEWING OR DISTRIBUTION
Investment Philosophy:High Quality Growth At Sensible Prices
Page 8
We believe there is a close correlation between earnings
growth and stock price appreciation over time. By
identifying sensibly priced high quality companies that can
grow earnings faster than the market on a sustainable basis,
we believe we will be able to achieve superior returns for
our clients.
Philoso
phy
* Source: Securities Research Company, chart by Vontobel.
13.8%
12.0%
8.1%
11.7%
9.2%
7.4% 7.8%
5.8% 5.4% 5.5%
3.7%
6.1%
11.9% 11.7%11.6%
11.3%
8.6%
7.1%
6.0%5.3% 5.0% 4.6%
2.1%
0.0%
Industry Groups
Annual Rates of Growth, 1985-2010
Stock Price Earnings
Past performance is not indicative of future results. For full disclosure and for further information regarding comparison to an index, see last page.
Please refer to the end of this presentation for a table of the gross and net returns for this composite, since inception.
FOR INSTITUTIONAL INVESTOR USE ONLY / NOT FOR PUBLIC VIEWING OR DISTRIBUTION
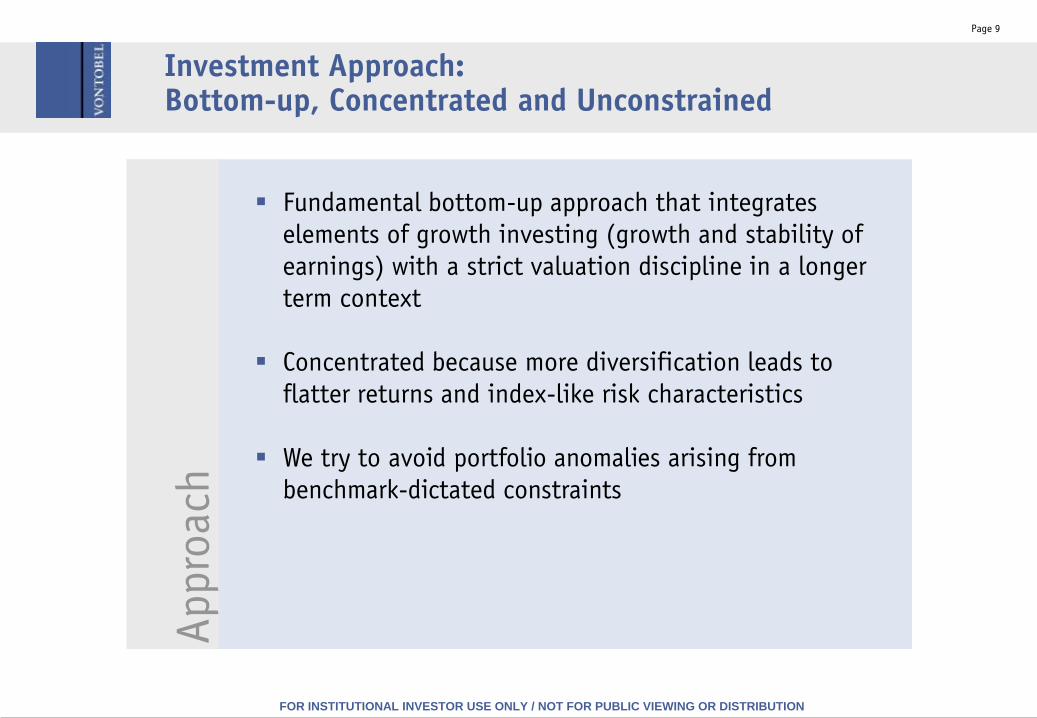
Investment Approach: Bottom-up, Concentrated and Unconstrained
Page 9
Fundamental bottom-up approach that integrates
elements of growth investing (growth and stability of
earnings) with a strict valuation discipline in a longer
term context
Concentrated because more diversification leads to
flatter returns and index-like risk characteristics
We try to avoid portfolio anomalies arising from
benchmark-dictated constraints
Appro
ach
FOR INSTITUTIONAL INVESTOR USE ONLY / NOT FOR PUBLIC VIEWING OR DISTRIBUTION
Product Profile
Page 10
High Quality at Sensible Prices
High-Conviction Portfolio
Benchmark Unconstrained
Multi-Cap Blend
Downside Protection
Char
acte
rist
ics
FOR INSTITUTIONAL INVESTOR USE ONLY / NOT FOR PUBLIC VIEWING OR DISTRIBUTION
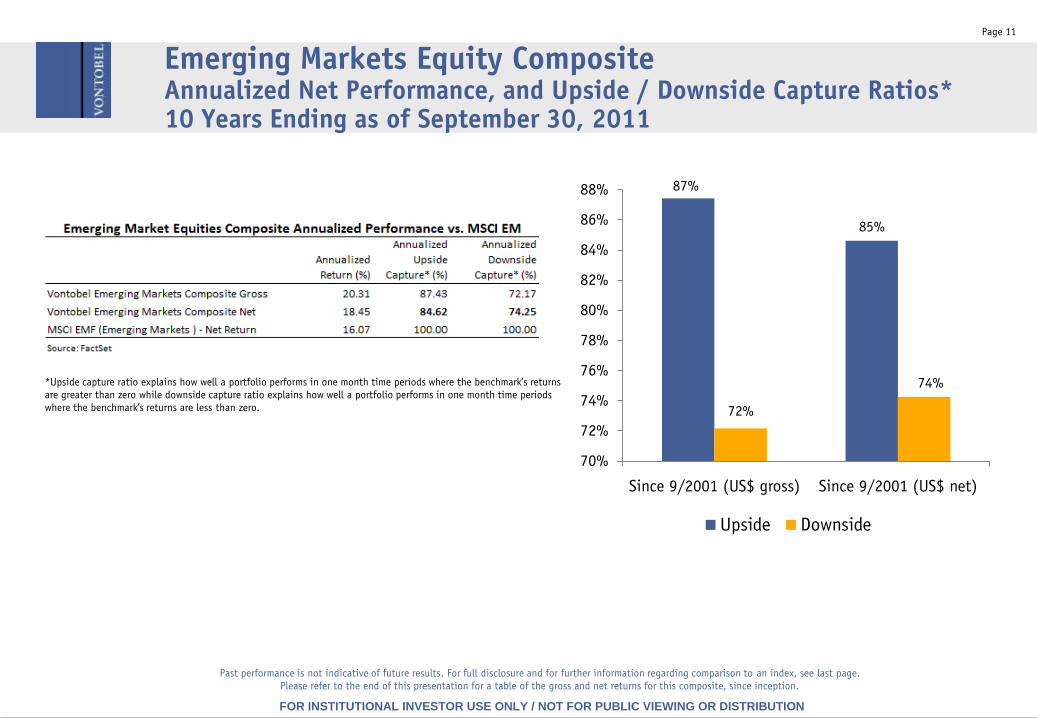
Emerging Markets Equity CompositeAnnualized Net Performance, and Upside / Downside Capture Ratios*10 Years Ending as of September 30, 2011
Page 11
Past performance is not indicative of future results. For full disclosure and for further information regarding comparison to an index, see last page.
Please refer to the end of this presentation for a table of the gross and net returns for this composite, since inception.
*Upside capture ratio explains how well a portfolio performs in one month time periods where the benchmark’s returns
are greater than zero while downside capture ratio explains how well a portfolio performs in one month time periods
where the benchmark’s returns are less than zero.
87%
85%
72%
74%
70%
72%
74%
76%
78%
80%
82%
84%
86%
88%
Since 9/2001 (US$ gross) Since 9/2001 (US$ net)
Upside Downside
FOR INSTITUTIONAL INVESTOR USE ONLY / NOT FOR PUBLIC VIEWING OR DISTRIBUTION
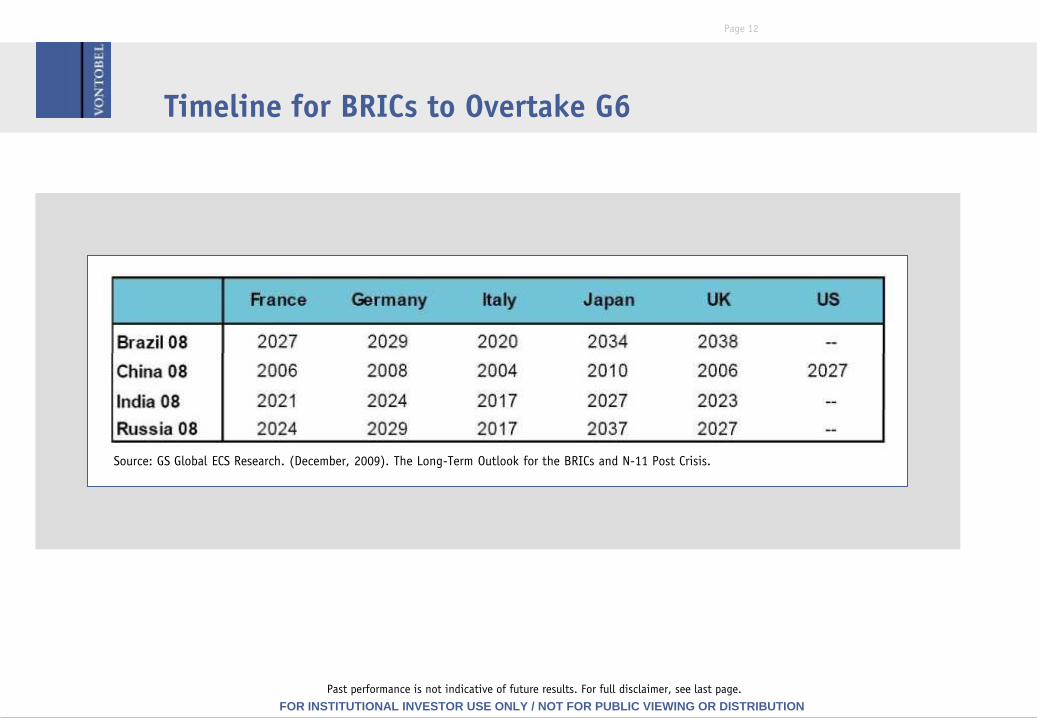
Timeline for BRICs to Overtake G6
Page 12
Source: GS Global ECS Research. (December, 2009). The Long-Term Outlook for the BRICs and N-11 Post Crisis.
Past performance is not indicative of future results. For full disclaimer, see last page.
FOR INSTITUTIONAL INVESTOR USE ONLY / NOT FOR PUBLIC VIEWING OR DISTRIBUTION
0
100
200
300
400
500
600
700
800
1994
1995
1995
1996
1996
1997
1997
1997
1998
1998
1999
1999
1999
2000
2000
2001
2001
2002
2002
2002
2003
2003
2004
2004
2004
2005
2005
2006
2006
2007
2007
2007
2008
2008
2009
2009
2009
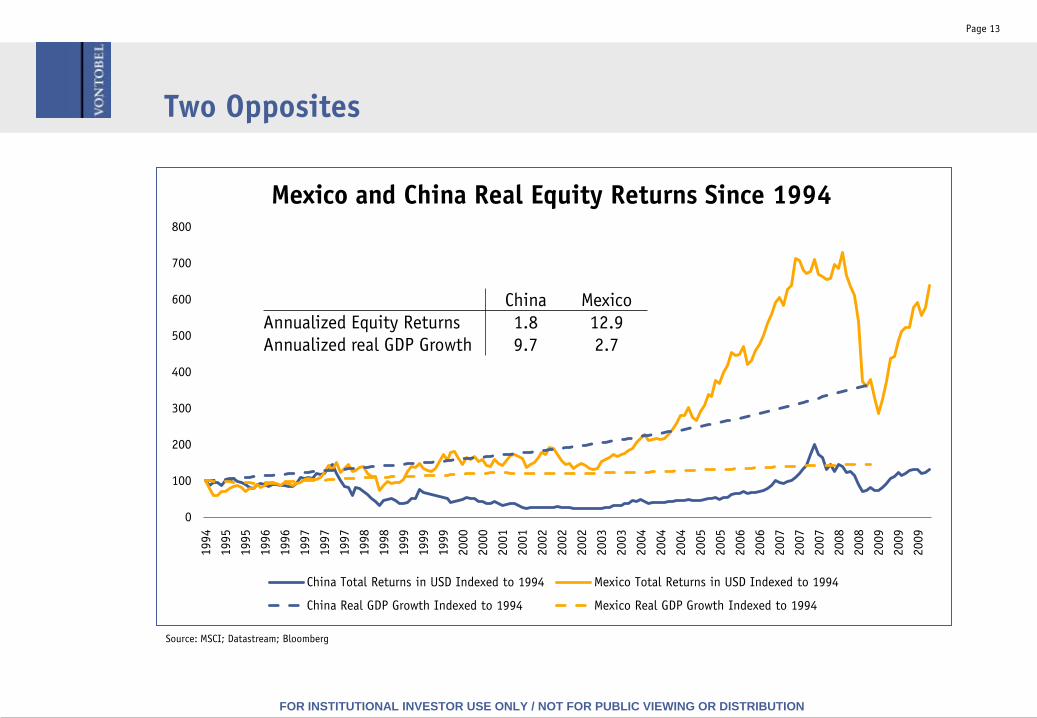
Mexico and China Real Equity Returns Since 1994
China Total Returns in USD Indexed to 1994 Mexico Total Returns in USD Indexed to 1994
China Real GDP Growth Indexed to 1994 Mexico Real GDP Growth Indexed to 1994
Two Opposites
China Mexico
Annualized Equity Returns 1.8 12.9
Annualized real GDP Growth 9.7 2.7
Source: MSCI; Datastream; Bloomberg
Page 13
FOR INSTITUTIONAL INVESTOR USE ONLY / NOT FOR PUBLIC VIEWING OR DISTRIBUTION
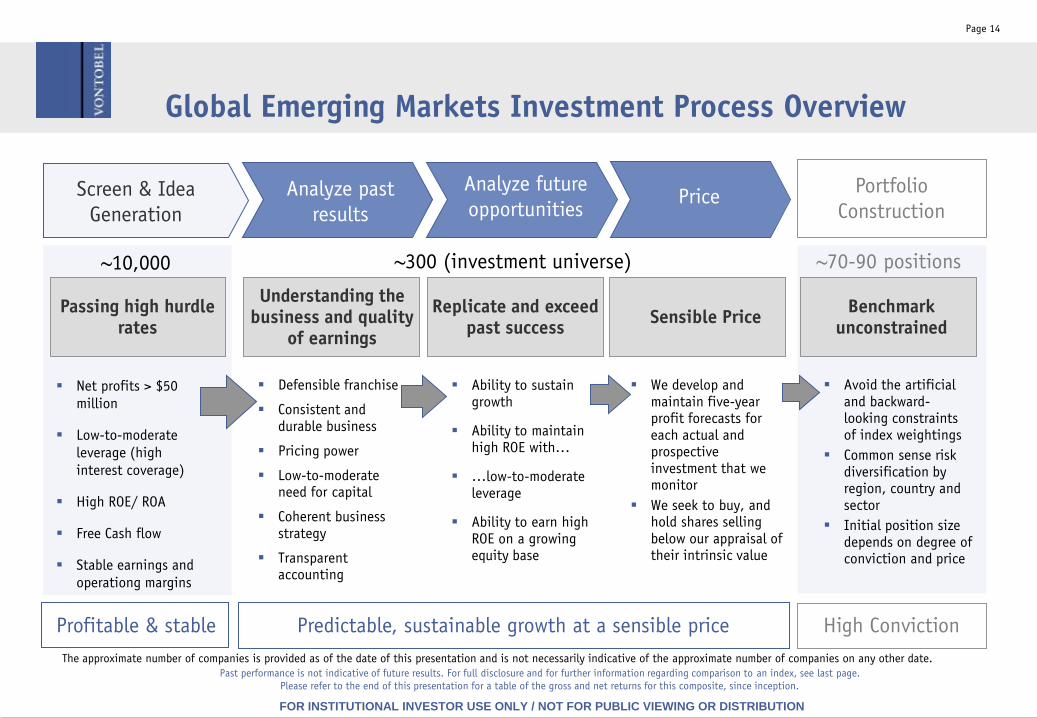
Page 14
~300 (investment universe) ~70-90 positions
Understanding the business and quality
of earnings
Replicate and exceed past success
Sensible Price Benchmark
unconstrained
Profitable & stable High Conviction
~10,000
Predictable, sustainable growth at a sensible price
Screen & Idea
Generation
Analyze past
results
Analyze future
opportunitiesPrice
Portfolio
Construction
The approximate number of companies is provided as of the date of this presentation and is not necessarily indicative of the approximate number of companies on any other date.
Global Emerging Markets Investment Process Overview
Passing high hurdle rates
Net profits > $50
million
Low-to-moderate
leverage (high
interest coverage)
High ROE/ ROA
Free Cash flow
Stable earnings and
operationg margins
Defensible franchise
Consistent and durable business
Pricing power
Low-to-moderate need for capital
Coherent business strategy
Transparent accounting
Ability to sustain growth
Ability to maintain high ROE with…
…low-to-moderate leverage
Ability to earn high ROE on a growing equity base
We develop and maintain five-year profit forecasts for each actual and prospective investment that we monitor
We seek to buy, and hold shares selling below our appraisal of their intrinsic value
Avoid the artificial and backward-looking constraints of index weightings
Common sense risk diversification by region, country and sector
Initial position size depends on degree of conviction and price
Past performance is not indicative of future results. For full disclosure and for further information regarding comparison to an index, see last page.
Please refer to the end of this presentation for a table of the gross and net returns for this composite, since inception.

FOR INSTITUTIONAL INVESTOR USE ONLY / NOT FOR PUBLIC VIEWING OR DISTRIBUTION
EPS growth estimate
20% p.a. (vs. 29% p.a.
for past 10 years)
Page 15
Buy Discipline: Valuation… Price is what you pay…- Value is what you get.
Discount rate 7%
(normalized 10
year bond)
Terminal multiple
19x (vs. 22x
historical median
and 20x currently)
Discount ~10%
Assumptions
For illustrative purposes, to demonstrate the process
2009 (a) 2010 2014
68.8
FV 1929PV PV Div 2421
82.5
171.1
Vontobel EPS estimate Terminal multiple on
year 5 earnings estimate
19.0 x
Vontobel
Intrinsic Value
(PV+PV Div)3250
2340
81
Undervalued/Margin of Safety
Legend:
FV = Future Value
PV = Present Value
Div= Dividends
R$ = Brazilian Real
A = Actual
Current Price
For illustrative purposes, to demonstrate the process
2010 (a) 2011 2015
INR 13.6
FV INR 460PV PV Div INR 503
17.0
35.0
Vontobel EPS estimate Terminal multiple on
year 5 earnings estimate
19.0 x
Vontobel
Intrinsic Value
(PV+PV Div)INR 664
INR 485
INR 18
Discount
Legend:
FV = Future Value
PV = Present Value
Div= Dividends
A = Actual
Current Price

FOR INSTITUTIONAL INVESTOR USE ONLY / NOT FOR PUBLIC VIEWING OR DISTRIBUTION
Sell Discipline
Page 16
Price target met
Major merger/acquisition-related activity
Portfolio considerations
Deterioration in fundamentals
Better alternative identified
Sell D
isci
pline
FOR INSTITUTIONAL INVESTOR USE ONLY / NOT FOR PUBLIC VIEWING OR DISTRIBUTION
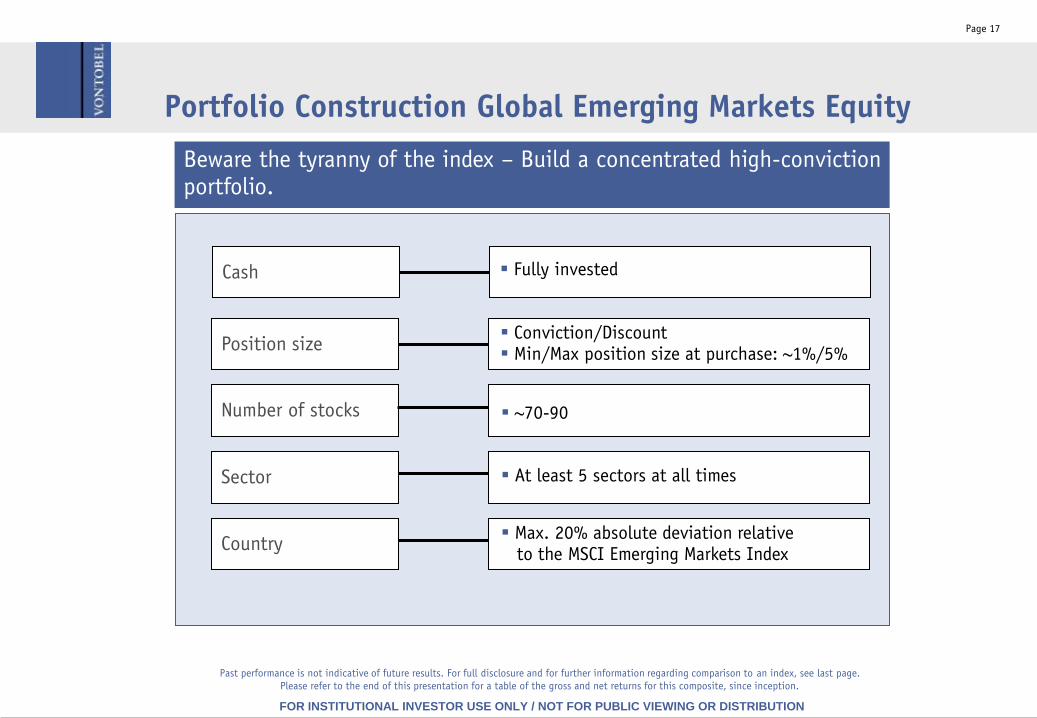
Portfolio Construction Global Emerging Markets Equity
Beware the tyranny of the index – Build a concentrated high-conviction portfolio.
Construction
Number of stocks
Cash
Page 17
Position size
Sector
Country
Conviction/Discount Min/Max position size at purchase: ~1%/5%
~70-90
At least 5 sectors at all times
Max. 20% absolute deviation relative to the MSCI Emerging Markets Index
Fully invested
Past performance is not indicative of future results. For full disclosure and for further information regarding comparison to an index, see last page.
Please refer to the end of this presentation for a table of the gross and net returns for this composite, since inception.
FOR INSTITUTIONAL INVESTOR USE ONLY / NOT FOR PUBLIC VIEWING OR DISTRIBUTION
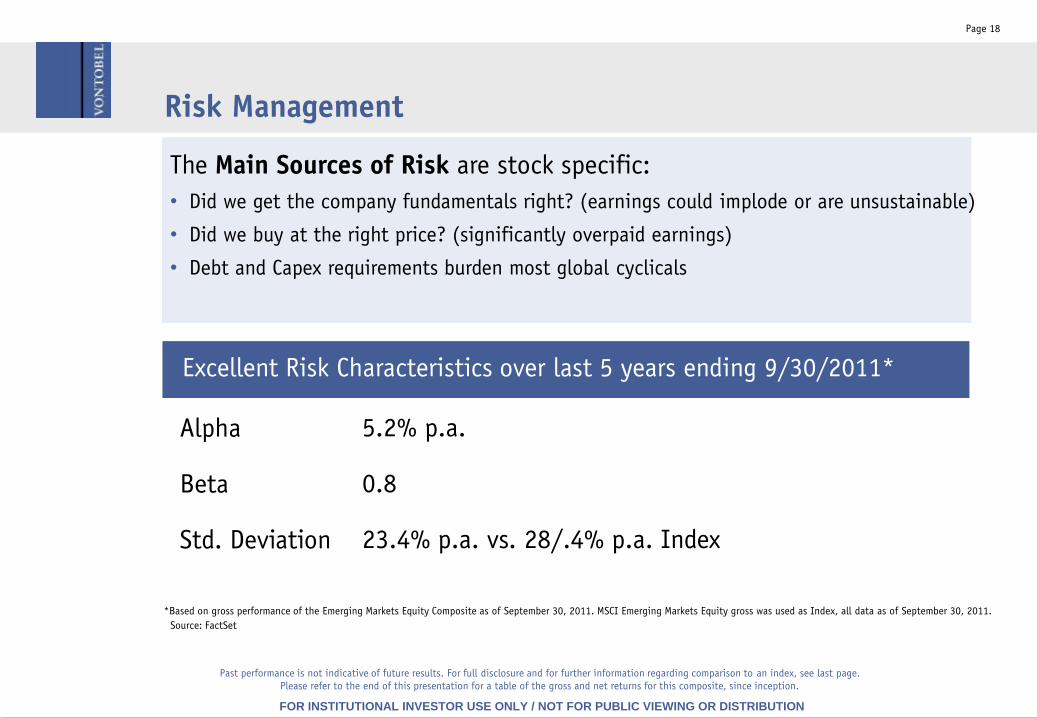
Risk Management
Page 18
Alpha
Beta
Std. Deviation
Excellent Risk Characteristics over last 5 years ending 9/30/2011*
5.2% p.a.
0.8
23.4% p.a. vs. 28/.4% p.a. Index
The Main Sources of Risk are stock specific:
• Did we get the company fundamentals right? (earnings could implode or are unsustainable)
• Did we buy at the right price? (significantly overpaid earnings)
• Debt and Capex requirements burden most global cyclicals
*Based on gross performance of the Emerging Markets Equity Composite as of September 30, 2011. MSCI Emerging Markets Equity gross was used as Index, all data as of September 30, 2011.
Source: FactSet
Past performance is not indicative of future results. For full disclosure and for further information regarding comparison to an index, see last page.
Please refer to the end of this presentation for a table of the gross and net returns for this composite, since inception.
FOR INSTITUTIONAL INVESTOR USE ONLY / NOT FOR PUBLIC VIEWING OR DISTRIBUTION
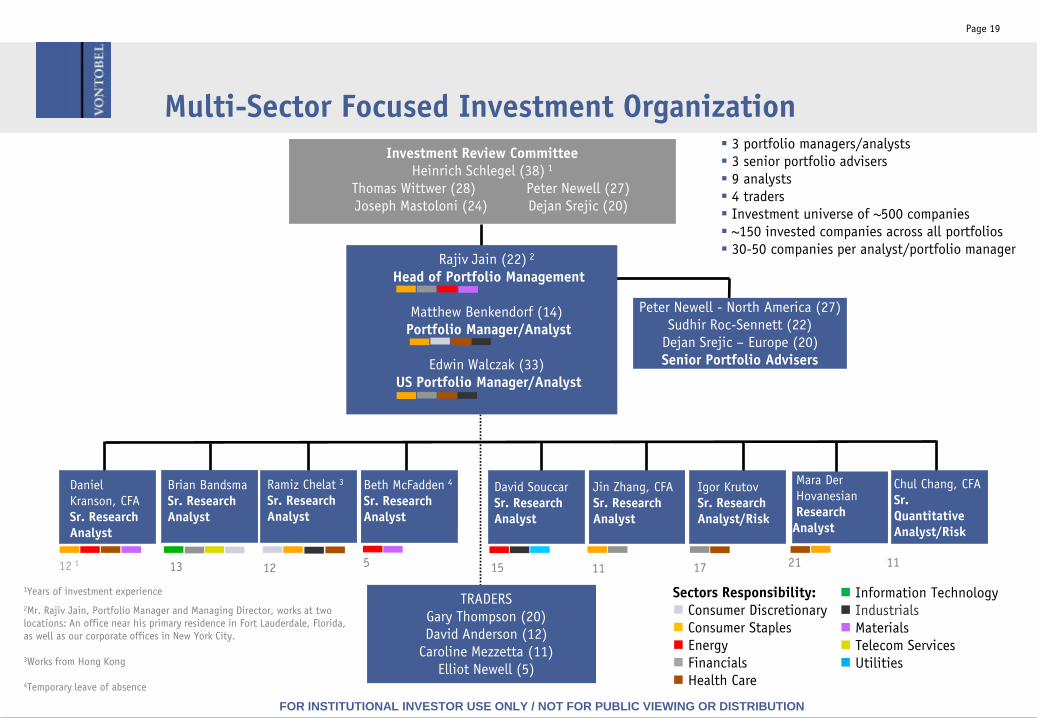
Multi-Sector Focused Investment Organization
Investment Review Committee
Heinrich Schlegel (38) 1
Thomas Wittwer (28) Peter Newell (27)
Joseph Mastoloni (24) Dejan Srejic (20)
Igor Krutov
Sr. Research
Analyst/Risk
Chul Chang, CFA
Sr.
Quantitative
Analyst/Risk
David Souccar
Sr. Research
Analyst
Sectors Responsibility:
Consumer Discretionary
Consumer Staples
Energy
Financials
Health Care
Information Technology
Industrials
Materials
Telecom Services
Utilities
Beth McFadden 4
Sr. Research
Analyst
Brian Bandsma
Sr. Research
Analyst
Daniel
Kranson, CFA
Sr. Research
Analyst
Jin Zhang, CFA
Sr. Research
Analyst
TRADERS
Gary Thompson (20)
David Anderson (12)
Caroline Mezzetta (11)
Elliot Newell (5)
3 portfolio managers/analysts
3 senior portfolio advisers
9 analysts
4 traders
Investment universe of ~500 companies
~150 invested companies across all portfolios
30-50 companies per analyst/portfolio manager
1Years of investment experience
2Mr. Rajiv Jain, Portfolio Manager and Managing Director, works at two
locations: An office near his primary residence in Fort Lauderdale, Florida,
as well as our corporate offices in New York City.
3Works from Hong Kong
4Temporary leave of absence
21171115121312 1 11
Mara Der
Hovanesian
Research
Analyst
Page 19
Peter Newell - North America (27)
Sudhir Roc-Sennett (22)
Dejan Srejic – Europe (20)
Senior Portfolio Advisers
5
Ramiz Chelat 3
Sr. Research
Analyst
Rajiv Jain (22) 2
Head of Portfolio Management
Matthew Benkendorf (14)
Portfolio Manager/Analyst
Edwin Walczak (33)
US Portfolio Manager/Analyst
FOR INSTITUTIONAL INVESTOR USE ONLY / NOT FOR PUBLIC VIEWING OR DISTRIBUTION
Page 20
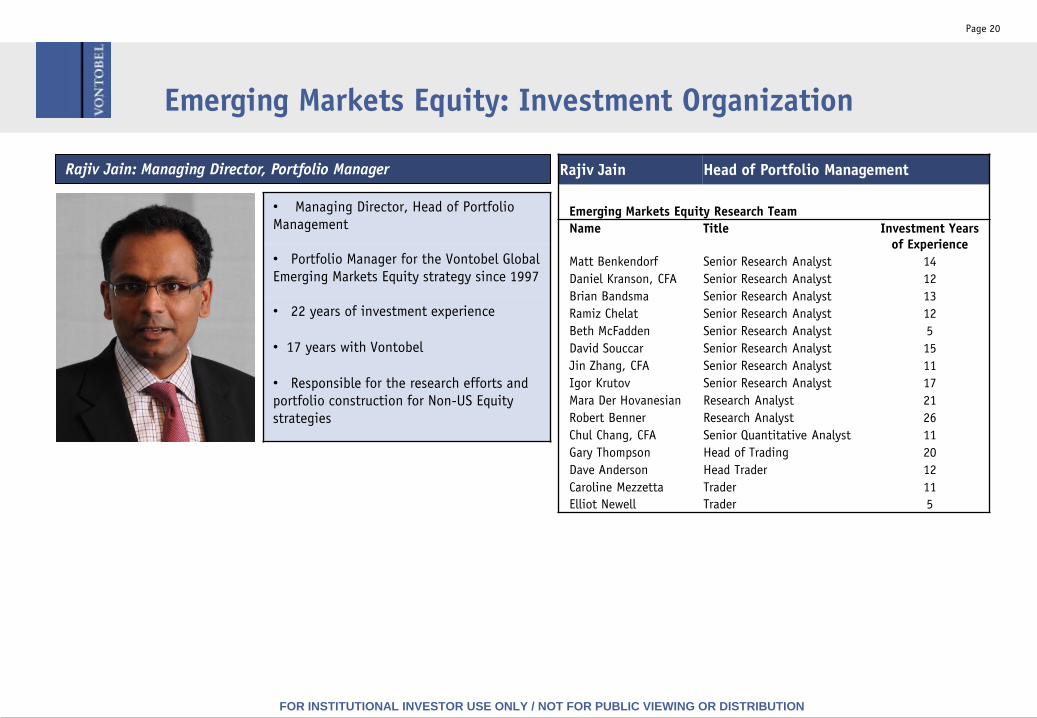
Rajiv Jain Head of Portfolio Management
Emerging Markets Equity Research Team
Name Title Investment Years
of Experience
Matt Benkendorf Senior Research Analyst 14
Daniel Kranson, CFA Senior Research Analyst 12
Brian Bandsma Senior Research Analyst 13
Ramiz Chelat Senior Research Analyst 12
Beth McFadden Senior Research Analyst 5
David Souccar Senior Research Analyst 15
Jin Zhang, CFA Senior Research Analyst 11
Igor Krutov Senior Research Analyst 17
Mara Der Hovanesian Research Analyst 21
Robert Benner Research Analyst 26
Chul Chang, CFA Senior Quantitative Analyst 11
Gary Thompson Head of Trading 20
Dave Anderson Head Trader 12
Caroline Mezzetta Trader 11
Elliot Newell Trader 5
• Managing Director, Head of Portfolio
Management
• Portfolio Manager for the Vontobel Global
Emerging Markets Equity strategy since 1997
• 22 years of investment experience
• 17 years with Vontobel
• Responsible for the research efforts and
portfolio construction for Non-US Equity
strategies
Rajiv Jain: Managing Director, Portfolio Manager
Emerging Markets Equity: Investment Organization
FOR INSTITUTIONAL INVESTOR USE ONLY / NOT FOR PUBLIC VIEWING OR DISTRIBUTION
Content
Page 21
Part I: Firm Overview
Part II: Investment Approach and Team
Part III: Portfolio Characteristics
Part IV: Performance and Competitive Standing
Part V: Appendix

FOR INSTITUTIONAL INVESTOR USE ONLY / NOT FOR PUBLIC VIEWING OR DISTRIBUTION
Page 22
Company*** % of Portfolio Country
British American Tobacco PLC 5.1 United Kingdom
HDFC Bank Ltd. 4.4 India
Housing Development Finance
Corp. Ltd.4.1 India
Companhia de Bebidas das
Americas4.1 Brazil
ITC Ltd. 3.4 India
Souza Cruz S.A. 3.2 Brazil
Itau Unibanco Holding S.A 3.2 Brazil
Baidu Inc. ADS 2.7 China
SABMiller PLC 2.6 South Africa
Companhia Energetica de Minas
Gerais-CEMIG1.9 Brazil
Top Ten as % of Portfolio 34.7
Portfolio Valuation & Statistics*
Portfolio MSCI EME
Capitalization ($ bn), weighted average 21.8 37.8
Capitalization ($ bn), weighted median 13.4 15.1
P/E - Forecast 12-month, weighted harmonic
average14.2 8.4
Dividend Yield (%) 2.8 3.3
5 Yr Historical EPS Growth 23.3 15.7
Return on Equity, weighted average 32.4 20.7
Return on Equity, average 31.1 18.4
Composite Statistics**
Anlzd Alpha 5 years 5.2 N/A
Beta 5 years 0.8 1.0
Sharpe Ratio 5 years 0.4 0.1
Anlzd Standard Deviation 5 years 23.4 28.4
Emerging Markets Equity Portfolio - Characteristics
As of September 30, 2011
***The securities identified and described do not represent all of the securities purchased, sold or
recommended for client accounts. The reader should not assume that an investment in the
securities identified was or will be profitable.
*Based on a representative portfolio and shown as supplemental information to the Composite presentation.
Other accounts contained in the composite could have materiallydifferent statistics. The basis upon which the
representative portfolio was selected is that the portfolio is the largest, and most representative account.
Source: FactSet
** Based on gross performance of the Emerging Markets Equity Composite as of September 30, 2011.
***The Top Ten Holdings are based on a representative portfolio, and are shown as supplemental
information to the Emerging Markets Equity Composite presentation. Source: FactSet
Past performance is not indicative of future results. For full disclosure and for further information regarding comparison to an index, see last page.
Please refer to the end of this presentation for a table of the gross and net returns for this composite, since inception.
Portfolio Turnover: 53.7% (2010)

FOR INSTITUTIONAL INVESTOR USE ONLY / NOT FOR PUBLIC VIEWING OR DISTRIBUTION
Page 23
Emerging Markets Equity Portfolio - Sector Allocation*
As of September 30, 2011
*Emerging Markets Equity Representative Account vs. MSCI EME Index
The sector holdings are based on a representative portfolio, and are shown as supplemental
information to the Emerging Markets Equity Composite presentation.
Source: FactSet
Port. Bench.
Vontobel Sector Weight Weight Difference
Consumer Discretionary 7.15 7.85 -0.70
Consumer Staples 38.01 7.74 30.27
Energy 3.39 13.97 -10.57
Financials 18.91 23.75 -4.84
Health Care 1.19 1.10 0.09
Industrials 2.86 6.64 -3.78
Information Technology 10.26 12.21 -1.95
Materials 3.92 13.80 -9.89
Telecommunication Services 2.09 9.47 -7.38
Utilities 10.21 3.49 6.73
[Cash] 2.01 -- 2.01
Total 100.00 100.00 --
-15 -10 -5 0 5 10 15 20 25 30
Energy
Materials
TelecommunicationServices
Financials
Industrials
InformationTechnology
ConsumerDiscretionary
Health Care
[Cash]
Utilities
ConsumerStaples
-10.57
-9.89
-7.38
-4.84
-3.78
-1.95
-0.70
0.09
2.01
6.73
30.27
Vontobel Sector 9/30/2011
Difference
FOR INSTITUTIONAL INVESTOR USE ONLY / NOT FOR PUBLIC VIEWING OR DISTRIBUTION
Page 24
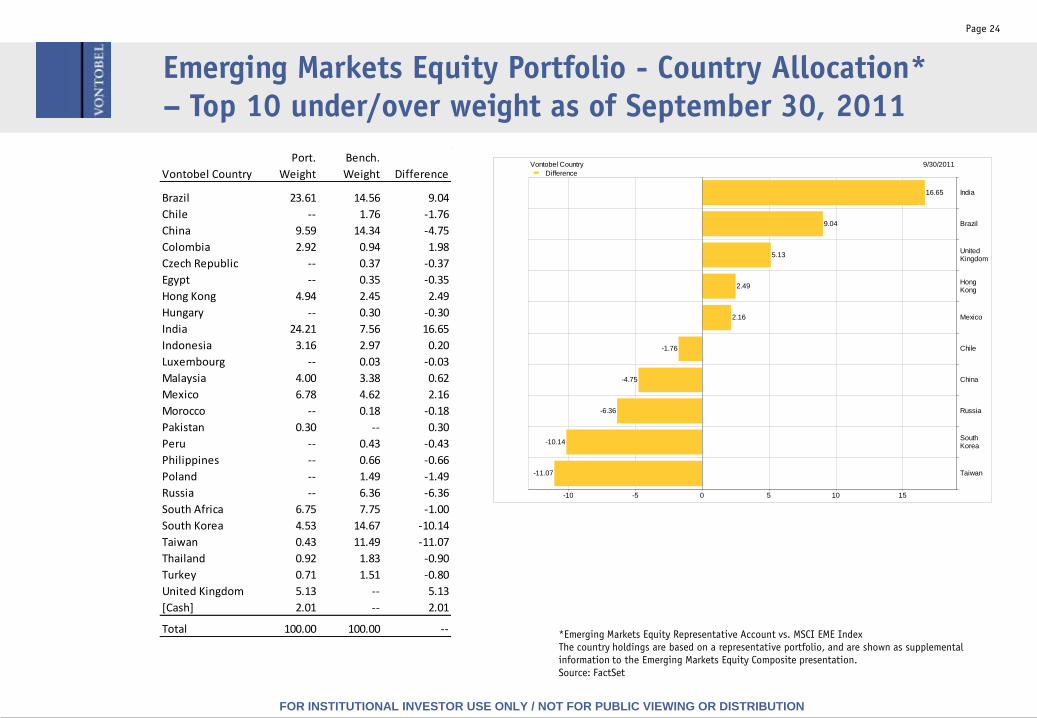
Emerging Markets Equity Portfolio - Country Allocation*
– Top 10 under/over weight as of September 30, 2011
*Emerging Markets Equity Representative Account vs. MSCI EME Index
The country holdings are based on a representative portfolio, and are shown as supplemental
information to the Emerging Markets Equity Composite presentation.
Source: FactSet
Port. Bench.
Vontobel Country Weight Weight Difference
Brazil 23.61 14.56 9.04
Chile -- 1.76 -1.76
China 9.59 14.34 -4.75
Colombia 2.92 0.94 1.98
Czech Republic -- 0.37 -0.37
Egypt -- 0.35 -0.35
Hong Kong 4.94 2.45 2.49
Hungary -- 0.30 -0.30
India 24.21 7.56 16.65
Indonesia 3.16 2.97 0.20
Luxembourg -- 0.03 -0.03
Malaysia 4.00 3.38 0.62
Mexico 6.78 4.62 2.16
Morocco -- 0.18 -0.18
Pakistan 0.30 -- 0.30
Peru -- 0.43 -0.43
Philippines -- 0.66 -0.66
Poland -- 1.49 -1.49
Russia -- 6.36 -6.36
South Africa 6.75 7.75 -1.00
South Korea 4.53 14.67 -10.14
Taiwan 0.43 11.49 -11.07
Thailand 0.92 1.83 -0.90
Turkey 0.71 1.51 -0.80
United Kingdom 5.13 -- 5.13
[Cash] 2.01 -- 2.01
Total 100.00 100.00 --
-10 -5 0 5 10 15
Taiwan
South Korea
Russia
China
Chile
Mexico
Hong Kong
United Kingdom
Brazil
India
-11.07
-10.14
-6.36
-4.75
-1.76
2.16
2.49
5.13
9.04
16.65
Vontobel Country 9/30/2011
Difference
FOR INSTITUTIONAL INVESTOR USE ONLY / NOT FOR PUBLIC VIEWING OR DISTRIBUTION
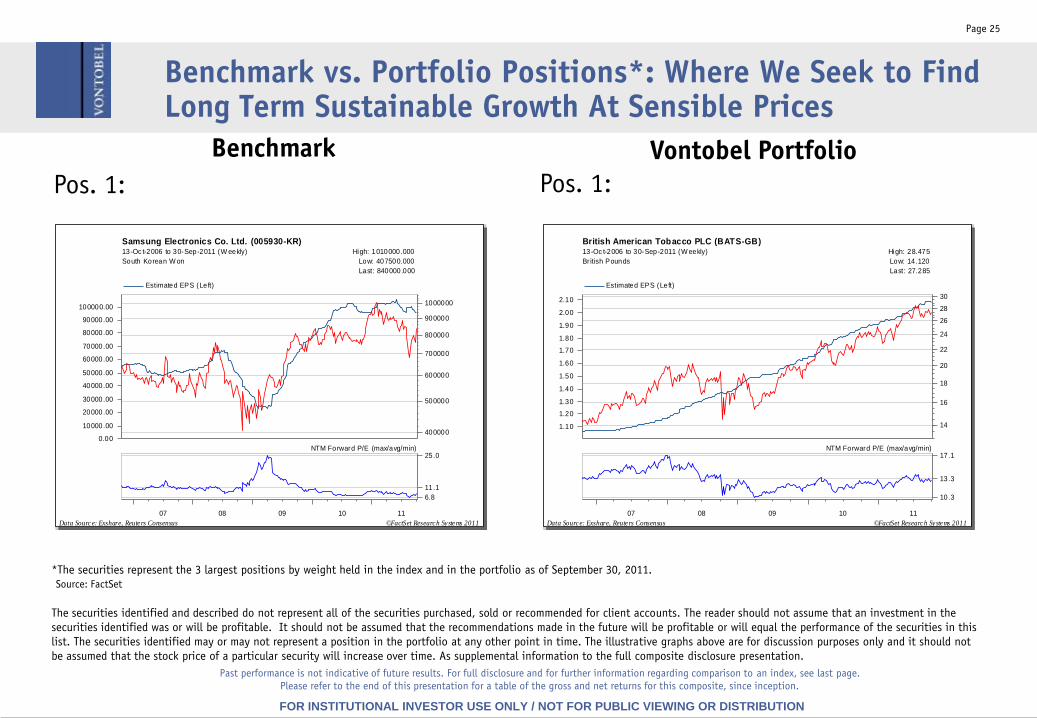
Page 25
Pos. 1: Pos. 1:
Benchmark vs. Portfolio Positions*: Where We Seek to Find Long Term Sustainable Growth At Sensible Prices
*The securities represent the 3 largest positions by weight held in the index and in the portfolio as of September 30, 2011.
The securities identified and described do not represent all of the securities purchased, sold or recommended for client accounts. The reader should not assume that an investment in the
securities identified was or will be profitable. It should not be assumed that the recommendations made in the future will be profitable or will equal the performance of the securities in this
list. The securities identified may or may not represent a position in the portfolio at any other point in time. The illustrative graphs above are for discussion purposes only and it should not
be assumed that the stock price of a particular security will increase over time. As supplemental information to the full composite disclosure presentation.
Benchmark Vontobel Portfolio
Past performance is not indicative of future results. For full disclosure and for further information regarding comparison to an index, see last page.
Please refer to the end of this presentation for a table of the gross and net returns for this composite, since inception.
Source: FactSet
07 08 09 10 11
1.10
1.20
1.30
1.40
1.50
1.60
1.70
1.80
1.90
2.00
2.10
14
16
18
20
22
24
26
28
30
17.1
13.3
10.3
NTM Forward P/E (max/avg/min)
Estimated EPS (Left)
British American Tobacco PLC (BATS-GB)13-Oc t-2006 to 30-Sep-2011 (W eekly) High: 28.475
Br itish Pounds Low: 14.120
Last: 27.285
Data Source: Exshare, Reuters Consensus ©FactSet Research Systems 2011
07 08 09 10 11
0.00
10000.00
20000.00
30000.00
40000.00
50000.00
60000.00
70000.00
80000.00
90000.00
100000.00
400000
500000
600000
700000
800000
900000
1000000
25.0
11.1
6.8
NTM Forward P/E (max/avg/min)
Estimated EPS (Left)
Samsung Electronics Co. Ltd. (005930-KR)13-Oc t-2006 to 30-Sep-2011 (W eekly) High: 1010000.000
South Korean W on Low: 407500.000
Last: 840000.000
Data Source: Exshare, Reuters Consensus ©FactSet Research Systems 2011
FOR INSTITUTIONAL INVESTOR USE ONLY / NOT FOR PUBLIC VIEWING OR DISTRIBUTION
Page 26
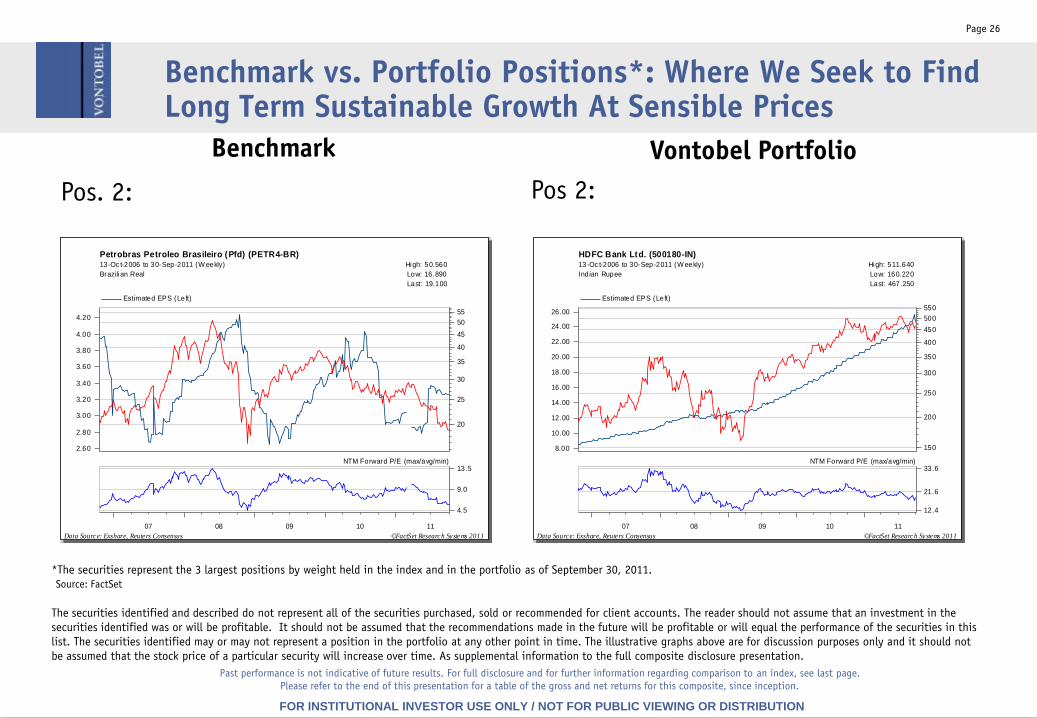
Pos. 2:
Benchmark Vontobel Portfolio
Pos 2:
Benchmark vs. Portfolio Positions*: Where We Seek to Find Long Term Sustainable Growth At Sensible Prices
Past performance is not indicative of future results. For full disclosure and for further information regarding comparison to an index, see last page.
Please refer to the end of this presentation for a table of the gross and net returns for this composite, since inception.
07 08 09 10 11
8.00
10.00
12.00
14.00
16.00
18.00
20.00
22.00
24.00
26.00
150
200
250
300
350
400
450
500
550
33.6
21.6
12.4
NTM Forward P/E (max/avg/min)
Estimated EPS (Left)
HDFC Bank Ltd. (500180-IN)13-Oc t-2006 to 30-Sep-2011 (W eekly) High: 511.640
Indian Rupee Low: 160.220
Last: 467.250
Data Source: Exshare, Reuters Consensus ©FactSet Research Systems 2011
*The securities represent the 3 largest positions by weight held in the index and in the portfolio as of September 30, 2011.
The securities identified and described do not represent all of the securities purchased, sold or recommended for client accounts. The reader should not assume that an investment in the
securities identified was or will be profitable. It should not be assumed that the recommendations made in the future will be profitable or will equal the performance of the securities in this
list. The securities identified may or may not represent a position in the portfolio at any other point in time. The illustrative graphs above are for discussion purposes only and it should not
be assumed that the stock price of a particular security will increase over time. As supplemental information to the full composite disclosure presentation.
Source: FactSet
07 08 09 10 11
2.60
2.80
3.00
3.20
3.40
3.60
3.80
4.00
4.20
20
25
30
35
40
45
50
55
13.5
9.0
4.5
NTM Forward P/E (max/avg/min)
Estimated EPS (Left)
Petrobras Petroleo Brasileiro (Pfd) (PETR4-BR)13-Oc t-2006 to 30-Sep-2011 (W eekly) High: 50.560
Brazilian Real Low: 16.890
Last: 19.100
Data Source: Exshare, Reuters Consensus ©FactSet Research Systems 2011

FOR INSTITUTIONAL INVESTOR USE ONLY / NOT FOR PUBLIC VIEWING OR DISTRIBUTION
Content
Page 27
Part I: Firm Overview
Part II: Investment Approach and Team
Part III: Portfolio Characteristics
Part IV: Performance and Competitive Standing
Part V: Appendix
FOR INSTITUTIONAL INVESTOR USE ONLY / NOT FOR PUBLIC VIEWING OR DISTRIBUTION
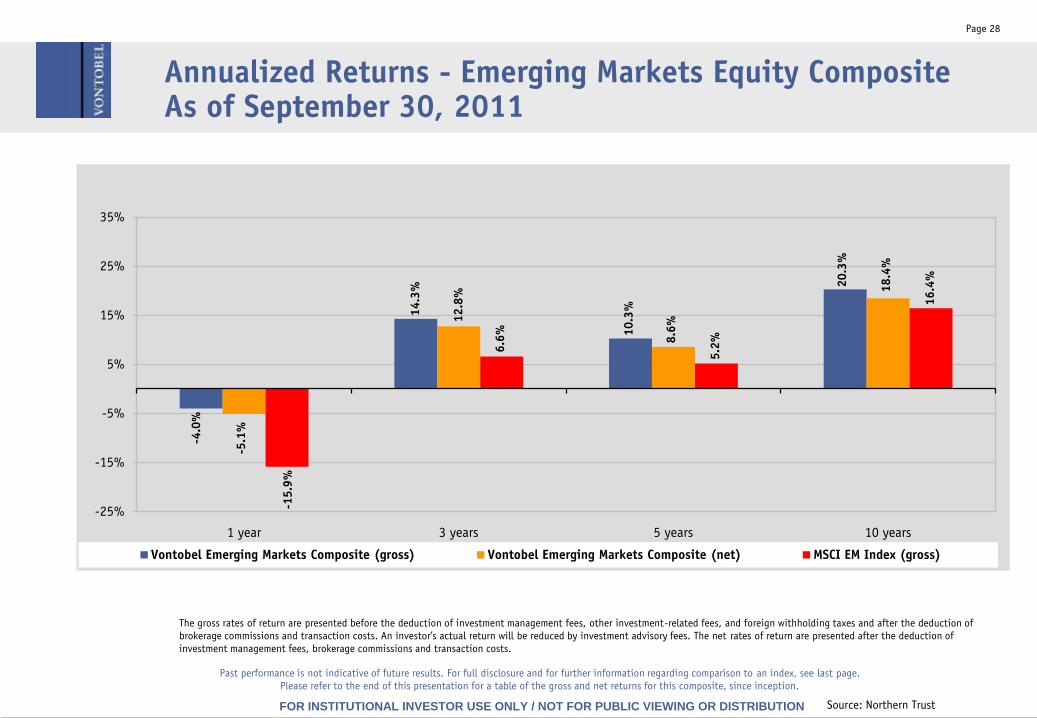
Annualized Returns - Emerging Markets Equity Composite As of September 30, 2011
-4.0
%
14.3
%
10.3
%
20.3
%
-5.1
%
12.8
%
8.6
%
18.4
%
-15.9
%
6.6
%
5.2
%
16.4
%
-25%
-15%
-5%
5%
15%
25%
35%
1 year 3 years 5 years 10 years
Vontobel Emerging Markets Composite (gross) Vontobel Emerging Markets Composite (net) MSCI EM Index (gross)
Source: Northern Trust
Page 28
The gross rates of return are presented before the deduction of investment management fees, other investment-related fees, and foreign withholding taxes and after the deduction of
brokerage commissions and transaction costs. An investor’s actual return will be reduced by investment advisory fees. The net rates of return are presented after the deduction of
investment management fees, brokerage commissions and transaction costs.
Past performance is not indicative of future results. For full disclosure and for further information regarding comparison to an index, see last page.
Please refer to the end of this presentation for a table of the gross and net returns for this composite, since inception.
FOR INSTITUTIONAL INVESTOR USE ONLY / NOT FOR PUBLIC VIEWING OR DISTRIBUTION
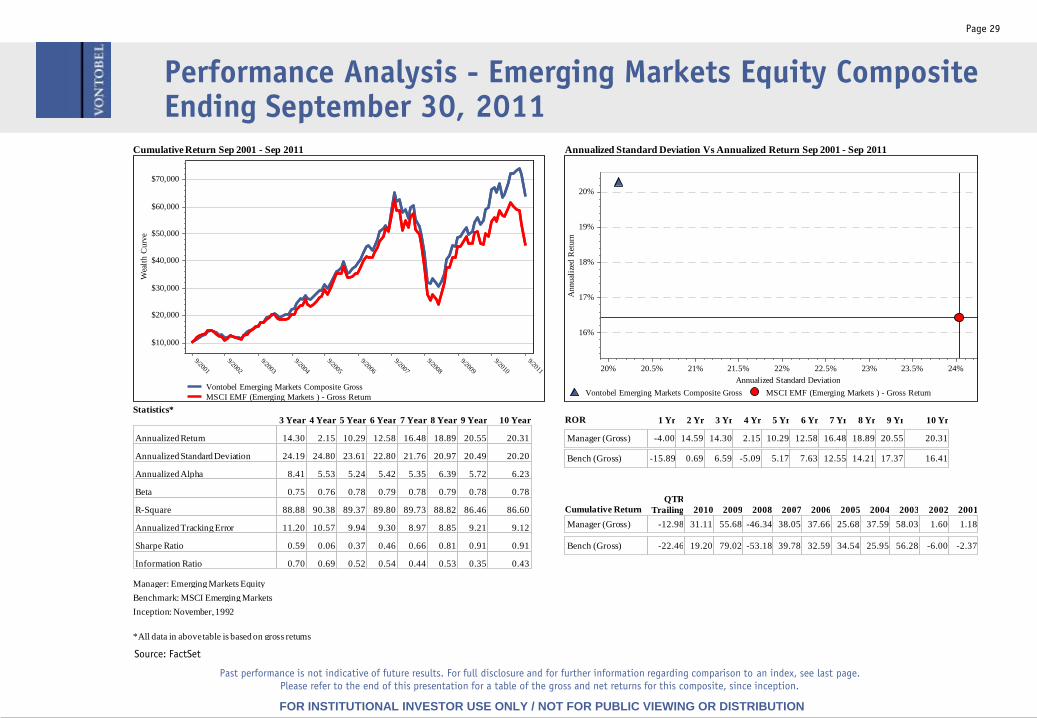
Performance Analysis - Emerging Markets Equity CompositeEnding September 30, 2011
Page 29
Past performance is not indicative of future results. For full disclosure and for further information regarding comparison to an index, see last page.
Please refer to the end of this presentation for a table of the gross and net returns for this composite, since inception.
Source: FactSet
*All data in above table is based on gross returns
Cumulative Return Sep 2001 - Sep 2011
9/2001
9/2002
9/2003
9/2004
9/2005
9/2006
9/2007
9/2008
9/2009
9/2010
9/2011
$10,000
$20,000
$30,000
$40,000
$50,000
$60,000
$70,000
Wea
lth C
urv
e
Vontobel Emerging Markets Composite Gross
MSCI EMF (Emerging Markets ) - Gross Return
Annualized Standard Deviation Vs Annualized Return Sep 2001 - Sep 2011
20% 20.5% 21% 21.5% 22% 22.5% 23% 23.5% 24%
Annualized Standard Deviation
16%
17%
18%
19%
20%
Annual
ized
Ret
urn
Vontobel Emerging Markets Composite Gross MSCI EMF (Emerging Markets ) - Gross Return
Statistics*
3 Year 4 Year 5 Year 6 Year 7 Year 8 Year 9 Year 10 Year
Annualized Return 14.30 2.15 10.29 12.58 16.48 18.89 20.55 20.31
Annualized Standard Deviation 24.19 24.80 23.61 22.80 21.76 20.97 20.49 20.20
Annualized Alpha 8.41 5.53 5.24 5.42 5.35 6.39 5.72 6.23
Beta 0.75 0.76 0.78 0.79 0.78 0.79 0.78 0.78
R-Square 88.88 90.38 89.37 89.80 89.73 88.82 86.46 86.60
Annualized Tracking Error 11.20 10.57 9.94 9.30 8.97 8.85 9.21 9.12
Sharpe Ratio 0.59 0.06 0.37 0.46 0.66 0.81 0.91 0.91
Information Ratio 0.70 0.69 0.52 0.54 0.44 0.53 0.35 0.43
ROR
Manager (Gross)
Bench (Gross)
1 Yr 2 Yr 3 Yr 4 Yr 5 Yr 6 Yr 7 Yr 8 Yr 9 Yr 10 Yr
Manager (Gross)-4.00 14.59 14.30 2.15 10.29 12.58 16.48 18.89 20.55 20.31
Bench -15.89 0.69 6.59 -5.09 5.17 7.63 12.55 14.21 17.37 16.41
Cumulative Return
Manager (Gross)
Bench (Gross)
QTR
Trailing 2010 2009 2008 2007 2006 2005 2004 2003 2002 2001
Manager (Gross)-12.98 31.11 55.68 -46.34 38.05 37.66 25.68 37.59 58.03 1.60 1.18
Bench -22.46 19.20 79.02 -53.18 39.78 32.59 34.54 25.95 56.28 -6.00 -2.37
Manager: Emerging Markets Equity
Benchmark: MSCI Emerging Markets
Inception: November, 1992
*All data in above table is based on gross returns
FOR INSTITUTIONAL INVESTOR USE ONLY / NOT FOR PUBLIC VIEWING OR DISTRIBUTION
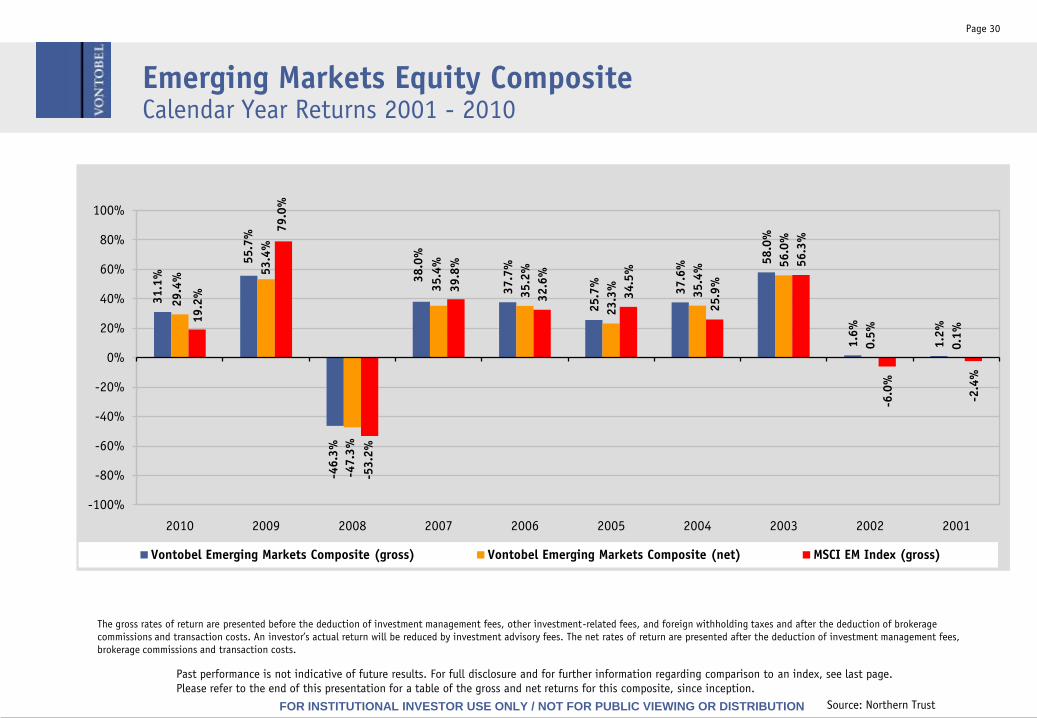
Emerging Markets Equity CompositeCalendar Year Returns 2001 - 2010
31.1
%
55.7
%
-46.3
%
38.0
%
37.7
%
25.7
%
37.6
%
58.0
%
1.6
%
1.2
%
29.4
%
53.4
%
-47.3
%
35.4
%
35.2
%
23.3
%
35.4
%
56.0
%
0.5
%
0.1
%
19.2
%
79.0
%
-53.2
%
39.8
%
32.6
%
34.5
%
25.9
%
56.3
%
-6.0
%
-2.4
%
-100%
-80%
-60%
-40%
-20%
0%
20%
40%
60%
80%
100%
2010 2009 2008 2007 2006 2005 2004 2003 2002 2001
Vontobel Emerging Markets Composite (gross) Vontobel Emerging Markets Composite (net) MSCI EM Index (gross)
Source: Northern Trust
Page 30
The gross rates of return are presented before the deduction of investment management fees, other investment-related fees, and foreign withholding taxes and after the deduction of brokerage
commissions and transaction costs. An investor’s actual return will be reduced by investment advisory fees. The net rates of return are presented after the deduction of investment management fees,
brokerage commissions and transaction costs.
Past performance is not indicative of future results. For full disclosure and for further information regarding comparison to an index, see last page.
Please refer to the end of this presentation for a table of the gross and net returns for this composite, since inception.
FOR INSTITUTIONAL INVESTOR USE ONLY / NOT FOR PUBLIC VIEWING OR DISTRIBUTION
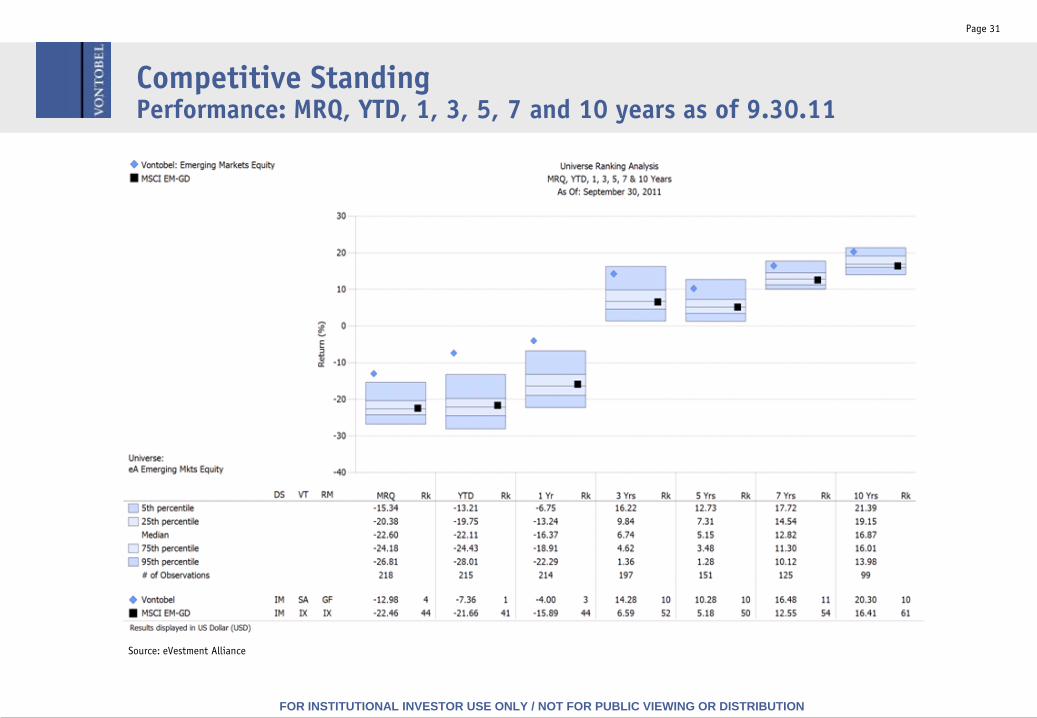
Competitive StandingPerformance: MRQ, YTD, 1, 3, 5, 7 and 10 years as of 9.30.11
Source: eVestment Alliance
Page 31

FOR INSTITUTIONAL INVESTOR USE ONLY / NOT FOR PUBLIC VIEWING OR DISTRIBUTION
Source: eVestment Alliance
Page 32
Competitive StandingMPT Statistics: Annualized 5 years as of 9.30.11

FOR INSTITUTIONAL INVESTOR USE ONLY / NOT FOR PUBLIC VIEWING OR DISTRIBUTION
Source: eVestment Alliance
Page 33
Competitive StandingReturns vs. Standard Deviation: Annualized 5 yr. periods as of 9.30.11
FOR INSTITUTIONAL INVESTOR USE ONLY / NOT FOR PUBLIC VIEWING OR DISTRIBUTION
Content
Page 34
Part I: Firm Overview
Part II: Investment Approach and Team
Part III: Portfolio Characteristics
Part IV: Performance and Competitive Standing
Part V: Appendix

FOR INSTITUTIONAL INVESTOR USE ONLY / NOT FOR PUBLIC VIEWING OR DISTRIBUTION
Vontobel Emerging MarketsFee Schedule
Page 35
Minimum initial investment is $5 million in the Institutional Commingled Fund. Fees are based
on the total net assets of the Fund. Includes management, custody and administrative fees.
The Vontobel Global Emerging Markets Institutional Commingled Fund has $225 million across 9
Institutional Clients as of September 30, 2011
Vontobel Global Emerging Markets Institutional Commingled Fund
First $50 million 1.10%
Next $150 million 1.00%
Over $200 million 0.85%
FOR INSTITUTIONAL INVESTOR USE ONLY / NOT FOR PUBLIC VIEWING OR DISTRIBUTION
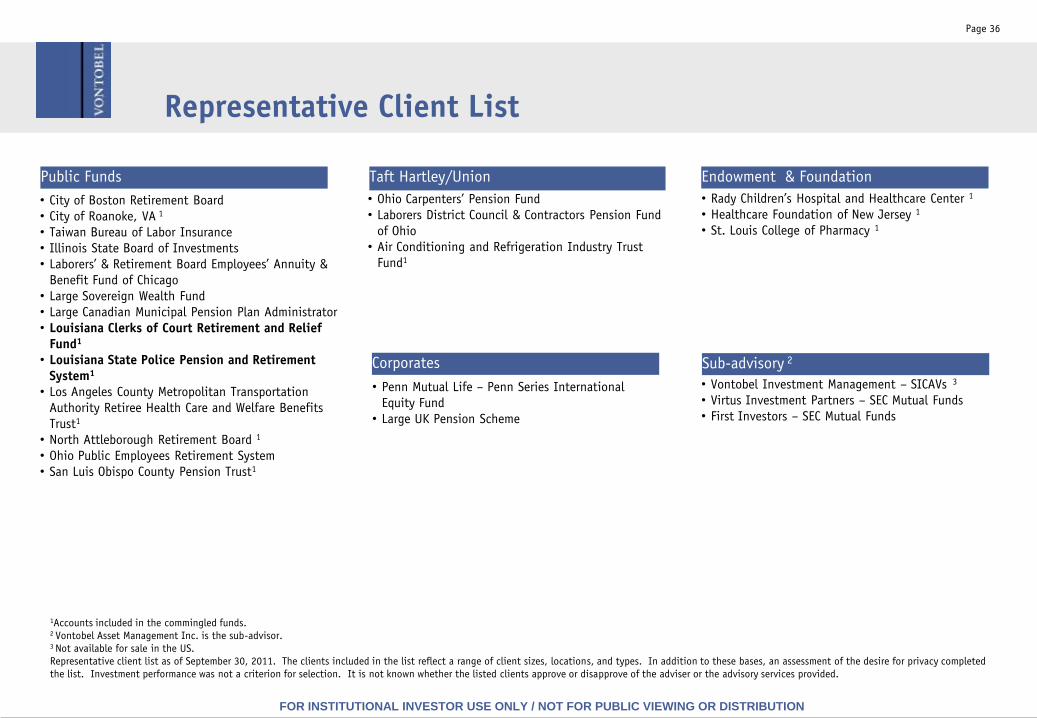
Representative Client List
Taft Hartley/Union
• Ohio Carpenters’ Pension Fund
• Laborers District Council & Contractors Pension Fund
of Ohio
• Air Conditioning and Refrigeration Industry Trust
Fund1
Sub-advisory 2
• Vontobel Investment Management – SICAVs 3
• Virtus Investment Partners – SEC Mutual Funds
• First Investors – SEC Mutual Funds
1Accounts included in the commingled funds.2 Vontobel Asset Management Inc. is the sub-advisor.3 Not available for sale in the US.
Representative client list as of September 30, 2011. The clients included in the list reflect a range of client sizes, locations, and types. In addition to these bases, an assessment of the desire for privacy completed
the list. Investment performance was not a criterion for selection. It is not known whether the listed clients approve or disapprove of the adviser or the advisory services provided.
Public Funds
• City of Boston Retirement Board
• City of Roanoke, VA 1
• Taiwan Bureau of Labor Insurance
• Illinois State Board of Investments
• Laborers’ & Retirement Board Employees’ Annuity &
Benefit Fund of Chicago
• Large Sovereign Wealth Fund
• Large Canadian Municipal Pension Plan Administrator
• Louisiana Clerks of Court Retirement and Relief
Fund1
• Louisiana State Police Pension and Retirement
System1
• Los Angeles County Metropolitan Transportation
Authority Retiree Health Care and Welfare Benefits
Trust1
• North Attleborough Retirement Board 1
• Ohio Public Employees Retirement System
• San Luis Obispo County Pension Trust1
Endowment & Foundation
• Rady Children’s Hospital and Healthcare Center 1
• Healthcare Foundation of New Jersey 1
• St. Louis College of Pharmacy 1
Corporates
• Penn Mutual Life – Penn Series International
Equity Fund
• Large UK Pension Scheme
Page 36
FOR INSTITUTIONAL INVESTOR USE ONLY / NOT FOR PUBLIC VIEWING OR DISTRIBUTION
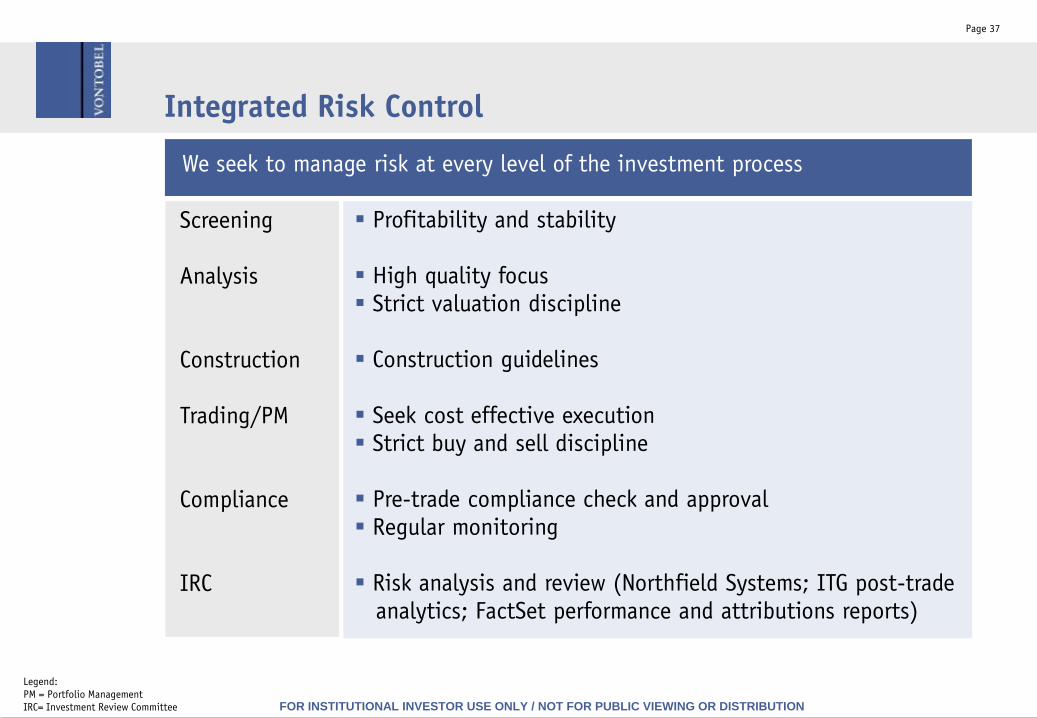
Integrated Risk Control
Page 37
Screening
Analysis
Construction
Trading/PM
Compliance
IRC
We seek to manage risk at every level of the investment process
Legend:
PM = Portfolio Management
IRC= Investment Review Committee
Profitability and stability
High quality focus Strict valuation discipline
Construction guidelines
Seek cost effective execution Strict buy and sell discipline
Pre-trade compliance check and approval Regular monitoring
Risk analysis and review (Northfield Systems; ITG post-tradeanalytics; FactSet performance and attributions reports)
FOR INSTITUTIONAL INVESTOR USE ONLY / NOT FOR PUBLIC VIEWING OR DISTRIBUTION
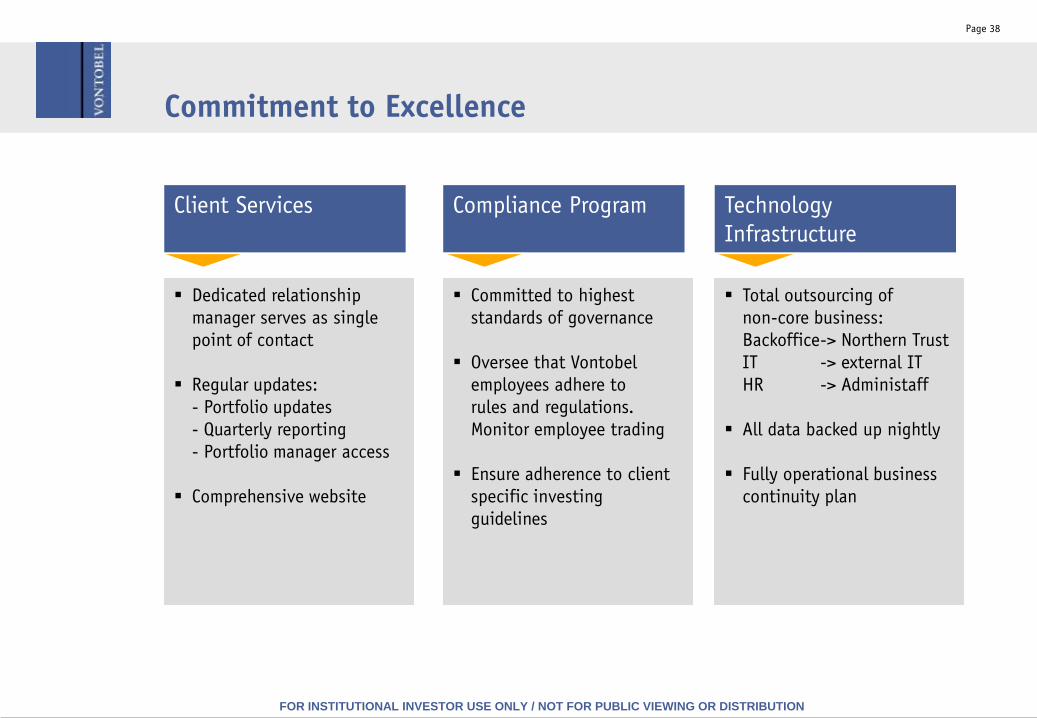
Commitment to Excellence
Dedicated relationship
manager serves as single
point of contact
Regular updates:
- Portfolio updates
- Quarterly reporting
- Portfolio manager access
Comprehensive website
Client Services
Committed to highest
standards of governance
Oversee that Vontobel
employees adhere to
rules and regulations.
Monitor employee trading
Ensure adherence to client
specific investing
guidelines
Compliance Program Technology
Infrastructure
Total outsourcing of
non-core business:
Backoffice-> Northern Trust
IT -> external IT
HR -> Administaff
All data backed up nightly
Fully operational business
continuity plan
Page 38
FOR INSTITUTIONAL INVESTOR USE ONLY / NOT FOR PUBLIC VIEWING OR DISTRIBUTION
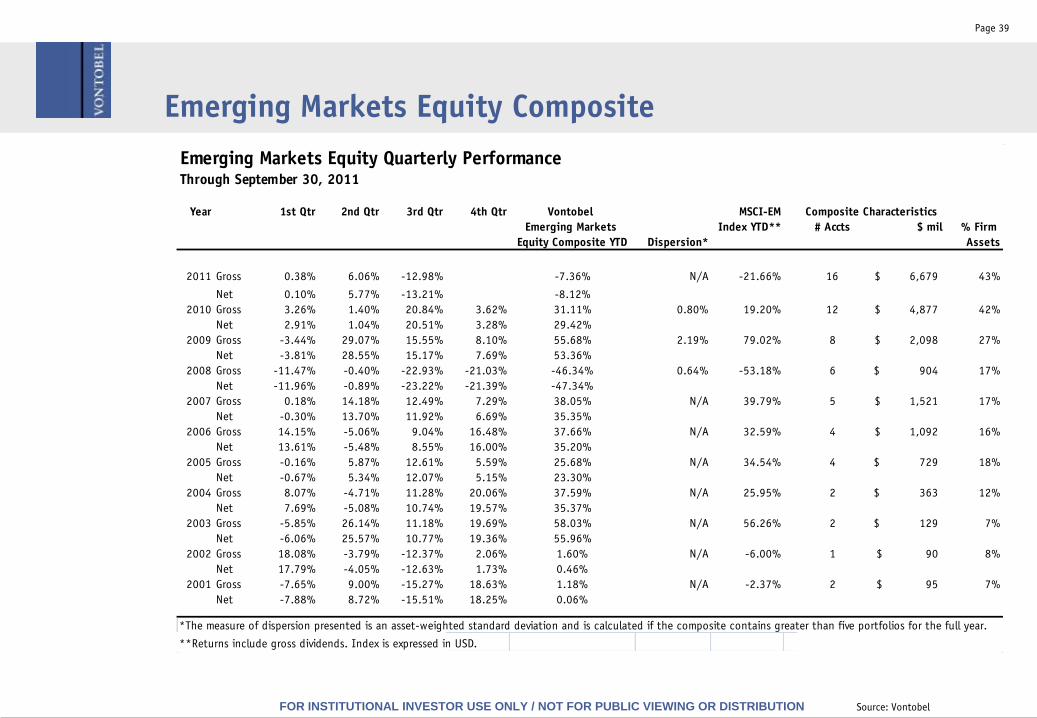
Page 39
Emerging Markets Equity Composite
Source: Vontobel
Emerging Markets Equity Quarterly Performance Through September 30, 2011
Year 1st Qtr 2nd Qtr 3rd Qtr 4th Qtr Vontobel MSCI-EM
Emerging Markets Index YTD** # Accts $ mil % Firm
Equity Composite YTD Dispersion* Assets
2011 Gross 0.38% 6.06% -12.98% -7.36% N/A -21.66% 16 6,679$ 43%
Net 0.10% 5.77% -13.21% -8.12%
2010 Gross 3.26% 1.40% 20.84% 3.62% 31.11% 0.80% 19.20% 12 4,877$ 42%
Net 2.91% 1.04% 20.51% 3.28% 29.42%
2009 Gross -3.44% 29.07% 15.55% 8.10% 55.68% 2.19% 79.02% 8 2,098$ 27%
Net -3.81% 28.55% 15.17% 7.69% 53.36%
2008 Gross -11.47% -0.40% -22.93% -21.03% -46.34% 0.64% -53.18% 6 904$ 17%
Net -11.96% -0.89% -23.22% -21.39% -47.34%
2007 Gross 0.18% 14.18% 12.49% 7.29% 38.05% N/A 39.79% 5 1,521$ 17%
Net -0.30% 13.70% 11.92% 6.69% 35.35%
2006 Gross 14.15% -5.06% 9.04% 16.48% 37.66% N/A 32.59% 4 1,092$ 16%
Net 13.61% -5.48% 8.55% 16.00% 35.20%
2005 Gross -0.16% 5.87% 12.61% 5.59% 25.68% N/A 34.54% 4 729$ 18%
Net -0.67% 5.34% 12.07% 5.15% 23.30%
2004 Gross 8.07% -4.71% 11.28% 20.06% 37.59% N/A 25.95% 2 363$ 12%
Net 7.69% -5.08% 10.74% 19.57% 35.37%
2003 Gross -5.85% 26.14% 11.18% 19.69% 58.03% N/A 56.26% 2 129$ 7%
Net -6.06% 25.57% 10.77% 19.36% 55.96%
2002 Gross 18.08% -3.79% -12.37% 2.06% 1.60% N/A -6.00% 1 90$ 8%
Net 17.79% -4.05% -12.63% 1.73% 0.46%
2001 Gross -7.65% 9.00% -15.27% 18.63% 1.18% N/A -2.37% 2 95$ 7%
Net -7.88% 8.72% -15.51% 18.25% 0.06%
*The measure of dispersion presented is an asset-weighted standard deviation and is calculated if the composite contains greater than five portfolios for the full year.
**Returns include gross dividends. Index is expressed in USD.
Composite Characteristics

FOR INSTITUTIONAL INVESTOR USE ONLY / NOT FOR PUBLIC VIEWING OR DISTRIBUTION
Disclaimer
Page 40
The index comparisons in this presentation are provided for informational purposes only and should not be used as the basis for making
an investment decision. Further, the performance of the composite and the Index may not be comparable.
Investments discussed in the presentation are hypothetical investments and there is no assurance that Vontobel will make any
investments with the same or similar characteristics as the hypothetical investments presented. The hypothetical investments are
presented for discussion purposes only and are not a reliable indicator of the performance or investment profile of the composite.
Any projections contained in this presentation are based on a variety of estimates and assumptions. There can be no assurance that the
assumptions made in connection with the projections will prove accurate, and actual results may differ materially. The inclusion of
projections should not be regarded as an indication that Vontobel considers the projections to be a reliable prediction of future events
and projections should not be relied upon as such.
This disclaimer applies to this presentation and the oral or written comments of any person presenting it.
The inclusion in the composite of the performance of wrap accounts and private client assets could result in a material difference in the
performance returns.
There can be no assurance that investment objectives will be achieved. Clients must be prepared to bear risk of a total loss of their
investment.
As fees are deducted quarterly, the compounding effect will be to increase the impact of the fee by an amount directly related to the
gross account performance. For example, on an account with a 0.5% fee, and gross performance of 20% over one year, the compounding
effect of the fee will result in performance of approximately 19.4%. A $10,000 initial investment would grow to approximately $14,256
gross of fees, versus $14,000 net of fees, over a two-year period.
FOR INSTITUTIONAL INVESTOR USE ONLY / NOT FOR PUBLIC VIEWING OR DISTRIBUTION
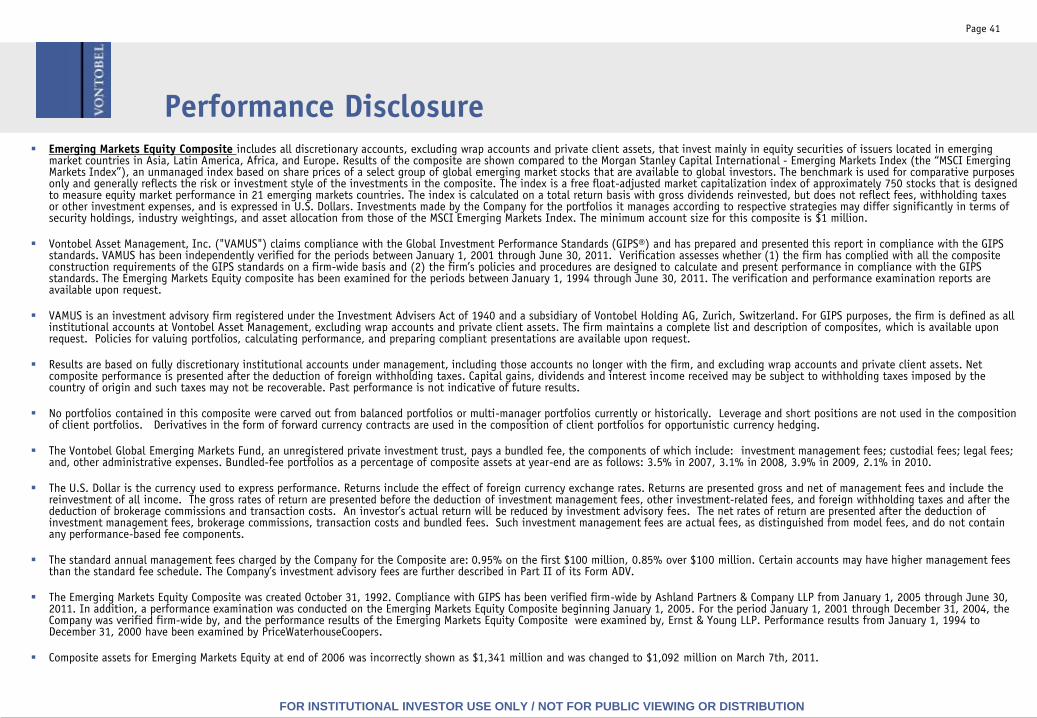
Performance Disclosure
Page 41
Emerging Markets Equity Composite includes all discretionary accounts, excluding wrap accounts and private client assets, that invest mainly in equity securities of issuers located in emerging market countries in Asia, Latin America, Africa, and Europe. Results of the composite are shown compared to the Morgan Stanley Capital International - Emerging Markets Index (the “MSCI Emerging Markets Index”), an unmanaged index based on share prices of a select group of global emerging market stocks that are available to global investors. The benchmark is used for comparative purposes only and generally reflects the risk or investment style of the investments in the composite. The index is a free float-adjusted market capitalization index of approximately 750 stocks that is designed to measure equity market performance in 21 emerging markets countries. The index is calculated on a total return basis with gross dividends reinvested, but does not reflect fees, withholding taxes or other investment expenses, and is expressed in U.S. Dollars. Investments made by the Company for the portfolios it manages according to respective strategies may differ significantly in terms of security holdings, industry weightings, and asset allocation from those of the MSCI Emerging Markets Index. The minimum account size for this composite is $1 million.
Vontobel Asset Management, Inc. ("VAMUS") claims compliance with the Global Investment Performance Standards (GIPS®) and has prepared and presented this report in compliance with the GIPS standards. VAMUS has been independently verified for the periods between January 1, 2001 through June 30, 2011. Verification assesses whether (1) the firm has complied with all the composite construction requirements of the GIPS standards on a firm-wide basis and (2) the firm’s policies and procedures are designed to calculate and present performance in compliance with the GIPS standards. The Emerging Markets Equity composite has been examined for the periods between January 1, 1994 through June 30, 2011. The verification and performance examination reports are available upon request.
VAMUS is an investment advisory firm registered under the Investment Advisers Act of 1940 and a subsidiary of Vontobel Holding AG, Zurich, Switzerland. For GIPS purposes, the firm is defined as all institutional accounts at Vontobel Asset Management, excluding wrap accounts and private client assets. The firm maintains a complete list and description of composites, which is available upon request. Policies for valuing portfolios, calculating performance, and preparing compliant presentations are available upon request.
Results are based on fully discretionary institutional accounts under management, including those accounts no longer with the firm, and excluding wrap accounts and private client assets. Net composite performance is presented after the deduction of foreign withholding taxes. Capital gains, dividends and interest income received may be subject to withholding taxes imposed by the country of origin and such taxes may not be recoverable. Past performance is not indicative of future results.
No portfolios contained in this composite were carved out from balanced portfolios or multi-manager portfolios currently or historically. Leverage and short positions are not used in the composition of client portfolios. Derivatives in the form of forward currency contracts are used in the composition of client portfolios for opportunistic currency hedging.
The Vontobel Global Emerging Markets Fund, an unregistered private investment trust, pays a bundled fee, the components of which include: investment management fees; custodial fees; legal fees; and, other administrative expenses. Bundled-fee portfolios as a percentage of composite assets at year-end are as follows: 3.5% in 2007, 3.1% in 2008, 3.9% in 2009, 2.1% in 2010.
The U.S. Dollar is the currency used to express performance. Returns include the effect of foreign currency exchange rates. Returns are presented gross and net of management fees and include the reinvestment of all income. The gross rates of return are presented before the deduction of investment management fees, other investment-related fees, and foreign withholding taxes and after the deduction of brokerage commissions and transaction costs. An investor’s actual return will be reduced by investment advisory fees. The net rates of return are presented after the deduction of investment management fees, brokerage commissions, transaction costs and bundled fees. Such investment management fees are actual fees, as distinguished from model fees, and do not contain any performance-based fee components.
The standard annual management fees charged by the Company for the Composite are: 0.95% on the first $100 million, 0.85% over $100 million. Certain accounts may have higher management fees than the standard fee schedule. The Company’s investment advisory fees are further described in Part II of its Form ADV.
The Emerging Markets Equity Composite was created October 31, 1992. Compliance with GIPS has been verified firm-wide by Ashland Partners & Company LLP from January 1, 2005 through June 30, 2011. In addition, a performance examination was conducted on the Emerging Markets Equity Composite beginning January 1, 2005. For the period January 1, 2001 through December 31, 2004, the Company was verified firm-wide by, and the performance results of the Emerging Markets Equity Composite were examined by, Ernst & Young LLP. Performance results from January 1, 1994 to December 31, 2000 have been examined by PriceWaterhouseCoopers.
Composite assets for Emerging Markets Equity at end of 2006 was incorrectly shown as $1,341 million and was changed to $1,092 million on March 7th, 2011.