Embed Size (px)
Citation preview
Page 1 Water Institute, University of South Florida
Hendrics West Lake
Methods
Study Area Analysis The watershed containing Hendrics West Lake was analyzed using ESRI ArcGIS 10.2.
Using this software with 2011 Hillsborough County aerial, Land Use/ Land Cover (LULC),
Landscape Development Intensity (LDI) Index values were calculated for the 100 meter buffer
surrounding the lake following the procedures of Reiss & Brown 2012(Reiss & Brown. 2012.
Landscape Development Intensity (LDI) Index User’s Manual. H.T. Odum Center for Wetlands,
University of Florida. March 2012). According to Reiss and Brown “The LDI represents a human
disturbance gradient for wetland systems. The LDI is an integrated measure of human activity,
combining the effects from air and water pollutants, physical damage, changes in the suite of
environmental conditions … on the structure and processes of landscapes and ecosystems…
Natural , undeveloped LU/LC classes have a LDI index value of zero. In the Florida framework,
the maximum LDI index score is approximately 42.”
Lake Bathymetry and Morphological Characteristics Assessment The Bathymetric Mapi provides the lake’s morphologic parameters in various units.
The bottom of the lake was mapped using a Lowrance HDS 5 Gen 2 Wide Area Augmentation
System (WAAS)ii enabled Global Positioning System (GPS) with fathometer (bottom sounder) to
determine the boat’s position, and bottom depth in a single measurement. The result is an
estimate of the lake’s area, mean and maximum depths, and volume and the creation of a
bottom contour map. Besides pointing out the deeper fishing holes in the lake, the morphologic
data derived from this part of the assessment can be valuable to overall management of the
lake vegetation as well as providing flood storage data for flood models.
i A bathymetric map is a map that accurately depicts all of the various depths of a water body. An accurate bathymetric map is important for effective herbicide application and can be an important tool when deciding which form of management is most appropriate for a water body. Lake volumes, hydraulic retention time and carrying capacity are important parts of lake management that require the use of a bathymetric map. ii WAAS is a form of differential GPS (DGPS) where data from 25 ground reference stations
located in the United States receive GPS signals form GPS satellites in view and retransmit these data to a master control site and then to geostationary satellites. For more information, see end note 2.

Page 2 Water Institute, University of South Florida
Lake Vegetation Index Assessment Hillsborough County requested the implementation of the Florida Department of Environmental
Protection methods for Lake Vegetation Index (LVI 1000)
(http://www.dep.state.fl.us/water/sas/sop/sops.htm) using forms FD 9000-03 (Physical/Chemical
Characterization), FD 9000-06 (Lake Habitat Assessment) FD 9000-27 (LVI Field Sheet) and FD 9000-31
(Lake Observation Field Sheet).
The Lake Vegetation Index (LVI) is a rapid assessment protocol in which selected sections of a
lake are assessed for the presence or absence of vegetation through visual observation and through the
use of a submerged vegetation sampling tool called a Frodus. The assessment results provide a list of
species presents and the dominant and where appropriate co-dominant species that are found in each
segment. These results are then entered into a scoring table and a final LVI score is determined. LVI
scores provide an estimate of the vegetative health of a lake. Our assessment team was trained and
qualified by FDEP to conduct these assessment as an independent team and must prequalify each year
prior to conducting additional assessments. The LVI method consists of dividing the lake into twelve pie-
shaped segments (see diagram below) and selecting a set of four segments from the twelve to include in
the LVI. The assessment team then travels across the segment and identifies all unique species of
aquatic plant present in the segment. Additionally, a Frodus is thrown at several points on a single five-
meter belt transect that is established in the center of the segment from a point along the shore to a
point beyond the submerged vegetation zone. For scoring, the threshold score for impairment is 37.
Four metrics are utilized in the Lake Vegetation Index Survey; Dominant Coefficient of
Conservatism (CoC), Percent Florida Exotic Pest Plant Council Type 1 (% FLEPPC), Percent Native Taxa,
Percent Sensitive Taxa.
The Dominant Coefficient of Conservatism (CoC) metric for the dominant or co-dominate
species in each section. The CoC applies a score of 0-10 to each species based on its ecological
tolerances and fidelity to pre-settlement conditions. Species with higher scores show a high fidelity to
native, undisturbed habitats and are typically sensitive to alterations. Available CoC scores can be
obtained from LT 7000 from the Florida Department of Environmental Protection at:
http://www.dep.state.fl.us/water/sas/sop/sops.htm.
The percent FLEPPC (Florida Exotic Pest Plant Council) Category 1 invasive exotic taxa in a single
sampling unit (pie slice) by dividing the number of FLEPPC Category I taxa by the total number of taxa in
that sampling unit. Multiply result times 100. Refer to Appendix LVI 1000-1 to determine which plants
are on the FLEPPC Category 1 list. Note that not all exotic taxa should be included in this metric, only
those listed in Appendix LVI 1000-1 as Category 1 FLEPPC. If the FLEPPC updates their list of Category 1
exotics, those updates shall not be reflected in this calculation until they are included in Appendix LVI
1000-1.
The percent native taxa in a single sampling unit (pie slice) is calculated by dividing the number
of native taxa by the total number of taxa in that sampling unit. Multiply result times 100. Nativity
status is determined by the Plant Atlas from the Institute for Systematic Botany, and is listed in

Page 3 Water Institute, University of South Florida
Appendix LVI 1000-1. For informational purposes, visit the website
http://www.florida.plantatlas.usf.edu/. Taxa that are native according to the Plant Atlas from the
Institute for Systematic Botany but are not on the list in Appendix LVI 1000-1 may be included in this
metric calculation, but inclusion of these additional taxa is not required.
The percent sensitive taxa in a single sampling unit by summing the number of taxa with a C of C
(Coefficient of Conservatism) score >= 7 and then dividing by the total number of taxa in that sampling
unit. Multiply result times 100. Refer to Appendix LVI 1000-1 for a list of C of C scores.
The collected bathymetric data is analyzed for submerged aquatic vegetation (SAV) calculations
including the percentage of the surface area of the lake inhabited by SAV as well as an estimate of the
percent volume of the lake inhabited by SAV. SAV is an important component to a lakes nutrient cycling
as well as chlorophyll concentrations due to the SAV and phytoplankton competing for available
nutrients in the water column. In addition SAV serves a vital role as habitat for many species of
macroinvertebrates and fish as well as substrate for epiphytic algae.
Water Quality Assessment Physical water quality samples were taken using a Eureka Manta Sub-2 multiprobe pre and post
calibrated on the day of the assessment. Measurements taken with this device include: depth,
conductivity, pH, Dissolved Oxygen (mg/l and % Saturation) and salinity. Chemical water parameters
were collected and preserved on ice by USF Water Institute staff and analyzed at the Environmental
Protection Commission of Hillsborough County Laboratory. Analysis include; Chlorophyll (a, b, c, t and
corrected), Alkalinity, Color, Fecal Coliform, Enterococci, Ammonia, Nitrates/Nitrites, Total Phosphorous,
Kjeldahl Nitrogen and Total Nitrogen. The results of the water quality sampling effort will be discussed in
the framework of the FDEP Numeric Nutrient Criteria
Page 4 Water Institute, University of South Florida
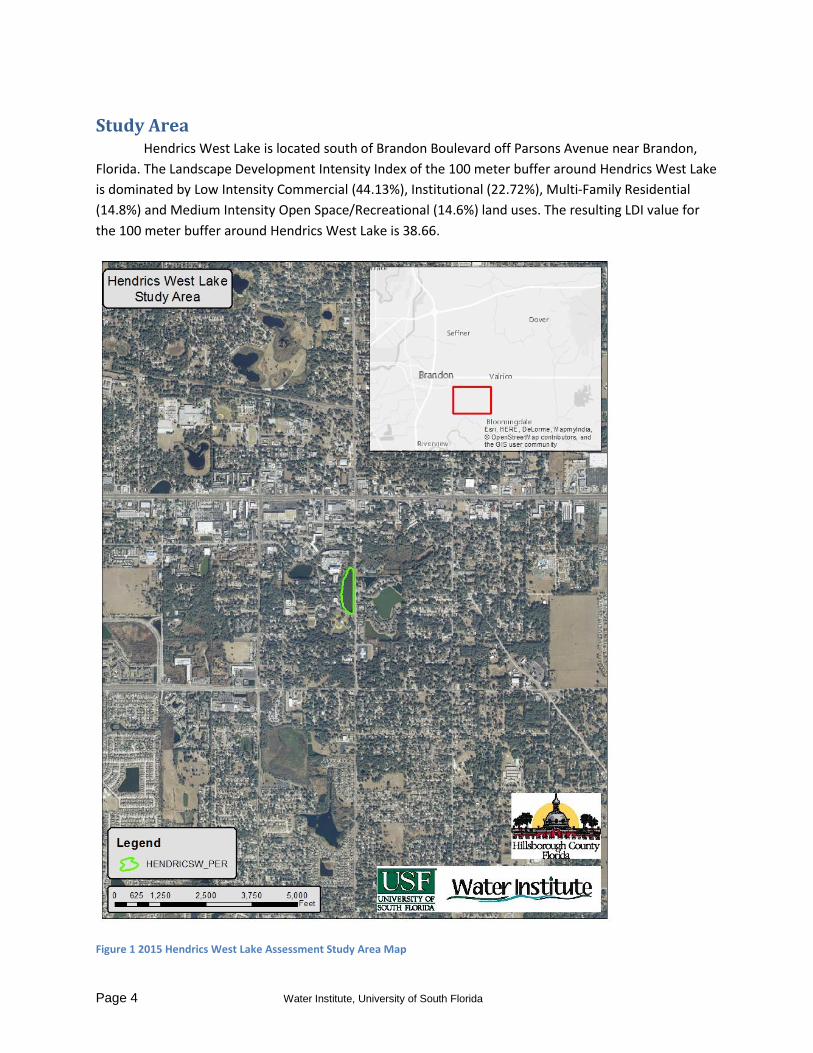
Study Area Hendrics West Lake is located south of Brandon Boulevard off Parsons Avenue near Brandon,
Florida. The Landscape Development Intensity Index of the 100 meter buffer around Hendrics West Lake
is dominated by Low Intensity Commercial (44.13%), Institutional (22.72%), Multi-Family Residential
(14.8%) and Medium Intensity Open Space/Recreational (14.6%) land uses. The resulting LDI value for
the 100 meter buffer around Hendrics West Lake is 38.66.
Figure 1 2015 Hendrics West Lake Assessment Study Area Map

Page 5 Water Institute, University of South Florida
Lake Bathymetry and Morphological Characterization Hendrics West Lake is a shallow system connected to Hendrics East Lake through a culvert under
Parsons Avenue. At the time of the assessment, Hendrics West Lake was experiencing moderately high
water levels resulting in a 6.57 acre water body. Hendrics West Lake at the time of the assessment had a
mean water depth of 2.30 feet and a maximum observed depth of 4.36 feet. The volume at this time
was approximately 4,919,959 gallons. Figure 2 shows the resulting bathymetric contour map for
Hendrics West Lake from data collected on July 27, 2015. The collected data has been overlain the 2011
Hillsborough County aerials.
Figure 2 2015 1-Foot Bathymetric Contour Map for Hendrics West Lake

Page 6 Water Institute, University of South Florida
Table 1 Morphological Calculations for Hendrics West Lake
Parameter Feet Meters Acres Acre-Ft Gallons
Surface Area (sq) 286,147 26,584 6.57 0 0
Mean Depth 2.30 0.70 0 0 0
Maximum Depth 4.36 1.33 0 0 0
Volume (cubic) 657,698 18,624 0 15.1 4,919,959
Gauge (relative) 32.2 9.81 0 0 0
Lake Vegetation Index Assessment
Figure 3 Overview photograph of Hendrics West Lake
The lake assessment for Hendrics West Lake was conducted on July 27, 2015. Hendrics West
Lake received a lake habitat assessment (FEDP form FD 9000-6) score of 47 due to suboptimal scores for
Vegetation Quality. Marginal scores were achieved for Secchi, Stormwater Inputs and Adverse
Watershed Land Use. Bottom Substrate Quality, Lakeside Adverse Human Alterations and Upland Buffer
Zone received poor scores.
Page 7 Water Institute, University of South Florida
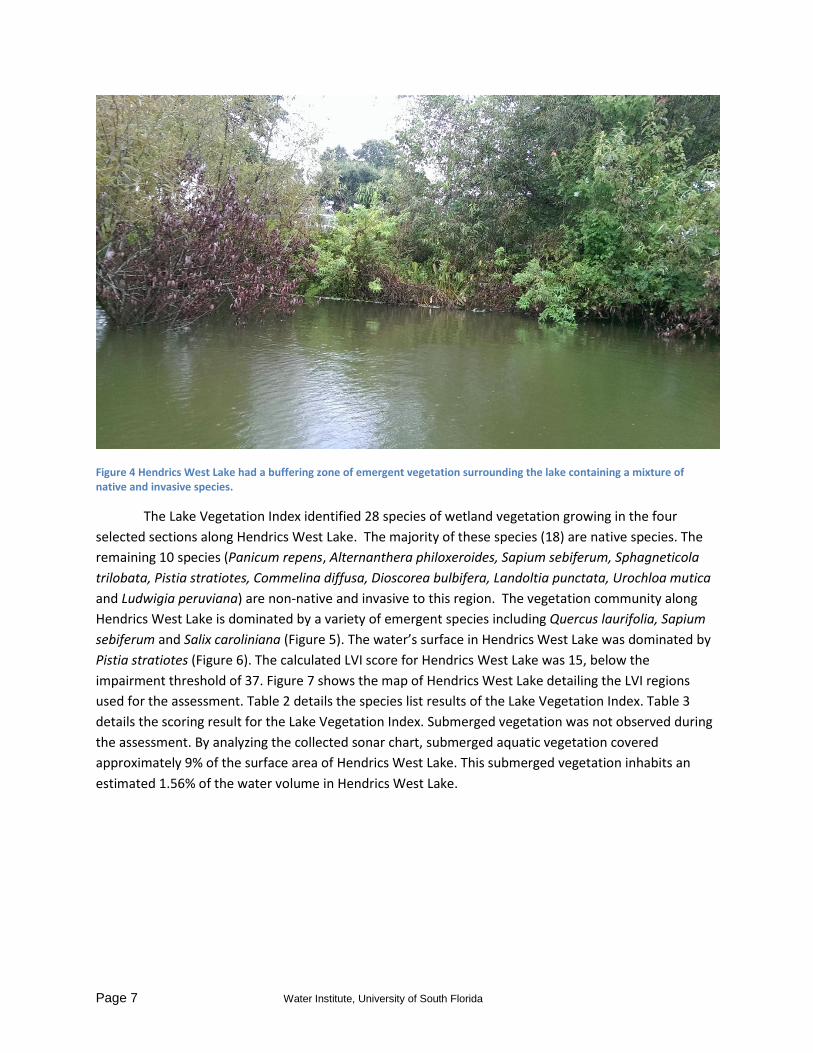
Figure 4 Hendrics West Lake had a buffering zone of emergent vegetation surrounding the lake containing a mixture of native and invasive species.
The Lake Vegetation Index identified 28 species of wetland vegetation growing in the four
selected sections along Hendrics West Lake. The majority of these species (18) are native species. The
remaining 10 species (Panicum repens, Alternanthera philoxeroides, Sapium sebiferum, Sphagneticola
trilobata, Pistia stratiotes, Commelina diffusa, Dioscorea bulbifera, Landoltia punctata, Urochloa mutica
and Ludwigia peruviana) are non-native and invasive to this region. The vegetation community along
Hendrics West Lake is dominated by a variety of emergent species including Quercus laurifolia, Sapium
sebiferum and Salix caroliniana (Figure 5). The water’s surface in Hendrics West Lake was dominated by
Pistia stratiotes (Figure 6). The calculated LVI score for Hendrics West Lake was 15, below the
impairment threshold of 37. Figure 7 shows the map of Hendrics West Lake detailing the LVI regions
used for the assessment. Table 2 details the species list results of the Lake Vegetation Index. Table 3
details the scoring result for the Lake Vegetation Index. Submerged vegetation was not observed during
the assessment. By analyzing the collected sonar chart, submerged aquatic vegetation covered
approximately 9% of the surface area of Hendrics West Lake. This submerged vegetation inhabits an
estimated 1.56% of the water volume in Hendrics West Lake.

Page 8 Water Institute, University of South Florida
Figure 5 Salix caroliniana on Hendrics West Lake
Figure 6 Pistia stratiotes on Hendrics West Lake

Page 9 Water Institute, University of South Florida
Figure 7 Lake Vegetation Index region map for Hendrics West Lake
Page 10 Water Institute, University of South Florida
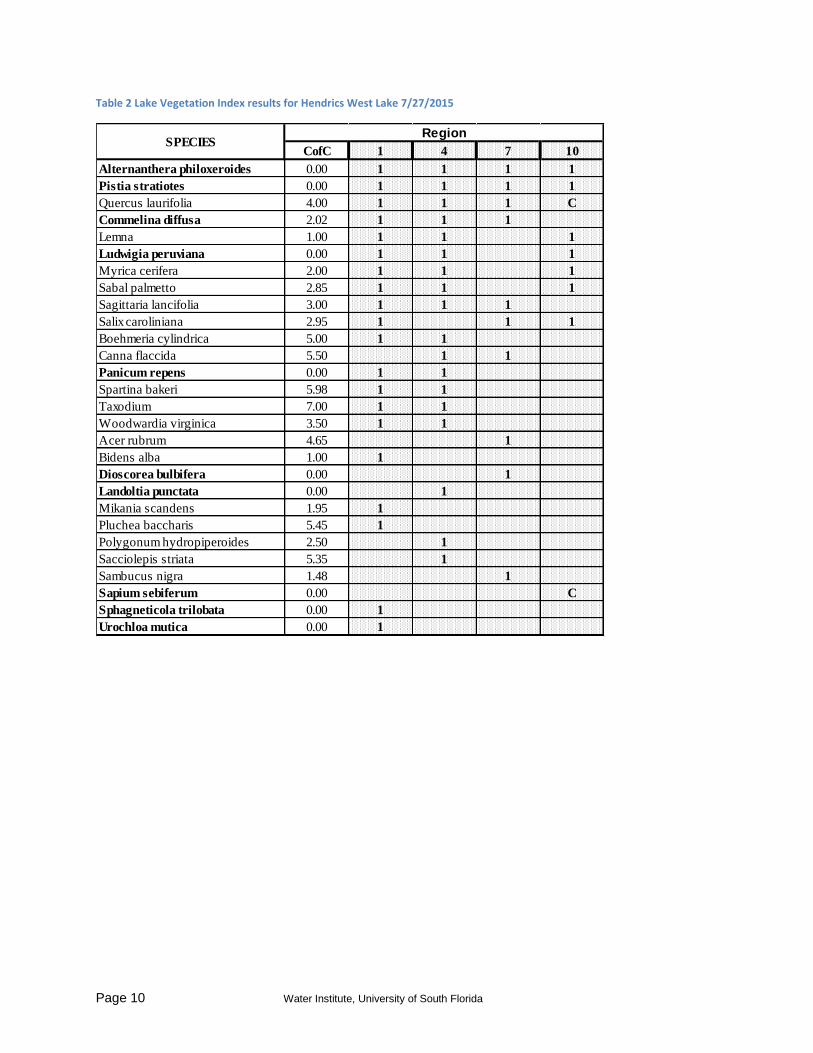
Table 2 Lake Vegetation Index results for Hendrics West Lake 7/27/2015
CofC 1 4 7 10
Alternanthera philoxeroides 0.00 1 1 1 1
Pistia stratiotes 0.00 1 1 1 1
Quercus laurifolia 4.00 1 1 1 C
Commelina diffusa 2.02 1 1 1
Lemna 1.00 1 1 1
Ludwigia peruviana 0.00 1 1 1
Myrica cerifera 2.00 1 1 1
Sabal palmetto 2.85 1 1 1
Sagittaria lancifolia 3.00 1 1 1
Salix caroliniana 2.95 1 1 1
Boehmeria cylindrica 5.00 1 1
Canna flaccida 5.50 1 1
Panicum repens 0.00 1 1
Spartina bakeri 5.98 1 1
Taxodium 7.00 1 1
Woodwardia virginica 3.50 1 1
Acer rubrum 4.65 1
Bidens alba 1.00 1
Dioscorea bulbifera 0.00 1
Landoltia punctata 0.00 1
Mikania scandens 1.95 1
Pluchea baccharis 5.45 1
Polygonum hydropiperoides 2.50 1
Sacciolepis striata 5.35 1
Sambucus nigra 1.48 1
Sapium sebiferum 0.00 C
Sphagneticola trilobata 0.00 1
Urochloa mutica 0.00 1
SPECIESRegion

Page 11 Water Institute, University of South Florida
Table 3 Scoring Summary for the Lake Vegetation Index
1 4 7 10
Total # of taxa in sampling unit 20 18 10 9
% Native taxa in sampling unit 65 66.66667 60 55.55556
% FLEPPC CAT 1 taxa in sampling unit 20 16.66667 20 33.33333
% Sensitive taxa in sample unit 5 5.555556 0 0
Dominant CoC in sample unit NULL NULL NULL 2
Native Score ((x-62.5)/37.5) or ((x-66.67)/25.89)= 0 0 0 0
Invasive FLEPPC 1 Score (1 - (x/30))= 0.333333 0.444444 0.333333 0
Sensitive Score (x/(27.78 or 20)) = 0.25 0.277778 0 0
Dominant CoC Score (x/(7.91 or 7)) = 0 0 0 0.285714
Raw Score Total = N+I+S+D = 0.583333 0.722222 0.333333 0.285714
Division Factor = (3 D=0 or 4) = 3 3 3 4
Average LVI dividend = Raw /DF 0.194444 0.240741 0.111111 0.071429
South
LVI Score for sampling unit = 19.44444 24.07407 11.11111 7.142857
Total LVI SCORE = 15
LVI Score SummaryRegion
Page 12 Water Institute, University of South Florida
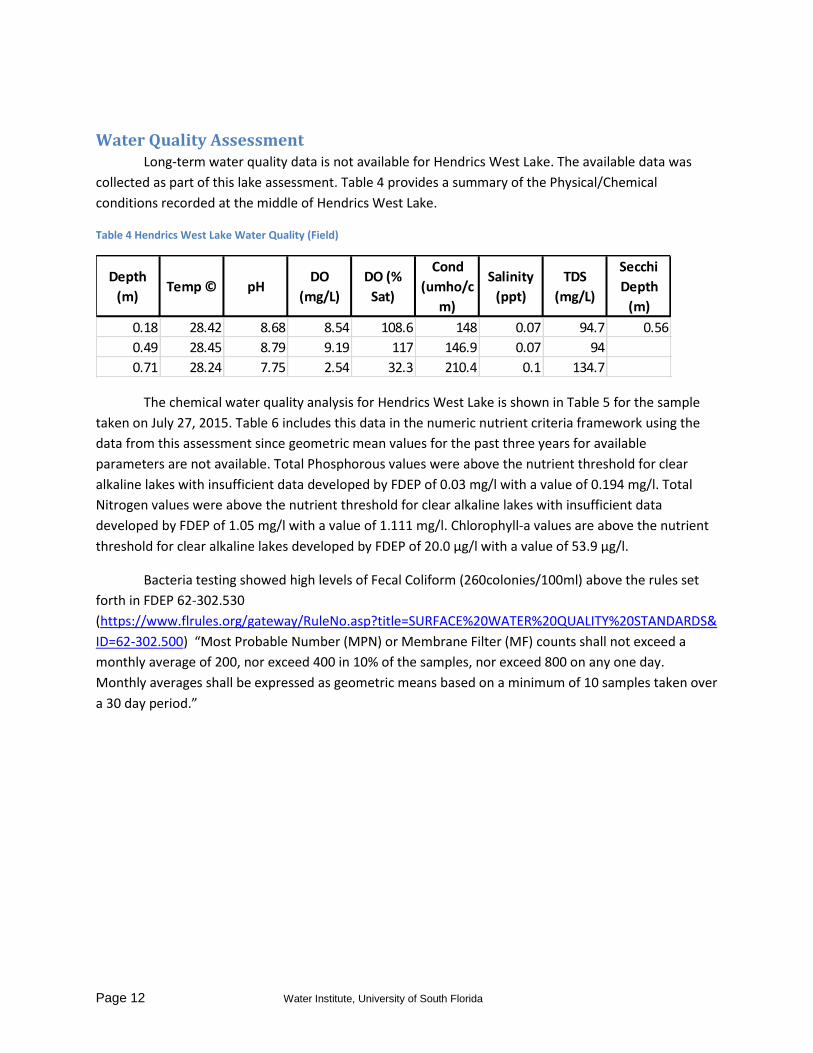
Water Quality Assessment Long-term water quality data is not available for Hendrics West Lake. The available data was
collected as part of this lake assessment. Table 4 provides a summary of the Physical/Chemical
conditions recorded at the middle of Hendrics West Lake.
Table 4 Hendrics West Lake Water Quality (Field)
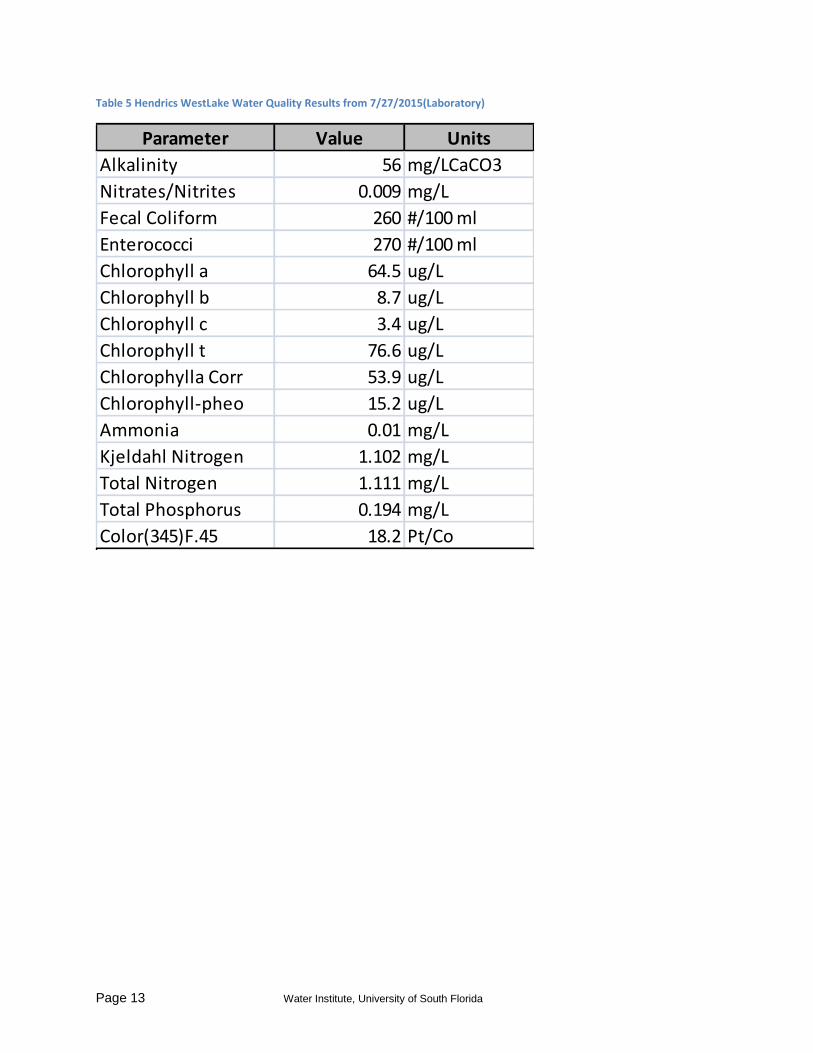
The chemical water quality analysis for Hendrics West Lake is shown in Table 5 for the sample
taken on July 27, 2015. Table 6 includes this data in the numeric nutrient criteria framework using the
data from this assessment since geometric mean values for the past three years for available
parameters are not available. Total Phosphorous values were above the nutrient threshold for clear
alkaline lakes with insufficient data developed by FDEP of 0.03 mg/l with a value of 0.194 mg/l. Total
Nitrogen values were above the nutrient threshold for clear alkaline lakes with insufficient data
developed by FDEP of 1.05 mg/l with a value of 1.111 mg/l. Chlorophyll-a values are above the nutrient
threshold for clear alkaline lakes developed by FDEP of 20.0 µg/l with a value of 53.9 µg/l.
Bacteria testing showed high levels of Fecal Coliform (260colonies/100ml) above the rules set
forth in FDEP 62-302.530
(https://www.flrules.org/gateway/RuleNo.asp?title=SURFACE%20WATER%20QUALITY%20STANDARDS&
ID=62-302.500) “Most Probable Number (MPN) or Membrane Filter (MF) counts shall not exceed a
monthly average of 200, nor exceed 400 in 10% of the samples, nor exceed 800 on any one day.
Monthly averages shall be expressed as geometric means based on a minimum of 10 samples taken over
a 30 day period.”
Depth
(m)Temp © pH
DO
(mg/L)
DO (%
Sat)
Cond
(umho/c
m)
Salinity
(ppt)
TDS
(mg/L)
Secchi
Depth
(m)
0.18 28.42 8.68 8.54 108.6 148 0.07 94.7 0.56
0.49 28.45 8.79 9.19 117 146.9 0.07 94
0.71 28.24 7.75 2.54 32.3 210.4 0.1 134.7
Page 13 Water Institute, University of South Florida
Table 5 Hendrics WestLake Water Quality Results from 7/27/2015(Laboratory)
Parameter Value Units
Alkalinity 56 mg/LCaCO3
Nitrates/Nitrites 0.009 mg/L
Fecal Coliform 260 #/100 ml
Enterococci 270 #/100 ml
Chlorophyll a 64.5 ug/L
Chlorophyll b 8.7 ug/L
Chlorophyll c 3.4 ug/L
Chlorophyll t 76.6 ug/L
Chlorophylla Corr 53.9 ug/L
Chlorophyll-pheo 15.2 ug/L
Ammonia 0.01 mg/L
Kjeldahl Nitrogen 1.102 mg/L
Total Nitrogen 1.111 mg/L
Total Phosphorus 0.194 mg/L
Color(345)F.45 18.2 Pt/Co

Page 14 Water Institute, University of South Florida
Table 6 Numeric Nutrient Criteria Framework
Parameter Value
Geometric Mean (Geomean) Color (pcu) 18.2
Number of Samples 1
Geometric Mean Alkalinity (mg/L CACO3) 56
Number of Samples 1
Lake Type Clear Alkaline
Chlorophyll a Criteria (ug/L) 20
Insufficient for Geomean Criteria then P mg/L 0.03
Insuffcient for Geomean Criteria then N mg/L 1.05
Geomean Chla ug/L 53.9
Geomean TP mg/L 0.194
Geomean TN mg/L 1.111
Number of Samples 1
Potential Impaired Chlorophyll a Impaired
Potential Impaired TP Impaired
Potential Impaired TN Impaired
Conclusion The results of the assessment of Hendrics West Lake shows impairment based on Total
Nitrogen, Total Phosphorous and Chlorophyll-a concentrations according to the FDEP numeric nutrient
criteria using the single sample taken during this assessment. Long term sampling would be necessary to
determine actual NNC values. The system also shows impairment in the vegetation communities
according to the Lake Vegetation Index with low overall species, high occurrences of non-native,
invasive species and a single sensitive plant species with an overall LVI score of 15. Bacteria sampling
also revealed elevated biomass of Fecal Coliform bacteria present at the time of the assessment.