Embed Size (px)
Citation preview
Henry County Public Service Authority
Comprehensive Annual Financial Report
Years Ended June 30, 2010 and 2009
Creedle, Jones
& Alga, P.C. Certified Public Accountants
Henry County Public Service Authority
Table of Contents
Years Ended June 30, 2010 and 2009
Pages
Independent Auditor’s Report i-ii Management’s Discussion and Analysis 1-5
FINANCIAL STATEMENTS Exhibits A Statements of Net Assets 6 B Statements of Activities 7 C Statements of Cash Flows 8 D Statement of Fiduciary Assets and Liabilities 9 Notes to Financial Statements 10-23
OTHER SUPPLEMENTARY INFORMATION Schedule 1 Schedule of Revenues and Expenses – Budget to Actual – Non-GAAP Budgetary Basis 24
OTHER INFORMATION Tables 1 Revenues by Source – Last Ten Fiscal Years 25 2 Expenses by Function – Last Ten Fiscal Years 25 3 Revenue Bond Debt Service Coverage – Last Ten Fiscal Years 26 4 Schedule of Insurance in Force 27 5 Raw Water Production by Source (In Million Gallons) – Last Ten Fiscal Years 28 6 Waste Water Treatment by Plant (In Million Gallons) – Last Ten Fiscal Years 28 7 Demographic Statistics – Last Ten Fiscal Years 29 8 List of Ten Largest Customers 30 9 Miscellaneous Statistical Data 31

Pages
COMPLIANCE Report on Internal Control Over Financial Reporting and on Compliance and Other Matters Based on an Audit of Financial Statements Performed in Accordance with Government Auditing Standards 32-33

i
P. O. Box 1113 P. O. Box 487 410 North Ridge Road P. O. Box 147
204 S. Main Street 828 N. Mecklenburg Avenue Suite 215 313 N. Main Street
Emporia, Virginia 23847 South Hill, Virginia 23970 Richmond, Virginia 23229 Lawrenceville, Virginia 23868
434-634-3111 FAX: 434-634-6895 434-447-7111 FAX: 434-447-5793 804-837-1638 434-848-4191 FAX: 434-848-1009
www.cja-cpa.com
A Professional Corporation
Creedle
Jones
& Alga
James A. Allen, Jr., CPA Nadine L. Chase, CPA
Nadia A. Rogers, CPA
Scott A. Thompson, CPA
INDEPENDENT AUDITOR’S REPORT
To the Board of Directors Henry County Public Service Authority Collinsville, Virginia
We have audited the accompanying financial statements of the governmental activities and the business-type activities of Henry County Public Service Authority, as of and for the year ended June 30, 2010, which collectively comprise the Authority’s basic financial statements as listed in the table of contents. These financial statements are the responsibility of Henry County Public Service Authority’s management. Our responsibility is to express opinions on these financial statements based on our audit. We conducted our audit in accordance with auditing standards generally accepted in the United States of America and the standards applicable to financial audits contained in Government Auditing Standards, issued by the Comptroller General of the United States, and Specifications for Audit of Industrial Development Authorities issued by the Auditor of Public Accounts of the Commonwealth of Virginia. Those standards and specifications require that we plan and perform the audit to obtain reasonable assurance about whether the financial statements are free of material misstatement. An audit includes examining, on a test basis, evidence supporting the amounts and disclosures in the financial statements. An audit also includes assessing the accounting principles used and the significant estimates made by management, as well as evaluating the overall financial statement presentation. We believe that our audit provides a reasonable basis for our opinions. In our opinion, the financial statements referred to above present fairly, in all material respects, the respective financial position of governmental activities and the business-type activities of the Henry County Public Service Authority, as of June 30, 2010, and the respective changes in financial position, and cash flows, where applicable, thereof for the year then ended in conformity with accounting principles generally accepted in the United States of America. In accordance with Government Auditing Standards, we have also issued our report dated November 23, 2010, on our consideration of the Henry County Public Service Authority’s internal control over financial reporting and on our tests of its compliance with certain provisions of laws, regulations, contracts, and grant agreements and other matters. The purpose of that report is to describe the scope of our testing of internal control over financial reporting and compliance and the results of that testing and not to provide an opinion on the internal control over financial reporting or on compliance. That report is an integral part of an audit performed in accordance with Government Auditing Standards and should be considered in assessing the results of our audit.
Sherwood H. Creedle, CPA
Robin B. Jones, CPA, CFP
David V. Alga, CPA, CVA, CFF
Denise C. Williams, CPA, CSEP
Members of
American Institute of Certified Public Accountants
Virginia Society of Certified Public Accountants

ii
Henry County Public Service Authority Page 2 Accounting principles generally accepted in the United States of America require that the management’s discussion and analysis and budgetary comparison information on pages 1 through 5 and 24 be presented to supplement the basic financial statements. Such information, although not a part of the basic financial statements, is required by the Governmental Accounting Standards Board, who considers it to be an essential part of financial reporting for placing the basic financial statements in an appropriate operational, economic, or historical context. We have applied certain limited procedures to the required supplementary information in accordance with auditing standards generally accepted in the United States of America, which consisted of inquiries of management about the methods of preparing the information and comparing the information for consistency with management’s responses to our inquiries, the basic financial statements, and other knowledge we obtained during our audit of the basic financial statements. We do not express an opinion or provide any assurance on the information because the limited procedures do not provide us with sufficient evidence to express an opinion or provide any assurance.
Creedle, Jones & Alga, P.C. Certified Public Accountants South Hill, Virginia November 23, 2010

1
Henry County Public Service Authority
Management’s Discussion and Analysis
As of June 30, 2010
Our discussion and analysis of the Henry County Public Service Authority’s financial performance provides an overview of the Authority’s financial activities for the fiscal year ended June 30, 2010. Please read this information in conjunction with Henry County Public Service Authority’s financial statements. OVERVIEW OF THE FINANCIAL STATEMENTS
The Henry County Public Service Authority (the “Authority”) presents three basic financial statements. These are: (1) Statements of Net Assets; (2) Statements of Activities; and (3) Statements of Cash Flows.
Our financial position is measured in terms of resources (assets) we own and obligations (liabilities) we owe on a given date. This information is reported on the Statements of Net Assets, which reflects the Authority’s assets in relation to its debt to creditors. The excess of our assets over liabilities is our equity, or net assets.
Information regarding the results of our operation during the years is reported in the Statements of Activities. These statements show how much our overall net assets increased or decreased during the year as a result of our operations and for other reasons.
Our Statements of Cash Flows disclose the flow of cash resources into and out of the Authority during the year (from fees and grants) and how we applied those funds (incentive payments and payment of expenses). SUMMARY OF ORGANIZATION AND BUSINESS The Henry County Public Service Authority is a public body organized and created under the Virginia Water and Waste Authorities Act of the Code of Virginia of 1950 as amended. The Henry County Board of Supervisors created the Authority in 1965. The purpose of the Authority is to "acquire, construct, improve, extend, operate, and maintain a water and sewage disposal system." The Authority is governed by six citizen members appointed by the Henry County Board of Supervisors to four-year staggered terms. In 1974, the Authority and neighboring City of Martinsville (the "City") signed a service agreement in which the Authority would purchase sewage treatment from the City. In 1982, the Authority signed a service agreement with the City to purchase water treatment from the City. These agreements require the Authority to share in the annual operating costs of the plants in proportion to its actual use as measured by the volume of water used and sewage it contributed. It also allowed for the Authority to purchase capacity rights into the water and sewer plants at an agreed-upon price. The Authority's infrastructure assets consist of one water treatment plant (owned by Henry County and leased to the Authority), approximately 342 miles of water lines and 391 miles of interceptor sewers, and several pump stations. The collection system, consisting of mains and laterals, is owned and maintained by the Authority. The last remaining waste water plant was converted to a pumping station and was completed in December 2005. The Authority has no taxing power. The revenues of the Authority are derived from water and sewage disposal charges based on metered and unmetered water consumption of the Authority's users of the system.

2
FINANCIAL SUMMARY Financial Position
A summary of the Authority’s Statements of Net Assets for 2010 and 2009 is presented below:
2010 2009 $ Change % Change
Current Assets 6,876,745$ 6,519,272$ 357,473$ 5.48%
Net Capital Assets 74,866,628 76,597,237 (1,730,609) -2.26%
Other Noncurrent Assets 8,321,998 8,278,185 43,813 0.53%
Total Assets 90,065,371$ 91,394,694$ (1,329,323)$ -1.45%
Total Liabilities 37,669,861$ 40,356,935$ (2,687,074)$ -6.66%
Net Assets
Invested in capital assets 40,572,037 39,997,336 574,701 1.44%
Restricted for debt 7,571,990 7,419,606 152,384 2.05%
Unrestricted 4,251,483 3,620,817 630,666 17.42%
Total Net Assets 52,395,510 51,037,759 1,357,751 2.66%-
Total Liabilities and Net Assets 90,065,371$ 91,394,694$ (1,329,323)$ -1.45%
Change in Net Assets
A summary of the Authority’s Statements of Revenues, Expenses, and Changes in Net Assets for 2010 and 2009 is presented below:
2010 2009 $ Change % Change
Operating Revenues 11,124,973$ 11,151,447$ (26,474)$ -0.24%
Operating Expenses (9,300,215) (9,350,862) 50,647 -0.54%
Operating Income 1,824,758 1,800,585 24,173 1.34%
Non-Operating Revenue 453,285 479,495 (26,210) -5.47%
Gain (Loss) on Sale of Properties 72,863 2,297 70,566 100.00%
Non-Operating Expense (1,826,122) (1,863,496) 37,374 -2.01%-$ #DIV/0!
Income Before Contributions 524,784 418,881 105,903 25.28%
Capital Contributions 832,967 802,086 30,881 3.85%
Changes in Net Assets 1,357,751$ 1,220,967$ 136,784$ 11.20%
Condensed Statements of Revenues, Expenses,
and Changes in Net Assets
During the year, the Authority’s net operating income was $1,824,758. The Authority had non-operating revenues and expenses in the form of interest income and sale of assets, which amounted to $526,148 and interest expense amounting to $1,826,122. Operating expenses of $9,300,215 included all expenses necessary to operate the Authority's water and sewer facilities.
Net assets increased $1,357,751 in 2010 as compared to an increase of $1,220,967 in 2009.

3
Cash Flows
A summary of the Authority’s Statements of Cash Flows for 2010 and 2009 is presented below:
2010 2009
Cash Provided by (Used in)
Operating activities 4,685,030$ 4,489,836$
Capital and related financing activities (4,696,892) (6,519,378)
Investing activities 373,764 1,508,182
Net Increase (Decrease) in Cash 361,902$ (521,360)$
Condensed Statement of Cash Flows
Cash flows from capital and related financing activities consist of purchases of fixed assets and payments related to debt.
Cash flows from operating activities consist of receipts from customers and grants less
operating expenses, creating a positive cash flow. During fiscal year 2010, there was an increase of $361,902 in cash as compared to a
decrease of $521,360 in 2009. Capital Assets
As of June 30, 2010, the Authority’s investment in capital assets totals $40,572,037 which is net capital assets less related debt.
During fiscal year 2010, the Authority’s net capital assets (including additions, decreases, and depreciation) decreased $1,730,609 as summarized below:
Balance Net Additions Balance
June 30, 2009 and Deletions June 30, 2010
Land and land improvements 361,554$ 93,117$ 454,671$
Construction in progress 1,159,684 (588,432) 571,252
Building and leasehold improvements 767,274 555,637 1,322,911
Water and sewer system 123,053,395 1,073,891 124,127,286
Trucks and autos 1,643,780 77,419 1,721,199
Office equipment 365,330 43,162 408,492
Total Capital Assets 127,351,017 1,254,794 128,605,811
Less: Accumulated depreciation (50,753,780) (2,985,403) (53,739,183)
Total Capital Assets, Net 76,597,237$ (1,730,609)$ 74,866,628$
Change in Capital Assets
Long-Term Debt
As of June 30, 2010, the Authority’s long-term debt totals $35,358,463.

4
The Authority’s long-term debt is presented as follows:
Balance Net Additions Balance
June 30, 2009 and Deletions June 30, 2010
Long-term notes 37,458,480$ (2,413,880)$ 35,044,600$
Compensated absences 319,038 (5,175) 313,863
37,777,518$ (2,419,055)$ 35,358,463$
Change in Long-Term Debt
GENERAL TRENDS AND SIGNIFICANT EVENTS
The Authority's service area in Henry County has the potential for growth. The County is
over two hundred years old and has available land that continues to be developed. Growth from
new development is not expected to significantly increase the Authority's water and sewage
disposal revenues in any given year.
It is anticipated that the small growth trend in customer connections will continue to
increase as the amount of undeveloped land is developed.
FINANCIAL CONDITION
The Authority's financial condition remained good at year end with adequate liquid assets
and a reasonable level of unrestricted net assets. The current financial condition, staff
capabilities, operating plans, and upgrade plans to meet future water quality requirements are
well balanced and under control.
Total assets decreased by $1,329,323 or 1.5 percent, while net assets increased by
$1,357,751. Accounts receivable-net at year end were $977,532 compared to $1,044,590 for
fiscal year 2009. The reserve for bad debts equals all accounts over 90 days past due. The bad
debt charge for 2010 and 2009 was $36,058 and $24,138, respectively. Recovery of bad debts
previously written off amounted to $9,190 and $7,804 in 2010 and 2009, respectively.
RESULTS OF OPERATIONS
The Authority's main revenues fall into the categories of operating revenues, interest
income, and capital contributions. Revenues, including capital contributions, totaled $12,484,088
compared to $12,435,325 last year, a 0.4 percent decrease.
DEBT
At year end, the Authority had $35,358,463 in long-term debt with $2,543,070 (including
the deferred amounts) coming due in 2011. More detailed information about the Authority's long-
term debt is presented in Note 7 to the financial statements.
5
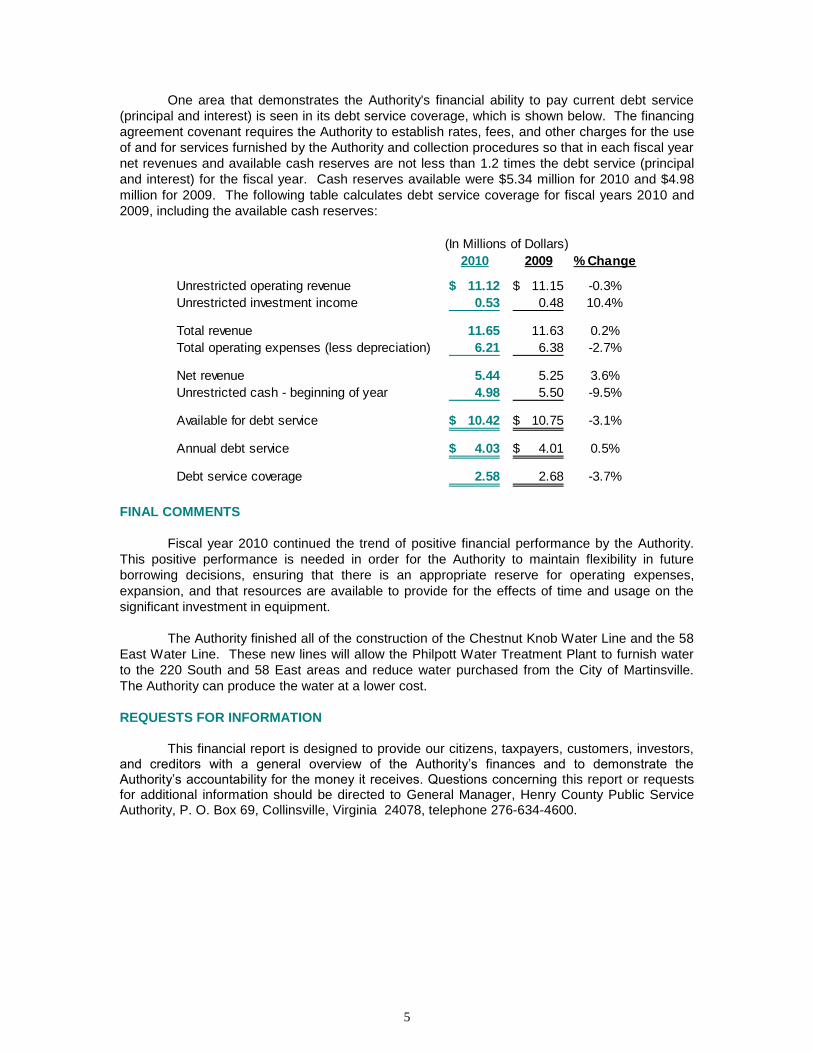
One area that demonstrates the Authority's financial ability to pay current debt service
(principal and interest) is seen in its debt service coverage, which is shown below. The financing
agreement covenant requires the Authority to establish rates, fees, and other charges for the use
of and for services furnished by the Authority and collection procedures so that in each fiscal year
net revenues and available cash reserves are not less than 1.2 times the debt service (principal
and interest) for the fiscal year. Cash reserves available were $5.34 million for 2010 and $4.98
million for 2009. The following table calculates debt service coverage for fiscal years 2010 and
2009, including the available cash reserves:
2010 2009 % Change
Unrestricted operating revenue 11.12$ 11.15$ -0.3%
Unrestricted investment income 0.53 0.48 10.4%
Total revenue 11.65 11.63 0.2%
Total operating expenses (less depreciation) 6.21 6.38 -2.7%
Net revenue 5.44 5.25 3.6%
Unrestricted cash - beginning of year 4.98 5.50 -9.5%
Available for debt service 10.42$ 10.75$ -3.1%
Annual debt service 4.03$ 4.01$ 0.5%
Debt service coverage 2.58 2.68 -3.7%
(In Millions of Dollars)
FINAL COMMENTS
Fiscal year 2010 continued the trend of positive financial performance by the Authority.
This positive performance is needed in order for the Authority to maintain flexibility in future
borrowing decisions, ensuring that there is an appropriate reserve for operating expenses,
expansion, and that resources are available to provide for the effects of time and usage on the
significant investment in equipment.
The Authority finished all of the construction of the Chestnut Knob Water Line and the 58
East Water Line. These new lines will allow the Philpott Water Treatment Plant to furnish water
to the 220 South and 58 East areas and reduce water purchased from the City of Martinsville.
The Authority can produce the water at a lower cost.
REQUESTS FOR INFORMATION
This financial report is designed to provide our citizens, taxpayers, customers, investors,
and creditors with a general overview of the Authority’s finances and to demonstrate the Authority’s accountability for the money it receives. Questions concerning this report or requests for additional information should be directed to General Manager, Henry County Public Service Authority, P. O. Box 69, Collinsville, Virginia 24078, telephone 276-634-4600.

FINANCIAL STATEMENTS
6
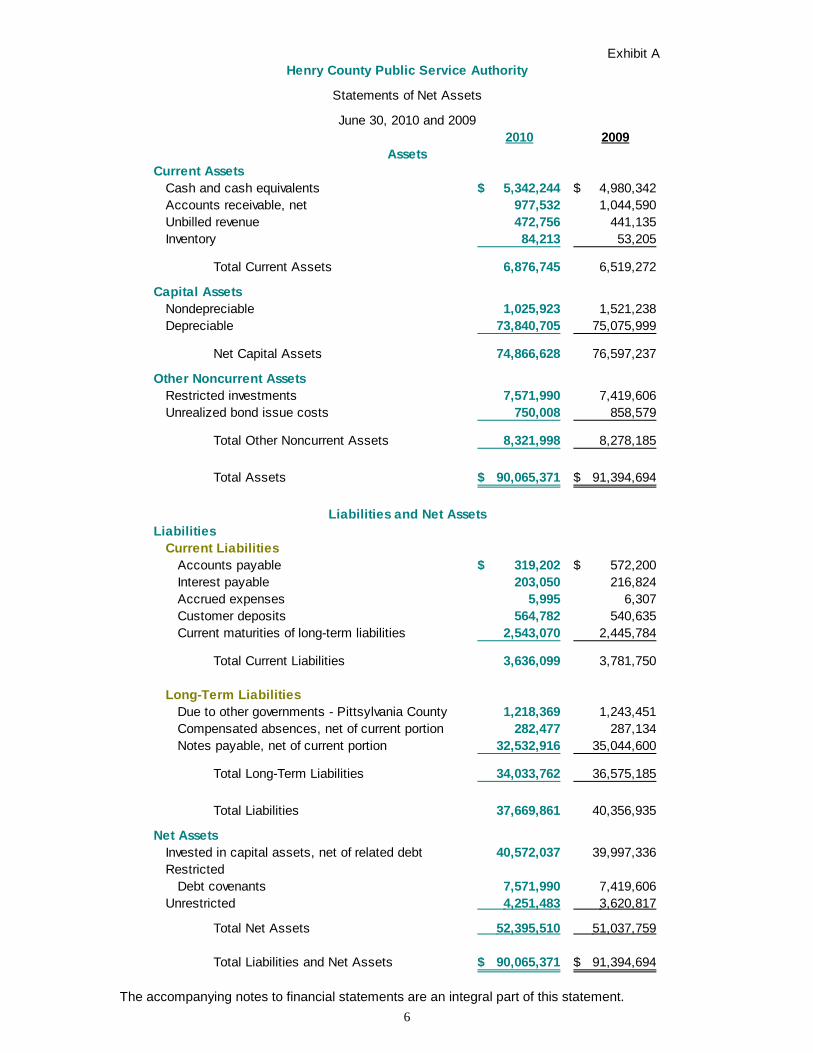
Exhibit A
2010 2009
Current Assets
Cash and cash equivalents 5,342,244$ 4,980,342$
Accounts receivable, net 977,532 1,044,590
Unbilled revenue 472,756 441,135
Inventory 84,213 53,205
Total Current Assets 6,876,745 6,519,272
Capital Assets
Nondepreciable 1,025,923 1,521,238
Depreciable 73,840,705 75,075,999
Net Capital Assets 74,866,628 76,597,237
Other Noncurrent Assets
Restricted investments 7,571,990 7,419,606
Unrealized bond issue costs 750,008 858,579
Total Other Noncurrent Assets 8,321,998 8,278,185
Total Assets 90,065,371$ 91,394,694$
Liabilities
Current Liabilities
Accounts payable 319,202$ 572,200$
Interest payable 203,050 216,824
Accrued expenses 5,995 6,307
Customer deposits 564,782 540,635
Current maturities of long-term liabilities 2,543,070 2,445,784
Total Current Liabilities 3,636,099 3,781,750
Long-Term Liabilities
Due to other governments - Pittsylvania County 1,218,369 1,243,451
Compensated absences, net of current portion 282,477 287,134
Notes payable, net of current portion 32,532,916 35,044,600
Total Long-Term Liabilities 34,033,762 36,575,185
Total Liabilities 37,669,861 40,356,935
Net Assets
Invested in capital assets, net of related debt 40,572,037 39,997,336
Restricted
Debt covenants 7,571,990 7,419,606
Unrestricted 4,251,483 3,620,817
Total Net Assets 52,395,510 51,037,759
Total Liabilities and Net Assets 90,065,371$ 91,394,694$
Liabilities and Net Assets
Henry County Public Service Authority
Statements of Net Assets
June 30, 2010 and 2009
Assets
The accompanying notes to financial statements are an integral part of this statement.
7
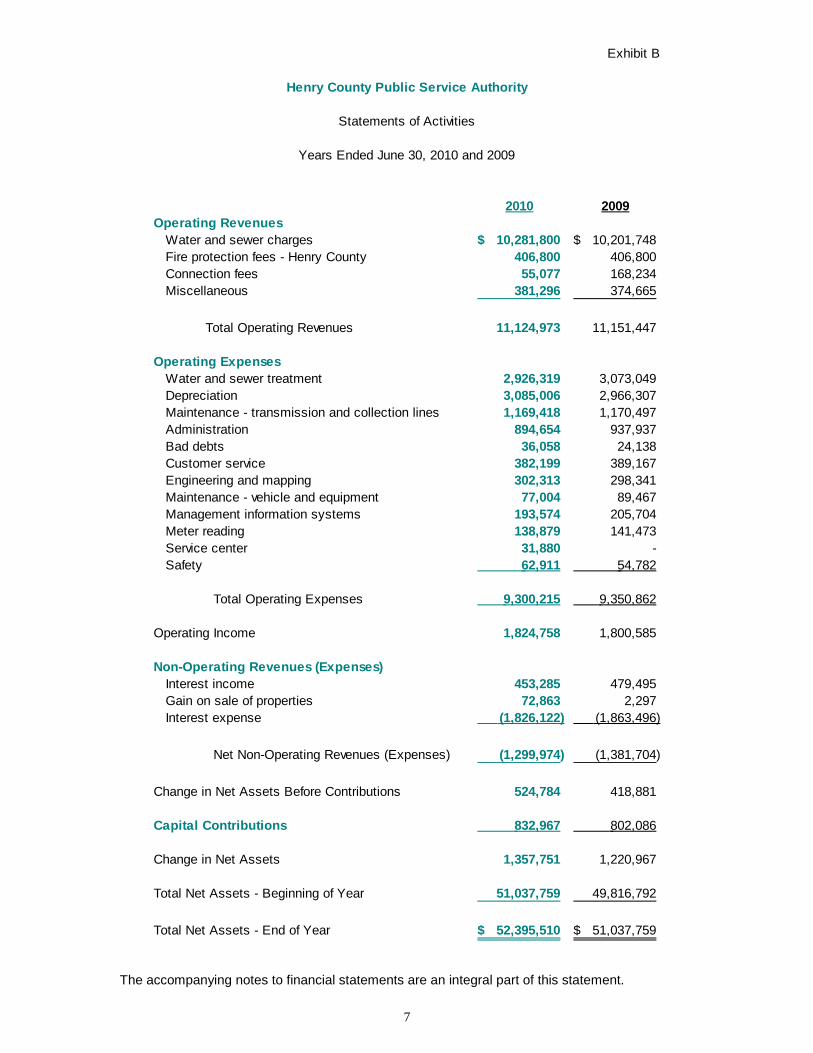
Exhibit B
Henry County Public Service Authority
Statements of Activities
Years Ended June 30, 2010 and 2009
2010 2009
Operating Revenues
Water and sewer charges 10,281,800$ 10,201,748$
Fire protection fees - Henry County 406,800 406,800
Connection fees 55,077 168,234
Miscellaneous 381,296 374,665
Total Operating Revenues 11,124,973 11,151,447
Operating Expenses
Water and sewer treatment 2,926,319 3,073,049
Depreciation 3,085,006 2,966,307
Maintenance - transmission and collection lines 1,169,418 1,170,497
Administration 894,654 937,937
Bad debts 36,058 24,138
Customer service 382,199 389,167
Engineering and mapping 302,313 298,341
Maintenance - vehicle and equipment 77,004 89,467
Management information systems 193,574 205,704
Meter reading 138,879 141,473
Service center 31,880 -
Safety 62,911 54,782
Total Operating Expenses 9,300,215 9,350,862
Operating Income 1,824,758 1,800,585
Non-Operating Revenues (Expenses)
Interest income 453,285 479,495
Gain on sale of properties 72,863 2,297
Interest expense (1,826,122) (1,863,496)
Net Non-Operating Revenues (Expenses) (1,299,974) (1,381,704)
Change in Net Assets Before Contributions 524,784 418,881
Capital Contributions 832,967 802,086
Change in Net Assets 1,357,751 1,220,967
Total Net Assets - Beginning of Year 51,037,759 49,816,792
Total Net Assets - End of Year 52,395,510$ 51,037,759$
The accompanying notes to financial statements are an integral part of this statement.

8
Exhibit C
2010 2009
Cash Flows from Operating Activities
Cash received from customers 11,184,557$ 11,874,487$
Cash paid for goods and services (4,291,464) (5,155,077)
Cash paid to employees (2,208,063) (2,229,574)
Net Cash Provided by Operating Activities 4,685,030 4,489,836
Cash Flows from Capital and Related Financing Activities
Governmental grant revenue 832,967 802,086
Money received other governments (Due to) (25,082) 1,243,451
Purchase of capital assets (1,354,397) (4,503,722)
Bond principal payments (2,419,055) (2,301,497)
Bond interest payments (1,839,896) (1,876,567)
Bond issuance costs 108,571 116,871
Net Cash Used in Capital and Related
Financing Activities (4,696,892) (6,519,378)
Cash Flows from Investing Activities
Interest received 453,285 479,495
Gain (Loss) on sale of properties 72,863 (30,756)
Net change in investments (152,384) 1,059,443
Net Cash Provided by Investing Activities 373,764 1,508,182
Net Increase (Decrease) in Cash and Cash Equivalents 361,902 (521,360)
Cash and Cash Equivalents - Beginning of Year 4,980,342 5,501,702
Cash and Cash Equivalents - End of Year 5,342,244$ 4,980,342$
Reconciliation of Operating Income to Net Cash Provided
by (Used in) Operating Activities
Operating income 1,824,758$ 1,800,585$
Adjustments to reconcile operating income
Depreciation 3,085,006 2,966,307
Bad debts 36,058 24,138
Change in assets and liabilities
Decrease (Increase) in
Accounts receivable 31,000 641,198
Inventory (31,008) (1,558)
Unbilled revenue (31,621) 24,961
Increase (Decrease) in
Accounts payable (252,998) (999,951)
Customer deposits 24,147 32,744
Accrued expenses (312) 1,412
Net Cash Provided by Operating Activities 4,685,030$ 4,489,836$
Henry County Public Service Authority
Statements of Cash Flows
Years Ended June 30, 2010 and 2009
The accompanying notes to financial statements are an integral part of this statement.

9
Exhibit D
OPEB
Trust Fund
Assets
Investment - restricted 21,242$
Total Assets 21,242$
Liabilities and Fund Balances
Liabilities
Amounts held for others 21,242$
Total Liabilities 21,242
Fund Balances
Unreserved/Undesignated -
Total Fund Balances -
Total Liabilities and
Fund Balances 21,242$
Henry County Public Service Authority
Statement of Fiduciary Assets and Liabilities
Year Ended June 30, 2010
The accompanying notes to financial statements are an integral part of this statement.

10
Henry County Public Service Authority
Notes to Financial Statements
Year Ended June 30, 2010
Organization, Description of the Entity, and Its Activities
The Henry County Public Service Authority (the "Authority") was formed in 1965 under the provisions of the Virginia Water and Sewer Authorities Act, Code of Virginia (1950), as amended. The Authority provides water and sewer services to communities in Henry County, Virginia (the "County"). The Authority is governed by a six-member Board of Directors who are appointed for four-year staggered terms by the Board of Supervisors of the County. Since the Board of Supervisors cannot impose its will on the Authority and since there is no potential financial benefit or burden in the relationship, the County is not financially accountable for the Authority. Accordingly, the Authority is not considered a component unit of the County.
Significant Accounting Policies
Financial Statement Presentation The accompanying financial statements conform to generally accepted
accounting principles (GAAP) applicable to government units promulgated by the Governmental Accounting Standards Board (GASB).
The Authority applies all GASB pronouncements as well as the Financial
Accounting Standards Board (FASB) Statements and Interpretations, APB Opinions and Accounts Research Bulletins issued on or before November 30, 1989, unless these pronouncements conflict with or contradict GASB pronouncements.
Basis of Accounting The Authority's financial statements are reported using the accrual basis of
accounting. Revenues are recorded when earned and expenses are recorded when a liability is incurred, regardless of the timing of related cash flows.
Private-sector standards of accounting and financial reporting issued prior to
December 1, 1989, generally are followed in the Authority's financial statements to the extent that those standards do not conflict with or contradict guidance of the Governmental Accounting Standards Board. The Authority also has the option of following subsequent private-sector guidance, subject to this same limitation. The Authority has elected not to follow subsequent private-sector guidance.
The Authority distinguishes operating revenues and expenses from nonoperating
items. Operating revenues and expenses generally result from providing services in connection with the Authority's principal ongoing operations. The principal operating revenues of the Authority are charges to customers for water and sewer sales. Operating expenses include the cost of water and sewer treatment, maintenance, and administrative expenses. All revenues and expenses not meeting this definition are reported as nonoperating revenues and expenses.
Cash and Cash Equivalents Cash and cash equivalents consists of cash on hand; demand, savings or money
market accounts; and certificates of deposit or short-term investments with purchased maturities of three months or less.
1
2

11
Unbilled Revenue Unbilled revenue consists of amounts earned as of year end, but not yet billed
because billing dates do not coincide with year end. Allowance for Doubtful Accounts The Authority has calculated its allowance for doubtful accounts using historical
collection data and specific account analysis of all accounts greater than or equal to ninety days aged.
Inventory Inventory consists of grinder pumps, parts, and supplies on hand at year end,
reported at the lower of cost (first-in, first-out) or market. Inventory is generally used for construction and for operation and maintenance work, and is not held for resale.
Investments Investments are carried at fair value. Capital Assets Capital assets are recorded at original cost at the time of acquisition. Donated
assets are recorded at their fair market value on the date donated. Repair and maintenance items are expensed when incurred. Depreciation is provided on the straight-line method over the following estimated useful lives:
Buildings and structures 40-50 years
Sewer system equipment 10-50 years
Water system equipment 10-40 years
Other equipment 5-20 years Compensated Absences The vacation policy provides for the accumulation of earned vacation leave,
depending on years of service with a maximum accumulation of 240 hours. The sick leave policy provides for sick leave to be earned at the rate of eight hours per month of service with a maximum accumulation of 720 hours. Accumulated vacation is paid at 100 percent, and sick leave is paid at 25 percent, upon termination of employment. These amounts are accrued when incurred.
Revenues The Authority records water and sewer revenues as billed to its customers
principally on a monthly basis. Fees charged for the privilege of connecting to the system are credited to income.
Property and Equipment Depreciation is provided principally on the straight-line method over the
estimated useful lives of the assets.

12
Use of Estimates The preparation of financial statements in conformity with generally accepted
accounting principles requires management to make estimates and assumptions that affect certain reported amounts and disclosures. Accordingly, actual results could differ from those estimates.
Budgets The Authority adopts an annual budget for informative and fiscal planning
purposes only. The budget is not intended to be a legal control on expenses. Budgets are adopted on the accrual basis of accounting with the exception that depreciation and amortization are not budgeted.
Amortization Bond premiums and discounts, as well as issuance costs, are deferred and
amortized over the life of the bonds using the effective interest method. Amortization of bond premiums or discounts is included in interest expense. Amortization of bond issuance costs is recorded as amortization expense. Bonds payable are reported net of the applicable bond premium or discount. The deferred amount resulting from bond refunding is amortized over the shorter of the life of the new bond issue or the refunded issue. Bonds payable are reported net of the deferred amount on refunding.
Net Assets Net assets are the difference between assets and liabilities. Net assets invested
in capital assets represent capital assets, less accumulated depreciation, less any outstanding debt related to the acquisition, construction, or improvement of those assets.
Cash Equivalents
Deposits
All cash of the Authority is maintained in accounts collateralized in accordance with the Virginia Security for Public Deposits Act, Section 2.2-4400 et seq. of the Code of Virginia or covered by Federal Depository Insurance.
Investments Statutes authorize local governments and other public bodies to invest in
obligations of the United States or agencies thereof, obligations of the Commonwealth of Virginia or political subdivisions thereof, obligations of the International Bank for Reconstruction and Development (World Bank), the Asian Development Bank, the African Development Bank, "prime quality" commercial paper and certain corporate notes, bankers acceptances, repurchase agreements, and the State Treasurer's Local Government Investment Pool (LGIP).
Investment Type Fair Value Maturity Rating
U.S. Treasuries 5,416,348$ 5 months or less AAA
Certificates of deposit 2,155,642 2010/2011 N/A
7,571,990$
3
13
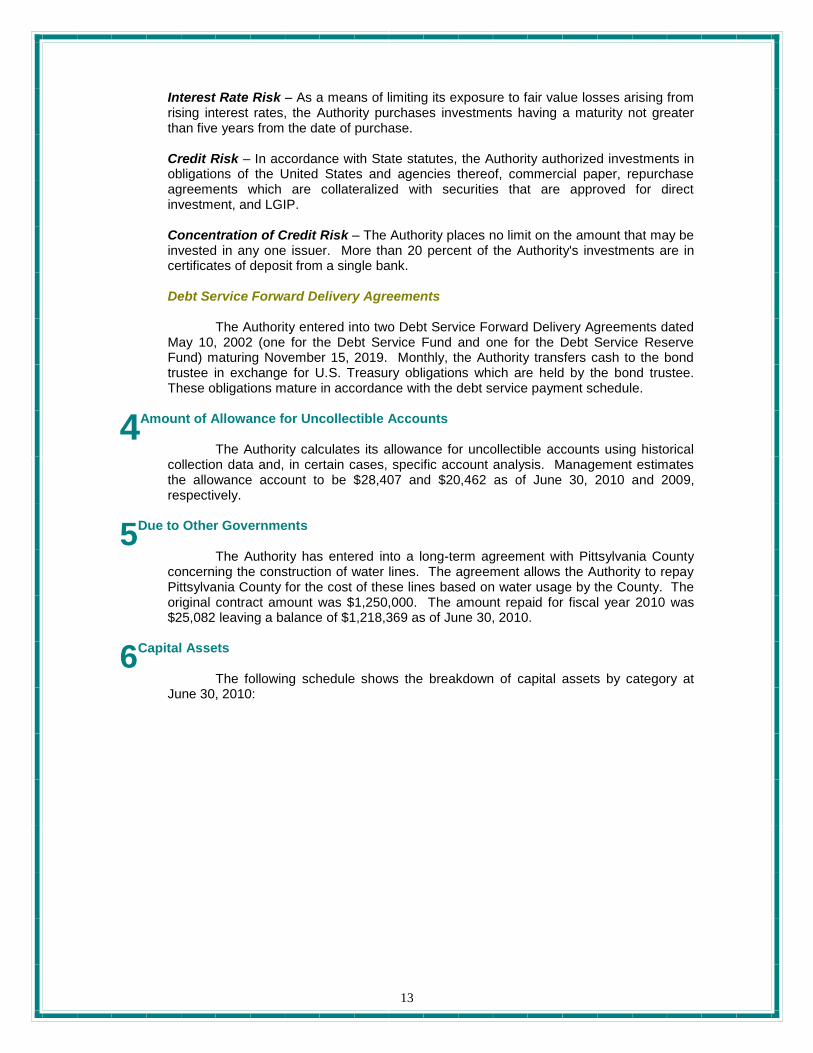
Interest Rate Risk – As a means of limiting its exposure to fair value losses arising from
rising interest rates, the Authority purchases investments having a maturity not greater than five years from the date of purchase.
Credit Risk – In accordance with State statutes, the Authority authorized investments in
obligations of the United States and agencies thereof, commercial paper, repurchase agreements which are collateralized with securities that are approved for direct investment, and LGIP.
Concentration of Credit Risk – The Authority places no limit on the amount that may be
invested in any one issuer. More than 20 percent of the Authority's investments are in certificates of deposit from a single bank.
Debt Service Forward Delivery Agreements The Authority entered into two Debt Service Forward Delivery Agreements dated
May 10, 2002 (one for the Debt Service Fund and one for the Debt Service Reserve Fund) maturing November 15, 2019. Monthly, the Authority transfers cash to the bond trustee in exchange for U.S. Treasury obligations which are held by the bond trustee. These obligations mature in accordance with the debt service payment schedule.
Amount of Allowance for Uncollectible Accounts
The Authority calculates its allowance for uncollectible accounts using historical collection data and, in certain cases, specific account analysis. Management estimates the allowance account to be $28,407 and $20,462 as of June 30, 2010 and 2009, respectively.
Due to Other Governments
The Authority has entered into a long-term agreement with Pittsylvania County concerning the construction of water lines. The agreement allows the Authority to repay Pittsylvania County for the cost of these lines based on water usage by the County. The original contract amount was $1,250,000. The amount repaid for fiscal year 2010 was $25,082 leaving a balance of $1,218,369 as of June 30, 2010.
Capital Assets
The following schedule shows the breakdown of capital assets by category at June 30, 2010:
4
5
6

14
Balance Acquired Deleted Balance
July 1, 2009 (Increased) (Decreased) June 30, 2010
Capital assets, not depreciated
Land and land improvements 361,554$ 123,117$ 30,000$ 454,671$
Construction in progress
Water 574,260 422,837 840,072 157,025
Sewer - 825,711 411,484 414,227
Other 585,424 327,942 913,366 -
Total Construction in Progress 1,159,684 1,576,490 2,164,922 571,252
Total Capital Assets, Not
Depreciated 1,521,238 1,699,607 2,194,922 1,025,923
Capital assets, depreciated
Buildings and leasehold improvements 767,274 615,342 59,705 1,322,911
Water and sewer system 123,053,395 1,101,251 27,360 124,127,286
Trucks and autos 1,643,780 89,957 12,538 1,721,199
Office equipment 365,330 43,162 - 408,492
Total Capital Assets,
Depreciated 125,829,779 1,849,712 99,603 127,579,888
Less: Accumulated depreciation for
Land improvements 2,029 89 - 2,118
Buildings and leasehold improvements 608,923 67,381 59,704 616,600
Water and sewer system 48,308,230 2,974,035 27,360 51,254,905
Trucks and autos 1,469,778 40,381 12,539 1,497,620
Office equipment 364,820 3,120 - 367,940
Total Accumulated Depreciation 50,753,780 3,085,006 99,603 53,739,183
Total Capital Assets
Depreciated, Net 75,075,999 (1,235,294) - 73,840,705
Total Capital Assets, Net 76,597,237$ 464,313$ 2,194,922$ 74,866,628$

15
Long-Term Debt The following is a summary of the Authority's long-term liability activity for the
year:
Balance Balance Due Within
Details of Long-Term Indebtedness July 1, 2009 Increase Decrease June 30, 2010 One Year
2000 VRL Fund 306,320$ -$ 29,700$ 276,620$ 29,700$
2000 Water 1,169,161 - 18,433 1,150,728 19,280
2000-A Water 776,254 - 11,994 764,260 12,545
2001 Water and Sewer Refunding 30,215,000 - 2,095,000 28,120,000 2,200,000
2004-B Water and Sewer Refunding 1,080,000 - 50,000 1,030,000 50,000
2005-A Sewer 1,007,474 - 12,447 995,027 12,971
2007 Bonds Payable 2,562,653 - 96,340 2,466,313 100,175
Long-Term Debt before Deferrals 37,116,862 - 2,313,914 34,802,948 2,424,671
Less: Deferred amounts
2001 refunding (611,908) - (78,634) (533,274) (72,234)
Imputed interest on 2000 VRL Fund (69,272) - (11,629) (57,643) (10,714)
Unamortized premium on 2001
Water and Sewer Refunding 1,017,282 - 189,646 827,636 169,398
Unamortized premium on
2004-B Water and Sewer 5,516 - 583 4,933 563
Total Deferred Amounts 341,618 - 99,966 241,652 87,013
Long-Term Debt 37,458,480 - 2,413,880 35,044,600 2,511,684
Compensated absences 319,038 - 5,175 313,863 31,386
Total Long-Term Debt 37,777,518$ -$ 2,419,055$ 35,358,463$ 2,543,070$
7
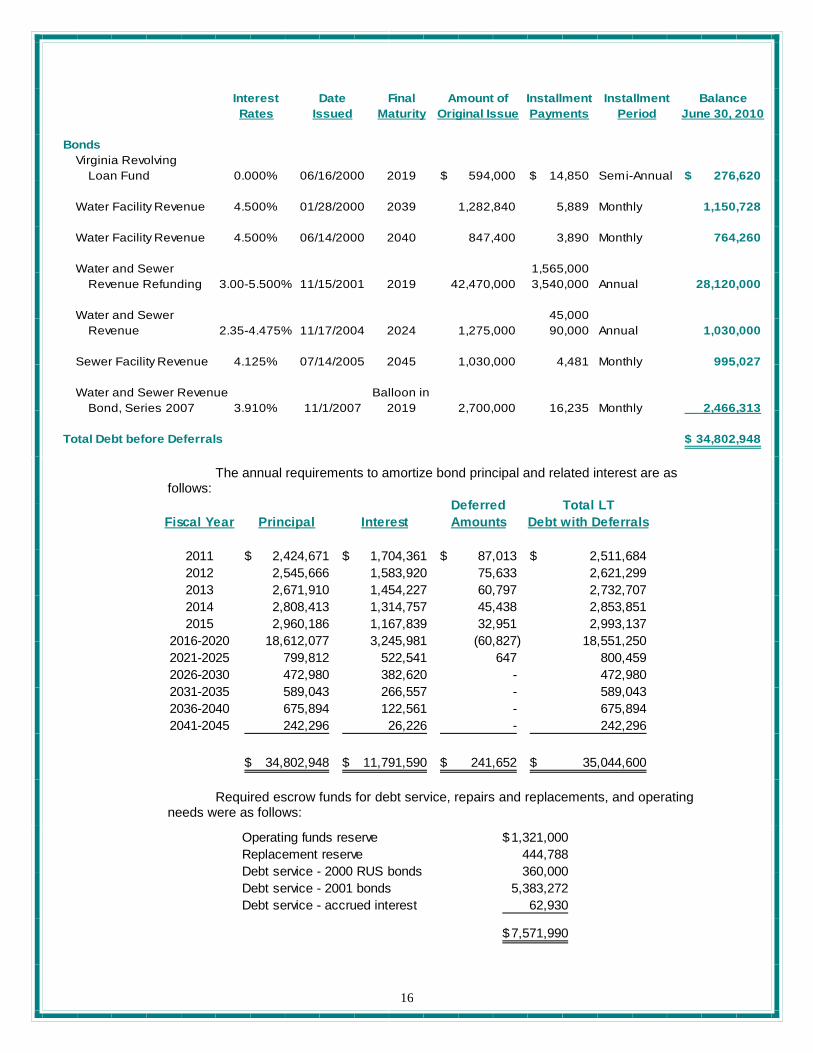
16
Interest Date Final Amount of Installment Installment Balance
Rates Issued Maturity Original Issue Payments Period June 30, 2010
Bonds
Virginia Revolving
Loan Fund 0.000% 06/16/2000 2019 594,000$ 14,850$ Semi-Annual 276,620$
Water Facility Revenue 4.500% 01/28/2000 2039 1,282,840 5,889 Monthly 1,150,728
Water Facility Revenue 4.500% 06/14/2000 2040 847,400 3,890 Monthly 764,260
Water and Sewer 1,565,000
Revenue Refunding 3.00-5.500% 11/15/2001 2019 42,470,000 3,540,000 Annual 28,120,000
Water and Sewer 45,000
Revenue 2.35-4.475% 11/17/2004 2024 1,275,000 90,000 Annual 1,030,000
Sewer Facility Revenue 4.125% 07/14/2005 2045 1,030,000 4,481 Monthly 995,027
Water and Sewer Revenue Balloon in
Bond, Series 2007 3.910% 11/1/2007 2019 2,700,000 16,235 Monthly 2,466,313
Total Debt before Deferrals 34,802,948$
The annual requirements to amortize bond principal and related interest are as
follows:
Deferred Total LT
Fiscal Year Principal Interest Amounts Debt with Deferrals
2011 2,424,671$ 1,704,361$ 87,013$ 2,511,684$
2012 2,545,666 1,583,920 75,633 2,621,299
2013 2,671,910 1,454,227 60,797 2,732,707
2014 2,808,413 1,314,757 45,438 2,853,851
2015 2,960,186 1,167,839 32,951 2,993,137
2016-2020 18,612,077 3,245,981 (60,827) 18,551,250
2021-2025 799,812 522,541 647 800,459
2026-2030 472,980 382,620 - 472,980
2031-2035 589,043 266,557 - 589,043
2036-2040 675,894 122,561 - 675,894
2041-2045 242,296 26,226 - 242,296
34,802,948$ 11,791,590$ 241,652$ 35,044,600$
Required escrow funds for debt service, repairs and replacements, and operating
needs were as follows:
Operating funds reserve 1,321,000$
Replacement reserve 444,788
Debt service - 2000 RUS bonds 360,000
Debt service - 2001 bonds 5,383,272
Debt service - accrued interest 62,930
7,571,990$

17
The Authority is required to maintain a debt service coverage ratio of 120 percent (as defined in the bond Master Trust Agreement and related amendments) and to periodically obtain a consulting engineer's report to determine amounts needed to escrow for future repairs, replacements, and operating needs. The Authority received the most recent report in September 2010. The management of the Authority believes it is in compliance with all requirements.
Revenue bonds require all revenues and receipts derived by the Authority to be
pledged as security for the bonds. In addition, a security interest in all accounts receivable for services is granted to the issuer of the bonds.
Capital Contributions Capital contributions represent proceeds from federal, state, and local agencies
for the following capital projects:
Source of Revenue Project
County of Henry, Virginia Philpott Sewer Extension 414,227$
Virginia Resources Authority SLS Generators Project 399,540
Department of Environmental Quality Marigold Water Extension 19,200
832,967$
Operating Leases The Authority leases its office space from the County for a fifteen year term
commencing November 1, 1997 and ending on October 31, 2012. The lease is renewable annually for one year terms thereafter. In lieu of rent, the Authority renovated a portion of the building for the County's and Authority's use. These improvements (shown as leasehold improvements) are being depreciated over the life of the lease. In addition, the Authority leases the water treatment plant from the County. The plant, with a cost of $1,642,595, accumulated depreciation of $1,051,437, and annual depreciation of $40,440 is recorded on the County's financial statements. The Authority is responsible for all maintenance and operations of the plant. No payments are required. The Authority is required to retain funds in an Expansion and Replacement Fund to be applied to reasonable and necessary expenses for construction, replacement, repair, additions and/or extensions to the water and waste water facilities of the Authority. All disbursements from this fund must first be approved by the County. The lease continues until all debts of the Authority relating to water facility improvements have been satisfied.
Contingent Liabilities (Including Federally Assisted Programs – Compliance Audits)
Amounts received or receivable from grantor agencies are subject to audit and
adjustment by grantor agencies, principally the Federal government. Any disallowed claims, including amounts already collected, may constitute a liability of the applicable funds. The amount, if any, of expenditures which may be disallowed by the grantor cannot be determined at this time although the government expects such amounts, if any, to be immaterial.
At June 30, 2010, there were no matters of litigation involving the Authority which
would materially affect the Authority’s financial position should any court decision or pending matter not be favorable to the Authority.
8
9
10

18
Defined Benefit Pension Plan A. Plan Description
Name of Plan: Virginia Retirement System (VRS) Identification of Plan: Agent and Cost-Sharing Multiple-Employer Defined Benefit Pension Plan Administering Entity: Virginia Retirement System (System)
All full-time, salaried permanent employees of participating employers
must participate in the VRS. Benefits vest after five years of service. Employees are eligible for an unreduced retirement benefit at age 65 with 5 years of service (age 60 for participating local law enforcement officers, firefighters, and sheriffs) or at age 50 with at least 30 years of service if elected by the employer (age 50 with at least 25 years of service for participating local law enforcement officers, firefighters, and sheriffs) payable monthly for life in an amount equal to 1.70% of their average final compensation (AFC) for each year of credited service (1.85% for sheriffs and if the employer elects, for other employees in hazardous duty positions receiving enhanced benefits). Benefits are actuarially reduced for retirees who retire prior to becoming eligible for full retirement benefits. In addition, retirees qualify for annual cost-of-living adjustment (COLA) beginning in their second year of retirement. The COLA is limited to 5.00% per year. AFC is defined as the highest consecutive 36 months of reported compensation. Participating local law enforcement officers, firefighters, and sheriffs may receive a monthly benefit supplement if they retire prior to age 65. The VRS also provides death and disability benefits. Title 51.1 of the Code of Virginia (1950), as amended, assigns the authority to establish and amend benefit provisions to the General Assembly of Virginia.
The System issues a publicly available comprehensive annual financial
report that includes financial statements and required supplementary information for VRS. A copy of that report may be downloaded from their website at http://www.varetire.org/Pdf/Publications/2009-Annual-Report.pdf or obtained by writing to the System’s Chief Financial Officer at P. O. Box 2500, Richmond, Virginia 23218-2500.
B. Funding Policy Plan members are required by Title 51.1 of the Code of Virginia (1950),
as amended, to contribute 5.00% of their annual salary to the VRS. This 5.00% member contribution may be assumed by the employer. In addition, the Authority is required to contribute the remaining amounts necessary to fund its participation in the VRS using the actuarial basis specified by the Code of Virginia and approved by the VRS Board of Trustees. The Authority’s contribution rate for the fiscal year ended 2010 was 1.81 percent of annual covered payroll.
C. Annual Pension Cost For fiscal year 2010, the Authority’s annual pension cost of $37,185 was
equal to the Authority’s required and actual contributions.
11
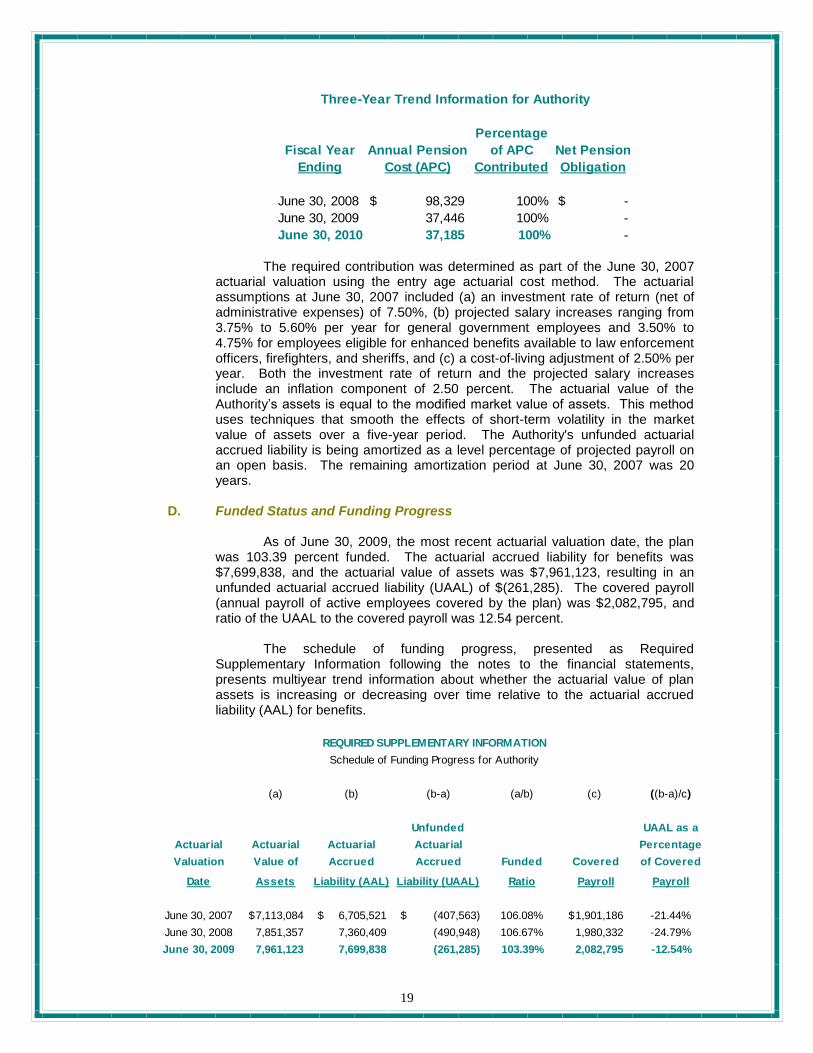
19
Percentage
Fiscal Year Annual Pension of APC Net Pension
Ending Cost (APC) Contributed Obligation
June 30, 2008 98,329$ 100% -$
June 30, 2009 37,446 100% -
June 30, 2010 37,185 100% -
Three-Year Trend Information for Authority
The required contribution was determined as part of the June 30, 2007 actuarial valuation using the entry age actuarial cost method. The actuarial assumptions at June 30, 2007 included (a) an investment rate of return (net of administrative expenses) of 7.50%, (b) projected salary increases ranging from 3.75% to 5.60% per year for general government employees and 3.50% to 4.75% for employees eligible for enhanced benefits available to law enforcement officers, firefighters, and sheriffs, and (c) a cost-of-living adjustment of 2.50% per year. Both the investment rate of return and the projected salary increases include an inflation component of 2.50 percent. The actuarial value of the Authority’s assets is equal to the modified market value of assets. This method uses techniques that smooth the effects of short-term volatility in the market value of assets over a five-year period. The Authority's unfunded actuarial accrued liability is being amortized as a level percentage of projected payroll on an open basis. The remaining amortization period at June 30, 2007 was 20 years.
D. Funded Status and Funding Progress
As of June 30, 2009, the most recent actuarial valuation date, the plan was 103.39 percent funded. The actuarial accrued liability for benefits was $7,699,838, and the actuarial value of assets was $7,961,123, resulting in an unfunded actuarial accrued liability (UAAL) of $(261,285). The covered payroll (annual payroll of active employees covered by the plan) was $2,082,795, and ratio of the UAAL to the covered payroll was 12.54 percent.
The schedule of funding progress, presented as Required Supplementary Information following the notes to the financial statements, presents multiyear trend information about whether the actuarial value of plan assets is increasing or decreasing over time relative to the actuarial accrued liability (AAL) for benefits.
(a) (b) (b-a) (a/b) (c) ((b-a)/c)
Unfunded UAAL as a
Actuarial Actuarial Actuarial Actuarial Percentage
Valuation Value of Accrued Accrued Funded Covered of Covered
Date Assets Liability (AAL) Liability (UAAL) Ratio Payroll Payroll
June 30, 2007 7,113,084$ 6,705,521$ (407,563)$ 106.08% 1,901,186$ -21.44%
June 30, 2008 7,851,357 7,360,409 (490,948) 106.67% 1,980,332 -24.79%
June 30, 2009 7,961,123 7,699,838 (261,285) 103.39% 2,082,795 -12.54%
Schedule of Funding Progress for Authority
REQUIRED SUPPLEMENTARY INFORMATION

20
Notes to Required Supplementary Information This information presented in the required supplementary schedules was
determined as part of the actuarial valuations at the dates indicated. Additional information as of the latest actuarial valuation follows:
Valuation Date June 30, 2009
Actuarial Cost Method Entry Age Normal
Amortization Method Level Percent of Pay, Open
Payroll Growth Rate 3.00%
Remaining Amortization Period 20 Years
Asset Valuation Method Five-Year Smoothed Market Value
Actuarial Assumptions
Investment rate of return1 7.50%
Projected salary increases1
NonLaw Enforcement Officer Employees 3.75% to 5.60%
Law Enforcement Officer Employees 3.50% to 4.75%
Cost-of-living adjustments 2.50%
1Includes inflation of 2.50%
Postemployment Healthcare Plan Plan Description. Henry County Public Service Authority provides
postemployment health benefits in the form of medical insurance benefits to eligible retirees and their spouses.
Three-year trend information is as follows:
Net
Percentage OPEB
Fiscal Year Annual of OPEB Cost Obligation
Ended OPEB Cost Contributed (Asset)
06/30/09 20,190$ 100.00% (10,335)$
06/30/10 19,689 100.00% 2,754
12

21
Actuarial Unfunded
Valuation Plan Accrued Unfunded Normal Funded Covered % of
Date Assets Liability Liability Cost Ratio Payroll Payroll
(a) (b) (b-a) (c) (a)/(b) (d) (b-a)/(d)
07/01/2008 -$ 242,547$ 242,547$ 4,637$ 0.0% 1,998,828$ 12.1%
07/01/2009 19,356 253,601 234,245 4,753 7.6% 2,048,799 11.4%
Schedule of Funding Progress
Actual
FYE ARC Contribution % Contributed
06/30/2009 20,190$ 30,525$ 151.2%
06/30/2010 19,689 6,600 33.5%
Schedule of Contributions
BOY Annual OPEB Cost Actual EOY Interest Amort.
Plan Year NOPEBO ARC Int. Adj. Total Cont. NOPEBO Rate Period
2008-09 -$ 20,190$ -$ -$ 20,190$ (30,525)$ (10,335)$ 7.50% 30
2009-10 (10,335) 19,784 (775) (680) 19,689 (6,600) 2,754 7.50% 30
Annual Pension OPEB Cost Summary
The Authority also participates in the VRS (Virginia Retirement System) Health
Insurance Credit Program.
Summary of Main Benefit Provisions as Interpreted for Valuation Purposes
Political subdivisions participating in the Virginia Retirement System (VRS) may elect to provide a credit toward the cost of health insurance coverage for any former state employee who retired under VRS with at least 15 years of total creditable service. The amount of each monthly health insurance credit shall be $1.50 per year of creditable service, which amount shall be credited monthly to any retired state employee participating in the state retiree health benefits program. However, such credit shall not exceed the health insurance premium for retiree. Disabled retirees automatically receive a maximum monthly credit, which is the greater of (i) $45, or (ii) $1.50 per year for each year of creditable service at the time of disability retirement. If an eligible employee has worked for more than one employer in VRS, for the purpose of this valuation, their most current (or last) employer assumes full liability for that employee.

22
Summary of Actuarial Assumptions and Methods as Interpreted for Valuation Purposes
Valuation Date June 30, 2009
Actuarial Cost Method Entry Age Normal
Amortization Method Level Percentage of Pay, Open
Remaining Amortization Period 27 Years
Asset Valuation Method Market Value of Assets
Actuarial Assumptions
Investment rate of return1 7.50%
Payroll growth rate 3.00%
1Includes inflation at 2.50%
(a) (b) (b-a) (a/b) (c) ((b-a)/c)
Actuarial
Accrued UAAL as a
Actuarial Actuarial Liability (AAL) Unfunded Percentage
Valuation Value of Projected AAL Funded Covered of Covered
Date Assets Unit Credit (UAAL) Ratio Payroll Payroll
September 30, 2009 14,886$ 92,758$ 77,872$ 16.05% 2,082,795$ 3.74%
September 30, 2008 9,478 100,147 90,669 9.46% 1,980,332 4.58%
September 30, 2007* 1,542 157,835 156,293 0.98% 1,901,186 8.22%
*Prepared by prior actuary.
REQUIRED SUPPLEMENTARY INFORMATION
Schedule of Funding Progress for Authority
Health Insurance Credit Program
Risk Management
The Authority is exposed to various risks of loss related to torts; theft of, damage to, and destruction of assets; errors and omissions; injuries to employees; and natural disasters. The Authority joined together with other local governments in the Virginia Municipal League Pool, a public entity risk pool currently operating as a common risk management and insurance program for participating local governments. The Authority pays an annual premium to the pool for substantially all of its insurance coverage. In the event of a loss creating a deficit or depletion of all available excess insurance, the pool may assist all members in the proportion that the premium of each bears to the total premiums of all members in the year in which such deficit occurs. The settled claims for 2010 and 2009 did not exceed insurance.
Commitments and Contingencies
Special purpose grants are subject to audit to determine compliance with their requirements. Authority officials believe that if any refunds are required, they will be immaterial.
13
14

23
Water and Sewer Purchases
In 1974, the Authority and neighboring City of Martinsville (the "City") signed a service agreement in which the Authority would purchase water and sewage treatment from the City and share in the annual operating costs of the plants in proportion to its actual use as measured by the volume of water used and sewage it contributed. It also allowed for the Authority to purchase capacity rights into the water and sewer plants at an agreed-upon price.
15

OTHER SUPPLEMENTARY INFORMATION

24
Schedule 1
Variance
Original Final Positive
Budget Budget Actual (Negative)
Operating Revenues
Metered water sales 6,054,385$ 6,054,385$ 5,974,119$ (80,266)$
Waste water service charges 4,079,178 4,079,178 4,307,681 228,503
Miscellaneous 394,000 438,000 381,296 (56,704)
Fire protection fees - Henry County 406,800 406,800 406,800 -
Connection fees 62,000 62,000 55,077 (6,923)
Total Operating Revenues 10,996,363 11,040,363 11,124,973 84,610
Operating Expenses
Water and sewer treatment 2,870,119 2,881,455 2,926,319 (44,864)
Depreciation - - 3,085,006 (3,085,006)
Maintenance - transmission and collection lines 1,195,242 1,244,692 1,169,418 75,274
Administration 955,456 961,991 894,654 67,337
Bad debts 34,000 34,000 36,058 (2,058)
Customer service 395,670 396,347 382,199 14,148
Engineering and mapping 312,267 320,480 302,313 18,167
Maintenance - vehicle and equipment 190,022 191,852 77,004 114,848
Management information systems 202,284 219,809 193,574 26,235
Meter reading 149,313 149,313 138,879 10,434
Service center 53,000 53,000 31,880 21,120
Safety 71,316 71,316 62,911 8,405
Total Operating Expenses 6,428,689 6,524,255 9,300,215 (2,775,960)
Operating Income (Loss) 4,567,674 4,516,108 1,824,758 (2,691,350)
Non-Operating Revenues (Expenses)
Interest income 433,981 433,981 453,285 19,304
Gain (Loss) on sale of properties - - 72,863 72,863
Interest expense (1,845,465) (1,845,465) (1,826,122) 19,343
Total Non-Operating Revenue (1,411,484) (1,411,484) (1,299,974) 111,510
Change in Net Assets Before Contributions 3,156,190 3,104,624 524,784 (2,579,840)
Capital Contributions - 1,155,740 832,967 (322,773)
Change in Net Assets 3,156,190$ 4,260,364$ 1,357,751$ (2,902,613)$
Henry County Public Service Authority
Schedule of Revenues and Expenses - Budget to Actual
Non-GAAP Budgetary Basis
Year Ended June 30, 2010

OTHER INFORMATION
25
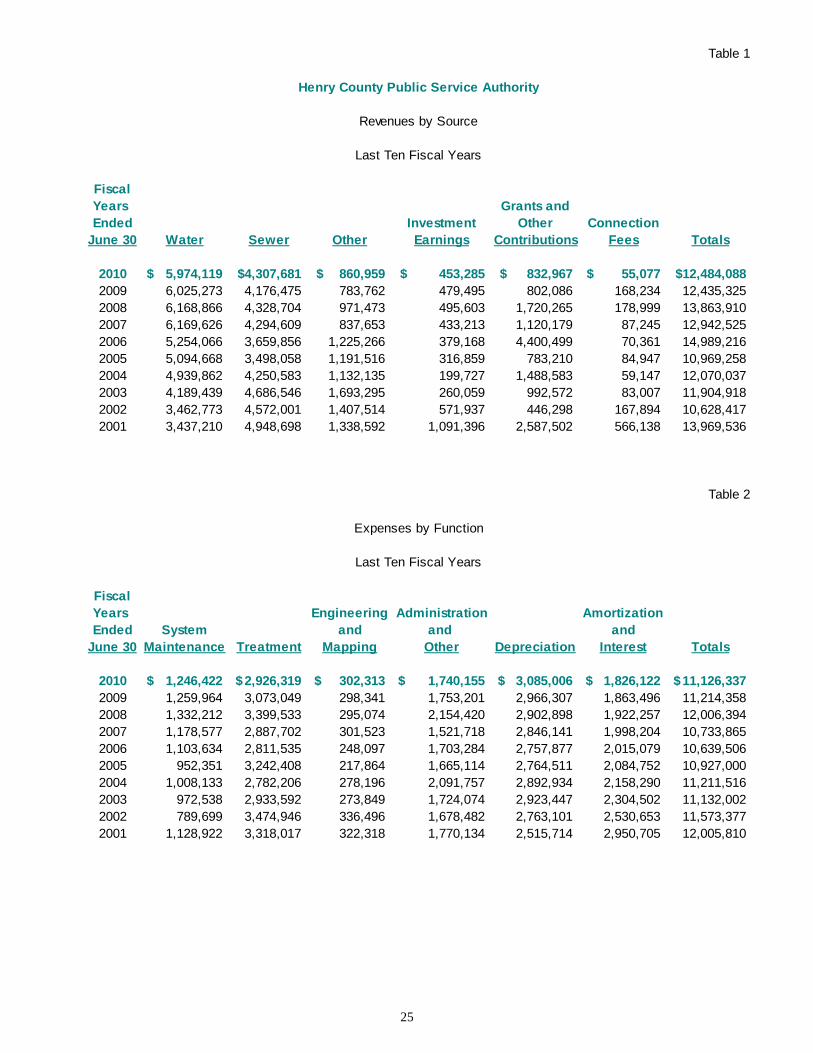
Table 1
Fiscal
Years Grants and
Ended Investment Other Connection
June 30 Water Sewer Other Earnings Contributions Fees Totals
2010 5,974,119$ 4,307,681$ 860,959$ 453,285$ 832,967$ 55,077$ 12,484,088$
2009 6,025,273 4,176,475 783,762 479,495 802,086 168,234 12,435,325
2008 6,168,866 4,328,704 971,473 495,603 1,720,265 178,999 13,863,910
2007 6,169,626 4,294,609 837,653 433,213 1,120,179 87,245 12,942,525
2006 5,254,066 3,659,856 1,225,266 379,168 4,400,499 70,361 14,989,216
2005 5,094,668 3,498,058 1,191,516 316,859 783,210 84,947 10,969,258
2004 4,939,862 4,250,583 1,132,135 199,727 1,488,583 59,147 12,070,037
2003 4,189,439 4,686,546 1,693,295 260,059 992,572 83,007 11,904,918
2002 3,462,773 4,572,001 1,407,514 571,937 446,298 167,894 10,628,417
2001 3,437,210 4,948,698 1,338,592 1,091,396 2,587,502 566,138 13,969,536
Table 2
Fiscal
Years Engineering Administration Amortization
Ended System and and and
June 30 Maintenance Treatment Mapping Other Depreciation Interest Totals
2010 1,246,422$ 2,926,319$ 302,313$ 1,740,155$ 3,085,006$ 1,826,122$ 11,126,337$
2009 1,259,964 3,073,049 298,341 1,753,201 2,966,307 1,863,496 11,214,358
2008 1,332,212 3,399,533 295,074 2,154,420 2,902,898 1,922,257 12,006,394
2007 1,178,577 2,887,702 301,523 1,521,718 2,846,141 1,998,204 10,733,865
2006 1,103,634 2,811,535 248,097 1,703,284 2,757,877 2,015,079 10,639,506
2005 952,351 3,242,408 217,864 1,665,114 2,764,511 2,084,752 10,927,000
2004 1,008,133 2,782,206 278,196 2,091,757 2,892,934 2,158,290 11,211,516
2003 972,538 2,933,592 273,849 1,724,074 2,923,447 2,304,502 11,132,002
2002 789,699 3,474,946 336,496 1,678,482 2,763,101 2,530,653 11,573,377
2001 1,128,922 3,318,017 322,318 1,770,134 2,515,714 2,950,705 12,005,810
Last Ten Fiscal Years
Expenses by Function
Revenues by Source
Henry County Public Service Authority
Last Ten Fiscal Years
26
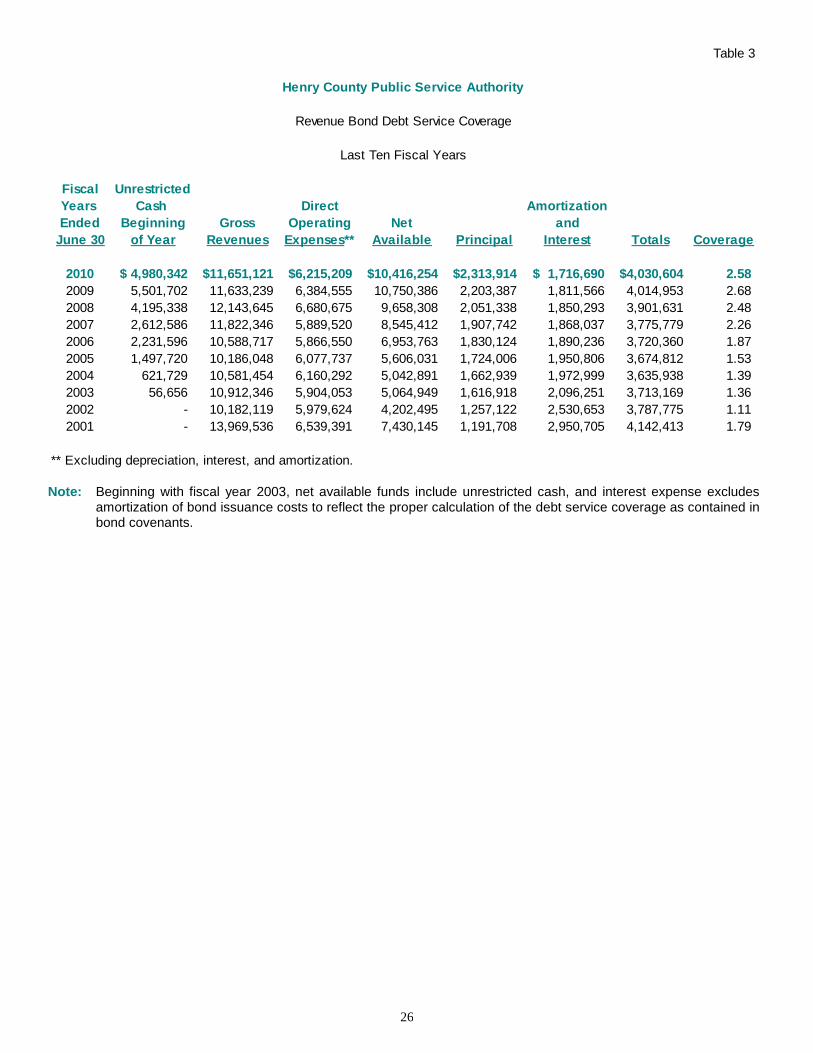
Table 3
Fiscal Unrestricted
Years Cash Direct Amortization
Ended Beginning Gross Operating Net and
June 30 of Year Revenues Expenses** Available Principal Interest Totals Coverage
2010 4,980,342$ 11,651,121$ 6,215,209$ 10,416,254$ 2,313,914$ 1,716,690$ 4,030,604$ 2.58
2009 5,501,702 11,633,239 6,384,555 10,750,386 2,203,387 1,811,566 4,014,953 2.68
2008 4,195,338 12,143,645 6,680,675 9,658,308 2,051,338 1,850,293 3,901,631 2.48
2007 2,612,586 11,822,346 5,889,520 8,545,412 1,907,742 1,868,037 3,775,779 2.26
2006 2,231,596 10,588,717 5,866,550 6,953,763 1,830,124 1,890,236 3,720,360 1.87
2005 1,497,720 10,186,048 6,077,737 5,606,031 1,724,006 1,950,806 3,674,812 1.53
2004 621,729 10,581,454 6,160,292 5,042,891 1,662,939 1,972,999 3,635,938 1.39
2003 56,656 10,912,346 5,904,053 5,064,949 1,616,918 2,096,251 3,713,169 1.36
2002 - 10,182,119 5,979,624 4,202,495 1,257,122 2,530,653 3,787,775 1.11
2001 - 13,969,536 6,539,391 7,430,145 1,191,708 2,950,705 4,142,413 1.79
** Excluding depreciation, interest, and amortization.
Henry County Public Service Authority
Revenue Bond Debt Service Coverage
Last Ten Fiscal Years
Note: Beginning with fiscal year 2003, net available funds include unrestricted cash, and interest expense excludes
amortization of bond issuance costs to reflect the proper calculation of the debt service coverage as contained in bond covenants.

27
Table 4
Type Coverage
(Insurer)
Commercial General Liability 1,000,000$ Each Occurrence Limit
(Virginia Municipal Liability Pool) 100,000$ Fire Damage Limit
10,000$ Medical Expense Limit
10,000$ No Fault Property Damage
Primary Automobile Liability 25,000$ Bodily Injury Per Person
(Virginia Municipal Liability Pool) 50,000$ Bodily Injury Per Accident
20,000$ Property Damage Per Accident
1,000,000$ Per Occurrence
Automobile Uninsured Motorists 25,000$ Bodily Injury Per Person
(Virginia Municipal Liability Pool) 50,000$ Bodily Injury Per Accident
20,000$ Property Damage Per Accident
10,000$ Automobile Medical Payments
Automobile Physical Damage Actual Comprehensive
(Virginia Municipal Liability Pool) Actual Collision
250$ Deductible/Comprehensive
500$ Deductible/Collision
Umbrella Liability 2,000,000$ Per Occurrence
(Virginia Municipal Liability Pool)
Commercial Property Coverage 33,881,793$ Blanket Real and Personal Property
(Virginia Municipal Liability Pool) 100,000$ Extra Expense (Monthly Limit)
1,000$ Deductible
Commercial Inland Marine Coverage 770,007$ Contractor's Equipment
(Virginia Municipal Liability Pool)
Boiler and Machinery Coverage 4,500,000$ Direct Damage (Per Accident)
(Virginia Municipal Liability Pool) 100,000$ Refrigerant
100,000$ Ammonia Contamination
100,000$ Expediting Expenses
100,000$ Hazardous Substances
100,000$ Water Damage
100,000$ Computer
100,000$ Perishable Goods
250,000$ Demolition & ICC
250,000$ Newly Acquired Location
Public Employees Dishonesty Coverage 1,000,000$ Aggregate Amount
(Virginia Municipal Liability Pool) 5,000$ Deductible
Worker's Compensation
(Virginia Municipal Group Self-Insurance Association) Statutory State Statutory Provision
1,000,000$ Employer's Liability Limit
Public Official Liability 1,000,000$ Limit of Liability
(Commonwealth of Virginia - Division of Risk Management) 1,000$ Deductible
Schedule of Insurance in Force
Henry County Public Service Authority
Liability Limits
June 30, 2010
28
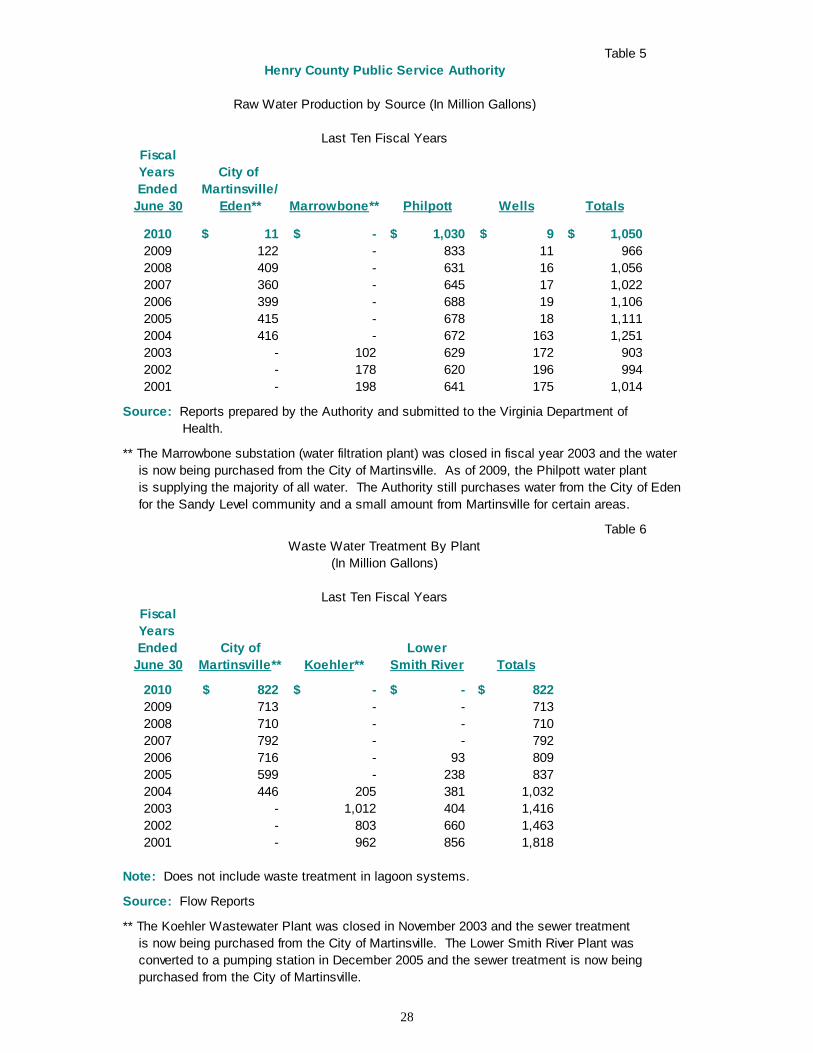
Table 5
Fiscal
Years City of
Ended Martinsville/
June 30 Eden** Marrowbone** Philpott Wells Totals
2010 11$ -$ 1,030$ 9$ 1,050$
2009 122 - 833 11 966
2008 409 - 631 16 1,056
2007 360 - 645 17 1,022
2006 399 - 688 19 1,106
2005 415 - 678 18 1,111
2004 416 - 672 163 1,251
2003 - 102 629 172 903
2002 - 178 620 196 994
2001 - 198 641 175 1,014
Source: Reports prepared by the Authority and submitted to the Virginia Department of
Health.
** The Marrowbone substation (water filtration plant) was closed in fiscal year 2003 and the water
is now being purchased from the City of Martinsville. As of 2009, the Philpott water plant
is supplying the majority of all water. The Authority still purchases water from the City of Eden
for the Sandy Level community and a small amount from Martinsville for certain areas.
Table 6
Fiscal
Years
Ended City of Lower
June 30 Martinsville** Koehler** Smith River Totals
2010 822$ -$ -$ 822$
2009 713 - - 713
2008 710 - - 710
2007 792 - - 792
2006 716 - 93 809
2005 599 - 238 837
2004 446 205 381 1,032
2003 - 1,012 404 1,416
2002 - 803 660 1,463
2001 - 962 856 1,818
Note: Does not include waste treatment in lagoon systems.
Source: Flow Reports
** The Koehler Wastewater Plant was closed in November 2003 and the sewer treatment
is now being purchased from the City of Martinsville. The Lower Smith River Plant was
converted to a pumping station in December 2005 and the sewer treatment is now being
purchased from the City of Martinsville.
Last Ten Fiscal Years
Waste Water Treatment By Plant
Raw Water Production by Source (In Million Gallons)
Henry County Public Service Authority
(In Million Gallons)
Last Ten Fiscal Years
29
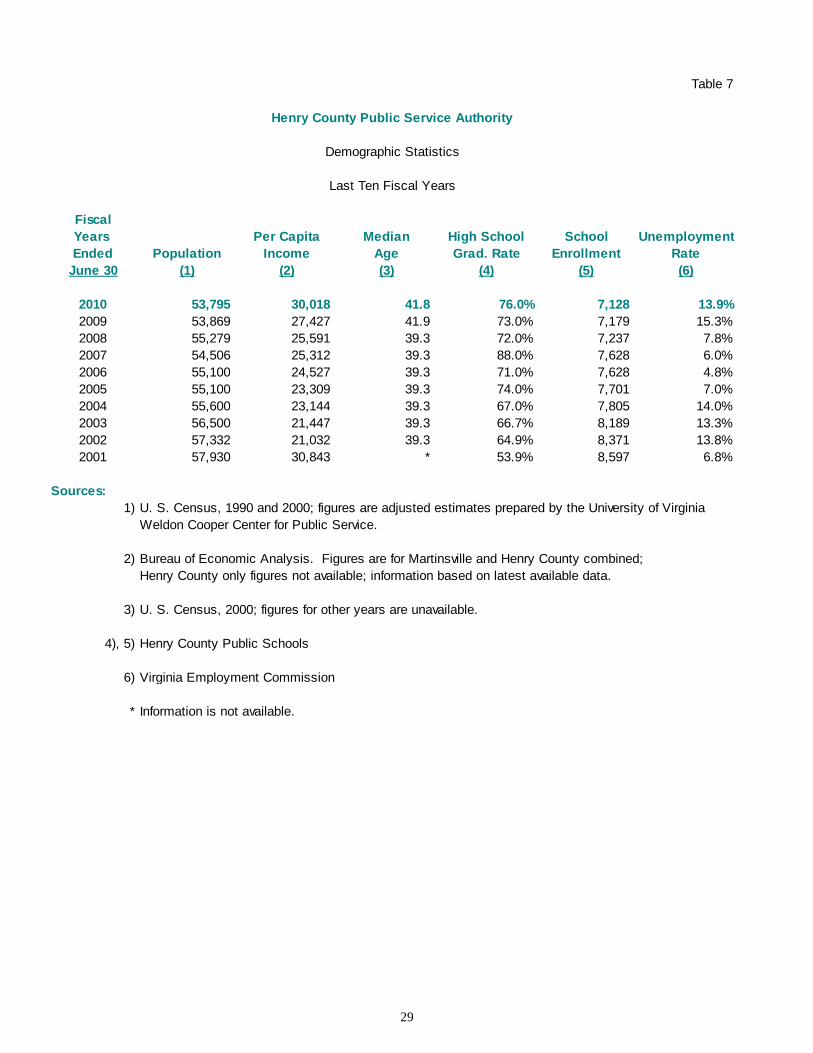
Table 7
Fiscal
Years Per Capita Median High School School Unemployment
Ended Population Income Age Grad. Rate Enrollment Rate
June 30 (1) (2) (3) (4) (5) (6)
2010 53,795 30,018 41.8 76.0% 7,128 13.9%
2009 53,869 27,427 41.9 73.0% 7,179 15.3%
2008 55,279 25,591 39.3 72.0% 7,237 7.8%
2007 54,506 25,312 39.3 88.0% 7,628 6.0%
2006 55,100 24,527 39.3 71.0% 7,628 4.8%
2005 55,100 23,309 39.3 74.0% 7,701 7.0%
2004 55,600 23,144 39.3 67.0% 7,805 14.0%
2003 56,500 21,447 39.3 66.7% 8,189 13.3%
2002 57,332 21,032 39.3 64.9% 8,371 13.8%
2001 57,930 30,843 * 53.9% 8,597 6.8%
Sources:
1) U. S. Census, 1990 and 2000; figures are adjusted estimates prepared by the University of Virginia
Weldon Cooper Center for Public Service.
2) Bureau of Economic Analysis. Figures are for Martinsville and Henry County combined;
Henry County only figures not available; information based on latest available data.
3) U. S. Census, 2000; figures for other years are unavailable.
4), 5) Henry County Public Schools
6) Virginia Employment Commission
* Information is not available.
Henry County Public Service Authority
Demographic Statistics
Last Ten Fiscal Years
30
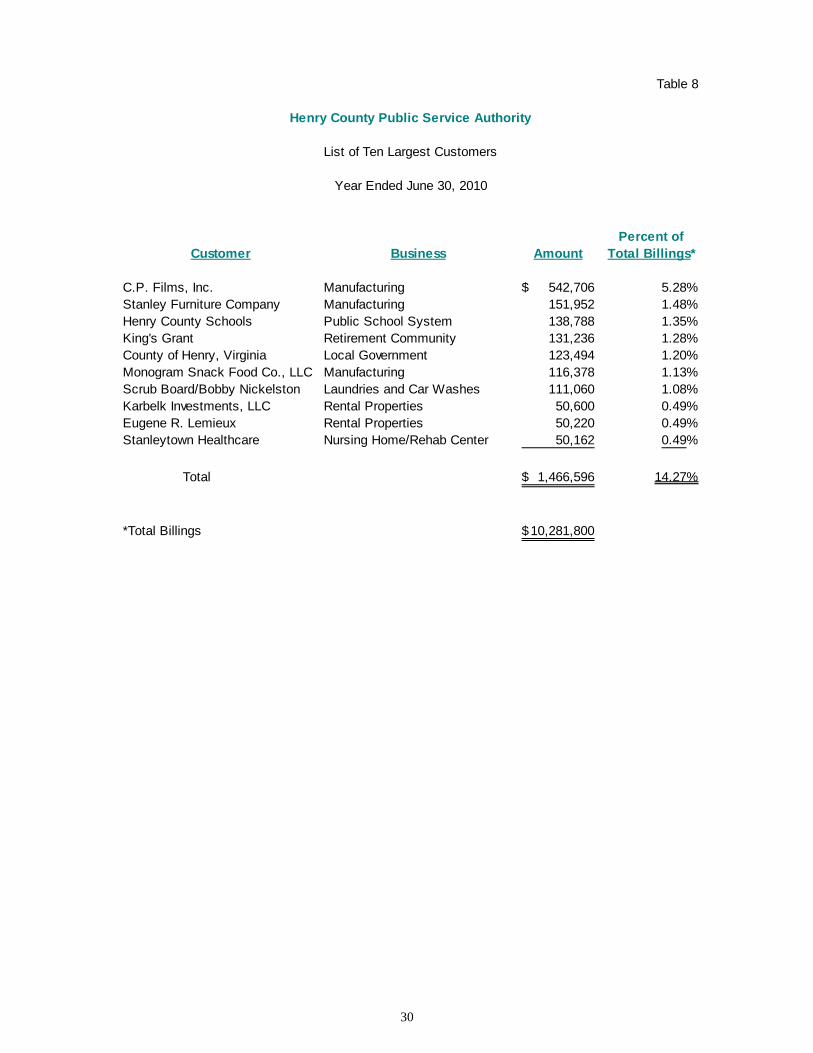
Table 8
Percent of
Customer Business Amount Total Billings*
C.P. Films, Inc. Manufacturing 542,706$ 5.28%
Stanley Furniture Company Manufacturing 151,952 1.48%
Henry County Schools Public School System 138,788 1.35%
King's Grant Retirement Community 131,236 1.28%
County of Henry, Virginia Local Government 123,494 1.20%
Monogram Snack Food Co., LLC Manufacturing 116,378 1.13%
Scrub Board/Bobby Nickelston Laundries and Car Washes 111,060 1.08%
Karbelk Investments, LLC Rental Properties 50,600 0.49%
Eugene R. Lemieux Rental Properties 50,220 0.49%
Stanleytown Healthcare Nursing Home/Rehab Center 50,162 0.49%
Total 1,466,596$ 14.27%
*Total Billings 10,281,800$
Henry County Public Service Authority
List of Ten Largest Customers
Year Ended June 30, 2010
31
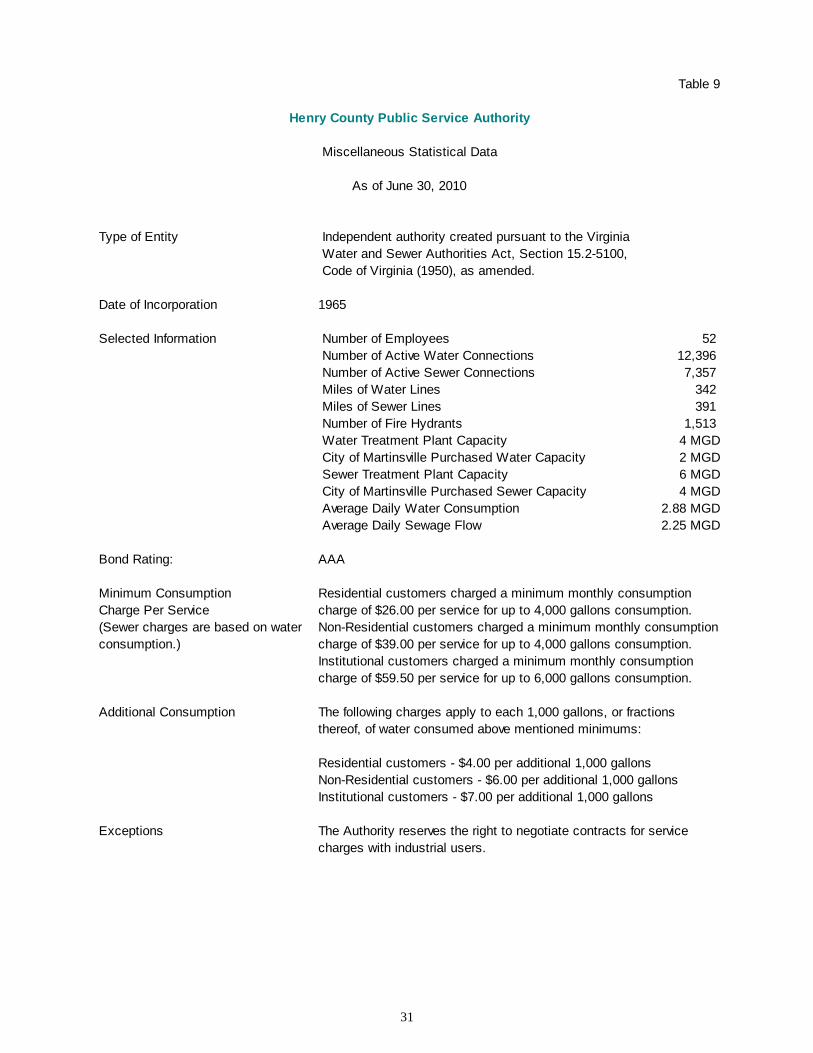
Table 9
Type of Entity Independent authority created pursuant to the Virginia
Water and Sewer Authorities Act, Section 15.2-5100,
Code of Virginia (1950), as amended.
Date of Incorporation 1965
Selected Information Number of Employees 52
Number of Active Water Connections 12,396
Number of Active Sewer Connections 7,357
Miles of Water Lines 342
Miles of Sewer Lines 391
Number of Fire Hydrants 1,513
Water Treatment Plant Capacity 4 MGD
City of Martinsville Purchased Water Capacity 2 MGD
Sewer Treatment Plant Capacity 6 MGD
City of Martinsville Purchased Sewer Capacity 4 MGD
Average Daily Water Consumption 2.88 MGD
Average Daily Sewage Flow 2.25 MGD
Bond Rating: AAA
Minimum Consumption Residential customers charged a minimum monthly consumption
Charge Per Service charge of $26.00 per service for up to 4,000 gallons consumption.
(Sewer charges are based on water Non-Residential customers charged a minimum monthly consumption
consumption.) charge of $39.00 per service for up to 4,000 gallons consumption.
Institutional customers charged a minimum monthly consumption
charge of $59.50 per service for up to 6,000 gallons consumption.
Additional Consumption The following charges apply to each 1,000 gallons, or fractions
thereof, of water consumed above mentioned minimums:
Residential customers - $4.00 per additional 1,000 gallons
Non-Residential customers - $6.00 per additional 1,000 gallons
Institutional customers - $7.00 per additional 1,000 gallons
Exceptions The Authority reserves the right to negotiate contracts for service
charges with industrial users.
Henry County Public Service Authority
Miscellaneous Statistical Data
As of June 30, 2010

COMPLIANCE

32
P. O. Box 1113 P. O. Box 487 410 North Ridge Road P. O. Box 147
204 S. Main Street 828 N. Mecklenburg Avenue Suite 215 313 N. Main Street
Emporia, Virginia 23847 South Hill, Virginia 23970 Richmond, Virginia 23229 Lawrenceville, Virginia 23868
434-634-3111 FAX: 434-634-6895 434-447-7111 FAX: 434-447-5793 804-837-1638 434-848-4191 FAX: 434-848-1009
www.cja-cpa.com
A Professional Corporation
Creedle
Jones
& Alga
James A. Allen, Jr., CPA Nadine L. Chase, CPA
Nadia A. Rogers, CPA
Scott A. Thompson, CPA
REPORT ON INTERNAL CONTROL OVER FINANCIAL REPORTING AND ON COMPLIANCE AND OTHER MATTERS BASED ON AN AUDIT OF FINANCIAL STATEMENTS
PERFORMED IN ACCORDANCE WITH GOVERNMENT AUDITING STANDARDS To the Board of Directors Henry County Public Service Authority Collinsville, Virginia We have audited the accompanying financial statements of the governmental activities and the business-type activities of Henry County Public Service Authority, as of and for the year ended June 30, 2010, and have issued our report thereon dated November 23, 2010. We conducted our audit in accordance with auditing standards generally accepted in the United States of America; Specifications for Audits of Authorities, Boards and Commissions, issued by the Auditor of Public Accounts of the Commonwealth of Virginia; and the standards applicable to financial audits contained in Government Auditing Standards, issued by the Comptroller General of the United States. Internal Control Over Financial Reporting In planning and performing our audit, we considered Henry County Public Service Authority’s internal control over financial reporting as a basis for designing our auditing procedures for the purpose of expressing our opinions on the financial statements, but not for the purpose of expressing an opinion on the effectiveness of Henry County Public Service Authority's internal control over financial reporting. Accordingly, we do not express an opinion on the effectiveness of the Henry County Public Service Authority's internal control over financial reporting. A deficiency in internal control exists when the design or operation of a control does not allow management or employees, in the normal course of performing their assigned functions, to prevent, or detect and correct misstatements on a timely basis. A material weakness is a deficiency, or a combination of deficiencies, in internal control such that there is a reasonable possibility that a material misstatement of the entity’s financial statements will not be prevented, or detected and corrected on a timely basis. Our consideration of internal control over financial reporting was for the limited purpose described in the first paragraph of this section and was not designed to identify all deficiencies in internal control over financial reporting that might be deficiencies, significant deficiencies, or material weaknesses. We did not identify any deficiencies in internal control over financial reporting that we consider to be material weaknesses, as defined above.
Sherwood H. Creedle, CPA
Robin B. Jones, CPA, CFP
David V. Alga, CPA, CVA, CFF
Denise C. Williams, CPA, CSEP
Members of
American Institute of Certified Public Accountants
Virginia Society of Certified Public Accountants

33
Henry County Public Service Authority Page 2 Compliance and Other Matters As part of obtaining reasonable assurance about whether Henry County Public Service Authority’s financial statements are free of material misstatement, we performed tests of its compliance with certain provisions of laws, regulations, contracts, and grant agreements, noncompliance with which could have a direct and material effect on the determination of financial statement amounts. However, providing an opinion on compliance with those provisions was not an objective of our audit and, accordingly, we do not express such an opinion. The results of our tests disclosed no instances of noncompliance or other matters that are required to be reported under Government Auditing Standards. This report is intended solely for the information and use of management, the audit committee, Board of Directors, and others within the entity and is not intended to be and should not be used by anyone other than these specified parties.
Creedle, Jones & Alga, P.C. Certified Public Accountants South Hill, Virginia November 23, 2010