Embed Size (px)
Citation preview

A&A 475, 281–300 (2007)DOI: 10.1051/0004-6361:20077889c© ESO 2007
Astronomy&
Astrophysics
Herbig-Haro flows in B335�,��,���,†
M. Gålfalk and G. Olofsson
Stockholm Observatory, Swedene-mail: [email protected]
Received 15 May 2007 / Accepted 7 September 2007
ABSTRACT
Aims. To study the Herbig-Haro flows in the nearby dark globule B335. To find new HH objects and H2 knots, make a proper motionmap of the flow activity and investigate physical properties through shock models.Methods. We have observed optical (Hα and [SII]) and near-IR (2.12 µm H2) deep fields and taken optical spectra using the2.56 m Nordic Optical Telescope, as well as a near-UV deep field (U band) using the 3.58 m NTT. In addition we present newSPITZER / IRAC (3.5–8.0 µm) and MIPS (24 µm) observations. We use previous Hα and 2.12 µm H2 observations taken 15 and9 years earlier to make proper motion maps. We then investigate the shock physics by matching our spectra with planar shock models.Results. We discover five new HH objects (HH 119 D–H) in the eastern and one (HH 119 I) in the western lobe of the outflow. Fromproper motions we find an optically bright, roughly E–W oriented group with high space velocities (200–280 km s−1) and a near-IRbright, slower group (15–75 km s−1) moving to the ESE. We also find a system of at least 15 H2 knots in the western lobe. This (WNW)counterflow suggests the possibility of a binary outflow source, giving rise to two outflow axes with slightly different orientations. Wefind that the E–W flow is symmetrical with evidence for two outbursts. We make the first detection of [OI] λλ 6300/63 in HH 119 Band Hβ in HH 119 A and B and find their extinctions to be AV ≈ 1.4 and 4.4, respectively. HH 119 A is found to expand much fasterthan expected from linear expansion with distance from the outflow source. Using planar shock models we find shock velocities of∼60 km s−1 (A) and ∼35 km s−1 (B and C). This agrees with A being of higher excitation than B and C. In our U image we detect threeof the HH objects and propose that the emission arise from the [OII] λ3728 line and the blue continuum. New SPITZER / IRAC andMIPS observations show most of the HH objects at 4.5 µm and a E–W elongated hour-glass shaped structure at the outflow source.Even at 24 µm it is not clear whether most of the light is direct or reflected.
Key words. ISM: jets and outflows – infrared: ISM – ISM: lines and bands – stars: formation – ISM: individual objects: B335 –ISM: individual objects: HH119
1. Introduction
The nearby prototypical globule B335 is located at about 250 pc,as estimated from star counts (Tomita et al. 1979). It is veryisolated and contains a deeply embedded, low-luminosity, low-temperature outflow source (Frerking & Langer 1982). The ex-tinction towards this central outflow source is extremely large(AV > 320 mag, e.g. Chandler et al. 1990). This explains whythe central object has only been seen at far-IR (Keene et al.1983) and longer wavelengths. It has been observed in sub-mm(Chandler et al. 1990) and at 3.6 cm using the VLA with increas-ing resolutions, Anglada et al. (1992) (config D, ±9′′), Avilaet al. (2001) (config C, ±3′′) and Reipurth et al. (2002b) (con-fig A, sub-arcsec resolution). These observations have shownthat the source is variable over timescales of years (Avila et al.2001). Reipurth et al. (2002b) found the outflow source to be
� Based on observations made with the Nordic Optical Telescope, op-erated on the island of La Palma jointly by Denmark, Finland, Iceland,Norway, and Sweden, in the Spanish Observatorio del Roque de losMuchachos of the Instituto de Astrofisica de Canarias.�� This work is based in part on observations made with the SpitzerSpace Telescope, which is operated by the Jet Propulsion Laboratory,California Institute of Technology under a contract with NASA.��� Based on observations made with the New Technology Telescope,ESO (La Silla) under programme ID 077.C-0524.† NOT and NTT images in FITS format are only available in elec-
tronic form at the CDS via anonymous ftp tocdsarc.u-strasbg.fr (130.79.128.5) or viahttp://cdsweb.u-strasbg.fr/cgi-bin/qcat?J/A+A/475/281
clearly elongated at 3.6 cm in the east-west direction, along theoutflow axis, indicating a compact thermal radio jet. The com-bined observations makes the B335 outflow source one of theclearest examples of a so-called Class 0 source (André 1993), theearliest evolutionary phase of star formation, in which a deeplyembedded protostar and a bipolar outflow exists.
The central ∼1 × 1′ has previously been observed in deep Hand K band images using both Keck I (Hodapp 1998) and theHST (Harvey et al. 2001). Observational evidence for currentprotostellar collapse also exists, based on millimetre wave inter-ferometry (Harvey et al. 2003).
B335 is ideal for a case study of isolated star formation, asthere is absolutely no source confusion caused by OB stars oroutflows from other young stars, unlike most star forming re-gions. Its geometry is similar to that of the well-known HH 30(disk and outflow), being seen almost exactly from the side italso contains a bipolar molecular outflow accompanied by sev-eral Herbig-Haro (HH) objects lying in a line with roughly con-stant declination through the deeply embedded outflow source.The axis of this HH flow coincides with that of the molecularoutflow. However, as can been seen in an optical deep field ofB335 (e.g. the one in this paper) the extinction drops off rapidlyabout one arcminute from the centre, making it possible to dooptical spectroscopy of several of the HH objects.
The three HH objects known prior to this paper are calledHH 119 B (discovered as a HH candidate by Vrba et al. 1986;and confirmed by Reipurth et al. 1992) and HH 119 A and C(Reipurth et al. 1992). Hodapp et al. (1998) discovered several
Article published by EDP Sciences and available at http://www.aanda.org or http://dx.doi.org/10.1051/0004-6361:20077889

282 M. Gålfalk and G. Olofsson : Herbig-Haro flows in B335
H2 features (called HH 119 IR 1–5) using the 2.12 µm line ofH2. In this paper we contribute with a detailed investigationof the B335 HH flows using mid-IR Spitzer data, deep near-UV, optical and near-IR imaging and optical spectra, revealingsix new HH objects (two with previously seen near-IR counter-parts). We calculate the proper motion of HH objects and H2 fea-tures and for HH 119 A–C we use planar shock models to calcu-late shock velocities, shock compression, preshock densities andextinctions.
2. Observations and reductions
2.1. Ground based
All our ground based observations, except the near-UV imag-ing, were carried out at the 2.56 m Nordic Optical Telescope(NOT) located at 2382 m above sea level on the island ofLa Palma, Canary Islands. We have used the two camerasALFOSC (Optical spectroscopy and imaging) and NOTCam(Near-IR imaging). The near-UV deep field was obtained at the3.58 m New Technology Telescope (NTT) located at La SillaObservatory, Chile. For details, see the subsections below.
2.1.1. Optical spectra
The ALFOSC (Andalucia Faint Object Spectrograph andCamera) long-slit spectra along the optical Herbig-Haro flow ofHH 119 in B335 were obtained 16 May 2003 using grism #7(3850–6850 Å) with a slit width of 2.′′5 (R = 260). This slitwidth was suitable since the centres of HH 119 A–C have thesame declinations within 1.′′3 of each other, however, HH119 Ais extended but with a condensation to the south (HH119 A2;Reipurth et al. 1992) that was located inside the slit. With a slitlength of 6.′5 it was possible to observe all three objects in oneslit for a total exposure time of 2400 s. Even though the Moonwas full, this did not influence the spectra noticeably since a to-tal lunar eclipse was in fact occurring at the time of the obser-vations. ALFOSC has a 2048 × 2048 array with a pixel size of0.′′188 and the seeing was about 1.′′0 during the observations.There were only three known HH objects (A–C) at the time ofthe observations, but a fourth HH object (D), east of object C,was also within the slit due to the alignment of the slit alongconstant declination.
2.1.2. Near-IR deep field (2.12 µm H2)
We have made deep near-IR observations of B335 using the2.12 µm ν = 1−0 S(1) line of H2. In order to use as muchtelescope time as possible for the line observations, the corre-sponding continuum observations were made using a KS filter(2.14 µm central wavelength). The observations were made dur-ing 4 photometric nights, 4−8 July 2004, under seeing conditionsthat varied from poor to excellent. We used nb exposure times of119 s and KS (continuum) exposures of 32 s to avoid satura-tion in most bright stars. These exposure times had been testedon a previous run and were shown to keep the near-IR camera,NOTCam, within its linear regime throughout most of the im-age, without any large transient effects from bright sources thatcould otherwise have made a strong pattern in the mosaic fromthe dithering involved. After careful selection of all exposures,based on seeing, the final mosaic is both deep and sharp, with amean seeing of 0.′′68 and total central mosaic exposure times of23 205 s (6.45 h) and 2880 s (48 min) for the 2.12 µm line andKS band respectively.
NOTCam is an HAWAII 1024 × 1024 × 18.5 µm pixelHgCdTe array with a field-of-view of 4.′0 × 4.′0 (pixel size ofabout 0.′′23). Since the observations are used for proper mo-tion calculations we applied a distortion model for NOTCam(Gålfalk 2005) using only the very sharpest exposures by map-ping a relation between the on-CCD pixel positions of all known2MASS stars in the field to their known coordinates. Using thismodel we have successfully removed most of the previouslyseen distortion, and even at the mosaic edges the PSF of starsis circular.
A median sky is subtracted from the target (with equal ex-posure time) and in these observations, where we do not haveany really extended objects, we use small-step dithering be-tween each exposure and calculate a median sky from the on-frames themselves. This effectively more than doubles the on-target telescope time when compared to beam switching. Theflatfielding is also differential (skyflats observed with some timedelay and subtracted). Besides the usual reduction steps of near-IR imaging, using in-house routines (written in IDL), we alsowrote subroutines to find and remove bad pixels, remove im-age distortion, sub-pixel shifting and adding overlapping imagesto a mosaic taking into account pixel weighting of individualpixel exposure times. We also made a routine to remove anydark stripes that results from lowered sensitivity after a brightsource has been read out of the CCD – this could go unnoticedfor normal imaging but when a deep field is made with a lot ofoverlaps this can introduce a complicated pattern (especially af-ter distortion correction) that has to be removed in order to beable to keep a high contrast throughout the mosaic.
The two mosaics were then sub-pixel shifted in order to co-incide, scaled in brightness relative to each other and a con-stant added in order to emphasize H2 line emission by havingthe same background levels in both filter mosaics and setting asuitable contrast. The final image is a colour composite madeby RGB colour coding the line image into the red and greenchannels and the KS (continuum) image into the blue channel,resulting in a deep image (Fig. 1) where H2 emission featuresare clearly yellow while stars, galaxies and reflection nebulaeare made white/blue.
2.1.3. Western near-IR field (2.12 µm H2)
In May 2007 we made additional S(1) observations, also us-ing NOTCam, centred on HH 119 A which had not been im-aged before at near-IR wavelengths. This was also an attemptto find new H2 knots in the western outflow. The observationswere carried out on May 28 with total on-target exposure timesof 90 min in S(1) and 19.7 min in KS. The reductions weremade in a similar way as desribed in the S(1) deep field sec-tion (cf. Sect. 2.1.2). The seeing was excellent (0.31–0.′′45 inKS) throughout the night. Part of the resulting image can be seenin Fig. 2 which shows three near-IR counterparts of HH 119 Aand a new system of at least 15 S(1) knots to the west.
2.1.4. Optical deep field (Hα and [SII])
As a follow up to the near-IR nb-imaging we have also madedeep optical nb-observations in Hα and [SII] 6717/31. In addi-tion we have made corresponding R band observations to sam-ple the continuum for both nb filters. The observations wereobtained under good seeing conditions (average seeing 0.′′83)during 3 photometric nights, 3−6 Aug. 2005 with ALFOSC

M. Gålfalk and G. Olofsson : Herbig-Haro flows in B335 283
100 km / s
Fig. 1. Near-IR deep field of B335 in the 2.12 µm S(1) line of H2 (yellow) and KS (blue) representing the continuum. All previously knownH2 features are confirmed to belong to the bipolar outflow and their proper motions are shown by the arrows. The red arrow shows the high propermotion of a star (asterisk). The position of the outflow source as seen by VLA in the 3.6 cm continuum is marked with a plus sign. The propermotions are divided into two groups, HH 119 IR 1 and 5 moving along constant declination (similar to the optical HH flow) and IR 2–4 movingmore to the south east. However, the groups emanate from the same outflow source, as suggested by their proper motions and the cone-like featureat IR 2, with IR 2–4 and IR 5 being on opposite sides of a cone shaped cavity created by the outflow. The field of view is 3.′89 × 4.′13.
(Andalucia Faint Object Spectrograph and Camera). This instru-ment has a 2048 × 2048 CCD and at a PFOV of 0.′′188/pixel ithas a FOV of about 6.′4 × 6.′4. For both nb filters we used anexposure time of 600 s and for the R band 60 s was used in orderto avoid too much saturation of bright stars. The resulting threemosaics have total central exposure times of 24 000 s (6.67 h)Hα, 22 200 s (6.17 h) [SII] and 2340 s (39 min) for the R band(continuum).
In addition to the usual reduction steps of optical imaging(bias removal, flatfielding, cosmic ray removal) using our ownset of in-house IDL routines, we also made a camera distortion
model for ALFOSC using our sharpest exposure and the po-sitions of 163 USNO-A2 calibration stars. After distortion re-moval, all exposures in each filter were sub-pixel shifted andcombined, resulting in three mosaics. The final colour compos-ite mosaic was made with the RGB colour coding Hα (red chan-nel), [SII] (green channel) and R band (blue channel). Effortswere made to achieve a high contrast in the final mosaic, withthe same background level in all channels outside of nebulousregions and a colour scaling that makes most stars white, nebu-lae blue, Hα and [SII] emission features clearly red and green,respectively.

284 M. Gålfalk and G. Olofsson : Herbig-Haro flows in B335
Fig. 2. Near-IR image of western B335 in the 2.12 µm S(1) line of H2 (yellow) and KS (blue) representing the continuum. A near-IR counterpart ofHH 119 A (which we call IR 7) is found as well as an extended new system of S(1) features further to the west. The HH 119 A counterpart consistsof three parts, two fairly bright S(1) features (IR 7a and b) reminiscent of the optical shock but clearly broken up and a fainter part (7c) coincidingwith a region of extended [SII] emission in the optical. We find 15 S(1) knots (IR 8a–o) in the extended S(1) feature to the west, one (IR 8n) whichis also seen in Hα and [SII] (Fig. 4) and classified as an Herbig-Haro object (HH 119 I). The field of view is 2.′30 × 1.′58.
The resulting colour mosiac is shown in Figs. 3 and 4. Allthe detected Herbig-Haro objects, except HH 119 I (Fig. 4), areshown in more detail in Fig. 5.
2.1.5. Near-UV deep field
Using EMMI on the 3.58 m New Technology Telescope (ESO)during four nights, 28 Jun.−01 Jul. 2006, we have obtained 37 ×720 s exposures of B335 in the U band, resulting in a total expo-sure time of 26 640 s (7.4 h). The filter, U602, is a Bessel U bandfilter centred on 3542 Å (covering roughly 3100−4000 Å) andits transmission curve is shown in Fig. 6. The usual reductionsteps of optical reductions were applied, including bias removal,flat fielding and shift-and-add to correct for tracking errors andsmall-step dithering between images. The sigma-clipping tech-nique was used to remove all cosmic rays after making the skymean value equal in all exposures.
The EMMI-Blue/NTT 1024 × 1024 chip gives a pixel andimage field of view of 0.′′362 and 6.′2 × 6.′2, respectively. Theaverage airmass in these observations is 1.35 and the averageseeing 2.′′03.
2.2. Spitzer space telescope
Spitzer is an IR space telescope that carries a 85 cm cryogenictelescope and three cryogenically cooled science instruments,one of these is the Infrared Array Camera (IRAC) that provides
simultaneous 5.′2 × 5.′2 images in four channels, centred at 3.6,4.5, 5.8 and 8.0 µm. Each channel is equipped with a 256 ×256 pixel detector array with a pixel size of about 1.′′2 × 1.′′2.Another instrument is the Multiband Imaging Photometer forSpitzer (MIPS) that contains three separate detector arrays, mak-ing simultaneous observations possible at 24, 70, and 160 µm.
The Spitzer data used in this paper (see Table 1) were ob-tained from the Spitzer Science Archive using the Leopard soft-ware. All data had been reduced to the Post-Basic CalibratedData (pbcd) level. We use all channels of the IRAC observations,and some in-house routines to reduce them further and especiallyto make a colour composite image. From the MIPS data, we onlyuse the 24 µm observations because of its higher resolution andbecause the other two channels are full of artefacts (probablydue to saturation). The 24 µm camera has a format of 128 ×128 pixels and a pixel size of 2.′′55. In order to plot Spitzer con-tours on our ground-based observations, although very differentresolutions, we matched all stars seen in the Spitzer 24 µm mo-saic with both our KS and R band observations and corrected fordifferences in FOV, distortion and image rotation.
2.3. Proper motions
2.3.1. Near-IR first epoch image
In order for us to map the IR proper motions of as many H2 fea-tures as possible we needed a previous epoch of 2.12 µm ob-servations, having a long enough time span to show the proper

M. Gålfalk and G. Olofsson : Herbig-Haro flows in B335 285
100 km / s
Fig. 3. Optical deep field of B335 using a composite of Hα (red), S[II] (green) and the R band (blue). The first thing we note is that the molecularcloud surrounding the globule shines unevenly across the image, with both nebulous patches and hole-like features. This is probably caused byscattered starlight (in the R band). HH 119 A–E are located in an almost perfect line along constant declination, with proper motions showing themto be part of the same bipolar HH flow. Note that the proper motion arrow for object F is displaced to fit inside the figure. The Spitzer contoursshow the outflow source region at 8.0 µm (red, solid curves) and 24 µm (yellow, dotted curves). The VLA outflow source position is marked witha white plus sign. At 8.0 µm there is a clear bipolar-like feature caused by reflected light whereas the 24 µm observations have a single peak witha location close to the VLA source. The red cross marks the origin HH 119 A would have had based on its current expansion alone (Fig. 12),suggesting that this bow shock is currently expanding much faster than before. The field of view is 5.′18 × 4.′20.
motions with reasonable accuracy, but at the same time with highenough quality to show as many of our recently observed H2 ob-jects as possible given that the new epoch is a deep field. Wewould like to thank Klaus-Werner Hodapp for kindly provid-ing us with the first epoch observations, in the form of a deep(8200 s or about 2.3 h) mosaic taken with the 2.2 m Universityof Hawaii telescope. These observations were made using theQuick Infrared Camera (QUIRC) mounted at the f/10 focus,yielding a pixel size of 0.′′185 (not that far from our secondepoch images, 0.′′23). Since these observations were obtainedbetween 8−10 July 1995 (and our second epoch observations4−8 July 2004) we have a time span of about 9 years betweenthe epochs. For more information about the first epoch observa-tions see Hodapp et al. (1998).
2.3.2. Optical first epoch image
For our optical proper motions, we used an even larger time span(roughly 15 years) than for the IR case. We would like to thank
Bo Reipurth for kindly providing us with the original Hα im-ages from Reipurth et al. (1992), taken in August 1990 with the3.58 m New Technology Telescope (NTT). These observationsare deep enough and have a long enough time span when com-bined with our images to yield accurate proper motions. The in-strument used in these observations, EMMI, provided a field sizeof 7.′5 × 7.′5 when used with a Thompson 1024 × 1024 pixelchip, yielding a pixel size of 0.′′44 (rougly twice the pixel size ofour Aug. 2005 observations).
2.3.3. Calculations and accuracy
We refer to Sect. 3 in Gålfalk & Olofsson (2007) for details onour method for calculating proper motions. In short, we fit allstars seen in both epoch images using a two-dimensional ellip-tical Gaussian. Stars with measurable proper motions are elimi-nated in the solution. After warping the lower resolution imageto fit the one with higher resolution, the images are shifted foreach object in sub-pixel (0.1 pixel) steps until the object overlaps

286 M. Gålfalk and G. Olofsson : Herbig-Haro flows in B335
Fig. 4. The westernmost part of our Hα (red), S[II] (green) and R band (blue) deep field. The number of exposures and therefore S/N decreasesto the west because of flat field uncertainties and image dithering during the observations. After correcting for background variations most of theextended system of S(1) knots is covered, however, only one of these bright S(1) knots is detected in the optical. This object, IR 8n, is seen in bothHα and [SII] and confirmed as a bona-fide HH object (HH 119 I). The field of view is 1.′95 × 1.′60.
itself in both epochs, and a proper motion is found. For each stepthe matching is judged by blinking the two images at differentrates and by making a colour image using two colour channels(red and blue). The accuracy is similar for our optical and near-IR proper motions (about 12 km s−1), except for HH 119 C (closeto a bright star) and HH 119 F (faint in the first epoch image).
3. Results and discussion
3.1. New HH objects and H2 knots
Using our deep optical and near-IR mosaics, in combinationwith the proper motions obtained from these and the addi-tional information from optical spectra, we confirm that twoof the previously known 2.12 µm H2 features (IR 4 and 5 inHodapp et al. 1998) have optical counterparts that are bona-fide HH objects (named HH 119 G and D). Four more HH ob-jects are also discovered in our optical deep field (we call theseHH 119 E, F, H and I). These six new HH objects can be seenin Figs. 3–5. HH 119 H was first found as an IR H2 feature inthe Spitzer/IRAC mosaic (Fig. 15). However, it is also faintly
detected in Hα (Fig. 5) and given its position in the E–WHH flow it is classified as an HH object.
Many of the HH objects have the appearance of bow shockswith clearly separated Hα and [SII] emission. A summary of allshocks is given in Table 2 and the photometry is presented inTable 3. Only three of these objects, HH 119 A–C, were knownHH objects prior to this survey. We have followed the same nam-ing scheme, and named Herbig-Haro objects using letters fromD to I.
There is a rough symmetry in HH 119 A–F and H, lyingapproximately in a line through the outflow source, all at tworoughly symmetric projected distances, possibly correspondingto two outburst episodes in the central source. The innermostHH object in the western lobe, HH 119 B (58.′′2 from the out-flow source), has two counterparts in the eastern lobe, HH 119 C(61.′′2) and D (73.′′3). The outermost western object, HH 119 A(142.′′3), has three counterparts in the eastern lobe, HH 119 E(123.′′4), F (126.′′4) and H (139.′′4). HH 119 G is not located onthis line roughly along constant declination, instead this object ismoving more to the south east, in the same group as IR knots 2,3, 4a and 4b (Fig. 1). All these IR knots are likely to have opticalcounterparts, however, due to the high extinction in this part of

M. Gålfalk and G. Olofsson : Herbig-Haro flows in B335 287
Fig. 5. All Herbig-Haro objects in our optical deep field (HH119 A–H), except object I (See Fig. 4). The colour composition is the same as inFig. 3. HH119 A and B belong to the west outflow lobe while C–H are part of the eastern lobe. In the case of object C, located very close to abright star, this star has been removed at the position marked with a red plus sign, using the PSF of another bright star in the image. The centralpart of the removed star has been blocked out because of strong residuals that could not be removed. Another star can be seen very close to thenorth of the removed PSF and the C shock itself is fairly extended in both Hα and [SII] and shows no strong condensations. Objects A, B, Dand F clearly have Hα bow-shocks leading a [SII] cooling zone, meaning that the flow moves into a less dense ambient medium as opposed toshock G which moves into a denser medium. Object E has a leading shock dominated by a line in the R band that is not Hα or [SII], probably[OI] λλ 6300/63 emission. The field of view in each panel is 38′′ × 38′′, except for HH 119 C where the field size is 24′′ × 24′′.
the flow only knot 4a is detected in the optical and confirmed asan HH object.
In the western lobe we discover a system of 15 new H2 knotsand three counterparts to HH 119 A (Fig. 2).
3.2. Near-IR shocks
Our 2.12 µm H2 deep field is presented in Fig. 1 along withshock names and arrows illustrating the calculated proper mo-tions. The near-IR proper motions and projected shock veloci-ties are also given in Table 4. There is an apparent division ofthe shocks into two groups, one (IR 1 and 5) that coincides withthe optical HH flow along almost constant declination, and an-other group (IR 2–4) with a position angle of about 115◦ (mov-ing to the ESE). The projected velocity vectors suggest that bothgroups emanate from the outflow source in the centre of B335(marked by a plus sign in the deep field image). Looking at theeast (blue-shifted) lobe, the faint cone-like feature close to theoutflow source in the near-IR (Fig. 1) and the mid-IR Spitzerdata (Fig. 15), combined with the proper motions suggest thatthe two groups in the eastern lobe are on the opposite sides of acone-shaped cavity, cleared out by the molecular outflow.
While the first group (IR 1 and 5) is bright in the opticallines, only the brightest peak in the second group, IR 4a, is seenin our optical Hα and [SII] deep fields. The reason for this
could be higher extinction but another reason is hinted by theslower projected velocities, slow moving (C-type) shocks arenon-dissociative, instead molecules like H2 are kept intact and isa good tracer of such shock environments. Fast moving (J-type)shocks instead break up molecules, making such shocks brightin atomic lines such as Hα and λλ 6717, 6731 [SII].
West of the outflow source (in the red-shifted lobe) we findat least 16 H2 knots, one in the deep field (IR 1) and an ex-tended system of knots in the western field (Fig. 2). Althoughwe lack proper motions for this system, they are most likely partof a counterflow to the ESE flow. This suggests the possibilityof a binary outflow source, giving rise to both an E–W and anESE–WNW outflow axis.
The only western knot for which we have previous obser-vations, IR 1, shows a proper motion that points almost exactlyaway from the VLA outflow source. Although very different inappearance, this shock coincides very well with the southern partof the optically (Hα and [SII]) strong, nicely defined, bow shockHH 119 B. With both the near-IR and optical shocks having aproper motion position angle of roughly 260◦ and partly over-lapping each other, it is clear that they are both part of the sameHH flow and originate from the central outflow source. However,how they are physically related is not equally clear from posi-tions and proper motions alone. A similar separation applies forthe optical and near-IR images of HH 119 D (IR 5). A more de-tailed discussion in given in Sect. 3.8 where it is shown that both

288 M. Gålfalk and G. Olofsson : Herbig-Haro flows in B335
Fig. 6. Transmission curves for the UV observations. The three red curves represent the three major components of the system: atmospherictransmission (dotted), detector QE (dashed) and the Bessel U filter (solid). The solid black curve is the total transmission, with all three red curvesincluded. Important emission lines in this wavelength range, seen in UV spectra of HH objects (Hartigan et al. 1999) are marked by verticallines. The horizontal line roughly marks the most contributing part of the blue continuum and the corresponding spectral energy distribution ofthe two-photon transition is shown by the blue curve (long dashed) in percentage of its peak value. It is clear that only [OII] 3728 and the bluecontinuum are likely contributors to the near-UV emission we see from three of the HH objects in B335 (A, B and E).
Table 1. Spitzer archive data used.
Prog.ID P.I. Key Type Released Scheduled94 Lawrence C. 4926464 IRAC Mapping 2005-06-24 2004-04-2153 Rieke G. 12022016 MIPS Scan Map 2005-11-09 2004-10-15
IR 1 and IR 5 likely trace parts of bow shocks HH 119 B andD, respectively, that have lower shock velocities (i.e. the outerwings of these bow shocks).
3.3. Optical shocks
Our optical deep field (Fig. 3) shows five HH objects(HH 119 A–E) in an almost exact line along constant declina-tion. This is a very clear case of a bipolar HH flow, with propermotions (Table 5) and bow shock morphologies that would beexpected from their positions relative to the outflow source.The projected space velocities of the optically bright and neatlylined up HH objects HH 119 A–D (200−280 km s−1) are muchfaster than the near-IR bright SSE moving groups 3 and 4(15−75 km s−1).
One explanation for this could be if the fast moving, east-west flow, contains gas expelled into an already cleared outbipolar cone by the outflow source. The optically bright shocks,HH objects, could then be caused by faster gas moving intoslower gas (with shock velocities much lower than the space ve-locities measured from proper motions). However, at the edgeof the cone-shaped cavity the expelled gas could interact morewith the surrounding globule itself via turbulence, making thesenear-IR shocks have slower space velocities, almost stationary,due to the encounter with the probably slow moving gas of theglobule.
Given that several HH objects are now known on each sideof the outflow source, all having similar space velocities, theshocks within each lobe have different dynamical ages and there
has thus been repeated eruptive episodes where matter from theaccretion is expelled into the outflow lobes. Objects B and Care located symmetrically about the outflow source, moving inopposite directions, and were probably expelled in the same out-burst. Using their (optical) proper motions and distances fromthe central VLA source we find dynamical ages of about 250and 265 years for HH 119 B and C, respectively. The proper mo-tions and dynamical ages of objects B anc C was also measuredby Reipurth et al. (1992) who suggested that this outburst mayhave occurred 350 years ago.
There are four more HH objects seen in the optical deepfield, HH 119 F–I. Objects F and H are located in the easternlobe of the E–W flow, close to the HH 119 A–E line, while ob-jects G (east) and I (west) seem to belong to the tilted (roughlyESE−WNW) flow. HH 119 I is the westernmost object in thisflow, and an optical counterpart of an H2 knot (IR 8n) in a sys-tem of at least 15 knots. Since these HH objects (and object D)are new detections, their proper motions are unknown, exceptfor object F which is faintly seen in the Hα first epoch mosaic.Its appearance, bow shaped with a clear separation of Hα and[SII], and its location relative to the outflow source agrees wellwith the calculated proper motion. The other objects are clearlyHH objects even though they lack proper motions, based on theirextended nature, separation of Hα and [SII], shapes and loca-tions on the outflow axis. As a further confirmation of HH sta-tus for these objects, HH 119 E, G and H are clearly seen in theshock sensitive Spitzer filter centred at 4.5 µm (Fig. 15) alongwith most of the other HH objects. The reason for this is dis-cussed in Sect. 3.7.

M. Gålfalk and G. Olofsson : Herbig-Haro flows in B335 289
Table 2. Geometry of all Herbig-Haro objects and H2 knots.
HH 119 a RA b Dec b Size c Regime Structure d Reference Comment(2000) (2000) (′′) (first)
A (IR 7) 19:36:51.32 07:34:10.5 6.1 × 17.2 Optical Hα / [SII] Reipurth 1992 Bow shock(A1) 19:36:51.32 07:34:10.5 .... " .... " Hα peak and background star(A2) 19:36:51.47 07:34:06.8 .... " .... " Hα peak (South)(A3) 19:36:51.46 07:34:15.2 .... " .... " Hα peak (North)B (IR 1) 19:36:56.98 07:34:06.0 8.0 × 13.2 Optical Hα / [SII] Vrba 1986 Bow shockC 19:37:05.00 07:34:06.0 1.7 × 4.4 Optical Hα + [SII] Reipurth 1992 No separation between [SII] and HαD (IR 5) 19:37:05.82 07:34:07.2 3.7 × 7.2 Optical Hα / [SII] This paper Hα bow shock, two [SII] bulletsE 19:37:09.19 07:34:06.5 5.6 × 8.6 Optical [SII] e / Hα This paper Leading feature bright in R bande
F 19:37:09.39 07:33:46.0 4.6 × 5.1 Optical Hα / [SII] This paper Bow shockG (IR 4a) 19:37:04.75 07:33:38.3 2.7 × 2.9 Optical [SII] / Hα This paperH 19:37:10.22 07:33:56.8 5.4 × 4.4 Optical Hα This paper More extended at 4.5 µmI (IR 8n) 19:36:45.41 07:34:40.2 2.3 × 3.4 Optical Hα + [SII] This paper Part of a WNW flowIR 1 19:36:57.22 07:34:01.7 3.0 × 5.4 Near-IR Hodapp 1998 IR counterpart of HH 119 BIR 2 19:37:01.50 07:34:08.5 2.3 × 2.4 Near-IR Hodapp 1998IR 3 19:37:03.89 07:33:49.6 11.7 × 3.5 Near-IR Hodapp 1998IR 4 19:37:05.22 07:33:39.3 21.6 × 6.3 Near-IR Hodapp 1998 Large and irregularIR 4a 19:37:04.66 07:33:36.6 4.5 × 1.2 Near-IR This paper IR counterpart of HH 119 GIR 4b 19:37:05.77 07:33:39.3 3.7 × 2.1 Near-IR This paper Condensation within IR 4IR 5 19:37:05.70 07:34:09.5 13.8 × 11.5 Near-IR Hodapp 1998 IR counterpart of HH 119 DIR 7a 19:36:51.39 07:34:12.7 3.7 × 8.4 Near-IR This paper North IR segment of AIR 7b 19:36:51.53 07:34:05.4 2.8 × 4.7 Near-IR This paper South IR segment of AIR 7c 19:36:50.93 07:34:06.5 2.6 × 3.8 Near-IR This paper Segment in front of bow AIR 8a–o 19:36:46 07:34:26 58 × 33 Near-IR This paper Extended system of 15 H2 knotsIR 8f 19:36:46.23 07:34:27.2 0.9 × 1.6 Near-IR This paper One of the brightest knots in IR 8IR 8i 19:36:46.02 07:34:29.1 0.9 × 0.7 Near-IR This paper One of the brightest knots in IR 8IR 8n 19:36:45.39 07:34:41.4 2.3 × 2.6 Near-IR This paper IR counterpart of HH 119 I
a Letters designate Herbig-Haro objects, while IR numbers designate H2 knots.b Optical positions in Hα (04 Aug. 2005) and near-IR positions in 2.12 µm H2 (06 Jul. 2004; 29 May 2007 for IR 7 and 8).c Approximate bounding box sizes, determined visually.d Leading / trailing flux peak.e The leading feature is easier seen in R than [SII], most likely due to a strong line other than Hα and [SII].
Table 3. Flux summary.
HH 119 FUa F [Hα]b F [SII]c F [S(1)]d F4.5
e F [SII] / F [Hα] f
(1) (2) (3) (4) (5) (6) (7)A (IR 7) 8.50 ± 0.34 17.34 ± 0.91 9.94 ± 0.47 17.12 ± 0.38 93 ± 19 0.573 ± 0.018B (IR 1) 1.45 ± 0.07 05.92 ± 0.34 7.87 ± 0.44 2.73 ± 0.11 103 ± 13 1.330 ± 0.030C ... 03.54 ± 0.18 7.36 ± 0.41 ... 2.079 ± 0.018D (IR 5) ... 01.40 ± 0.08 2.45 ± 0.10 10.95 ± 0.17 107 ± 19 1.749 ± 0.077E 1.23 ± 0.06 00.79 ± 0.06 0.51 ± 0.03 out 40 ± 7 0.65 ± 0.11F ... 00.78 ± 0.05 2.16 ± 0.12 out 67 ± 8 2.78 ± 0.10G (IR 4a) ... 0.144 ± 0.007 0.065 ± 0.004 6.91 ± 0.14 45 ± 11 0.45 ± 0.15H (IR 6) ... 00.07 ± 0.01 ... out 147 ± 17 ...I (IR 8n) out 01.64 ± 0.06 0.24 ± 0.03 5.58 ± 0.18 out 0.148 ± 0.021IR 2 ... ... ... 1.36 ± 0.03 ...IR 3 ... ... ... 7.71 ± 0.15 41 ± 6 ...IR 4 ... ... ... 21.59 ± 0.30 134 ± 13 ...IR 4b ... ... ... 2.40 ± 0.05 14 ± 3 ...IR 7a ... ... ... 11.04 ± 0.34 ... ...IR 7b ... ... ... 5.43 ± 0.17 ... ...IR 7c ... ... ... 0.66 ± 0.03 ... ...IR 8f out ... ... 5.29 ± 0.17 out ...IR 8i out ... ... 4.34 ± 0.14 out ...
a Integrated U band flux in units of 10−15 erg s−1 cm−2, effective filter width is 408.8 Å (from total transmission curve).b Emergent flux in Hα, in units of 10−15 erg s−1 cm−2.c Emergent flux in the 6717+6731 [SII] lines, in units of 10−15 erg s−1 cm−2.d Emergent flux in the H2 µ = 1−0 S(1) 2.12 µm line, in units of 10−15 erg s−1 cm−2.e Integrated flux of Spitzer IRAC 2 (4.5 µm) in units of 10−15 erg s−1 cm−2. HH 119 C and IR2 close to bright sources.f Mean flux ratio including full object extension.

290 M. Gålfalk and G. Olofsson : Herbig-Haro flows in B335
Table 4. IR proper motion results. Column 1 gives the H2 feature designation, as given in Fig. 1. Columns 2–4 give the angular distance eachshock has moved between the two epochs (9 years apart). Columns 5−7 are the proper motions and finally Cols. 8, 9 the (tangential) velocities andpositional angles. Uncertainties are given at the bottom of the table (except for the PA which is given for each row).
HH 119 ∆α ∆δ ∆tot µα µδ µtot vel PA a Comment(′′) (′′) (′′) (mas/yr) (mas/yr) (mas/yr) (km s−1) (deg)
(1) (2) (3) (4) (5) (6) (7) (8) (9) (10)IR 1 (B) –1.51 –0.24 1.53 –168 –27 170 201 261 ± 3IR 2 +1.53 –0.61 1.65 +170 –68 183 217 112 ± 3IR 3 +0.17 –0.09 0.19 +19 –10 21 25 119 ± 24IR 4a (G) +0.06 –0.11 0.12 +6 –12 14 16 153 ± 37IR 4b +0.45 –0.35 0.57 +50 –39 63 75 128 ± 9IR 5 (D) +1.86 0 1.86 +207 0 207 245 90 ± 2Star +0.17 –0.35 0.39 +19 –39 44 ... 155 ± 8 Marked in Fig. 1
± 0.06 ± 0.06 ± 0.09 ± 7 ± 7 ± 10 ± 12
a Position Angle: North 0◦, East 90◦, South = 180◦, West 270◦.
Table 5. Optical proper motion results. Column 1 are the HH designations, as given in Fig. 3. Columns 2−4 give the angular distance each shockhas moved between the two epochs (15 years apart). Columns 5−7 are the proper motions and finally Cols. 8, 9 the (tangential) velocities andpositional angles. Uncertainties are given at the bottom of the table (except for the PA where this is given in each row).
HH 119 ∆α ∆δ ∆tot µα µδ µtot vel PA a
(′′) (′′) (′′) (mas/yr) (mas/yr) (mas/yr) (km s−1) (deg)(1) (2) (3) (4) (5) (6) (7) (8) (9)A1 –3.00 ± 0.10 –0.49 ± 0.10 3.04 ± 0.12 –201± 7 –33± 7 203± 9 241± 10 261± 3A2 –2.43 ± 0.10 –0.97 ± 0.10 2.62 ± 0.13 –162± 7 –65± 7 175± 10 207± 11 248± 3A3 –2.34 ± 0.10 +0.53 ± 0.10 2.40 ± 0.12 –156± 7 +36± 7 160± 9 190± 10 283± 3B –3.40 ± 0.10 –0.91 ± 0.10 3.52 ± 0.13 –227± 7 –61± 7 235± 9 278± 11 255± 3C +3.42 ± 0.19 –0.57 ± 0.19 3.47 ± 0.22 +228± 13 –38± 13 231± 15 274± 18 100± 4F +3.23 ± 0.57 –0.57 ± 0.57 3.28 ± 0.66 +216± 38 –38± 38 219± 44 260± 53 100± 10
a Position Angle: North 0◦, East 90◦, South = 180◦, West 270◦.
HH 119 E has a different flux distribution than the otherHH objects. In Fig. 3 its leading shock is seen more clearly inthe R band than in [SII] emission (making the leading shocklook blue in the mosaic even though the R and [SII] positionof the shock overlaps, followed by the Hα shock). This is verylikely due to unusually bright [OI] λλ 6300/63 emission. Thesituation is similar to HH 119 B, which has bright [OI] emissionlines as seen in recent spectra (Fig. 7), but with an even higher[OI]/[SII] ratio since HH 119 B looks red-yellow-green acrossthe shock, using the same colour scaling.
HH 119 G, seen in both Hα and [SII], coincides very wellwith the brightest peak of the corresponding feature in the near-IR mosaic (H2 knot IR 4a) and has a separation between Hα and[SII] supporting the near-IR proper motion.
Objects A and E (F) are located roughly symmetrically onopposite sides of the outflow source and may belong to the sameoutburst, prior to the B and C outburst. We estimate the ages ofHH 119 A and F to be about 700 and 590 years, respectively. Thedifference of about 100 years in these estimates may be due tothe large uncertainty in proper motion for object F (which is onlyfaintly detected in the first epoch image).
3.4. Optical spectra and line-ratios of HH 119 A–D
The optical spectra of HH 119 A–D are shown in Figs. 7 and 8.Even though all spectra cover the spectral range 3850−6850 Å,each spectrum has been plotted using individual ranges, omittingparts where no features are seen.
In Table 6 we present calibrated and relative (to Hα) linefluxes for all detected lines. The dereddened flux (F0) has beencalculated using the extinctions we find for HH 119 A and B
using planar shock models and comparing the intrinsic and ob-served Hα/Hβ ratios (cf. Sect. 3.5). We have also calculated themean electron density, ne, in HH 119 A, B and C for the posi-tion covered by the slit using the [SII] I(λ6717)/I(λ6731) lineratio. For this we use the effective collision strengths for elec-tron impact excitation given in Ramsbottom et al. (1996) andEinstein A-coefficients from Keenan et al. (1993), assuming anelectron preshock temperature of ∼104 K which is a common as-sumption for HH shock models (see e.g. Morse et al. 1994). Theuncertainty range in these estimates are given in paranthesis inTable 6.
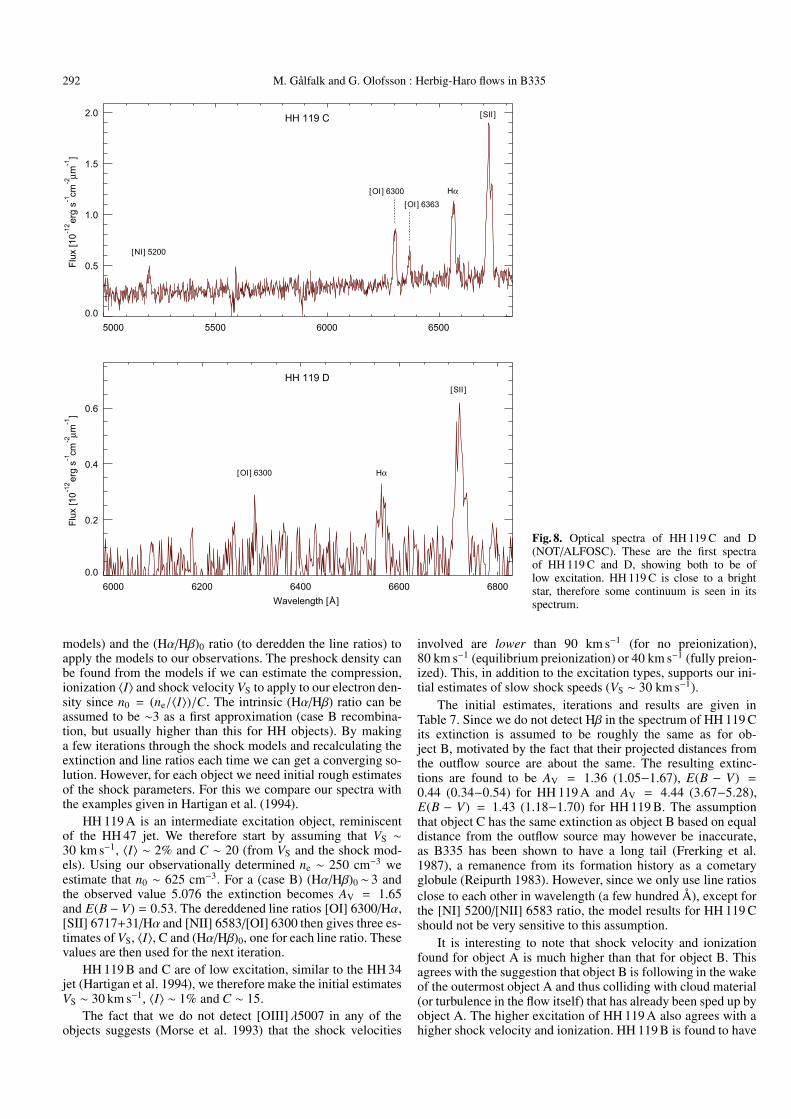
All objects show Hα in strong emission and except forHH 119 A, the [SII] 6717/31 doublet is the strongest line. Thechoice of nb filters for our optical deep fields were in fact basedon the line strengths in these spectra. HH 119 A, B and C alsohave [OI] λλ 6300/63 emission lines ([OI] 6300 faintly seen inobject D as well but with poor S/N).
It is also very interesting to note that the [OI] lines are strongin HH 119 B. This is somewhat unexpected, as they were notdetected in previous spectra by Reipurth et al. (1992) taken13 years earlier even though the S/N of those observationsshould have been more than enough for a clear detection. Thissuggests that the [OI] lines are very variable and that conditionshave changed a lot in HH 119 B during this time period. Thespectra confirm that object A is an intermediate excitation objectwhile HH 119 B, C and D are found to have lower excitation.Since HH 119 A is located further out from the outflow sourcethan object B, the lower excitation of B could be explained by itmoving in the wake of the bow shock from object A.
It is common practice to plot contours of e.g. Hα–[SII] to il-lustrate regions dominated by Hα (positive) and [SII] (negative),respectively. This has the disadvantage of cancelling out in

M. Gålfalk and G. Olofsson : Herbig-Haro flows in B335 291
Fig. 7. Optical spectra of HH 119 A and B(NOT/ALFOSC). Object A is clearly of higherexcitation than object B. Hβ is detected for thefirst time in object A and B, as well as strong[OI] lines in HH 119 B that were not seen inspectra taken 13 years earlier (suggesting vari-able [OI] lines).
regions where Hα and [SII] have similar flux. It also lowersthe signal of both the Hα and [SII] contours while the noiseremains at the same level. This is the case since they alwayscancel out partially as long as there is some Hα or [SII] fluxpresent. A map of F([SII])/F(Hα) is better in that respect but hasits own disadvantages, the most noticeable one being that verylarge values (both positive and negative) are found where F(Hα)is close to zero (mostly in sky regions). It is also common to plotHα+[SII] contours. This uses the full S/N for contours but hidesthe relative flux information that indicates the abundance of thetwo species.
A solution to this illustrative dilemma is found by e.g.using coloured contours to simultaneously plot both the to-tal flux F(Hα)+F([SII]) (contours) and their relative strengthF(Hα)/F([SII]) (colours). This is presented for HH 119 A andB in Figs. 9 and 10, respectively. Note that the contours arecoloured on a pixel-scale level (0.′′188) meaning that each con-tour can have any colours along its curve. By choosing reason-able surface brightness limits for the faintest contour includedin the plots only relevant regions are included (i.e. most of theHH object and all stars, while excluding the sky). Technicallythis is done by multiplying a high-resolution binary contourmap (zero for sky and one for contours) pixel-by-pixel with anequally high-resolution F(Hα)/F([SII]) ratio map that has beencoloured with red and blue shades to separate Hα (blue) and[SII] (red) bright regions.
From these figures it is clear that HH 119 A is of relativelyhigh excitation compared to HH 119 B which is a low excitation
object. There is also a clear separation in both HH 119 A andB, between Hα (leading) and [SII] (trailing) in the direction ofmotion. In both cases the bow shock is of high excitation (low[SII]/Hα ratio) and the emission behind the bow shock is of lowexcitation (high [SII]/Hα ratio). This structure is typical for mostHH objects, Hα tracing sharp leading edges of the cooling zoneand [SII] dominating in the chaotic and clumpy postshock re-gion. It is indicative of a heavy flow that rams into a less denseambient medium. The situation is the same for all other HH ob-jects in B335, except for E and G which have [SII] leading Hα,suggesting a flow that rams into a denser ambient medium. SeeSect. 3.8 for more discussion of the individual HH objects.
3.5. Shock modeling and extinction
In this section we use the planar shock models of Hartigan et al.(1994) with our electron densities and different line ratios (fromTable 6) for HH 119 A–C to calculate the average shock veloc-ity (〈VS〉), [SII]-weighted ionization fraction (〈I〉), preshock den-sity (n0), compression (C) and intrinsic (Hα/Hβ)0 ratio of eachshock. Using the observed (Hα/Hβ) ratio we also estimate theextinction to HH 119 A and B by applying the optical extinctionlaw described in Cardelli et al. (1989) for RV = 3.1, and calcu-lating the extinction AV needed to match the intrinsic ratio fromthe model.
This is an iterative process since we need to know someof the model results, the preshock density n0 (for the shock
292 M. Gålfalk and G. Olofsson : Herbig-Haro flows in B335
Fig. 8. Optical spectra of HH 119 C and D(NOT/ALFOSC). These are the first spectraof HH 119 C and D, showing both to be oflow excitation. HH 119 C is close to a brightstar, therefore some continuum is seen in itsspectrum.
models) and the (Hα/Hβ)0 ratio (to deredden the line ratios) toapply the models to our observations. The preshock density canbe found from the models if we can estimate the compression,ionization 〈I〉 and shock velocity VS to apply to our electron den-sity since n0 = (ne/〈I〉)/C. The intrinsic (Hα/Hβ) ratio can beassumed to be ∼3 as a first approximation (case B recombina-tion, but usually higher than this for HH objects). By makinga few iterations through the shock models and recalculating theextinction and line ratios each time we can get a converging so-lution. However, for each object we need initial rough estimatesof the shock parameters. For this we compare our spectra withthe examples given in Hartigan et al. (1994).
HH 119 A is an intermediate excitation object, reminiscentof the HH 47 jet. We therefore start by assuming that VS ∼30 km s−1, 〈I〉 ∼ 2% and C ∼ 20 (from VS and the shock mod-els). Using our observationally determined ne ∼ 250 cm−3 weestimate that n0 ∼ 625 cm−3. For a (case B) (Hα/Hβ)0 ∼ 3 andthe observed value 5.076 the extinction becomes AV = 1.65and E(B − V) = 0.53. The dereddened line ratios [OI] 6300/Hα,[SII] 6717+31/Hα and [NII] 6583/[OI] 6300 then gives three es-timates of VS, 〈I〉, C and (Hα/Hβ)0, one for each line ratio. Thesevalues are then used for the next iteration.
HH 119 B and C are of low excitation, similar to the HH 34jet (Hartigan et al. 1994), we therefore make the initial estimatesVS ∼ 30 km s−1, 〈I〉 ∼ 1% and C ∼ 15.
The fact that we do not detect [OIII] λ5007 in any of theobjects suggests (Morse et al. 1993) that the shock velocities
involved are lower than 90 km s−1 (for no preionization),80 km s−1 (equilibrium preionization) or 40 km s−1 (fully preion-ized). This, in addition to the excitation types, supports our ini-tial estimates of slow shock speeds (VS ∼ 30 km s−1).
The initial estimates, iterations and results are given inTable 7. Since we do not detect Hβ in the spectrum of HH 119 Cits extinction is assumed to be roughly the same as for ob-ject B, motivated by the fact that their projected distances fromthe outflow source are about the same. The resulting extinc-tions are found to be AV = 1.36 (1.05−1.67), E(B − V) =0.44 (0.34−0.54) for HH 119 A and AV = 4.44 (3.67−5.28),E(B − V) = 1.43 (1.18−1.70) for HH 119 B. The assumptionthat object C has the same extinction as object B based on equaldistance from the outflow source may however be inaccurate,as B335 has been shown to have a long tail (Frerking et al.1987), a remanence from its formation history as a cometaryglobule (Reipurth 1983). However, since we only use line ratiosclose to each other in wavelength (a few hundred Å), except forthe [NI] 5200/[NII] 6583 ratio, the model results for HH 119 Cshould not be very sensitive to this assumption.
It is interesting to note that shock velocity and ionizationfound for object A is much higher than that for object B. Thisagrees with the suggestion that object B is following in the wakeof the outermost object A and thus colliding with cloud material(or turbulence in the flow itself) that has already been sped up byobject A. The higher excitation of HH 119 A also agrees with ahigher shock velocity and ionization. HH 119 B is found to have

M. Gålfalk and G. Olofsson : Herbig-Haro flows in B335 293
Table 6. Optical spectroscopy.
Object Line identification Flux inside slita Fb F0c F(λ6717)/F(λ6731) ne
d
(10−17 erg s−1 cm−2) (Hα) (Hα) (cm−3)HH 119 A Hβ λ4861 47.79 ± 4.0 0.197 ± 0.020 0.304 ± 0.035
[OI] λ6300 20.04 ± 3.7 0.083 ± 0.017 0.087 ± 0.019[OI] λ6363 11.73 ± 3.7 0.048 ± 0.016 0.050 ± 0.017Hα λ6563 242.1 ± 3.6 1.000 1.000[NII] λ6583 10.45 ± 2.6 0.043 ± 0.012 0.043 ± 0.012[SII] λλ6717, 6731 75.93 ± 3.7 0.314 ± 0.021 0.304 ± 0.021 1.19 (1.04-1.36) 250 (60-500)
HH 119 B Hβ λ4861 13.3 ± 3.3 0.056 ± 0.016 0.231 ± 0.087[NI] λλ5198, 5201 14.19 ± 2.8 0.060 ± 0.013 0.167 ± 0.044[OI] λ6300 121.9 ± 4.4 0.517 ± 0.027 0.611 ± 0.033[OI] λ6363 38.35 ± 4.3 0.163 ± 0.021 0.185 ± 0.025Hα λ6563 235.8 ± 3.6 1.000 1.000[NII] λ6583 26.27 ± 4.2 0.111 ± 0.020 0.110 ± 0.020[SII] λλ6717, 6731 440.4 ± 4.2 1.867 ± 0.046 1.686 ± 0.043 0.82 (0.76-0.90) 1260 (890-1590)
HH 119 C [NI] λλ5198, 5201 27.64 ± 4.4 0.138 ± 0.028 ∼0.384[OI] λ6300 81.46 ± 4.3 0.408 ± 0.037 ∼0.482[OI] λ6363 35.07 ± 3.7 0.176 ± 0.026 ∼0.200Hα λ6563 199.6 ± 7.0 1.000 1.000[NII] λ6583 19.47 ± 5.9 0.098 ± 0.034 ∼0.097[SII] λλ6717, 6731 327.3 ± 5.0 1.639 ± 0.085 ∼1.481 1.29 (1.12-1.40) 140 (30-360)
HH 119 D [OI] λ6300 16.19 ± 6.8 0.53 +0.44-0.28 ...Hα λ6563 30.58 ± 6.7 1.000 ...[SII] λλ6717, 6731 104.2 ± 6.8 3.41 +1.24-0.80 ... ... ...
a Using a slit width of 2.′′5 along constant declination and centred on HH 119 B.b Observed flux, relative to Hα.c Dereddened flux, using the extinction from the model results found in Table 7.d Electron density. Estimate of uncertainty range given in parenthesis.
Fig. 9. Detailed overview of HH 119 A simul-taneously showing a Hα+[SII] surface bright-ness map (contours) and the excitation struc-ture by colouring the contours based on the[SII]/Hα ratio. Note that the colour coding istotally independent of the contours, this meansthat any given contour can have any varia-tion of colours ([SII]/Hα) along its curve. Starsare also included in this plot, these howeverhave black contours. HH 119 A is centred sothat its brightest position is roughly locatedat zero offset. The faintest Hα+[SII] contourshown has a surface brightness of about 8.4 ×10⁻¹⁷ erg s−1 cm−2 arcsec−2.

294 M. Gålfalk and G. Olofsson : Herbig-Haro flows in B335
Fig. 10. Detailed overview of HH 119 B, using the same technique as in Fig. 9. HH 119 B is centred so that its brightest position is roughly locatedat zero offset. The faintest Hα+[SII] contour shown has a surface brightness of about 3.1 × 10⁻¹⁷ erg s−1 cm−2 arcsec−2.
much higher preshock density n0 than object A, which mightbe expected given its location much closer to the centre of theglobule where the density is higher.
3.6. Near-UV imaging
In Fig. 11 our U band deep field is presented. HH 119 A is clearlydetected, and has a very similar appearance to its Hα counter-part. After background subtraction of the scattered starlight inthe globule we also detect HH 119 B and E but these are howevermuch fainter than object A in the near-UV. For object B this isexpected because of its much higher extinction (∆AV ≈ 3). Noneof the other HH objects are detected, but for HH 119 C and Dthis could partly be explained by their proximity to a bright starcombined with the seeing in the near-UV.
The transmission curve of the U filter is shown in Fig. 6together with the atmospheric transmission for the mean air-mass of the observations, the detector QE and the total sys-tem transmission (black solid curve). There are probably only
two spectral features that contribute to the U band flux of theseHH objects. The [OII]λ3728 line, located close to the maximumsystem transmission, which has also been shown to be strong inother HH objects (see e.g. Hartigan et al. 1999) and the blue con-tinuum from two-photon emission. The blue continuum spectraldistribution has been plotted in Fig. 6 using a blue dashed curvewith a scale corresponding to the percentage of its peak value.The total U band flux for the three detected HH objects are givenin Table 3.
3.7. Spitzer mid-IR imaging
Figure 15 shows our Spitzer 3.5, 4.5 and 8.0 µm IRAC compositeof B335. An hourglass-shaped reflection nebula is clearly seenin the centre (at 4.5 and 8.0 µm), with an outflow cone to eachside of the central VLA source (IRAS 19345+0727), marked bya cross in the figure. Most of the HH objects we see in our opti-cal and near-IR deep fields can also be seen in the 4.5 µm chan-nel of Spitzer (green in the colour composition used in Fig. 15).

M. Gålfalk and G. Olofsson : Herbig-Haro flows in B335 295
Table 7. Extinction and shock model results for HH 119 A, B and C.
Iteration step (Hα/Hβ)0 AVa E(B − V) n0
b Cc Ionization Id 〈I〉 e Shock velocity VSd 〈VS〉
(mag) (mag) (cm−3) (%) (%) (km s−1) (km s−1)(1) (2) (3) (4) (5) (6) (7) (8) (9) (10)
HH 119 AInitial guess f 3.00 1.65 0.53 625 20 ... 2.0 ... 30.0Iteration 3.34 1.31 0.42 25 40 40.0, 23.0, 13.5 25.5 ± 14 74.7, 60.2, 46.4 60.4 ± 15Result 3.29 1.36 0.44 23 40 40.0, 30.0, 13.5 27.8 ± 14 74.7, 68.7, 45.3 62.9 ± 16
HH 119 BInitial guess f 3.00 5.59 1.80 8400 15 ... 1.0 ... 30.0Iteration 4.33 4.44 1.43 1530 25 3.1, 2.2, 4.6 3.3 ± 1.3 37.8, 34.6, 39.8 37.4 ± 2.7Result 4.33 4.44 1.43 1070 28 3.7, 3.6, 5.2 4.2 ± 1.0 37.1, 35.7, 38.0 36.9 ± 1.5
HH 119 CInitial guess f 4.33 (4.44) g (1.43) g 930 15 ... 1.0 ... 30.0Iteration 4.18 (4.44) g (1.43) g 100 28 6.1, 4.1, 6.1, 3.3 4.9 ± 1.5 43.6, 37.7, 38.1, 33.5 38.2 ± 4.2Result 4.38 (4.44) g (1.43) g 83 23 8.6, 7.6, 7.7, 5.5 7.3 ± 1.5 41.9, 37.2, 33.3, 26.9 34.8 ± 6.4
a Using the extinction law of Cardelli et al. 1989, RV = 3.1 and (Hα/Hβ)obs.b Preshock density, n0 = (ne/〈I〉)/C.c Shock compression.d Estimates from line ratios [OI] 6300/Hα, [SII] 6717+31/Hα, [NII] 6583/[OI] 6300. For HH 119 C also from [NI] 5200/[NII] 6583.e [SII]-weighted ionization fraction 〈I〉.f Initial guesses taken from objects with similar excitation, HH 47 jet (HH 119 A) and HH 34 jet (B and C). See Hartigan et al. (1994).g Since Hβ is not detected from HH 119 C, the extinction is assumed to be the same as for HH 119 B (see text).
Fig. 11. Near-UV deep field. A composite of KS (red), R (green) and U (blue) mosaics (left panel). The cloud extinction is effectively shown usingthis filter combination, spanning from the near-UV to the near-IR. After removing the background from scattered starlight in the U mosaic, threeof the HH objects are detected (HH 119 A, B and E). In the right panel we show several filter combinations using background subtracted mosaics.It is clear that the appearance of object A is very similar in the U and Hα filters. The field of view is 4.′25 × 4.′13 in the left panel and 116′′ × 39′′in each of the right panels.
Note that, except for the strong artefacts seen close to brightstars (to the SSW) in this filter, all these extended objects aremost likely HH objects. These include all HH objects A–H, ex-cept HH 119 C, which is too close to a bright star for detection.HH 119 I is located outside the Spitzer image.
It has been shown in several other Spitzer surveys (e.g.Noriega-Crespo et al. 2004; Harvey et al. 2006; and Gålfalk& Olofsson 2007) that the IRAC channel centred at 4.5 µmis very efficient in detecting bona-fide Herbig-Haro objects.The reason for this is partly that the spectral response func-tion is highest in this channel, but there are at least two more
contributing factors. Between approximately 4–5 µm there aremany vibrational and rotational H2 emission lines, these havebeen modeled by Smith & Rosen (2005) for all IRAC bandsusing three-dimensional hydrodynamic simulations of molecu-lar jets. The strongest integrated H2 emission is predicted toarise from band 2 because of rotational transitions. For the typ-ical conditions of low-mass outflows, pure-rotational transitionslike S(11)–S(4) (4.18–8.02 µm) can actually be much brighterthan the standard 2.12 µm H2 line (Kaufman & Neufeld 1996).Channel 2 is also the most “PAH-free” band of IRAC, greatlyenhancing its usefulness as a HH tracer, as opposed to the 5.8
296 M. Gålfalk and G. Olofsson : Herbig-Haro flows in B335
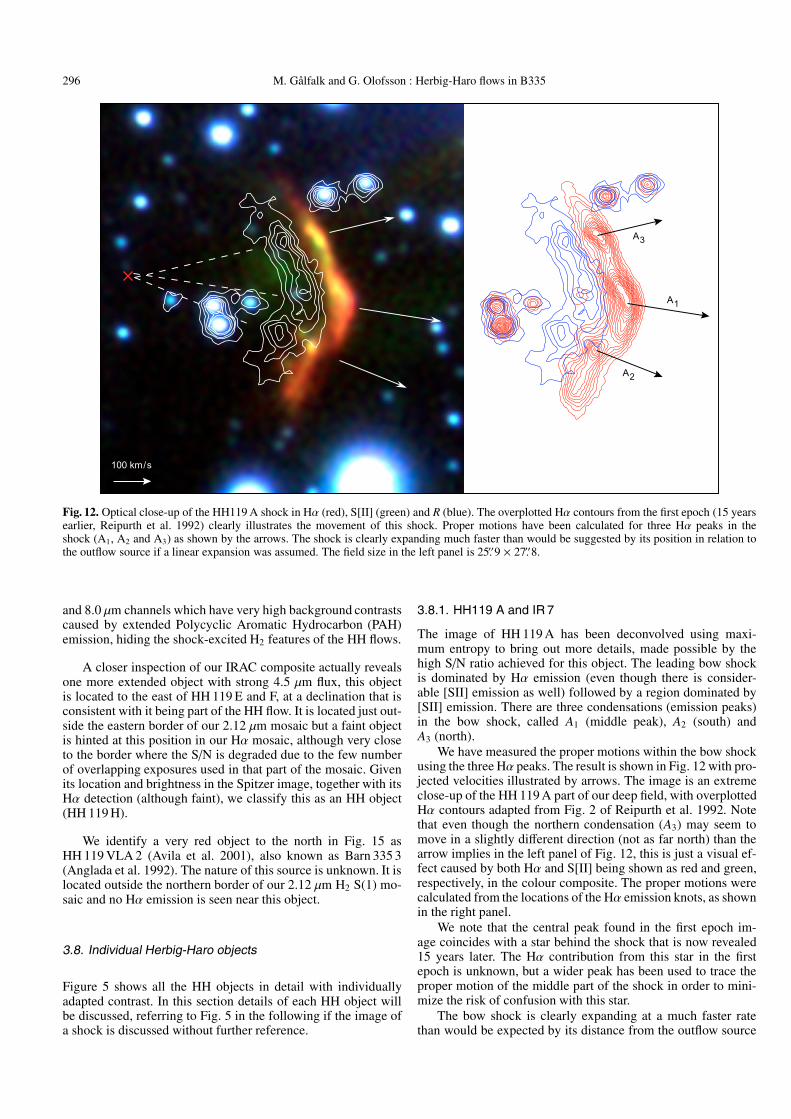
Fig. 12. Optical close-up of the HH119 A shock in Hα (red), S[II] (green) and R (blue). The overplotted Hα contours from the first epoch (15 yearsearlier, Reipurth et al. 1992) clearly illustrates the movement of this shock. Proper motions have been calculated for three Hα peaks in theshock (A1, A2 and A3) as shown by the arrows. The shock is clearly expanding much faster than would be suggested by its position in relation tothe outflow source if a linear expansion was assumed. The field size in the left panel is 25.′′9 × 27.′′8.
and 8.0 µm channels which have very high background contrastscaused by extended Polycyclic Aromatic Hydrocarbon (PAH)emission, hiding the shock-excited H2 features of the HH flows.
A closer inspection of our IRAC composite actually revealsone more extended object with strong 4.5 µm flux, this objectis located to the east of HH 119 E and F, at a declination that isconsistent with it being part of the HH flow. It is located just out-side the eastern border of our 2.12 µm mosaic but a faint objectis hinted at this position in our Hα mosaic, although very closeto the border where the S/N is degraded due to the few numberof overlapping exposures used in that part of the mosaic. Givenits location and brightness in the Spitzer image, together with itsHα detection (although faint), we classify this as an HH object(HH 119 H).
We identify a very red object to the north in Fig. 15 asHH 119 VLA 2 (Avila et al. 2001), also known as Barn 335 3(Anglada et al. 1992). The nature of this source is unknown. It islocated outside the northern border of our 2.12 µm H2 S(1) mo-saic and no Hα emission is seen near this object.
3.8. Individual Herbig-Haro objects
Figure 5 shows all the HH objects in detail with individuallyadapted contrast. In this section details of each HH object willbe discussed, referring to Fig. 5 in the following if the image ofa shock is discussed without further reference.
3.8.1. HH119 A and IR 7
The image of HH 119 A has been deconvolved using maxi-mum entropy to bring out more details, made possible by thehigh S/N ratio achieved for this object. The leading bow shockis dominated by Hα emission (even though there is consider-able [SII] emission as well) followed by a region dominated by[SII] emission. There are three condensations (emission peaks)in the bow shock, called A1 (middle peak), A2 (south) andA3 (north).
We have measured the proper motions within the bow shockusing the three Hα peaks. The result is shown in Fig. 12 with pro-jected velocities illustrated by arrows. The image is an extremeclose-up of the HH 119 A part of our deep field, with overplottedHα contours adapted from Fig. 2 of Reipurth et al. 1992. Notethat even though the northern condensation (A3) may seem tomove in a slightly different direction (not as far north) than thearrow implies in the left panel of Fig. 12, this is just a visual ef-fect caused by both Hα and S[II] being shown as red and green,respectively, in the colour composite. The proper motions werecalculated from the locations of the Hα emission knots, as shownin the right panel.
We note that the central peak found in the first epoch im-age coincides with a star behind the shock that is now revealed15 years later. The Hα contribution from this star in the firstepoch is unknown, but a wider peak has been used to trace theproper motion of the middle part of the shock in order to mini-mize the risk of confusion with this star.
The bow shock is clearly expanding at a much faster ratethan would be expected by its distance from the outflow source

M. Gålfalk and G. Olofsson : Herbig-Haro flows in B335 297
Fig. 13. HH 119 A flux contours in Hα (blue), S[II] (green) and S(1) (red). The contour levels have been chosen to emphasize the different featuresseen in each transition. It is clear that most S(1) knots in HH 119 A lie well within the optical bow shock. In S[II] there are two more featureswhen compared to Hα, a bright trailing structure and an extended faint feature in front of the bow. This feature can also be seen faintly in S(1) asa bow-shaped object leading the main optical bow shock. Stars have been coloured black. The field size is 21′′ × 21′′ in both panels.
assuming a linear expansion, since tracing the arrows back-wards leads to a point much further west than the outflow source(Figs. 3 and 12). The expansion rate has thus increased with timeas the shock gradually moves into less dense parts of the globule,approaching free expansion. Object B has a similar appearanceto object A, albeit on a smaller scale, suggesting the amount ofexpansion between these positions in the flow. The situation isreminiscent of the HH34 jet and bow shock (Figs. 9 and 10 ofReipurth et al. 2002a) where the width of the jet and the size ofHH objects increase with distance along the jet from the outflowsource.
The spectrum of HH 119 A2 (Fig. 7) shows strong Hα andweak [SII] emission, HH 119 A is thus a high excitation objectas opposed to the other HH objects for which we have opticalspectra. The first detection of Hβ in object A is also seen in thisspectrum.
The picture of HH 119 A as a coherent bow shock (as seen inHα) is not always true. We detect the S(1) counterpart of ob-ject A as broken up into three parts (IR 7a–c, see Fig. 2). InFig. 13 we plot flux contours in Hα, [SII] and the S(1) line. It isevident that most of the S(1) knots in the northern and southernpart (IR 7a and b) lie well within the contours of the optical bowshock. There is also a third, very faint counterpart in S(1) (IR 7c),also bow-shaped, which preceeds the optical bow. Comparingthe [SII] and S(1) contours (right panel) we see that, not only isthere extended [SII] emission in a cooling zone behind the bowshock, there is also a faint [SII] structure preceeding the bow, atthe position of IR 7c.
3.8.2. HH119 B and IR 1
HH 119 B is a nice well-defined bow shock with Hα followed by[SII] emission, and an apex with both strong Hα and [SII] emis-sion. The shock follows in the wake of HH 119 A, which is apossible explanation why the spectrum of this shock shows alower excitation (see Fig. 7). The spectrum also shows object B
to have strong [OI] λλ 6300/63 emission lines, which was notthe case in the Aug. 1990 observations of Reipurth et al. (1992).The conditions in object B have apparently changed during the13 years between the two epochs.
The near-IR H2 S(1) source IR 1 has a similar position andproper motion position angle as object B, although their propermotions differ by more than 70 km s−1. To clarify the situationa colour composite using both the optical and near-IR shock ob-servations has been made (Fig. 14, right panel) by warping theS(1) image to match the pixel size and distortion of the opticalimages (Hα and S[II]).
These shocks are likely physically connected, with theS(1) bright shock IR 1 located in the southern part of opticallybright shock B. While their difference in projected velocitiessuggest that their alignment could be merely coincidental, themost likely situation is that they are in fact counterparts of thesame object, since IR 1 is located far out in the wing of bowshock B where the (projected) shock speed is much slower thanat the apex. This could explain the S(1) brightness if H2 is notdisassociated in the bow wing. The geometry and expected ex-citation structure (Fig. 14) thus suggest that IR 1 is the near-IRcounterpart of HH 119 B.
3.8.3. HH119 C, D and IR 5
In the image of object C in Fig. 5, a bright star has been removedat the position marked by a plus sign in all three filters (Hα, [SII]and R) using the PSF of a similarly bright star, lowering the con-trast considerably and making it possible to display HH 119 C inmuch more detail. A star, not seen prior to the PSF removal, isalso revealed very close to the north of the removed bright star(at the edge of the black circle).
This is the first detection of object D in the optical, it hadonly been seen faintly in the near IR prior to this paper (IR 5).Our near-IR observations show this to be a bow shock at 2.12 µmH2 as well. Object D has a complicated excitation structure, as

298 M. Gålfalk and G. Olofsson : Herbig-Haro flows in B335
Fig. 14. Optical and Near-IR composites of HH 119 D / IR 5 (left) and B / IR 1 (right) using a Hα (blue), [SII] (green) and 2.12 µm H2 (red) colourcoding. In both shocks the optical shock emission is clearly strongest close to the apex of the bow shock, Hα at the front and [SII] in the coolingzone behind it. The near-IR shock emission is displaced to the north and south in HH 119 D and B, respectively. In the case of HH 119 D, thenear-IR shock is also bow-shaped, but located further to the north. The near-IR counterpart of HH 119 B, IR 1, does not have the appearance ofa bow, it does however coincide with the far southern wing of the optical bow shock, as might be expected since the projected shock velocity(perpendicular to the bow surface) is much lower far out in the wing than at the apex. Both fields have a size of 75′′ × 75′′.
suggested by the optical/IR composite image (Fig. 14). A lead-ing bow-shock dominated by Hα is clearly seen, followed by twowell-defined “sulphur bullets” in the complicated cooling zoneand a near-IR H2 bow shock, displaced to the north relative tothe optical bow shock. The situation appears to be similar to thatof objects B and IR 1, with a S(1) strong part of the bow shockfar out in the (north) wing where the projected shock speed ismuch lower than at the apex of the bow shock.
3.8.4. HH119 E, F, H and IR 6
Both HH 119 E and F are previously undetected Herbig-Haro ob-jects. As can be seen in the image, they both have separated neb-ulous features between filters in the direction expected if theyoriginate from the central outflow source. HH 119 F is seen as aHα bow shock, followed by a similar S[II] feature. It resemblesa smaller version of HH 119 B moving approximately ESE, assuggested by its structure and supported by its proper motion.HH 119 E is probably moving almost exactly to the east, as itis perfectly lined up with HH 119 A–D and the outflow source.As seen in the image for object E, and suggested by the opticalspectra of other HH objects in this flow (B and C), object E musthave very strong [OI] λλ 6300/63 emission (as the leading shockis strongest in the R band) followed by a Hα shock.
There is another, although very faint, Hα feature to the eastof these objects in the HH flow but mid-way between them indeclination. This object, HH 119 H, is however clearly seen at4.5 µm using Spitzer (IR 6 in Fig. 15). Details about this objectare given in Table 2.
3.8.5. HH119 G, IR 2, 3 and 4
In the blue-shifted lobe we find IR objects 2–4 moving as a grouproughly to the ESE. Except for the brightest S(1) peak, IR 4a (G),
these objects are only seen in the near-IR deep field. They allhave slower projected velocities than the A–D optical bipolarflow, and especially features 3 and 4 have much slower spacevelocities.
As suggested by the Spitzer image (Fig. 15) these shockscould be the result of turbulent interaction of molecular mate-rial from the surrounding cloud and the outflow, near the cavitywalls. This interaction could be what is slowing down the out-flow and creating these shocks. The reason why they are onlyseen in the near-IR could be a combination of extinction and theamount of H2 relative to atoms and ions (such as H, S+ and O).In a slow magnetically supported (C-type) shock, molecules arenot as dissociated as in fast (J-type) shocks. IR 2 is moving muchfaster than objects 3 and 4, in a direction more to the east, withinthe cone that has already been cleared out by the outflow.
3.9. HH119 I and the IR 8 system
In our 2007 images of western B335 we see a very likely coun-terflow (Fig. 2) to the ESE flow, consisting of a system of at least15 H2 knots. Careful image re-reduction of our optical deep fieldclose to the mosaic edge, where the signal is lower due to fewoverlaps and the flatielding is very sensitive to vignetting, re-vealed an optical (Hα and [SII]) counterpart, HH 119 I (Fig. 4),to one of these H2 knots. This WNW counterflow (althoughno proper motions are known yet) is, similar to the ESE flow,much brighter in S(1) than at Hα or S[II] when compared toHH 119 A–F in the E–W flow. The detection of this system andthe similar properties to the ESE flow opens up the possibilitythat the outflow source may in fact be a binary source, withtwo slightly different oriented outflow axes giving rise to thesetwo flows.

M. Gålfalk and G. Olofsson : Herbig-Haro flows in B335 299
Fig. 15. Spitzer IRAC composite of B335 using a 3.5 µm (blue), 4.5 µm (green) and 8.0 µm (red) colour coding. The red plus sign marks the centralVLA source position. There is a clear correlation between the bipolar cone-shaped structure seen at these wavelengths (3.5–8.0 µm) and the VLAsource position. Many of the HH objects and S(1) knots seen in our optical and near-IR mosaics are also detected at 4.5 µm (IRAC channel 2)which is clearly the most efficient channel for tracing the flows.
4. Summary and conclusions
In an effort to investigate the Herbig-Haro flows in the nearbydark globule B335, a well-studied protostellar collapse candi-date with three previously known HH objects, we have takenoptical spectra and observed an optical tri-colour deep field (Hα6.7 h, [SII] 6.2 h and R 39 min) and a near-IR bi-colour deep field(2.12µm H2 S(1) 6.5 h and KS 48 min), as well as an additional
near-IR field of western B335, using the 2.56 m Nordic OpticalTelescope and a near-UV deep field (U band 7.4 h) with the3.58 m New Technology Telescope. In addition we present newSPITZER / IRAC (3.5, 4.5 and 8.0 µm) and MIPS (24 µm) obser-vations. The following results were obtained:
1. We discover five new HH objects (HH 119 D–H) in the blue-shifted (eastern) lobe and one new HH object (HH 119 I) in

300 M. Gålfalk and G. Olofsson : Herbig-Haro flows in B335
the red-shifted (western) lobe of the outflow. Two of theseHH objects (D and G) have previously observed near-IRcounterparts (Hodapp 1998). In our S(1) mosaic we detectthese as large extended shocks (object D being a large bowshock). In western B335 we also detect a system of at least15 previously unknown H2 knots.
2. By combining our observations with earlier epochs in theoptical and near-IR we calculate proper motions of the pre-viously known HH objects (and the new HH 119 F) and2.12 µm H2 S(1) knots using a time span of 15 and 9 years,respectively.
3. The combined optical and near-IR proper motion maps, to-gether with the deep images, show that the opening an-gle of the bipolar flow is already very wide and revealstwo sub-groups within the flow, a high velocity bipolarflow (space velocities 200–280 km s−1) in the E–W direc-tion (HH 119 A–F) that is bright in optical shock lines, anda much slower flow (15–75 km s−1) in the ESE directionwithin the blue lobe (HH 119 G and IR 2–4) that is bright inthe S(1) line. We also propose a counterflow in a roughlyWNW direction (red lobe), also bright in S(1) and faint inHα and [SII].
4. All proper motion vectors originate from central B335.We suggest two possibilities, either the E–W andESE−WNW shock groups belong to the same outflow butare flowing in different parts of a cone-shaped cavity clearedout by the outflow, or the outflow source is binary in na-ture resulting in two outflow axes with slightly differentorientations.
5. Two of the new HH objects, HH 119 E/F, are equidistant toHH 119 A from the outflow source, while HH 119 C/D areroughly equidistant to HH 119 B. The bipolar E–W flow isthus roughly symmetrical, with two outburst episodes sug-gested, 255 and 645 years ago, respectively, from propermotions. The conclusion that the central source has under-gone several eruptive events has previously been suggestedby Reipurth et al. (1992) who also used proper motions toestimate these two outburst ages (they estimated 350 and850 years).
6. For HH 119 A, the proper motions of three Hα condensa-tions show that the shock is rapidly expanding, at a muchfaster rate than would be expected from a linear expansiongiven its distance from the outflow source.
7. The [SII] /Hα structure of the shocks indicate that theESE group rams into a denser ambient medium, with thesituation being the opposite for the E-W flow.
8. Our optical spectra show HH 119 A to be of higher excita-tion than B and C (which are both low excitation objects).We detect Hβ for the first time in both A and B, makingit possible to estimate the extinction towards these HH ob-jects. In stark contrast to a previous spectrum of HH 119 B,we detect strong [OI] λλ 6300/63 emission lines. It is clearthat object B must have changed a lot during the last decadeor so.
9. We calculate the optical extinction towards HH 119 A and Bto be AV ≈ 1.4 and 4.4, respectively.
10. Using planar shock models we have estimated the shockproperties of HH 119 A–C. The resulting shock velocitiesare much lower (a factor 5−10) than the space velocitiesfound through proper motions. This is however very com-mon for Herbig-Haro objects, and expected when gas withhigh space velocity is caught up by slightly faster gas, mak-ing the relative (shock) velocity lower than the space veloc-ities. This is also the case in bow shocks, where the shock
velocity is lower in the wings than at the apex of the bowsince the projected velocity perpendicular to the shock ishighest at the apex and lowest far out in the wings. Wefind shock velocities of ∼60 km s−1 (A) and ∼35 km s−1 (Band C). This agrees well with object A being of higher ex-citation, and B following in the wake of this object. The[SII]-weighted ionization fraction is also found to be muchhigher in object A.
11. We detect HH 119 A, B and E in the U band after back-ground subtraction of scattered starlight throughout theglobule. This emission is proposed to be a combination oftwo spectral features, the [OII]λ3728 line and the blue con-tinuum.
12. Most of the HH objects and S(1) knots are detected inthe SPITZER / IRAC observations (channel 2, 4.5 µm). Anhour-glass shaped feature is seen in the IRAC images, cen-tred on the VLA outflow source, with a morphology thatagrees with a cone-shaped E–W flow. Even at 24 µm it isunclear whether most of the light is direct or reflected, asingle peak can be seen but it is offset by about 2.′′8 to theSE from the VLA position.
Acknowledgements. The Swedish participation in this research is funded by theSwedish National Space Board. This publication made use of the NASA/IPACInfrared Science Archive, which is operated by the Jet Propulsion Laboratory,California Institute of Technology, under contract with the National Aeronauticsand Space Administration, and data products from the Two Micron All SkySurvey, which is a joint project of the University of Massachusetts and theInfrared Processing and Analysis Center/California Institute of Technology,funded by the National Aeronautics and Space Administration and the NationalScience Foundation. We would like to thank Klaus-Werner Hodapp, Institute forAstronomy, University of Hawaii for providing the 2.12 µm H2 mosaic we usedas the first epoch in our proper motion calculations. We would also like to thankBo Reipurth, Institute for Astronomy, University of Hawaii for providing us withthe first epoch Hα images we used in our optical proper motion calculations.Also, we want to thank Sven Olofsson, Stockholm Observatory, for providing uswith the U band image.
References
André, P., Ward-Thompson, D., & Barsony, M. 1993, ApJ, 406, 122Anglada, G., Rodríguez, L. F., Cantø, J., et al. 1992, ApJ, 395, 494Avila, R., Rodríguez, L. F., & Curiel, S. 2001, Rev. Mex. Astron. Astrofis., 37,
201Cardelli, J. A., Clayton, G. C., & Mathis, J. S. 1989, ApJ, 345, 245Chandler, C. J., Gear, W. K., Sandell, G., et al. 1990, MNRAS, 243, 330Frerking, M. A., & Langer, W. D. 1982, ApJ, 256, 523Frerking, M. A., Langer, W. D., & Wilson, R. W. 1987, ApJ, 313, 320Gålfalk, M. 2005, NOT Annual report 2004, 18Gålfalk, M., & Olofsson, G. 2007, A&A, 466, 579Hartigan, P., Morse, J. A., & Raymond, J. 1994, ApJ, 436, 125Hartigan, P., Morse, J. A., Tumlinson, J., et al. 1999, ApJ, 512, 901Harvey, D. W. A., Wilner, D. J., Lada, C. J., et al. 2001, ApJ, 563, 903Harvey, D. W. A., Wilner, D. J., & Myers, P. C. 2003, ApJ, 583, 809Harvey, P. M., Chapman, N., Lai, S.-P., et al. 2006, ApJ, 644, 307Hodapp, K. W. 1998, ApJ, 500, L183Kaufman, M. J., & Neufeld, D. A. 1996, ApJ, 456, 611Keenan, F. P., Hibbert, A., Ojha, P. C., et al. 1993, Phys. Scr., 48, 129Keene, J., Davidson, J. A., Harper, D. A., et al. 1983, ApJ, 274, L43Morse, J. A., Heathcote, S., Cecil, G., et al. 1993, ApJ, 410, 764Morse, J. A., Hartigan, P., Heathcote, S., et al. 1994, ApJ, 425, 738Noriega-Crespo, A., Morris, P., Marleau, F. R., et al. 2004, ApJS, 154, 352Ramsbottom, C. A., Bell, K. L., & Stafford, R. P. 1996, Atomic Data and Nuclear
Data Tables, 63, 57Reipurth, B. 1983, A&A, 117, 183Reipurth, B., Heathcote, S., & Vrba, F. 1992, A&A, 256, 225Reipurth, B., Heathcote, S., Morse, J., et al. 2002a, AJ, 123, 362Reipurth, B., Rodríguez, L. F., Anglada, G., & Bally, J. 2002b, AJ, 124, 1045Smith, M. D., & Rosen, A. 2005, MNRAS, 357, 1370Tomita, Y., Saito, T., & Ohtani, H. 1979, PASJ, 31, 407Vrba, F. J., Luginbuhl, C. B., Strom, S. E., et al. 1986, AJ, 92, 633


![[Tobias herbig, franz_gerl]_self-learning_speaker_(book_zz.org)](https://img.pdfslide.net/doc/110x75/55cf3678bb61ebad1c8b458c/tobias-herbig-franzgerlself-learningspeakerbookzzorg.jpg)