Embed Size (px)
Citation preview
Herd Immunity and a Vaccination Game∗
Wooyoung Lim† Franco P. Zhang‡
November 12, 2018
Abstract
Would the affected communities in West Africa voluntarily obtain herd immunity if a cure for Ebola
was available? This paper theoretically and experimentally investigates people’s vaccination choices in
the context of a nonlinear public good game. We first consider the standard SIR model (Kermack and
McKendrick, 1927) to capture the dynamic process of contagion and to show that the long-run infection
probability decreases concavely as vaccination coverage rises, with the probability eventually vanish-
ing when herd immunity is obtained. The nonlinear nature of the externality dramatically changes the
social planner’s problem such that it is socially optimal to eliminate an epidemic by obtaining herd im-
munity. We then consider an individual’s strategic vaccination choice problem. A “vaccination game” is
defined in which costly commitments (vaccination) are required of a fraction of the population to reach
the critical level needed for herd immunity, without which defectors are punished by the natural conta-
gion of epidemics. Our game-theoretic approach to herd immunity reveals that endogenous epidemic
punishment is an effective mechanism, resulting in voluntary vaccination to obtain herd immunity, for
which the orthodox principle of positive externalities fails to account. As a result, the socially optimal
outcome can be approximated through voluntary vaccination. Our experimental implementation of a
vaccination game in a controlled laboratory setting provides strong support for the major theoretical
predictions.
Keywords: Vaccination Game, Economic Epidemiology, Nonlinear Public Goods, Laboratory Experiment
JEL classification: C72, C91, D62, H00, I18
∗We are grateful to Marco Battaglini, Dongkyu Chang, Stephen Coate, John Duffy, Lata Gangadharan, CharlesHolt, Duk Gyoo Kim, Philip Neary, In-Uck Park, Siyang Xiong, Jane Zhang, and Xiaojian Zhao for their valuable com-ments and suggestions. For helpful comments and discussions, we also thank seminar and conference participants atCornell University, HKUST, Korea University, NYU Shanghai, Sungkyunkwan University, Tsinghua University, Yon-sei University, the 2017 Asian Meeting of the Econometric Society, the 2017 Asia-Pacific Economic Science AssociationConference, and the 92nd Western Economic Association Internal Annual Conference. This study is supported by agrant from the Research Grants Council of Hong Kong (Grant No. GRF-16502015).†Department of Economics, Hong Kong University of Science and Technology, [email protected]‡Department of Economics, Cornell University, [email protected]
1
1 Introduction
Globally, infectious diseases are responsible for one-quarter of all deaths each year; even when
infections do not kill, they reduce the quality of life of the hundreds of millions of people affected
(Laxminarayan et al., 2006). Recent outbreaks, such as SARS in 2003, Ebola in 2014 and MERS in
2015, have forced citizens around the world to confront and reconsider the high social and eco-
nomic costs of epidemic control.1 The problem of epidemic control is of fundamental economic
importance because disease and infection are irrefutably associated with uncertainty and exter-
nalities, which have long been central concepts in economics. According to a WHO report (WHO
Ebola Response Team, 2015), behavioral changes at the community level are key to the prevention
and elimination of epidemics, especially in low- and middle-income countries. Understanding
people’s choices for epidemic control thus has significant policy implications.
Any model of epidemic control must consider 1) how an infectious disease is transmitted
among individuals and 2) how individuals respond to the threat of being infected. To capture
these two components, we construct our epidemic model based on two key building blocks. The
first block is the dynamic epidemiological model of Bauch and Earn (2004), which captures the
contagion and elimination of infectious diseases. The second block is a vaccination game, a non-
linear public good game in which costly commitments (vaccination) are required of a fraction of
the population to reach the critical level required for herd immunity, without which defectors are
punished by the natural contagion of epidemics.2,3
More precisely, our work builds critically on the nonlinear nature of vaccination externality,
the foundation of which is a class of well-established epidemiological models. The susceptible-
infected-recovered (SIR) framework, introduced by Kermack and McKendrick (1927), describes
the transmission of infectious disease through individuals in a society with a fixed population
that consists of three compartments: susceptible, infected, and recovered. Bauch and Earn (2004)
extended the model to incorporate vaccination with fixed timing and revealed that the long-run
probability of infection exhibits an interesting property: it decreases concavely as vaccination
1The word “epidemic” originates from the Greek “epidemos,” which literally means among (epi) the people(demos), and it refers to the rapid spread of infectious disease to a large number of individuals in a given populationwithin a short period, usually two weeks or less (Cambridge Dictionary, 2015).
2More precisely, we derive the steady-state probability of infection from the dynamic epidemic transmissionmodel of Bauch and Earn (2004) and consider forward-looking individuals who simultaneously and independentlymake (strategic) decisions on whether to receive a vaccine on day 1 by considering the threat of being infected as thesteady-state probability of infection. Thus, our model can be regarded as a steady-state model of dynamic contagionwith static strategic decision making.
3Galeotti and Rogers (2013) also considered a dynamic epidemic model of the susceptible-infected-susceptible(SIS) framework to study the diffusion process of a harmful state and combine it with a strategic decision-makingproblem of individuals exposed to the diffusion process. See the literature review section for further discussion.
2
coverage increases and eventually vanishes when a critical mass of the population obtains vacci-
nations.4 The minimum fraction of a population that must be vaccinated to prevent an outbreak
is called “herd immunity.”
We explore how the nonlinear nature of this externality affects the social planner’s problem
and individuals’ vaccination choice problem. We first show that, due to the nonlinearity of the
externality, the marginal social cost of vaccination becomes discontinuous at the vaccination cov-
erage required to obtain herd immunity. As a result, eliminating epidemics by obtaining herd
immunity is a necessary and sufficient condition for the social optimum.5 This result is new to the
economic literature on epidemic transmission and control, the previous conclusion of which was
that social optimum should be achieved when an epidemic is not eliminated (e.g., Brito, Sheshin-
ski and Intriligator, 1991; Francis, 1997; Geoffard and Philipson, 1997; Gersovitz and Hammer,
2004; Kureishi, 2009).
We then turn to investigating the outcome of strategic vaccination when the probability of
infection is endogenously determined by vaccination coverage.6 Each player faces a trade-off be-
tween the nonlinear probabilistic benefit of vaccination and the deterministic cost of vaccination,
although vaccination behavior benefits society as a whole. The nonlinear public goods game,
in which forward-looking individuals make vaccination choices to optimize their health assets
to guard against epidemics, with the steady-state probability of infection derived from the dy-
namic epidemic contagion model of Bauch and Earn (2004), is in our formulation the “vaccination
game.” We show that there is a strategic advantage from being unpredictable in immunization,
which could lead individuals to randomize accepting vaccination. In this equilibrium, an increase
in the relative benefit of vaccination results in unambiguously higher vaccination coverage and,
consequently, a higher likelihood of herd immunity.
That the equilibrium likelihood of herd immunity monotonically increases with the relative
benefit of vaccination is vital in predicting whether voluntary vaccinations can be an effective
mechanism to achieve the social optimum. From a social planner’s perspective, it indicates that
voluntary vaccination can approximate elimination of any disease if the relative benefit of vacci-
4This modeling choice is especially appropriate when individuals are assumed not to be informed about theprevalence of the disease.
5Since Bauch and Earn (2004), the nonlinear nature of this externality has been well understood in the epidemi-ological literature. However, to our knowledge, we are the first to investigate how the nonlinear nature of thisexternality changes the social planner’s problem.
6Heal and Kunreuther (2005) and Galeotti and Rogers (2013) were pioneers in adopting a game-theoretic ap-proach to explore the interdependency of vaccination decisions. Following in their footsteps, in this paper, we extendthe game-theoretic approach to incorporate the nonlinear nature of epidemic externalities. The model presented inthis paper is, to the best of our knowledge, the first attempt in economics to apply a nonlinear public good game tothe study of vaccination choice.
3
nation is sufficiently large, i.e., when the individual benefit from vaccination is sufficiently larger
than the individual’s utility cost of vaccination. The social planner’s well-defined policy goal
should be to increase the relative benefit. One can imagine several natural policy tools available
to the social planner to achieve the goal, such as a subsidy to decrease the cash cost of vaccina-
tion, a nationwide public vaccination campaign to lower the psychological cost of vaccination,
and financial aid to encourage R&D activities to minimize the side effects of vaccines. However,
a mandatory vaccination program is not necessary to achieve the social optimum.
The results of the controlled laboratory experiments provide strong support for our major
theoretical predictions from the mixed-strategy equilibrium. We consider a laboratory vaccination
game in which there are eight individuals in a society, each of whom independently and simul-
taneously decides whether to be vaccinated. For each individual, the benefit of being vaccinated
monotonically and nonlinearly decreases with the number of other people being vaccinated. To
the best of our knowledge, we are the first to experimentally explore how the nonlinear nature of
the positive prevention externality affects people’s free-riding behavior in the context of a vacci-
nation choice problem. We explore various treatments that differ in the relative benefit of vaccina-
tion and the characteristics of the disease (the reproduction ratio). The mean vaccination coverage
and the likelihood of herd immunity reported in our experimental data indicate that endogenous
epidemic punishment is an effective mechanism for voluntary vaccination, indicating that herd
immunity can be achieved through voluntary, private vaccination.
The rest of this paper proceeds as follows. The remainder of this section reviews the related
literature on the economics of vaccination and nonlinear public good games. Section 2 presents
the steady-state characterization of the dynamic epidemiological model of Bauch and Earn (2004)
and formally derives herd immunity and epidemic punishment. Section 3 explores the social
planner’s problem and reveals that eliminating an epidemic by obtaining herd immunity is so-
cially optimal. In Section 4, we formally define the vaccination game and characterize the unique,
symmetric, mixed-strategy Nash equilibrium. Section 5 describes the experimental design and
procedures of the vaccination game. Section 6 presents the experimental results. In Section 7, we
provide experimental evidence for the role of concavity in the long-run probability of infection in
facilitating voluntary vaccination. Section 8 concludes the study by inviting further discussion of
the relevance of the vaccination game.
4
1.1 Literature Review
Many leading contributions to the field of economic epidemiology have focused on the market
failure of vaccination. Brito et al. (1991) showed that laissez-faire competitive equilibrium is not
socially optimal since individuals do not consider the benefits and costs to others who will be
infected or protected as a consequence of their infection or vaccination. Subsequent formal treat-
ments reached similar conclusions by incorporating intertemporal disease transmission (Geoffard
and Philipson (1997), Gersovitz and Hammer (2004), Boulier et al. (2007)).7 A notable exception is
Francis (1997), who examined a case of dynamic vaccination in which the competitive equilibrium
coincided with the socially optimal solution.
In the above mainstream welfare literature on vaccination, decentralized decision making
regarding vaccination considered the probability of infection as given. As noted by Heal and
Kunreuther (2005), the notion of the strategic interplay among individuals deserves particular at-
tention because vaccination decisions are interlocking, at least at a community level.8 Our paper
contributes to the emerging literature on strategic vaccination (Heal and Kunreuther (2005), Ga-
leotti and Rogers (2013), Chen and Toxvaerd (2014)). Heal and Kunreuther (2005) adopted a static
epidemic formulation, while we explicitly model the dynamic transmission of epidemics. Chen
and Toxvaerd (2014) considered a two-player dynamic game of vaccination, while our formal-
ization allows us to study the threshold implications of herd immunity for a general population
and thus captures the crucial feature of collective action in vaccination problems. In addition, the
prevalence elastic strategy in Chen and Toxvaerd (2014) makes it difficult to attribute the results to
either the prevention externality or the infection externality.9 Identifying the source of market fail-
ure is essential to its remediation measures. To isolate the positive externalities of vaccination, we
contend that a vaccination game with inflexible timing embedded in a dynamic epidemiological
context provides an ideal tool.10
7For example, Geoffard and Philipson (1997) argued that public health interventions, including price subsidiesand stand-alone vaccination programs, are generally unable to remedy vaccination market failures, as the increase indemand is always offset by an increase in free riding. Note that they considered eradication, while the focus of thispaper is elimination, which means the interruption of epidemics of an infectious disease, achieved by maintainingvaccination coverage to ensure that the proportion of immune individuals remains greater than the critical thresholdfor herd immunity. Eradication means the worldwide reduction of infective organisms in the wild to zero. To achieveeradication, elimination must be achieved in all world regions.
8Investigating vaccination choices in a game-theoretic framework is also critical for examinations of the welfareaspects of preventive behavior, as the individual risk of infection is directly influenced by the choices made by othersin the community.
9A prevalence elastic strategy is an action plan contingent on how many people are infectious over the course ofan epidemic. It is usually employed in models featuring flexible timing of vaccination, in which feedback about theepidemic is available. As noted by Gersovitz and Hammer (2004), the prevention externality, wherein the vaccinationchoice of an individual can reduce the likelihood that others are immunized, should be separated from the infectionexternality, as one’s own infection can increase the likelihood that others are infected.
10Our social planner problem can also be seen as complementary to that of Gersovitz and Hammer (2004), who
5

This paper is closest in form to Galeotti and Rogers (2013), although we differ in focus.
Galeotti and Rogers (2013) integrated strategic decision making into the susceptible-infected-
susceptible (SIS) framework, in which forward-looking individuals consider the long-run infec-
tion probability.11 Their focus was on how group structure, particularly homophily and assorta-
tive matching, affects immunization behavior, while we focus on how a nonlinear externality af-
fects vaccination decisions and the conditions under which voluntary vaccination can be socially
optimal. There are also major differences in assumptions between our model and that of Galeotti
and Rogers (2013). First, unlike Galeotti and Rogers (2013), we consider the SIR framework un-
der uniform random matching, in which a recovered individual obtains individual immunity and
thus does not suffer any further infection. Second, Galeotti and Rogers (2013) considered a society
with a continuum of individuals, while we consider a society with finitely many individuals.
In the economics literature, nonlinear public good games have been studied primarily to test
the robustness of the typical overcontribution result observed in the standard linear public good
games. Several papers, such as Keser (1996), Sefton and Steinberg (1996) and Isaac and Walker
(1998), have shown that the overcontribution results are persistent in nonlinear settings with in-
terior Nash equilibria. Laury, Walker and Williams (1999) explored how robust the overcontribu-
tion results are to changes in the information describing the payoff structure. They showed that,
although experimental subjects continue to allocate more resources than the Nash prediction, pro-
viding participants with detailed descriptions of the declining marginal benefit to the public good
leads to a significant decrease in the provision of public goods.
Nonlinear public good games have been also investigated in the context of common pool
resources (e.g., Ostrom et al., 1994; Casari and Plott, 2003) and of the volunteer’s dilemma (e.g.,
Diekmann, 1985; Goeree and Holt, 2000; Goeree et al., 2017).12 In a recent contribution, Cason and
Gangadharan (2015) studied behavior in linear and nonlinear social dilemma games with costly
punishment opportunities and demonstrated that the impact of punishment is weaker and takes
longer to be effective in a nonlinear environment. In the volunteer’s dilemma initiated by Diek-
mann (1985), only a single volunteer’s costly commitment to provide a public benefit is required,
and a symmetric equilibrium usually involves mixed strategies. In this regard, the vaccination
game is an extension of the volunteer’s dilemma when the critical level requires a fraction of the
studied the effects of an infection externality without considering the threshold implications of herd immunity.11The proper modeling choice between the SIS framework and the SIR framework depends crucially on the na-
ture of the disease. For instance, it might be more natural to consider the SIS model for pertussis, diphtheria andAIDS/HIV among the diseases mentioned in Appendix A.
12Note, however, that threshold public goods, also known as lumpy public goods or provision point public goods,are only extreme examples of nonlinear public goods. In particular, our nonlinear public good game is not a thresholdpublic good game. Threshold public goods have been widely studied in the economics literature, and we do notreview this literature in this paper.
6
population. In fact, Goeree and Holt (2000) classified the volunteer’s dilemma as a special case of
a threshold public good, for which the critical level is one. Moreover, a standard provision point-
discrete public good game (see Palfrey and Rosenthal, 1984) usually exhibits multiple equilibria
in pure strategies, and mixing is usually not a concern. To the best of our knowledge, the vacci-
nation game is the first to consider mixed-strategy Nash equilibria in nonlinear threshold public
good games.13
2 Preliminaries: Epidemic Model of Bauch and Earn (2004)
A plausible vaccination choice at a fixed interval should account for the fact that the probability
of catching a disease is not constant but will converge to a certain level in the long run. In this
section, we present a model of dynamic epidemic transmission based on the analysis of Bauch and
Earn (2004), who described the interaction of different health compartments of the population.
As we shall see, the vaccination choice of each agent gives rise to the vaccination coverage of a
community, which eventually determines the probability that an unimmunized agent is infected.
2.1 Population Dynamics
Bauch and Earn (2004)’s formulation was based on the well-established SIR model in mathemat-
ical epidemiology (refer to, e.g., Kermack and McKendrick, 1927; Geoffard and Philipson, 1997).
In the classical model, susceptible individuals in a population interact with one another and are
exposed to an infectious disease. Once infected, an individual shifts from the susceptible to the
infected state. Upon infection, an individual has a chance of making a spontaneous recovery and
transitioning to the recovered state, where he/she remains thereafter.
Define S(t), I(t), and R(t) as the number of susceptible, infectious and recovered individu-
als, respectively, at time t, which exhaustively and mutually exclusively categorize a population
of size N " 0. Instantaneously, there is probability β of infectious contact between a susceptible
individual and an infectious individual.14 We introduce vaccination in such a way that immu-
nized agents remain in the recovered state, while unvaccinated agents automatically enter the
susceptible state. The dynamics of the SIR model thus evolve as the following nonlinear ODE
13In their experimental investigation of the volunteer’s dilemma, Goeree et al. (2017) focused on the symmetricmixed-strategy equilibrium. Dixit and Olson (2000) considered a mixed-strategy equilibrium in a two-stage lumpypublic good game, but their focus was on whether voluntary participation undermines the Coase theorem.
14Note that infectious contact can only occur between a susceptible individual and an infectious individual.
7
system:dS(t)
dt= µN(1´ P)´
βS(t)I(t)N
´ µS(t) (1)
dI(t)dt
=βS(t)I(t)
N´ γI(t)´ µI(t) (2)
dR(t)dt
= µNP + γI(t)´ µR(t), (3)
where, for any given t, S(t) + I(t) + R(t) = N, γ is the probability of recovery and µ indicates
the birth rate and the death rate (1/µ is the expected life expectancy).15 P denotes the vaccination
coverage in the population, which is a public choice component added to the original model to fit
settings in which a new medication is introduced or in which new members are introduced into
the community (e.g., infants, immigrants).16 It is noteworthy that, in our setting, the vaccination
term has been defined independently of the time trend of prevalence.
More precisely, (1) specifies the rate of change in the number of susceptible individuals due
to the entry of nonvaccinated members and exit due to new infections and non-disease-related
mortality; (2) specifies the rate of change in prevalence due to the entry of infectious individuals,
while exits are caused by post immunity and mortality; and (3) specifies the rate of change in the
number of recovered individuals due to the entry of vaccinated members and those who recover
from infection, with exits purely due to mortality.
We rewrite the nonlinear ODE system in dimensionless form:17
dSdt
= µ(1´ P)´ βS I ´ µS
dIdt
= βS I ´ γ I ´ µ I
1 = S + I + R,
(4)
where S, I, and R respresent the respective proportion of the population.
Define Pcrit as the vaccination coverage needed for herd immunity (after which the entire
population will be safe from an epidemic). To prevent a disease from becoming an epidemic, we
15Following Geoffard and Philipson (1997), we assume that infection does not induce death since we are not in-terested in the effects of population change. See Keeling and Rohani (2008) for SIR models that incorporate infection-induced mortality. When disease-induced mortality is added to the SIR model with density-dependent transmission,the equilibrium and stability property simply reflect a change in parameters (Chapter 2, pages 24-25).
16We focus on the case of perfect vaccination and no virus evolution, although it is straightforward to extend ourmodel to incorporate imperfect vaccination and virus evolution. Our main qualitative result does not depend on theperfect vaccination assumption.
17Note that Equation (3) is redundant after normalization. We further assume that the initial condition R(0) = 0,I(0) is small but nontrivial, and thus S(0) « 1.
8
should at least have no increase in the proportion of infected individuals, i.e.,
dIdt
= 0,
which implies that
1´ Pcrit =γ + µ
β.
It follows that
Pcrit = 1´1
R0, (5)
where R0 = βγ+µ is the basic reproduction ratio of the disease. Note that R0 ą 1 for any epidemic
(see Anderson and May (1992) for a detailed discussion).18 As listed in Appendix A, the value of
R0 varies with the disease. In the subsequent analysis, we use R0 as a general characteristic that
differentiates epidemics.
Definition 1 (Herd Immunity). A community achieves herd immunity to a disease if a proportion of
the population weakly more than Pcrit is vaccinated in the steady state.
2.2 Long-run Behavior of the Nonlinear Differential System
We denote the steady state of the system as a profile (S˚, I˚, R˚). By setting dSdt = 0 and dI
dt = 0, we
obtain (S˚, I˚, R˚):
(1´ P, 0, P) if P ě Pcrit, (6)
(1
R0,
µ
γ + µ(1´ P)´
µ
β, 1´
1R0´
µ
γ + µ(1´ P) +
µ
β) if P ă Pcrit. (7)
It is readily seen that the system has a “good” steady state and a “bad” steady state. Steady state
(6) is seemingly more socially desirable than steady state (7), as no infection occurs in convergence
to the former. In the subsequent welfare analysis, we verify that this relationship is indeed the
case. Vaccination coverage P plays an indispensable role here, as the steady state toward which
the system will converge depends crucially on P.
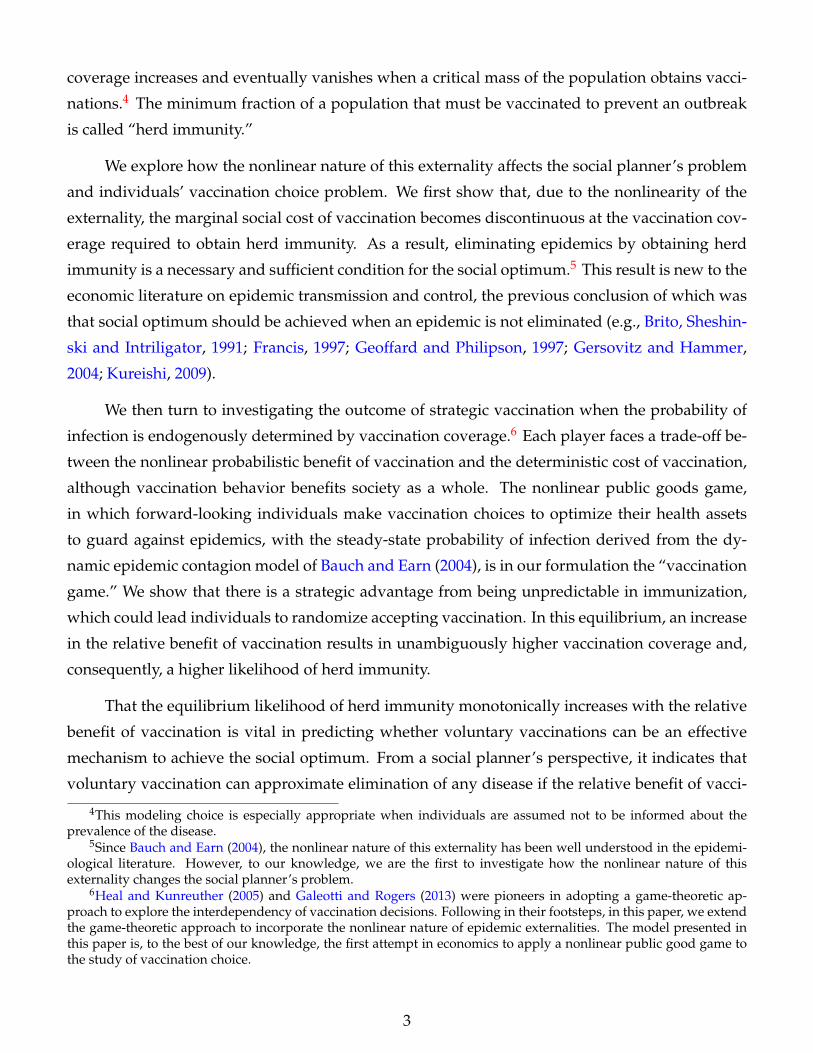
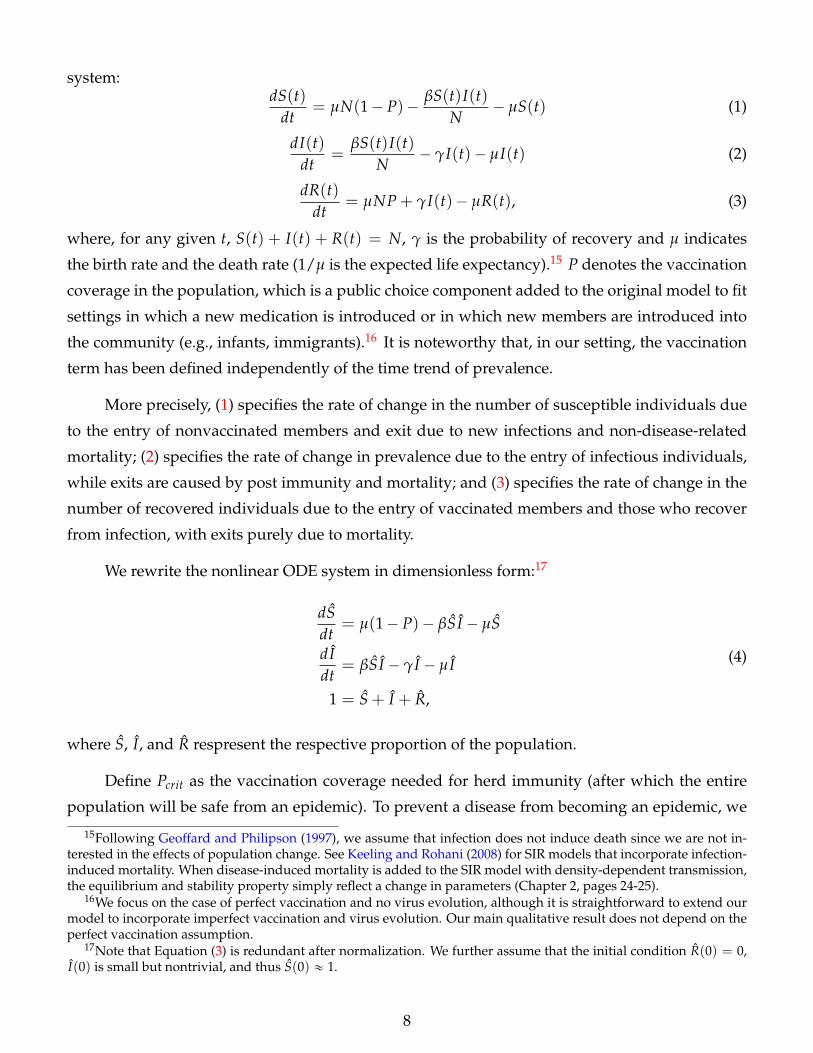
Figure 1(a) plots the direction field of S and R and the contour line of I as a function of S
and R when P = 90%, while Figure 1(b) reproduces the graph with the much lower vaccination
coverage of P = 10% as the only parameter change. We set β = 1, γ = 0.1, and µ = 0.01, which
results in R0 = 9.1 and Pcrit = 89%. The difference between the two figures illustrates the distinct
18Barrett (2003) and Kureishi (2009) derive the same result in their static models.
9
0.1 0.2 0.3 0.4 0.5 0.6 0.7 0.8 0.9Proportion of the Recovered
0
0.1
0.2
0.3
0.4
0.5
0.6
0.7
0.8
0.9
1P
ropo
rtion
of t
he S
usce
ptib
le
0
0
0
0
0
0
0.2
0.2
0.2
0.2
0.2
0.4
0.4
0.4
0.4
0.6
0.6
0.60.8
(10%, 0%, 90%)
1
(a) Herd Immunity
0.1 0.2 0.3 0.4 0.5 0.6 0.7 0.8 0.9Proportion of the Recovered
0
0.1
0.2
0.3
0.4
0.5
0.6
0.7
0.8
0.9
1
Prop
ortio
n of
the Su
scep
tible
0
0
0
0
0
0
0.2
0.2
0.2
0.2
0.2
0.4
0.4
0.4
0.4
0.6
0.6
0.60.8
(11%, 10%, 79%)
1
(b) Without Herd Immunity
Figure 1: Direction Field and Contour Line of the SIR disease
steady states with and without herd immunity. In Figure 1(a), starting from any arbitrary initial
point in the upper-left corner, the epidemic system will eventually move toward the steady state
(6) marked by the cross (10%, 0, 90%), which lies on the diagonal line I = 0 (i.e., zero prevalence).
In comparison, given an arbitrary plausible initial point, the epidemic system in Figure 1(b) will
always move to a stable node corresponding to the steady state (7) marked by the other cross
(11%, 10%, 79%), making elimination impossible.
The implications of the steady states are far reaching: one of them is to determine the long-
run infection probability. Define πP as the probability that an unvaccinated individual will even-
tually be infected, with the vaccination coverage of the population being P. We simply call πP the
long-run probability of infection. The characterization of πP leads us to the following proposition.
Proposition 1. [Bauch and Earn (2004)] Given any P P [0, 1], there exists a unique πP that is strictly
decreasing and concave in P until P reaches the elimination threshold Pcrit. Furthermore, πP = 1´ 1R0(1´P)
for any P ă Pcrit, and πP = 0 for any P ě Pcrit.
Proof. See Appendix B.
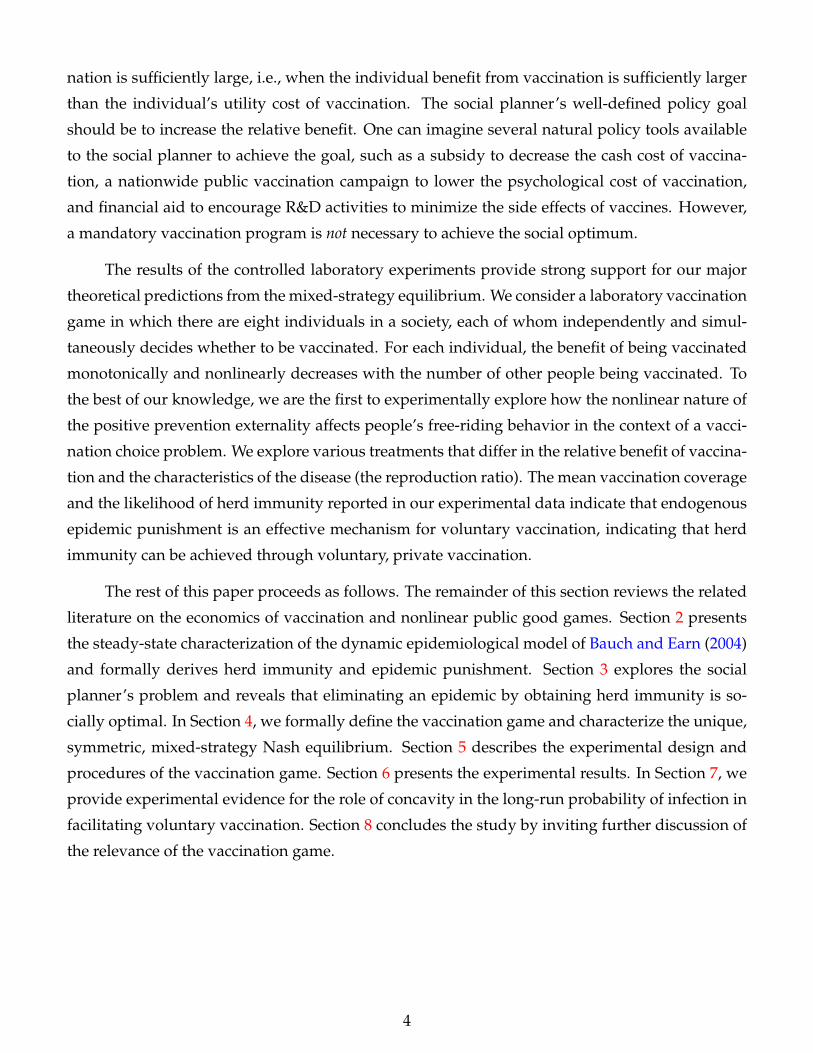
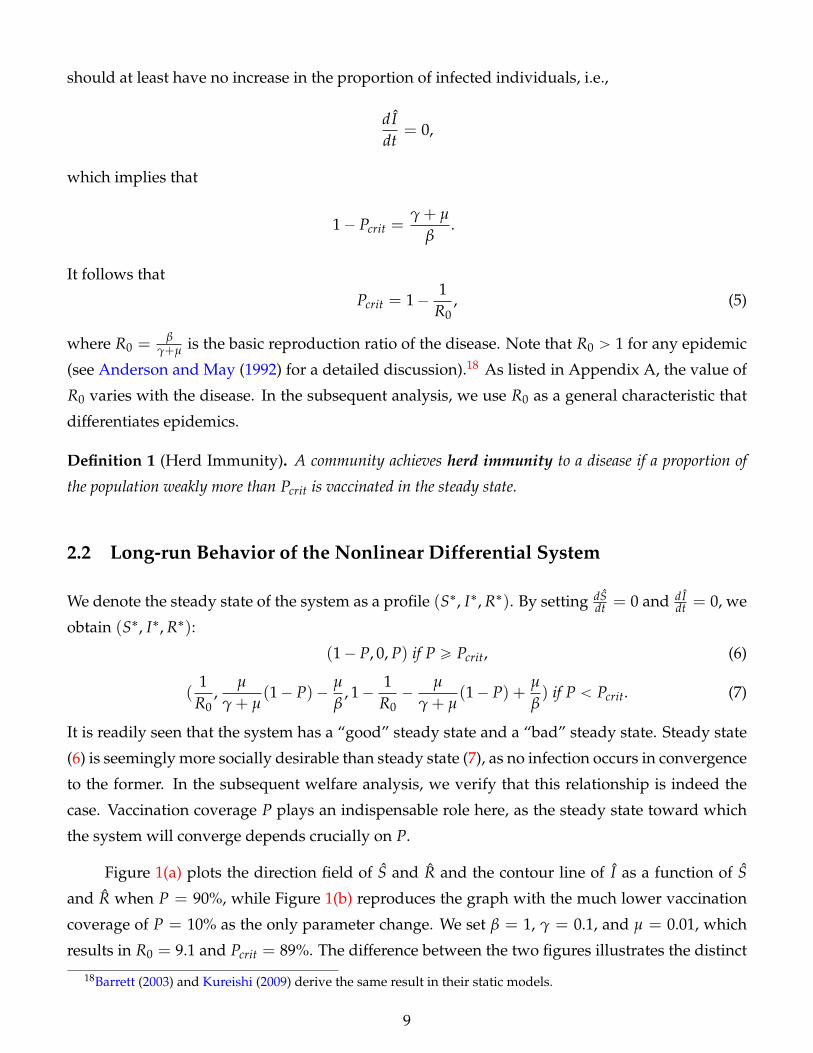
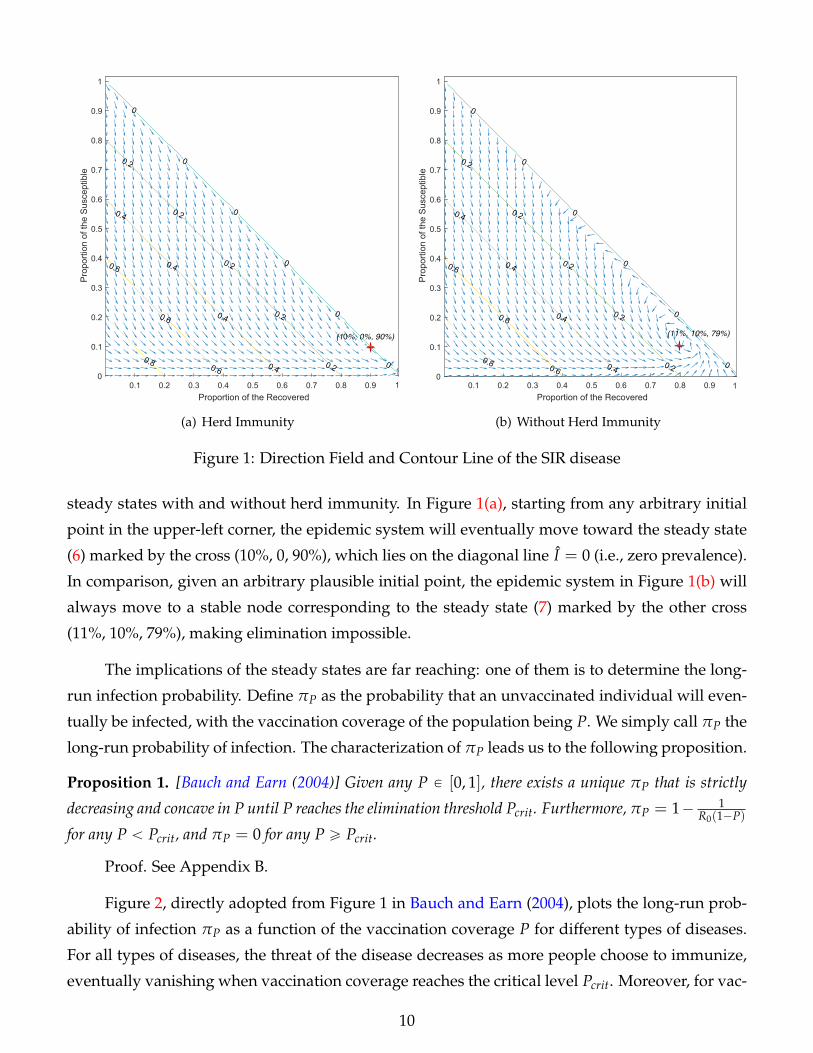
Figure 2, directly adopted from Figure 1 in Bauch and Earn (2004), plots the long-run prob-
ability of infection πP as a function of the vaccination coverage P for different types of diseases.
For all types of diseases, the threat of the disease decreases as more people choose to immunize,
eventually vanishing when vaccination coverage reaches the critical level Pcrit. Moreover, for vac-
10
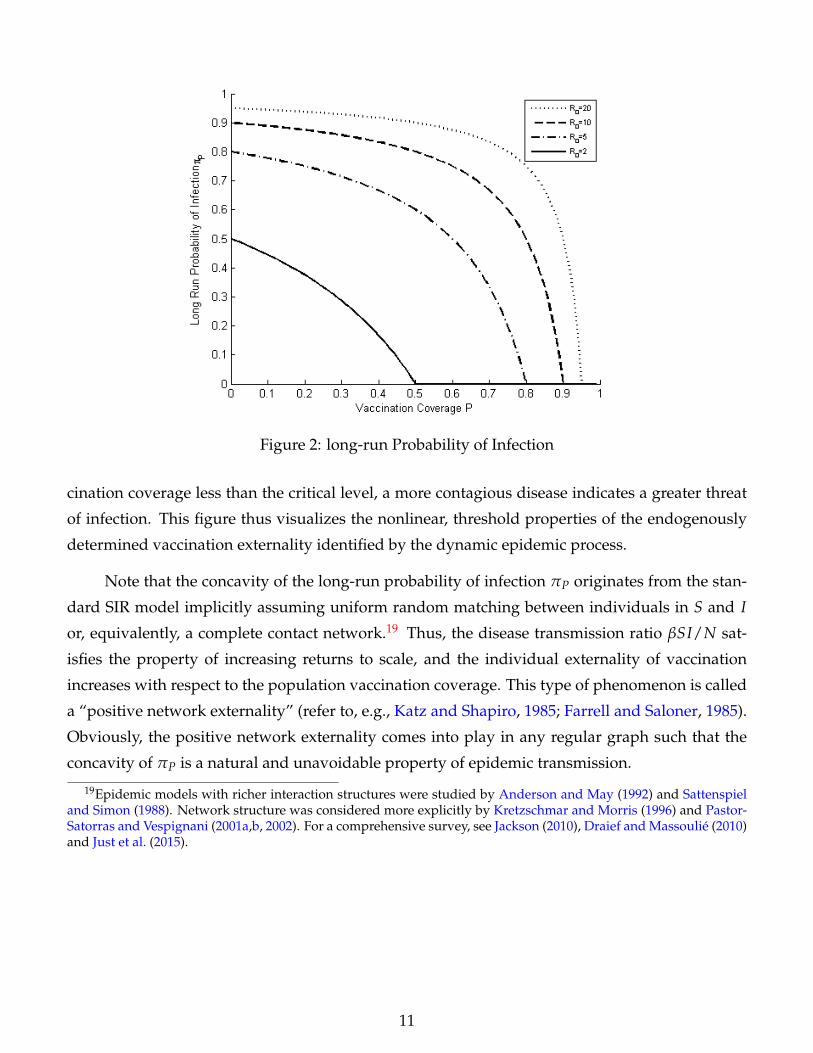
Figure 2: long-run Probability of Infection
cination coverage less than the critical level, a more contagious disease indicates a greater threat
of infection. This figure thus visualizes the nonlinear, threshold properties of the endogenously
determined vaccination externality identified by the dynamic epidemic process.
Note that the concavity of the long-run probability of infection πP originates from the stan-
dard SIR model implicitly assuming uniform random matching between individuals in S and I
or, equivalently, a complete contact network.19 Thus, the disease transmission ratio βSI/N sat-
isfies the property of increasing returns to scale, and the individual externality of vaccination
increases with respect to the population vaccination coverage. This type of phenomenon is called
a “positive network externality” (refer to, e.g., Katz and Shapiro, 1985; Farrell and Saloner, 1985).
Obviously, the positive network externality comes into play in any regular graph such that the
concavity of πP is a natural and unavoidable property of epidemic transmission.
19Epidemic models with richer interaction structures were studied by Anderson and May (1992) and Sattenspieland Simon (1988). Network structure was considered more explicitly by Kretzschmar and Morris (1996) and Pastor-Satorras and Vespignani (2001a,b, 2002). For a comprehensive survey, see Jackson (2010), Draief and Massoulie (2010)and Just et al. (2015).
11
3 Social Planner’s Problem
The notion of herd immunity and the nonlinear nature of externality make it necessary to redefine
the social planner’s problem. In this section, we show that the elimination of epidemics is a
necessary and sufficient condition for the socially optimal vaccination coverage when the notion
of herd immunity and the concavity of the long-run infection probability are considered.
For each player i, there are three possible health statuses: susceptible (S), infected (I), and
recovered (R). For any health status θ P tS, I, Ru, u(θ) denotes the instantaneous utility from the
state θ. Assume that
u(S) = u(R) ą u(I), (8)
such that a player values the uninfected status qualitatively more than the infected status. Define
the utility cost of infection as L = u(R)´ u(I).
Let Unv(P) denote a schedule representing the expected utility of an unvaccinated individual
given the vaccination coverage P in the steady state. Then,
Unv(P) =
$
&
%
1µ u(R) if P ě Pcrit
1µ u(S)´ πP ¨ dR0 ¨ L if P ă Pcrit,
where dR0 ą 0 is the duration of the infection that is uniquely determined by R0, a characteristic
of the disease. 1/µ is the life expectancy.
Let Uv(P) denote a schedule representing the actual utility of a vaccinated individual inclu-
sive of vaccination cost in the steady state. Then, we have
Uv(P) =1µ
u(R)´ C(P),
where C(P) is the P-percentile individual’s utility cost of vaccination that can reflect a combina-
tion of cash costs, psychological costs and possible side effects. Note that this cost is the only
individual heterogeneity allowed in the model considered in this section.20
In an epidemic context, social welfare is defined as the aggregate health assets of the society
20To render our analysis comparable to the findings in the literature, we focus on a quasisymmetric environmentallowing for the heterogenous vaccination costs in this section. However, we consider the case of homogeneousvaccination costs to provide a full characterization of equilibria in Section 4. The main result of this section – theoptimality of herd immunity – does not depend on whether the vaccination cost is heterogenous or homogenous.
12
(i.e., utilitarian). Formally, the social welfare function W(P) can be written as
W(P) =ż P
0Uv(P)dP + Unv(P)(1´ P).
The social optimum can be found by solving the social planner’s problem of maximizing the
social welfare function W(P). From the first-order condition, we have
Uv(P)loomoon
MSB(P)
= Unv(P)loomoon
MPC(P)
´dUnv(P)
dP(1´ P)
looooooooomooooooooon
Externality
” MSC(P) (9)
The left-hand side of Equation (9) represents the marginal social benefit (MSB) of vaccination. The
first term on the right-hand side of Equation (9) represents the marginal private cost (opportunity
cost) of vaccination, while the second term represents the prevention externality of vaccination.
The combination of these two terms, denoted MSC, is thus the marginal social cost of vaccination.
The social optimum is achieved exactly when the marginal social benefit of vaccination is the
same as its marginal social cost.
EU, U
P
Unv(P)
MSC(P)
P’ P*
Uv(P)
(a) Brito et al. (1991)
Unv(P)
P’ P*=Pcrit P
EU, U
MSC(P)
MSC(P)
dR0L
Uv(P)
(b) Our case
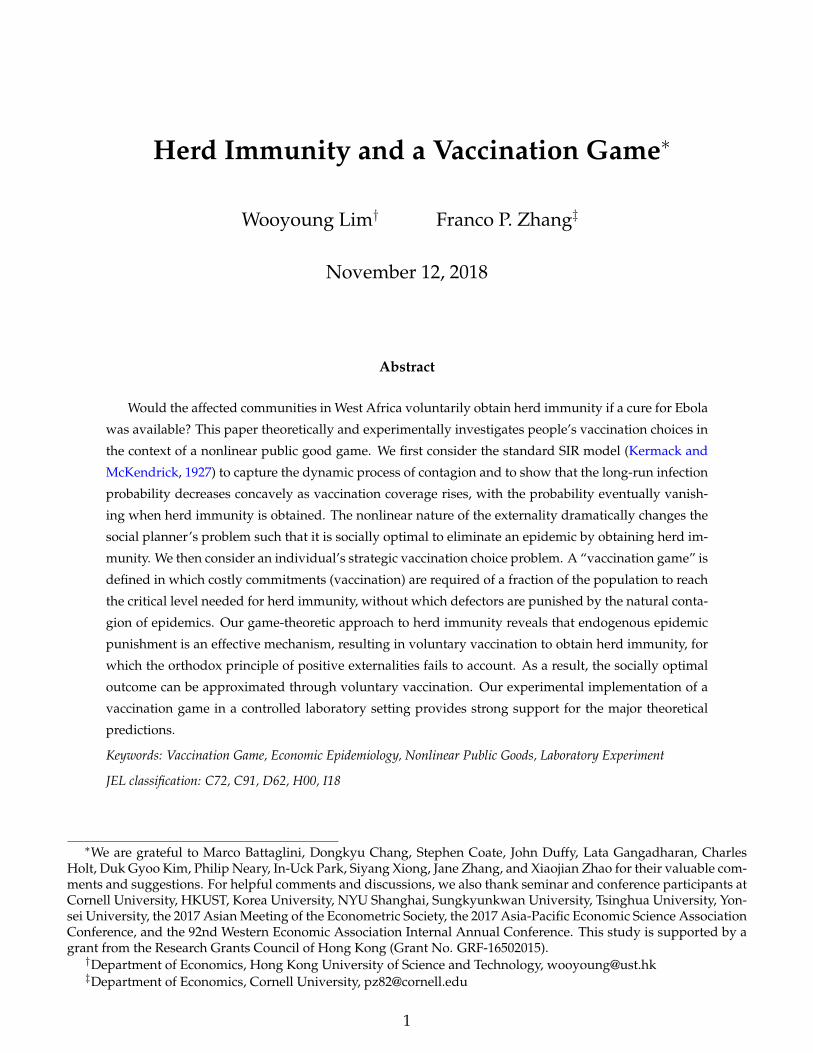
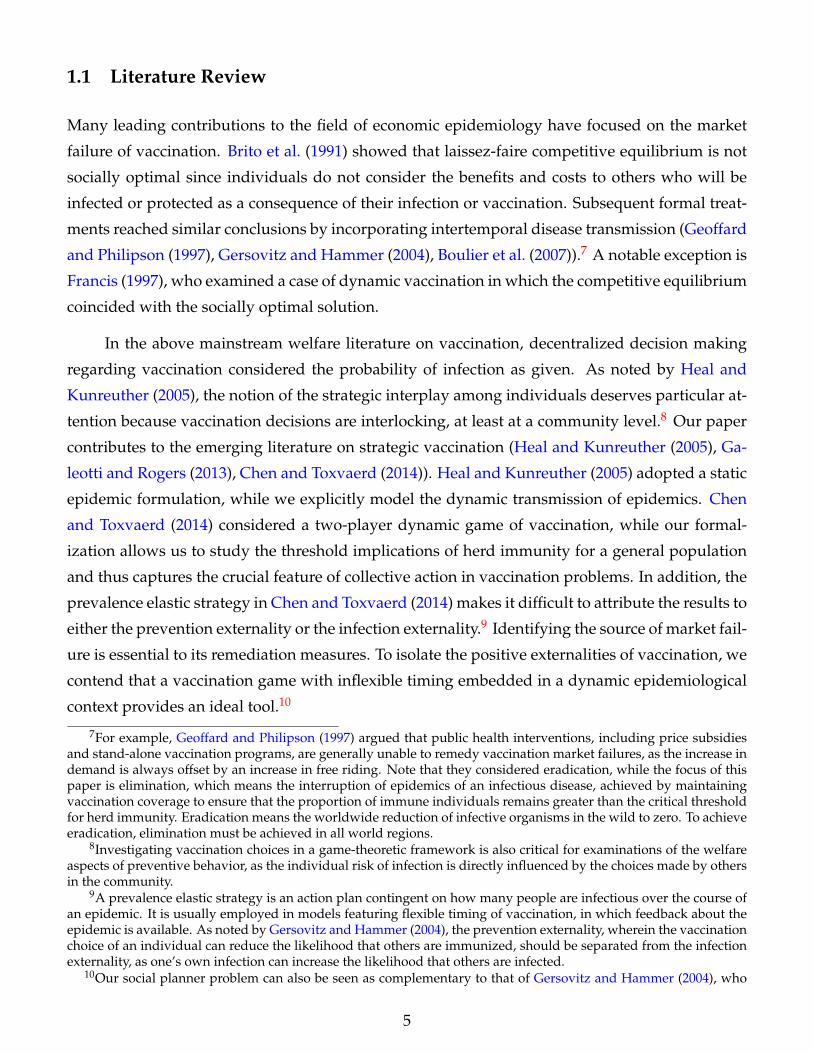
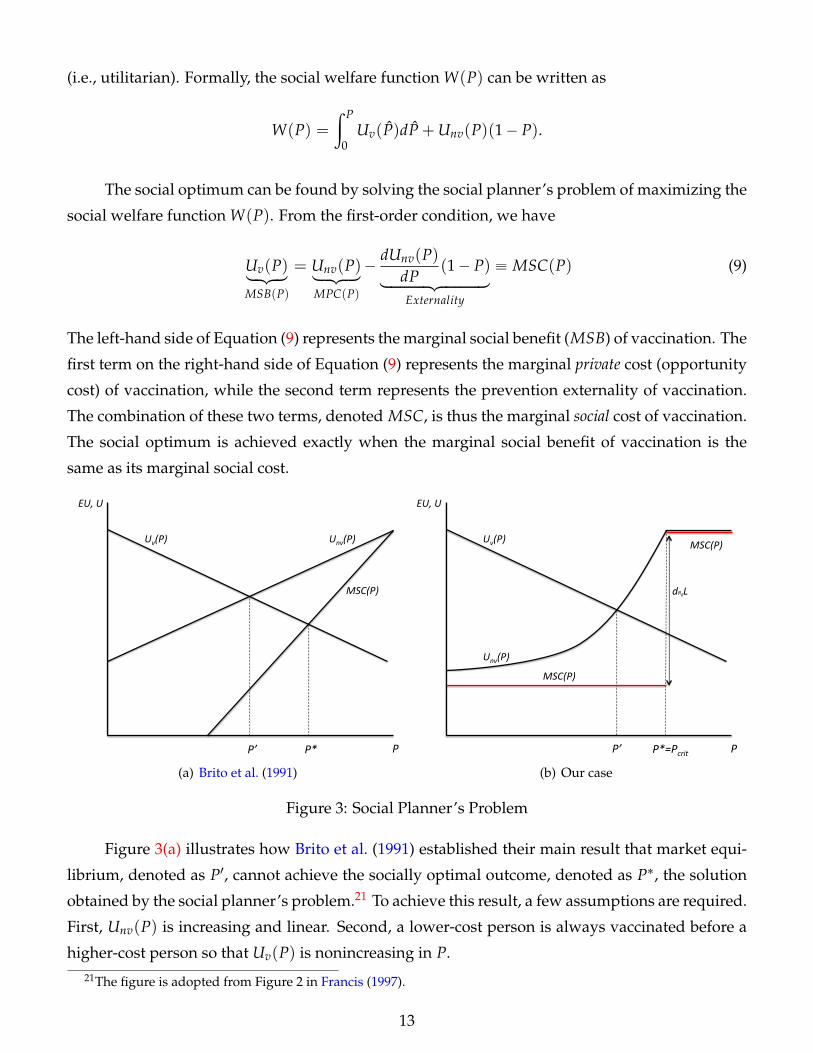
Figure 3: Social Planner’s Problem
Figure 3(a) illustrates how Brito et al. (1991) established their main result that market equi-
librium, denoted as P1, cannot achieve the socially optimal outcome, denoted as P˚, the solution
obtained by the social planner’s problem.21 To achieve this result, a few assumptions are required.
First, Unv(P) is increasing and linear. Second, a lower-cost person is always vaccinated before a
higher-cost person so that Uv(P) is nonincreasing in P.21The figure is adopted from Figure 2 in Francis (1997).
13
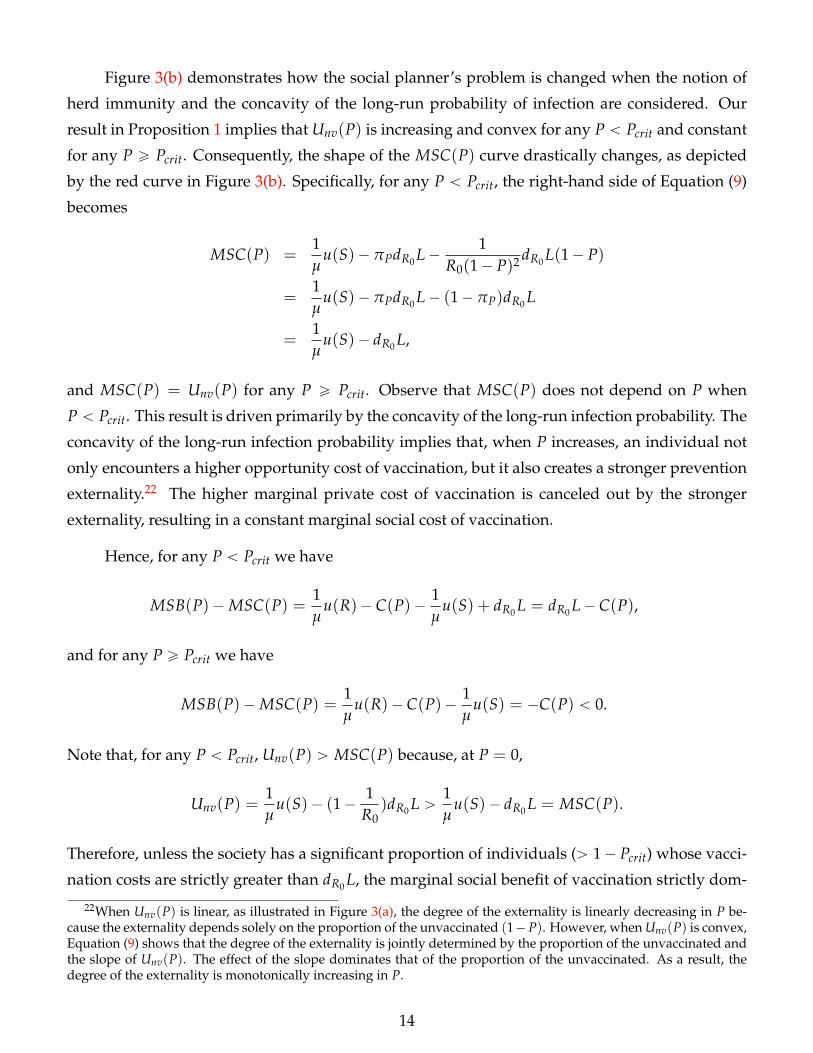
Figure 3(b) demonstrates how the social planner’s problem is changed when the notion of
herd immunity and the concavity of the long-run probability of infection are considered. Our
result in Proposition 1 implies that Unv(P) is increasing and convex for any P ă Pcrit and constant
for any P ě Pcrit. Consequently, the shape of the MSC(P) curve drastically changes, as depicted
by the red curve in Figure 3(b). Specifically, for any P ă Pcrit, the right-hand side of Equation (9)
becomes
MSC(P) =1µ
u(S)´ πPdR0 L´1
R0(1´ P)2 dR0 L(1´ P)
=1µ
u(S)´ πPdR0 L´ (1´ πP)dR0 L
=1µ
u(S)´ dR0 L,
and MSC(P) = Unv(P) for any P ě Pcrit. Observe that MSC(P) does not depend on P when
P ă Pcrit. This result is driven primarily by the concavity of the long-run infection probability. The
concavity of the long-run infection probability implies that, when P increases, an individual not
only encounters a higher opportunity cost of vaccination, but it also creates a stronger prevention
externality.22 The higher marginal private cost of vaccination is canceled out by the stronger
externality, resulting in a constant marginal social cost of vaccination.
Hence, for any P ă Pcrit we have
MSB(P)´MSC(P) =1µ
u(R)´ C(P)´1µ
u(S) + dR0 L = dR0 L´ C(P),
and for any P ě Pcrit we have
MSB(P)´MSC(P) =1µ
u(R)´ C(P)´1µ
u(S) = ´C(P) ă 0.
Note that, for any P ă Pcrit, Unv(P) ą MSC(P) because, at P = 0,
Unv(P) =1µ
u(S)´ (1´1
R0)dR0 L ą
1µ
u(S)´ dR0 L = MSC(P).
Therefore, unless the society has a significant proportion of individuals (ą 1´ Pcrit) whose vacci-
nation costs are strictly greater than dR0 L, the marginal social benefit of vaccination strictly dom-
22When Unv(P) is linear, as illustrated in Figure 3(a), the degree of the externality is linearly decreasing in P be-cause the externality depends solely on the proportion of the unvaccinated (1´ P). However, when Unv(P) is convex,Equation (9) shows that the degree of the externality is jointly determined by the proportion of the unvaccinated andthe slope of Unv(P). The effect of the slope dominates that of the proportion of the unvaccinated. As a result, thedegree of the externality is monotonically increasing in P.
14
inates the marginal social cost of it for any P ă Pcrit. This result is summarized in the following
proposition.
Proposition 2. Assume that C(Pcrit) ď dR0 L. Then,
(1) P1 ă P˚; i.e., the market equilibrium cannot achieve the socially optimal outcome; and
(2) P˚ = Pcrit; i.e., the socially optimal outcome is achieved if and only if herd immunity is achieved.
Three remarks are in order. First, we consider a society that consists of a continuum of in-
dividuals (so that P is a continuous variable) in this section for ease of comparison between our
result and the result presented in Brito et al. (1991). However, the optimality of the herd immu-
nity presented in Proposition 2 is robust to the environment with a finite number of individuals.
Second, this result reveals that achieving herd immunity is socially optimal unless the society has
a significant proportion of individuals whose vaccination costs are unreasonably high. Thus, in
the remainder of our paper, we focus on the case in which achieving herd immunity is socially
optimal, and we address whether voluntary vaccination can achieve the elimination of epidemics.
Third, the market equilibrium P1 is a traditional solution obtained by assuming that individuals
consider the vaccination coverage P as given when making their vaccination choices. In the next
section, we consider a strategic vaccination choice problem among individuals in the society in
which vaccination coverage P is endogenously determined. We show that this strategic interde-
pendency can completely change the prediction.
4 Vaccination Game and Equilibrium Analysis
In this section, we present a game-theoretic model of vaccination choices by incorporating the
main result of the epidemic dynamics presented in Section 2. The long-run infection probability
πP generates an endogenous punishment for free-riders, i.e., unvaccinated individuals.
4.1 Vaccination Game
Consider a society with a finite set of players N := t1, 2, . . . , nu whose preferences satisfy the
Von Neumann-Morgenstern axioms such that they maximize expected utility.23 Each player i P
23To be consistent with the epidemic model, let n = µN denote an integer-valued number of players. Risk prefer-ences can alter the benefits of vaccination; altruism can reduce the costs of vaccination. However, in either case, thedecision rule for the binary choice would not be affected, and the same result applies.
15
N simultaneously and independently makes a vaccination choice bi in Bi := tvc, nvu, where
vc and nv refer to vaccination and nonvaccination choices, respectively. For any player i, let
b´i = (b1, ...bi´1, bi+1, ..., bn) denote the pure-strategy profile of other players. For a given pure-
strategy profile b = (b1, ..., bn) = (bi, b´i), let V(b) = ti P N |bi = vcu denote the set of vaccinated
players. The proportional vaccine coverage of the population P is endogenously determined as
follows:
P(b) = |V(b)|/n,
where |V(b)| = ν denotes the cardinality of the set V(b). Let νcrit denote the smallest integer
value greater than Pcritn.
For a given P, let πP denote the long-run infection probability. As described in Proposition
1, πP is strictly decreasing and concave in P for any P ă Pcrit, and πP = 0 for any P ě Pcrit.
E = tβ, γ, µu describes the unique characteristics of the nature of the epidemic. We consider
forward-looking players who consider the steady-state, long-run probability of infection πP when
making their vaccination decisions bi.24
For each player i, there are three possible health statuses ex post: susceptible (S), infected (I),
and recovered (R). For any health status θ P tS, I, Ru, u(θ) denotes the instantaneous utility from
the state θ. Assume that
u(S) = u(R) ą u(I), (10)
such that a player values the uninfected status qualitatively more than the infected status.25 De-
fine the utility cost of infection as L = u(R)´ u(I).26
For any player i, the expected utility of not vaccinating given a fixed strategy profile of other
players b´i (and thus for a fixed vaccine coverage P) is as follows:
Ui(nv, b´i) =
$
&
%
1µ u(R) if P(nv, b´i) ě Pcrit
1µ u(S)´ πP(nv,b´i)
¨ dR0 ¨ L if P(nv, b´i) ă Pcrit,
where dR0 ą 0 is the duration of the infection uniquely determined by R0, a characteristic of the
disease. d1R0ě 0 because a larger R0 indicates a lower possibility of recovery.
24We aim at modeling a situation in which epidemic transmission occurs in a short period of time, e.g., two weeksor less, allowing us to focus on the steady-state payoffs and outcomes with no time discounting.
25We acknowledge that u(R) can be larger than u(S), and the same conclusion applies in this case but is consider-ably more notationally burdensome.
26As one might have already noted, the model and notations we have in this section are consistent with those inSection 3. We restate them to render this section self-contained.
16
For any player i, the expected utility of vaccination for any b´i is
Ui(vc, b´i) = Ui(vc) =1µ
u(R)´ C,
where C is the utility cost of vaccination that can reflect a combination of cash costs, psychological
costs and possible side effects. All of these costs are common knowledge.27
We call the simultaneous-move game defined by the tuple tN , tBiuiPN , tUiuiPN u the vacci-
nation game G. In what follows, we focus on the case in which C ď π0dR0 L because our welfare
analysis shows that herd immunity is the social optimum (i.e. P˚ = Pcrit) if and only if that condi-
tion is satisfied. If C ą π0dR0 L, then the only equilibrium outcome is zero vaccination coverage.
4.2 Mixed-strategy Equilibria
Can epidemics be eliminated by voluntary vaccinations? It is clear that there is a spectrum of
pure-strategy equilibria in which precisely n ¨ Pcrit players choose vaccination, and the remainder
choose to free ride. Consequently, the answer should be yes if one focuses on the pure-strategy
equilibria. Nonetheless, the asymmetry of these equilibria is undesirable because they all arbi-
trarily require identical players to choose different strategies in a precisely coordinated manner.28
In this section, we thus answer this question by focusing on unique symmetric mixed-strategy
equilibrium. The full characterization of Nash equilibrium outcomes is presented in Appendix B.
Before presenting a formal derivation, we discuss why an individual would use a mixed
strategy for a binary immunization choice in the simplest three-player setting when one of them
has already been infected, and the vaccination of only one susceptible individual suffices to obtain
herd immunity in the society. If the other susceptible individual has not been vaccinated for
certain, an individual should protect himself/herself from infection unless the vaccination cost is
unreasonably high; however, if the other individual is certain to vaccinate, an individual would
choose to free ride. Therefore, there is a strategic advantage of being unpredictable.
Let σi P [0, 1] denote the probability that player i chooses vaccination. σ = (σ1, . . . , σn)
denotes a mixed-strategy profile. The expected payoff for player i from randomization with σi
27Following Heal and Kunreuther (2005) and Galeotti and Rogers (2013), we focus on the case of homogenousvaccination cost, which enables us to provide a full characterization of equilibria in the next subsection. However,our main result – the existence of a symmetric mixed-strategy equilibrium in which herd immunity is approximatedas the relative benefit of vaccination increases – does not depend on the homogenous vaccination cost assumption.Also note that Ui(nv, b´i) and Ui(vc, b´i) correspond to Unv(P) and Uvc(P), respectively, defined in Section 3.
28See Dixit and Olson (2000) for a detailed discussion of this coordination issue. For the same reason, Goeree etal. (2017) focused on the symmetric mixed-strategy equilibrium in their experimental investigation of the volunteer’sdilemma.
17
can be expressed as follows:
EUi(σi, σ´i) =u(R)
µ´ σiC´ (1´ σi)dR0 LE[πP(σ)],
where E[πP(σ)] denotes the expected infection probability given the mixed-strategy profile σ.
Definition 2. A strategy profile σ˚ = (σ˚1 , . . . , σ˚n) P [0, 1]n is a totally mixed-strategy Nash equilibrium
for the game G if we have for any i P N
σi P (0, 1), (11)
and for all σ˚i P [0, 1],
EUi(σ˚i , σ˚´i) ě EUi(σi, σ˚´i). (12)
The following proposition implicitly characterizes the unique totally mixed-strategy Nash
equilibrium of the vaccination game G, the uniqueness of which is proved in Appendix B.
Proposition 3. Let LC = r P ( R0
(R0´1)dR0,+8) be the relative benefit of vaccination, and n ą R0. There
exists a unique, totally mixed-strategy equilibrium, where σ˚i = σ˚ and is implicitly defined by
1dR0r
=νcritÿ
k=0
(1´
1R0´
kn
)(nk
)σ˚k(1´ σ˚)n´1´k. (13)
Proof. See Appendix B.
This proposition reveals that our vaccination game has no asymmetric, totally mixed-strategy
Nash equilibrium. However, as noted earlier, there is a whole collection of asymmetric pure-
strategy equilibria, in which precisely n ¨ Pcrit players choose vaccination, and the remainder free
ride. This outcome conflicts with the noncooperative nature of our vaccination game because
identical players are required to behave differently but in a precisely coordinated manner. There-
fore, we focus on the unique symmetric mixed-strategy equilibrium, also considered by Palfrey
and Rosenthal (1984), Dixit and Olson (2000), and Goeree et al. (2017). We determine later whether
any of the asymmetric pure-strategy equilibria could explain the observed laboratory behavior
well.
18
4.3 Equilibrium Vaccination Coverage
In this section, we focus on the mixed-strategy equilibrium and ask the following two questions.
First, when is it possible that players contribute sufficiently for the society to achieve herd im-
munity? Second, are the players more likely to reach immunity if they are faced with a more
threatening epidemic?
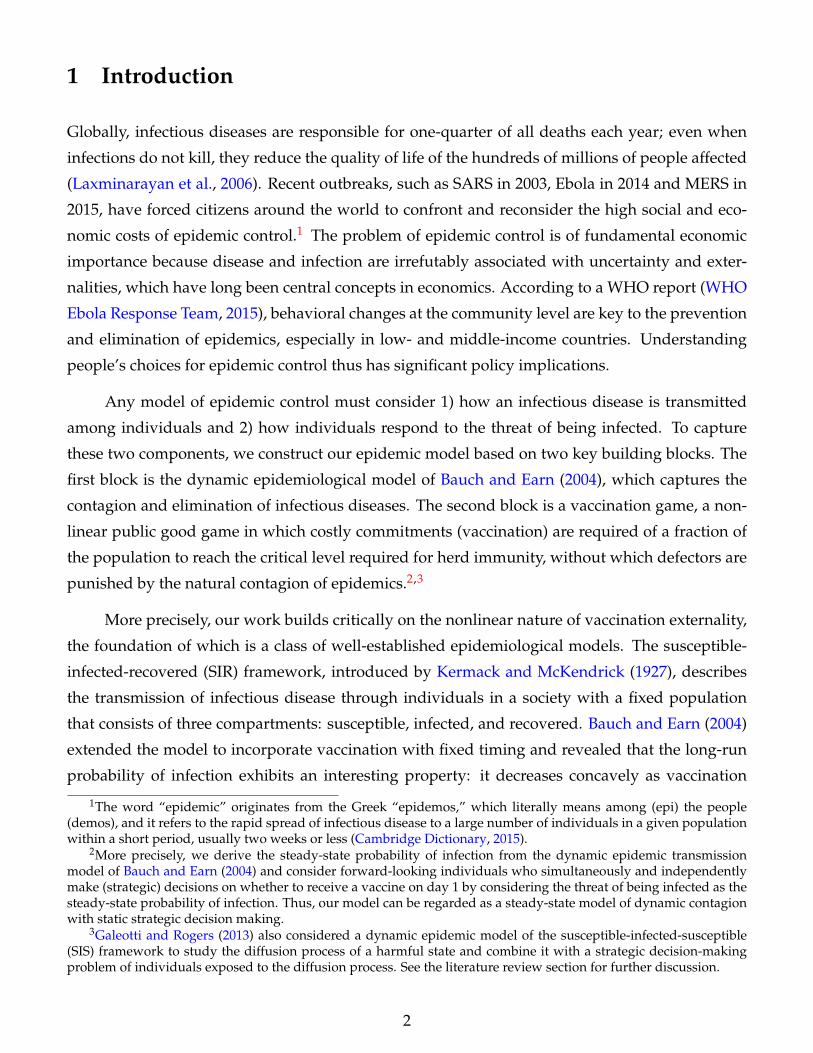
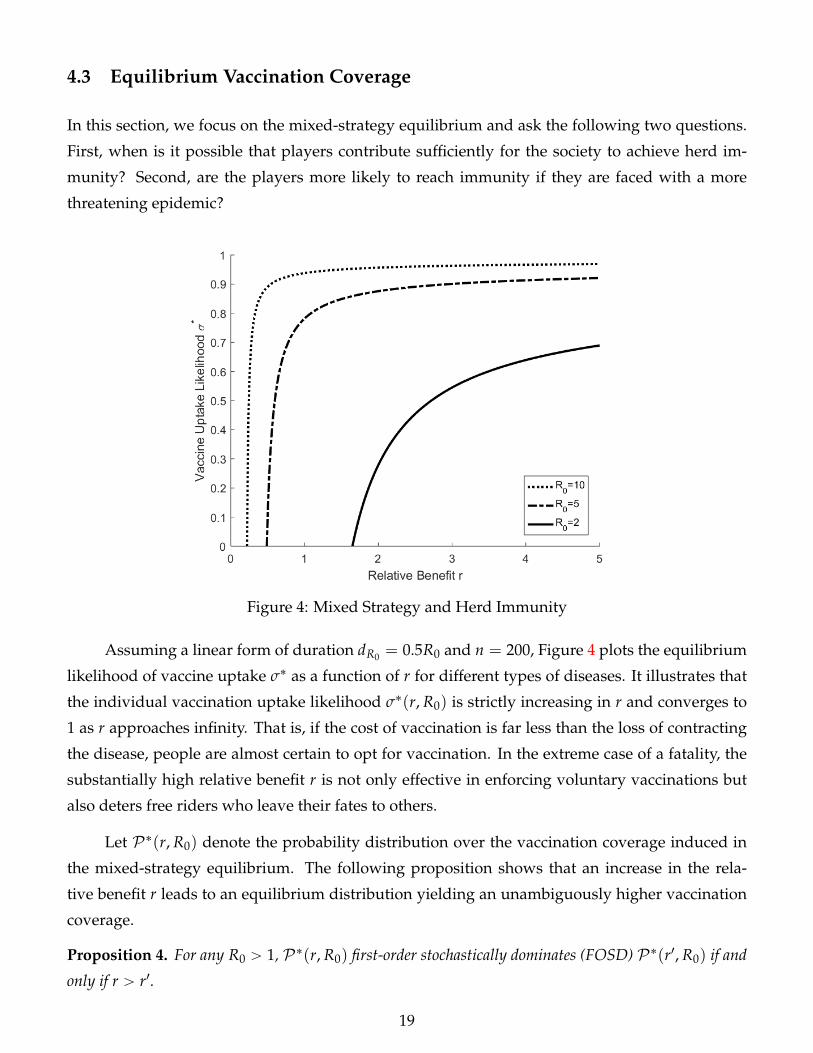
Figure 4: Mixed Strategy and Herd Immunity
Assuming a linear form of duration dR0 = 0.5R0 and n = 200, Figure 4 plots the equilibrium
likelihood of vaccine uptake σ˚ as a function of r for different types of diseases. It illustrates that
the individual vaccination uptake likelihood σ˚(r, R0) is strictly increasing in r and converges to
1 as r approaches infinity. That is, if the cost of vaccination is far less than the loss of contracting
the disease, people are almost certain to opt for vaccination. In the extreme case of a fatality, the
substantially high relative benefit r is not only effective in enforcing voluntary vaccinations but
also deters free riders who leave their fates to others.
Let P˚(r, R0) denote the probability distribution over the vaccination coverage induced in
the mixed-strategy equilibrium. The following proposition shows that an increase in the rela-
tive benefit r leads to an equilibrium distribution yielding an unambiguously higher vaccination
coverage.
Proposition 4. For any R0 ą 1, P˚(r, R0) first-order stochastically dominates (FOSD) P˚(r1, R0) if and
only if r ą r1.
19
Proof. See Appendix B.
The stochastic dominance presented in Proposition 4 implies that Pr˚(P ě Pcrit), the equi-
librium probability for the society to achieve the vaccination coverage needed to obtain herd im-
munity, is monotonically increasing in r and converges to 1 as r approaches infinity. By nature of
mixed-strategy equilibria, it is impossible to obtain Pr˚(P ě Pcrit) = 1 and obliterate an epidemic.
However, the society can still approximate the complete immunity via voluntary vaccination. The
following corollary summarizes this discussion.
Corollary 1. Pr˚(P ě Pcrit)Ñ 1 as r Ñ 8.
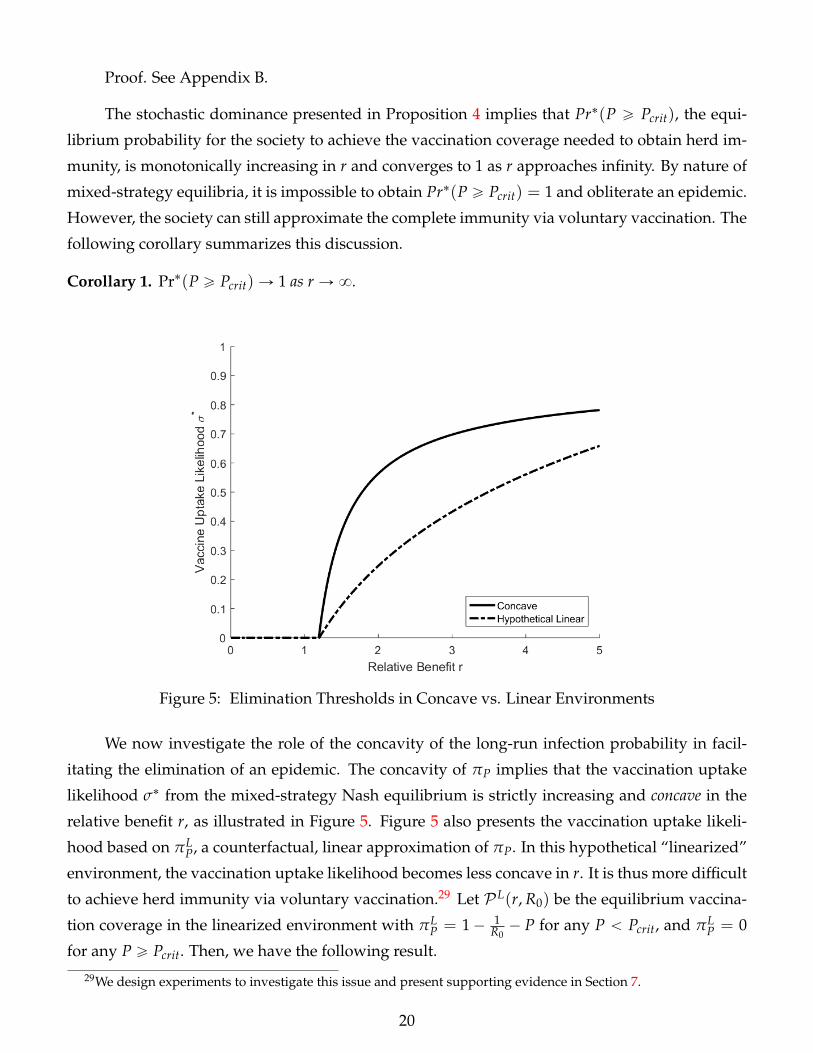
Figure 5: Elimination Thresholds in Concave vs. Linear Environments
We now investigate the role of the concavity of the long-run infection probability in facil-
itating the elimination of an epidemic. The concavity of πP implies that the vaccination uptake
likelihood σ˚ from the mixed-strategy Nash equilibrium is strictly increasing and concave in the
relative benefit r, as illustrated in Figure 5. Figure 5 also presents the vaccination uptake likeli-
hood based on πLP, a counterfactual, linear approximation of πP. In this hypothetical “linearized”
environment, the vaccination uptake likelihood becomes less concave in r. It is thus more difficult
to achieve herd immunity via voluntary vaccination.29 Let P L(r, R0) be the equilibrium vaccina-
tion coverage in the linearized environment with πLP = 1´ 1
R0´ P for any P ă Pcrit, and πL
P = 0
for any P ě Pcrit. Then, we have the following result.
29We design experiments to investigate this issue and present supporting evidence in Section 7.
20
Proposition 5. For any r ą R0(R0´1)dR0
and R0 ą 1, P˚(r, R0) FOSD P L(r, R0).
The results presented in Propositions 4 and 5 have an important policy implication. Propo-
sition 4 implies that the social planner should have a well-defined policy goal of increasing the
relative benefit r. Proposition 5 shows that targeting a higher relative benefit r is particularly
effective due to the concave nature of the externality. There are a few ways to achieve a high
relative benefit r. First, a subsidy should be an effective policy tool to lower the vaccination cost
C. Second, a nationwide vaccination campaign can also decrease the psychological cost of vacci-
nation. Third, financial aid can be provided to encourage R&D activities to develop new vaccines
with fewer and weaker side effects. However, the propositions imply that no mandatory vacci-
nation program is needed to achieve the socially optimal outcome, especially when the network
externality is strong in the society, and the nature of the externality is concave.
We now address our second question. An exogenous increase in the reproduction ratio R0
has two competing effects on how easily the society can achieve herd immunity via voluntary
vaccination. On the one hand, it increases the long-run probability of infection πP, as illustrated
in Figure 2, indicating that individuals in the mixed-strategy Nash equilibrium are more likely
to vaccinate. On the other hand, a higher R0 also increases the critical level needed for herd
immunity Pcrit. Figure 4 shows that the first effect dominates the second effect so that it is easier to
achieve herd immunity when R0 is higher. This result is summarized in the following proposition.
Proposition 6. For any r P ( R0(R0´1)dR0
,+8), P˚(r, R0) FOSD P˚(r, R10) if and only if R0 ą R10.
Proof. See Appendix B.
This result implies that a more contagious disease is unambiguously easier to manage. A
higher R0 encourages people to be vaccinated voluntarily. Hence, epidemics like Ebola, with
substantially low R0, are particularly difficult to control based on voluntary vaccination.
5 Experimental Design
We now present our experimental design to test the major theoretical predictions from the unique
symmetric/totally mixed-strategy Nash equilibrium shown in the previous section. There are a
few reasons that it is necessary to offer supporting evidence for our theoretical findings. First,
there is a trivial equilibrium selection issue in our vaccination game such that, without experi-
mental evidence, it is unclear whether the general conclusion that we draw from our theoretical
analysis is reliable. Second, except for the work by Ibuka et al. (2014), no experimental study has
21
directly investigated how the benefit and cost of vaccination influence free-riding behavior in in-
dividuals’ vaccination decisions. To the best of our knowledge, we are the first to experimentally
explore how the nonlinear nature of the positive prevention externality affects people’s free-riding
behavior in the context of a vaccination choice problem.
5.1 Treatments and Hypotheses
Our experimental implementation considers the following reduced form of the vaccination game.
There are eight individuals in a society (i.e., n = 8), and they are ex ante identical. Each individual
is initially endowed with u(R)/µ = 80. It is assumed that the duration of infection takes the
functional form dR0 = 0.8R0 and the utility cost of vaccination C = 5. That is, with herd immunity,
all free riders receive 80, while people who receive the vaccine receive 75. In the absence of
herd immunity, the probability of infection πP is endogenously determined by P, according to
Proposition 1. For example, when the utility cost of infection L = 25, the basic reproduction
ratio is R0 = 4, and the vaccination coverage is P = 1/2, so πP = 1/2; i.e., the payoff for a
nonvaccinator is equally likely to be 80 and 0 (= 80´ 0.8ˆ 4ˆ 25).
The major treatment variables correspond to the relative benefit of vaccination (r: relative
benefit) and the basic reproduction ratio of the epidemic (R0: reproduction ratio). We choose
parameter specifications with r = 1 or 5 and R0 = 2 or 4 to create a qualitative difference in
the vaccination coverage predicted by the symmetric mixed-strategy Nash equilibrium across
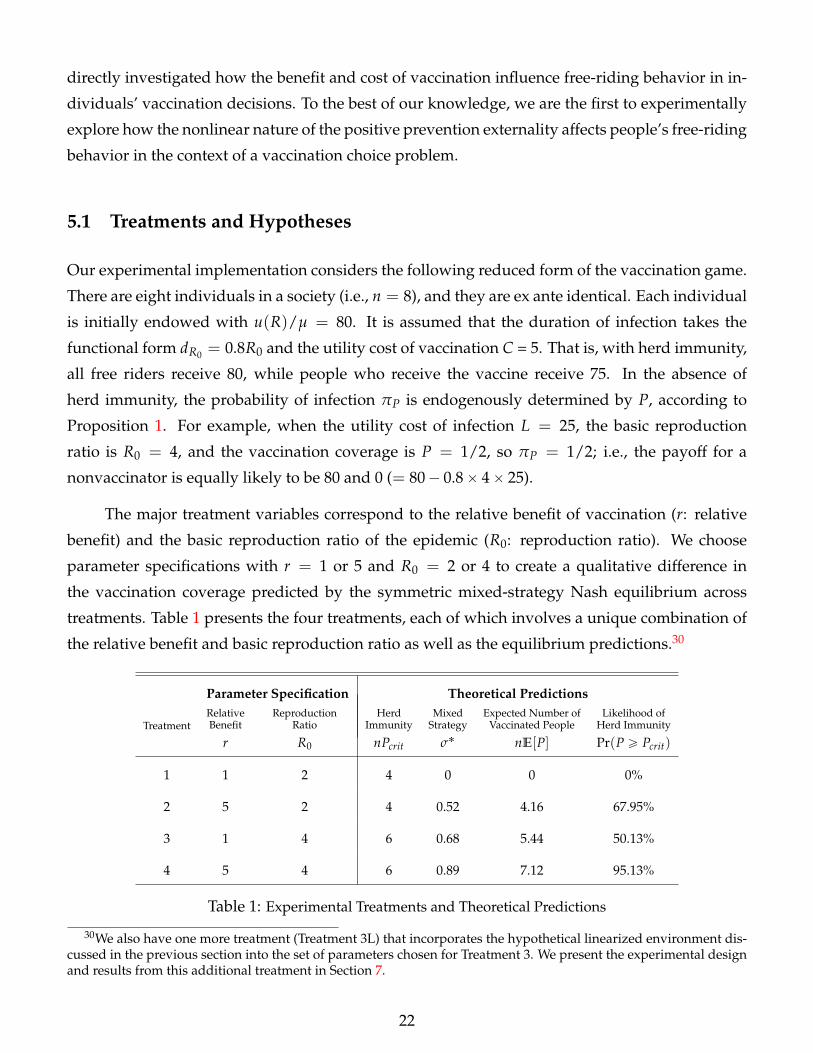
treatments. Table 1 presents the four treatments, each of which involves a unique combination of
the relative benefit and basic reproduction ratio as well as the equilibrium predictions.30
Parameter Specification Theoretical Predictions
TreatmentRelative Reproduction Herd Mixed Expected Number of Likelihood ofBenefit Ratio Immunity Strategy Vaccinated People Herd Immunity
r R0 nPcrit σ˚ nE[P] Pr(P ě Pcrit)
1 1 2 4 0 0 0%
2 5 2 4 0.52 4.16 67.95%
3 1 4 6 0.68 5.44 50.13%
4 5 4 6 0.89 7.12 95.13%
Table 1: Experimental Treatments and Theoretical Predictions
30We also have one more treatment (Treatment 3L) that incorporates the hypothetical linearized environment dis-cussed in the previous section into the set of parameters chosen for Treatment 3. We present the experimental designand results from this additional treatment in Section 7.
22
A unique feature of Treatment 1 is that the reproduction ratio R0 is large relative to the rel-
ative benefit r, indicating that the expected gain from vaccination is dominated by the expected
cost. As a result, no vaccination is predicted. With the three other treatments, however, the indi-
vidual probability of vaccination is positive in the mixed-strategy equilibrium, and the resulting
vaccination coverage for the society reaches the critical level needed for herd immunity in more
than 50% of cases. Thus, we have our first hypothesis as follows.
Hypothesis 1. (a) In Treatment 1, the individual probability of vaccination is not significantly different
from 0, and as a result, the likelihood of herd immunity is not significantly different from 0.
(b) In Treatments 2, 3 and 4, the individual probability of vaccination is significantly higher than 0.
(c) In Treatments 2, 3 and 4, the likelihood of herd immunity is significantly higher than 0.
We next consider whether the endogenous epidemic punishment is effective. Given the
reproduction ratio R0, the higher relative benefit r in Treatment 2 (Treatment 4) than in Treatment
1 (Treatment 3) makes it more likely that an individual vaccinates, and thus, the society achieves
herd immunity in Treatment 2 (Treatment 4) than in Treatment 1 (Treatment 3).
Hypothesis 2. Given a fixed reproduction ratio R0,
(a) the individual likelihood of vaccination is higher in Treatment 2 than in Treatment 1 and higher in
Treatment 4 than in Treatment 3.
(b) the likelihood of herd immunity is higher in Treatment 2 than in Treatment 1 and higher in Treatment
4 than in Treatment 3.
We investigate the effect of the reproduction ratio on individuals’ vaccination choices. Given
the relative benefit r, the higher reproduction ratio R0 in Treatment 3 (Treatment 4) than in Treat-
ment 1 (Treatment 2) makes it more likely for an individual to take vaccination in Treatment 3
(Treatment 4) than in Treatment 1 (Treatment 2).
Hypothesis 3. Given a fixed relative benefit r,
(a) the individual likelihood of vaccination is higher in Treatment 3 than in Treatment 1 and higher in
Treatment 4 than in Treatment 2.
(b) the likelihood of herd immunity is higher in Treatment 3 than in Treatment 1 and higher in Treatment
4 than in Treatment 2.
23
Notably, the predictions from the asymmetric pure-strategy Nash equilibria are invariant to
the changes in the treatment variables. With every treatment, there exists a collection of asym-
metric equilibria in which exactly n ¨ Pcrit players are vaccinated, and the remainder are not. As a
result, the likelihood of herd immunity is expected to be 100% in all four treatments. Our experi-
mental data are informative and enable us to reject this prediction from the asymmetric equilibria.
5.2 Procedures
The experiments were conducted in English at the Hong Kong University of Science and Tech-
nology Experimental Lab using z-Tree (Fischbacher, 2007). A between-subjects design and random-
matching protocol were used. Four sessions were conducted for each of the four treatments, and
each session included twenty-four subjects. Using sessions as independent observation units, we
have four observations for each treatment. A total of 384 subjects with no prior experience with
our experiment were recruited from the undergraduate and graduate populations of the univer-
sity and participated in 16 sessions.31
Upon arrival at the laboratory, subjects were instructed to sit at separate computer terminals.
Each participant was given a copy of the experiment instructions, which were read aloud and
supplemented with slide illustrations. In each session, subjects first participated in one practice
round and then in 20 official rounds.
We illustrate the instructions for Treatment 1. The full instructions can be found in Appendix
D. In each round, a subject was randomly matched with seven other participants to form a group
of eight. In each group, the eight members were asked to make decisions that would affect their
earnings in the round. The participants were randomly rematched after each round to form new
groups.
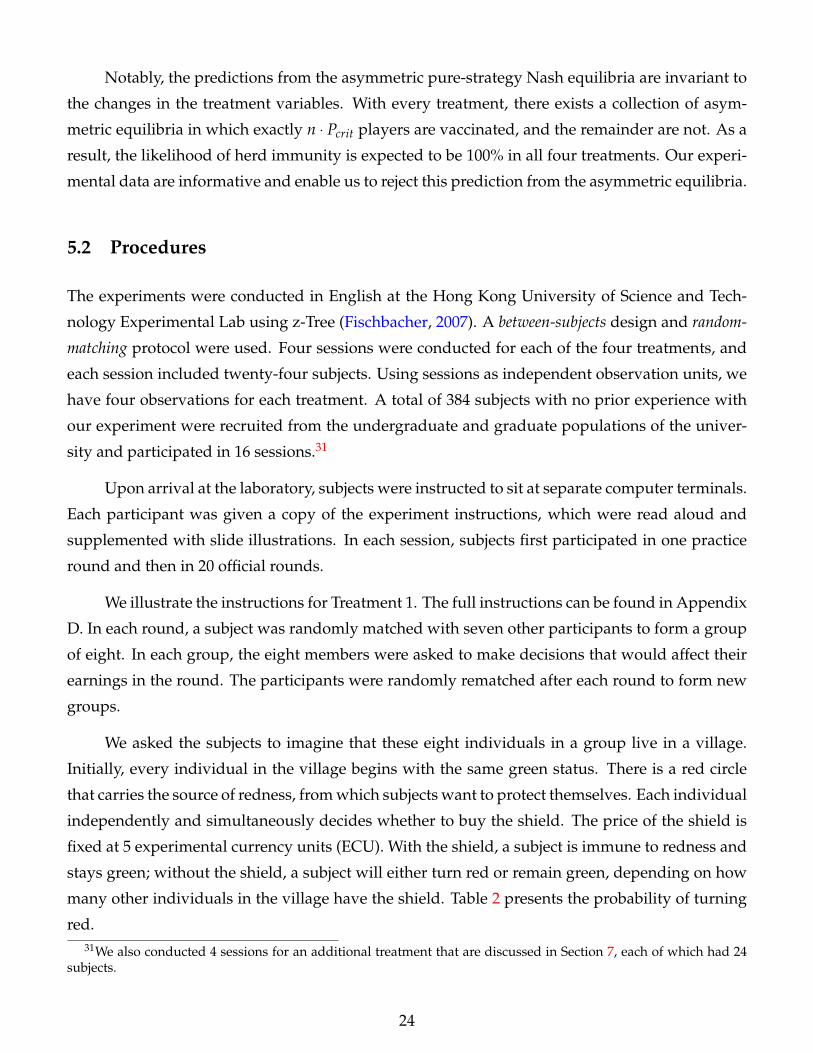
We asked the subjects to imagine that these eight individuals in a group live in a village.
Initially, every individual in the village begins with the same green status. There is a red circle
that carries the source of redness, from which subjects want to protect themselves. Each individual
independently and simultaneously decides whether to buy the shield. The price of the shield is
fixed at 5 experimental currency units (ECU). With the shield, a subject is immune to redness and
stays green; without the shield, a subject will either turn red or remain green, depending on how
many other individuals in the village have the shield. Table 2 presents the probability of turning
red.31We also conducted 4 sessions for an additional treatment that are discussed in Section 7, each of which had 24
subjects.
24
If you choose “No Shield”# of others having the shield Prob. of turning red
0 50.0%1 42.9%2 33.3%3 20.0%4 0.00%5 0.00%6 0.00%7 0.00%
Table 2: Probability that you turn red
The earnings in each round are determined by the ex post status of an individual and by
whether he/she buys the shield. If the individual does not buy the shield but his/her status
remains green, then he/she earns 80 ECU. If his/her status turns red, resulting in the loss of 8
ECU, his/her earnings are 80´ 8 = 72 ECU. If an individual buys the shield, he/she must pay 5
ECU, and his/her status stays green so that he/she earns 80´ 5 = 75 ECU.
We randomly selected one round to determine the subjects’ payments. A subject was paid
the amount of ECU that he/she earned in the selected round at an exchange rate of 10 ECU = 1
HKD. A session lasted for approximately forty-five minutes, and the subjects earned, on average,
HK$109 («US$14), including a HK$30 show-up fee.32
6 Experimental Results
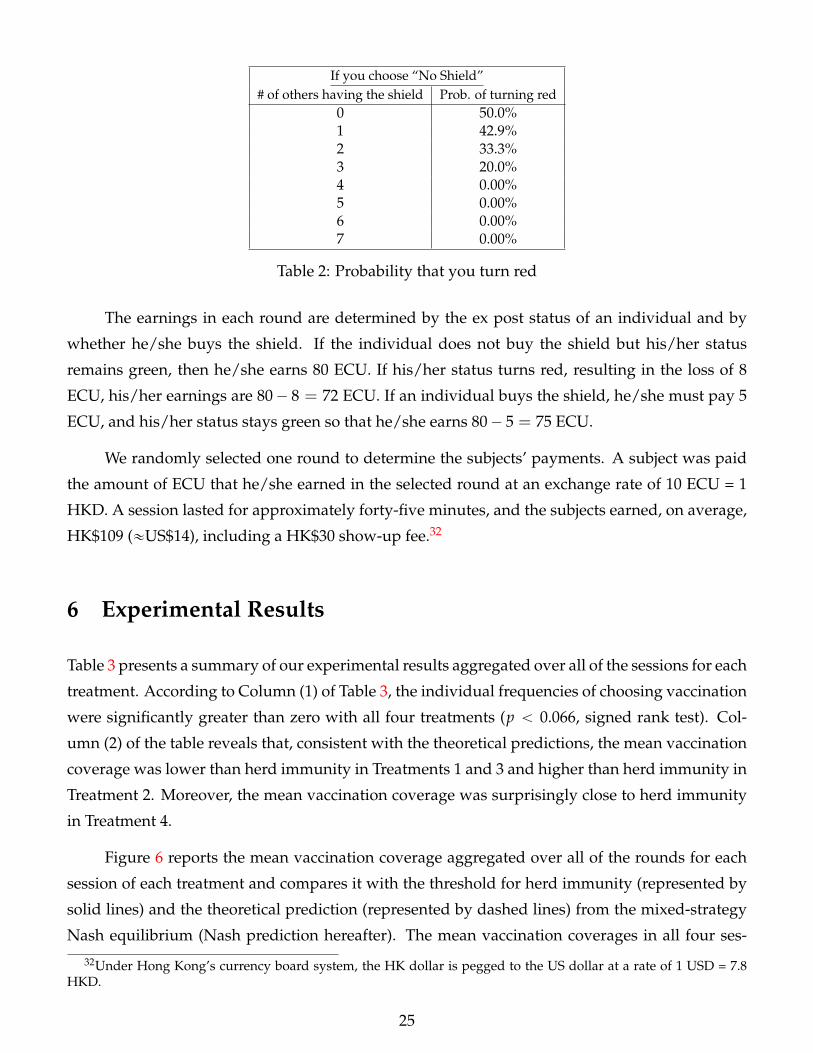
Table 3 presents a summary of our experimental results aggregated over all of the sessions for each
treatment. According to Column (1) of Table 3, the individual frequencies of choosing vaccination
were significantly greater than zero with all four treatments (p ă 0.066, signed rank test). Col-
umn (2) of the table reveals that, consistent with the theoretical predictions, the mean vaccination
coverage was lower than herd immunity in Treatments 1 and 3 and higher than herd immunity in
Treatment 2. Moreover, the mean vaccination coverage was surprisingly close to herd immunity
in Treatment 4.
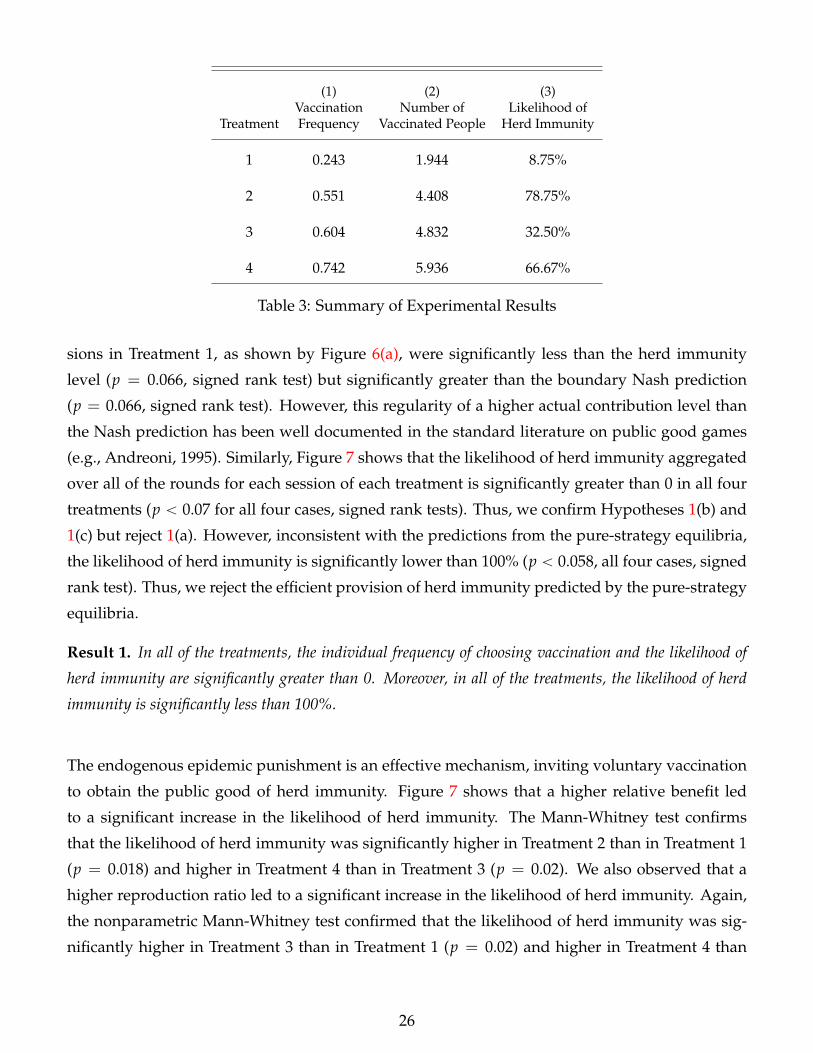
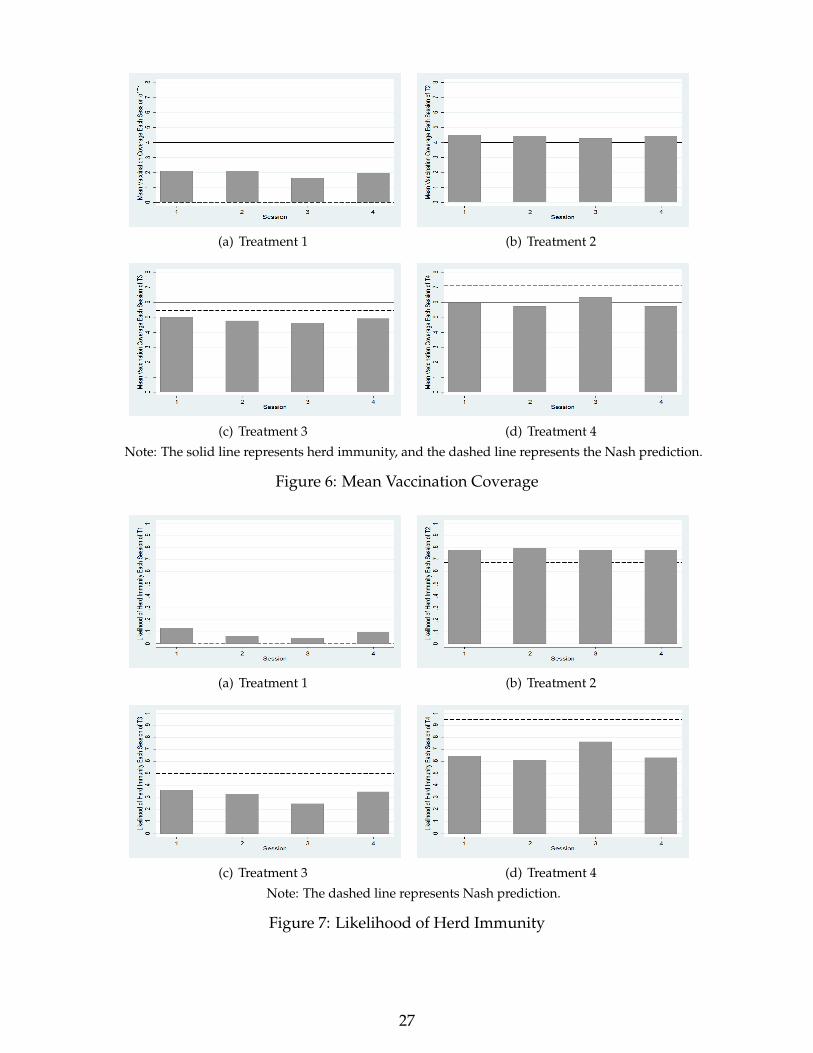
Figure 6 reports the mean vaccination coverage aggregated over all of the rounds for each
session of each treatment and compares it with the threshold for herd immunity (represented by
solid lines) and the theoretical prediction (represented by dashed lines) from the mixed-strategy
Nash equilibrium (Nash prediction hereafter). The mean vaccination coverages in all four ses-
32Under Hong Kong’s currency board system, the HK dollar is pegged to the US dollar at a rate of 1 USD = 7.8HKD.
25
(1) (2) (3)Vaccination Number of Likelihood of
Treatment Frequency Vaccinated People Herd Immunity
1 0.243 1.944 8.75%
2 0.551 4.408 78.75%
3 0.604 4.832 32.50%
4 0.742 5.936 66.67%
Table 3: Summary of Experimental Results
sions in Treatment 1, as shown by Figure 6(a), were significantly less than the herd immunity
level (p = 0.066, signed rank test) but significantly greater than the boundary Nash prediction
(p = 0.066, signed rank test). However, this regularity of a higher actual contribution level than
the Nash prediction has been well documented in the standard literature on public good games
(e.g., Andreoni, 1995). Similarly, Figure 7 shows that the likelihood of herd immunity aggregated
over all of the rounds for each session of each treatment is significantly greater than 0 in all four
treatments (p ă 0.07 for all four cases, signed rank tests). Thus, we confirm Hypotheses 1(b) and
1(c) but reject 1(a). However, inconsistent with the predictions from the pure-strategy equilibria,
the likelihood of herd immunity is significantly lower than 100% (p ă 0.058, all four cases, signed
rank test). Thus, we reject the efficient provision of herd immunity predicted by the pure-strategy
equilibria.
Result 1. In all of the treatments, the individual frequency of choosing vaccination and the likelihood of
herd immunity are significantly greater than 0. Moreover, in all of the treatments, the likelihood of herd
immunity is significantly less than 100%.
The endogenous epidemic punishment is an effective mechanism, inviting voluntary vaccination
to obtain the public good of herd immunity. Figure 7 shows that a higher relative benefit led
to a significant increase in the likelihood of herd immunity. The Mann-Whitney test confirms
that the likelihood of herd immunity was significantly higher in Treatment 2 than in Treatment 1
(p = 0.018) and higher in Treatment 4 than in Treatment 3 (p = 0.02). We also observed that a
higher reproduction ratio led to a significant increase in the likelihood of herd immunity. Again,
the nonparametric Mann-Whitney test confirmed that the likelihood of herd immunity was sig-
nificantly higher in Treatment 3 than in Treatment 1 (p = 0.02) and higher in Treatment 4 than
26
(a) Treatment 1 (b) Treatment 2
(c) Treatment 3 (d) Treatment 4
Note: The solid line represents herd immunity, and the dashed line represents the Nash prediction.
Figure 6: Mean Vaccination Coverage
(a) Treatment 1 (b) Treatment 2
(c) Treatment 3 (d) Treatment 4
Note: The dashed line represents Nash prediction.
Figure 7: Likelihood of Herd Immunity
27
in Treatment 2 (p = 0.018), thus confirming our Hypotheses 2 and 3.33 We have the following
results.
Result 2. Given a fixed reproduction ratio R0, the likelihood of herd immunity was higher in Treatment 2
than in Treatment 1 and higher in Treatment 4 than in Treatment 3. Given a fixed relative benefit r, the
likelihood of herd immunity was higher in Treatment 3 than in Treatment 1 and higher in Treatment 4 than
in Treatment 2.
7 Role of Concavity: Experimental Evidence
In this section, we provide experimental evidence for the role of concavity in enhancing the in-
dividual vaccination uptake likelihood and thus the likelihood of herd immunity. To investigate
this issue, we considered a new, counterfactual treatment, Treatment 3L, a variant of Treatment 3
in which the probability of infection is linearized. Recall that, in Treatment 3, the long-run prob-
ability of infection was nonlinear, as πP = 1 ´ 14(1´P) . In Treatment 3L, we linearized it to be
πLP = 3
4 ´ P.34 There is no other difference between Treatment 3 and Treatment 3L.35
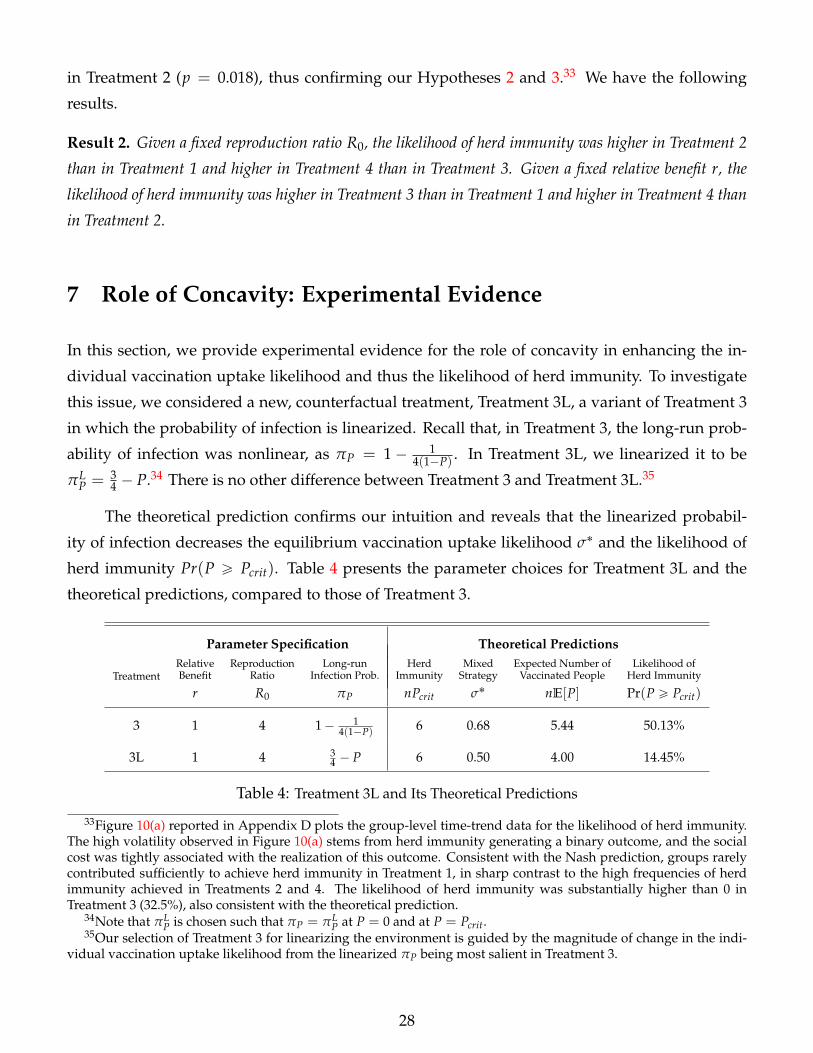
The theoretical prediction confirms our intuition and reveals that the linearized probabil-
ity of infection decreases the equilibrium vaccination uptake likelihood σ˚ and the likelihood of
herd immunity Pr(P ě Pcrit). Table 4 presents the parameter choices for Treatment 3L and the
theoretical predictions, compared to those of Treatment 3.
Parameter Specification Theoretical Predictions
TreatmentRelative Reproduction Long-run Herd Mixed Expected Number of Likelihood ofBenefit Ratio Infection Prob. Immunity Strategy Vaccinated People Herd Immunity
r R0 πP nPcrit σ˚ nE[P] Pr(P ě Pcrit)
3 1 4 1´ 14(1´P) 6 0.68 5.44 50.13%
3L 1 4 34 ´ P 6 0.50 4.00 14.45%
Table 4: Treatment 3L and Its Theoretical Predictions
33Figure 10(a) reported in Appendix D plots the group-level time-trend data for the likelihood of herd immunity.The high volatility observed in Figure 10(a) stems from herd immunity generating a binary outcome, and the socialcost was tightly associated with the realization of this outcome. Consistent with the Nash prediction, groups rarelycontributed sufficiently to achieve herd immunity in Treatment 1, in sharp contrast to the high frequencies of herdimmunity achieved in Treatments 2 and 4. The likelihood of herd immunity was substantially higher than 0 inTreatment 3 (32.5%), also consistent with the theoretical prediction.
34Note that πLP is chosen such that πP = πL
P at P = 0 and at P = Pcrit.35Our selection of Treatment 3 for linearizing the environment is guided by the magnitude of change in the indi-
vidual vaccination uptake likelihood from the linearized πP being most salient in Treatment 3.
28
We conducted four sessions of Treatment 3L, and each session had 24 subjects. The same
experimental procedure was used. A session lasted for approximately 45 minutes, and subjects
earned, on average, HK$105.6 («US$13.5), including a HK$30 show-up fee.
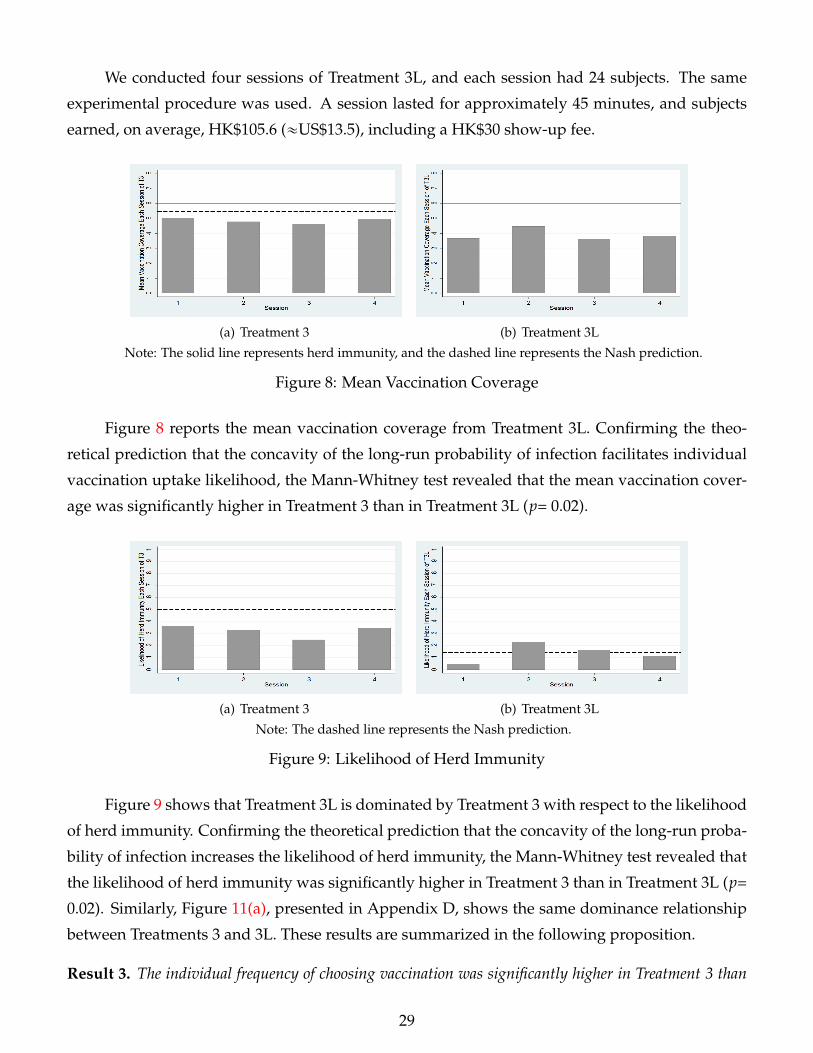
(a) Treatment 3 (b) Treatment 3L
Note: The solid line represents herd immunity, and the dashed line represents the Nash prediction.
Figure 8: Mean Vaccination Coverage
Figure 8 reports the mean vaccination coverage from Treatment 3L. Confirming the theo-
retical prediction that the concavity of the long-run probability of infection facilitates individual
vaccination uptake likelihood, the Mann-Whitney test revealed that the mean vaccination cover-
age was significantly higher in Treatment 3 than in Treatment 3L (p= 0.02).
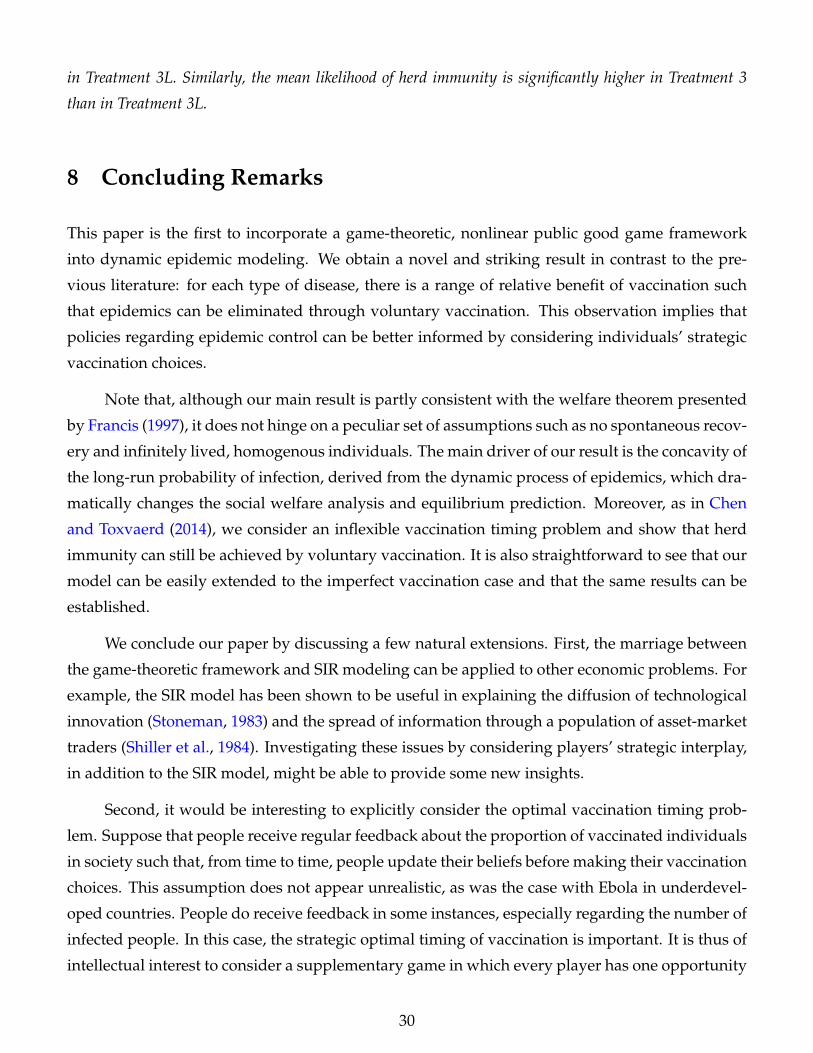
(a) Treatment 3 (b) Treatment 3L
Note: The dashed line represents the Nash prediction.
Figure 9: Likelihood of Herd Immunity
Figure 9 shows that Treatment 3L is dominated by Treatment 3 with respect to the likelihood
of herd immunity. Confirming the theoretical prediction that the concavity of the long-run proba-
bility of infection increases the likelihood of herd immunity, the Mann-Whitney test revealed that
the likelihood of herd immunity was significantly higher in Treatment 3 than in Treatment 3L (p=
0.02). Similarly, Figure 11(a), presented in Appendix D, shows the same dominance relationship
between Treatments 3 and 3L. These results are summarized in the following proposition.
Result 3. The individual frequency of choosing vaccination was significantly higher in Treatment 3 than
29
in Treatment 3L. Similarly, the mean likelihood of herd immunity is significantly higher in Treatment 3
than in Treatment 3L.
8 Concluding Remarks
This paper is the first to incorporate a game-theoretic, nonlinear public good game framework
into dynamic epidemic modeling. We obtain a novel and striking result in contrast to the pre-
vious literature: for each type of disease, there is a range of relative benefit of vaccination such
that epidemics can be eliminated through voluntary vaccination. This observation implies that
policies regarding epidemic control can be better informed by considering individuals’ strategic
vaccination choices.
Note that, although our main result is partly consistent with the welfare theorem presented
by Francis (1997), it does not hinge on a peculiar set of assumptions such as no spontaneous recov-
ery and infinitely lived, homogenous individuals. The main driver of our result is the concavity of
the long-run probability of infection, derived from the dynamic process of epidemics, which dra-
matically changes the social welfare analysis and equilibrium prediction. Moreover, as in Chen
and Toxvaerd (2014), we consider an inflexible vaccination timing problem and show that herd
immunity can still be achieved by voluntary vaccination. It is also straightforward to see that our
model can be easily extended to the imperfect vaccination case and that the same results can be
established.
We conclude our paper by discussing a few natural extensions. First, the marriage between
the game-theoretic framework and SIR modeling can be applied to other economic problems. For
example, the SIR model has been shown to be useful in explaining the diffusion of technological
innovation (Stoneman, 1983) and the spread of information through a population of asset-market
traders (Shiller et al., 1984). Investigating these issues by considering players’ strategic interplay,
in addition to the SIR model, might be able to provide some new insights.
Second, it would be interesting to explicitly consider the optimal vaccination timing prob-
lem. Suppose that people receive regular feedback about the proportion of vaccinated individuals
in society such that, from time to time, people update their beliefs before making their vaccination
choices. This assumption does not appear unrealistic, as was the case with Ebola in underdevel-
oped countries. People do receive feedback in some instances, especially regarding the number of
infected people. In this case, the strategic optimal timing of vaccination is important. It is thus of
intellectual interest to consider a supplementary game in which every player has one opportunity
30

to vaccinate and in which he/she chooses when to obtain the vaccine as the epidemic spreads. We
leave these extensions for future research.
31
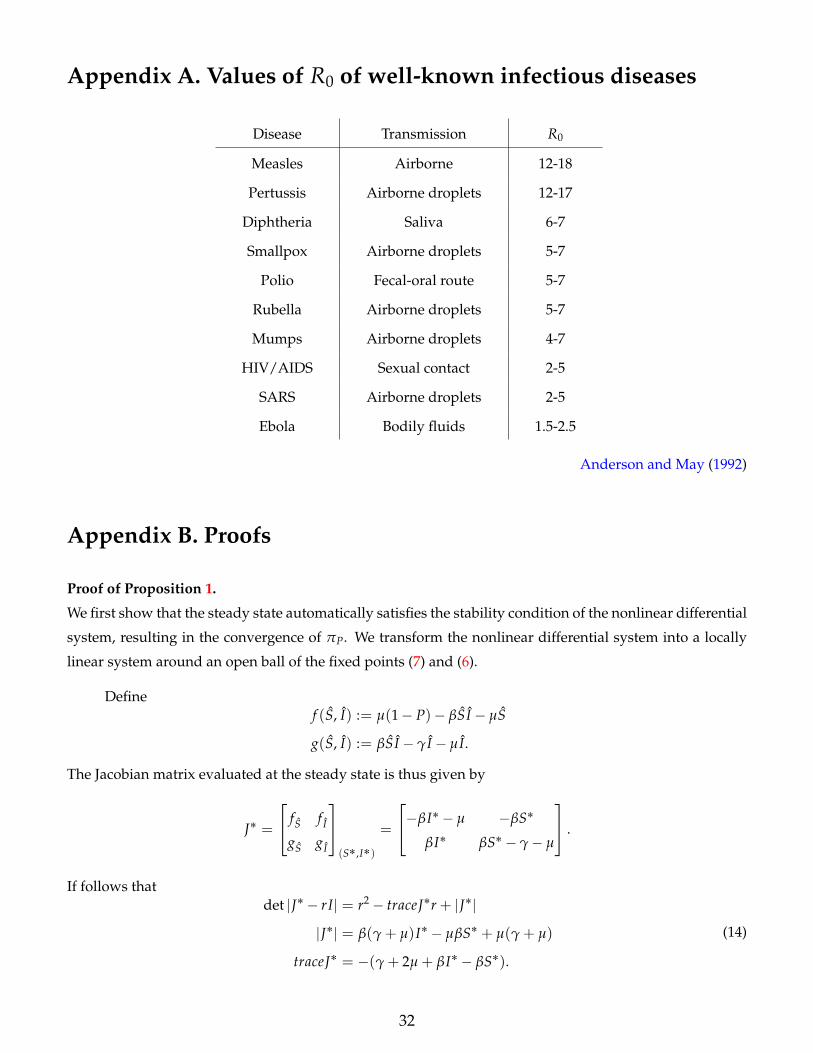
Appendix A. Values of R0 of well-known infectious diseases
Disease Transmission R0
Measles Airborne 12-18
Pertussis Airborne droplets 12-17
Diphtheria Saliva 6-7
Smallpox Airborne droplets 5-7
Polio Fecal-oral route 5-7
Rubella Airborne droplets 5-7
Mumps Airborne droplets 4-7
HIV/AIDS Sexual contact 2-5
SARS Airborne droplets 2-5
Ebola Bodily fluids 1.5-2.5
Anderson and May (1992)
Appendix B. Proofs
Proof of Proposition 1.
We first show that the steady state automatically satisfies the stability condition of the nonlinear differential
system, resulting in the convergence of πP. We transform the nonlinear differential system into a locally
linear system around an open ball of the fixed points (7) and (6).
Definef (S, I) := µ(1´ P)´ βS I ´ µS
g(S, I) := βS I ´ γ I ´ µ I.
The Jacobian matrix evaluated at the steady state is thus given by
J˚ =
fS f I
gS g I
(S˚,I˚)
=
´βI˚ ´ µ ´βS˚
βI˚ βS˚ ´ γ´ µ
.
If follows thatdet |J˚ ´ rI| = r2 ´ traceJ˚r + |J˚|
|J˚| = β(γ + µ)I˚ ´ µβS˚ + µ(γ + µ)
traceJ˚ = ´(γ + 2µ + βI˚ ´ βS˚).
(14)
32
The characteristic roots of the equation
det|J˚ ´ rI| = 0,
thus have the following relations
r1 + r2 = traceJ˚
r1r2 = |J˚|.(15)
We proceed to proof by cases:
• Herd Immunity Case: P ě Pcrit.
Substitute R0 = βγ+µ and rearrange the inequality, we have
γ + µ´ β(1´ P) ą 0. (16)
Note that the steady state 6 gives us S˚ = 1´ P, I˚ = 0, which implies
|J˚| ą 0 and traceJ˚ ă 0. (17)
It follows that
r1 ă 0, r2 ă 0.
• Under-provision Case: P ă Pcrit.
Substitute R0 = βγ+µ and rearrange the inequality, we have
β(1´ P)´ (γ + µ) ą 0. (18)
Note that the steady state 7 gives us S˚ = 1R0
, I˚ = µγ+µ (1´ P)´ µ
β , which implies
|J˚| ą 0 and traceJ˚ ă 0. (19)
It follows that
r1 ă 0, r2 ă 0.
From the stability theorem of system of differential equations, a fixed point of a first-order nonhomoge-
neous linear system with two variables is locally asymptotically stable if and only if the eigenvalues have
negative real parts (i.e., r1 ă 0, r2 ă 0). Therefore, the steady state of the nonlinear differential system is
locally asymptotically stable for any P P [0, 1]. When r1 and r2 are real, the steady state is a stable node.
When r1 and r2 are complex, the steady state is a stable focus, establishing the dynamic stability of the
epidemic.
33
At the steady state, we have
πP = limtÑ8
βS IβS I + µS
=βS˚ I˚
βS˚ I˚ + µS˚= 1´
1R0(1´ P)
when P ă Pcrit
πP = limtÑ8
βS IβS I + µS
=βS˚ I˚
βS˚ I˚ + µS˚= 0 when P ě Pcrit.
(20)
The uniqueness of πP can be easily shown by contradiction.
When P ă Pcrit, calculating a partial derivative of πP w.r.t. P gives us
BπP
BP= ´
1R0(1´ P)2 ă 0. (21)
It follows that the maximum of πP is obtained when P takes the value of its lower bound 0. This step
completes the proof.
Characterization of All Nash Equilibria
The following proposition characterizes the set of pure-strategy equilibrium outcomes.
Proposition 7. For k = 0, 1, . . . , νcrit´ 1, ν = k + 1 is the pure strategy equilibrium outcome for CdR0 L P (πk+1, πk].
Proof. For any i P V(b), he/she has no incentive to deviate because C ď dR0 Lπk; for any i R V(b), he/she
has no incentive to deviate because C ą dR0 Lπk+1. ν ă k + 1 cannot arise in pure strategy equilibrium
because some i R V(b) can always be better off by accepting vaccination. ν ą k + 1 cannot arise in pure
strategy equilibrium because some i P V(b) can always be better off by not accepting vaccination. Finally,
note that ν ą νcrit cannot arise in equilibrium because the infection probability vanishes.
In what follows, we offer a general characterization of all mixed-strategy equilibria and derive Propo-
sition 3 as a corollary.
Proof of Proposition 3.
Let M be the set of players using mixed strategies, and |M| = m. A mixed-strategy Nash equilibrium
requires that every player inM is indifferent between vaccination and nonvaccination, i.e.,
EUi(vc, σ˚´i) = EUi(nv, σ˚´i) for any i PM. (22)
It follows that
1µ
u(R)´ C =1µ
u(S)´ dR0 LE[πP(σ)].
where E[πP(σ)] denotes the expected infection probability given ν = k. Note that the additional vaccination
arising from mixed-strategy follows the Poisson binomial distribution with success probabilities σ´i, we
34
obtain
CdR0 L
=m´1ÿ
k=0
πν+k
ÿ
VPP(M´i ;k)
ź
jPV
σjź
lPM´i/V
(1´ σl) (23)
for any i PM. Consider this system of equations (characterizing the indifference conditions for the players
in setM) where ν ď mintνcrit ´ 1, n´mu; we claim that, for any mixed strategy equilibria with m ą 1, the
mixed-strategy profile σ is unique as shown by the following two lemmas.
Lemma 1. There exists a solution to (23) for CdR0 L P (πν+m´1, πν) s.t. σi = σ˚ for any i PM.
Proof. The system (23) reduces to
CdR0 L
=m´1ÿ
k=0
πν+k
(m´ 1
k
)σ˚k(1´ σ˚)m´1´k. (24)
By the intermediate value theorem, there exists σ˚ P (0, 1) such that the above equation holds.
Lemma 2. (23) has at most one solution.
Proof. Define vector-valued function H : [0, 1]n Ñ IRn where every component function
Hi := dR0rσi
m´1ÿ
k=0
πν+kÿ
VPP(M´i ;k)
ź
jPV
σjź
lPM´i/V
(1´ σl).
It is easy to check that H is continuously differentiable on (0, 1)n. The system of equations (23) is equivalent
to σi = Hi(σ) for all i P N . Suppose there exist two solutions σ˚ and σ1 such that }σ˚ ´ σ1} ą 0. By mean
value inequality (Rudin, 1976), we have
}σ˚ ´ σ1} = }H(σ˚)´ H(σ1)} ď }DH(ξ)} ¨ }σ˚ ´ σ1} (25)
where ξ P (0, 1)n and DH(ξ) is the Jacobian matrix evaluated at ξ. Since the row vectors of DH(ξ) are
linearly dependent, DH(ξ) is not invertible and thus }DH(ξ)} = 0. It follows that }σ˚ ´ σ1} ď 0. This
outcome requires a contradiction.
Combining the two lemmas, we reach the conclusion that, in any mixed strategy equilibrium with m ą 1,
mixing probabilities must be unique and identical across players. The next proposition characterizes all the
mixed-strategy equilibria for m ą 1,
Proposition 8. For m ą 1 and ν ď mintνcrit ´ 1, n´mu, xν, my arises as a mixed strategy equilibrium outcome
35
for CdR0 L P (πν+m´1, πν) with σ = σ˚ and is uniquely determined by
CdR0 L
=m´1ÿ
k=0
πν+k
(m´ 1
k
)σ˚k(1´ σ˚)m´1´k. (26)
Proof. (26) implies the best response of any i P M. Any i P V(b) has no incentive to deviate since
his/her incentive constraint C ă dR0 LE[πk´1] can be simplified using (26) as
CdR0 L
ă σm´1πν+m´2 + (1´ σ)m´1πν´1,
which holds under CdR0 L P (πν+m´1, πν). Any i R V(b) has no incentive to deviate since his/her incentive
constraint C ą dR0 LE[πP(σ)] can be simplified using (26) as
CdR0 L
ą σm´1πν+m + (1´ σ)m´1πν+1,
which again holds under CdR0 L P (πν+m´1, πν).
It follows from this more general proposition that there exists a unique totally mixed strategy equi-
librium, where m = n,
Corollary 2. There exists a unique totally mixed strategy equilibrium, where σ˚i = σ˚, and it is implicitly defined
by1
dR0r=
νcritÿ
k=0
(1´
1R0´
kn
)(nk
)σ˚k(1´ σ˚)n´1´k. (27)
This step completes the proof.
Proof of Proposition 4.
Let ν and ν1 be the equilibrium number of vaccinated people given the relative benefit r and r1, respectively.
For future use, denote Fν(x) as the CDF of a random variable ν. We start by working directly with σ, as
shown in the following lemma.
Lemma 3. ν FOSD ν1 if and only if σ ą σ1.
Proof. ν FOSD ν1 if and only if Fν(x) ď Fν1(x) for any x P t1, . . . , nu. Since both ν and ν1 follows
36
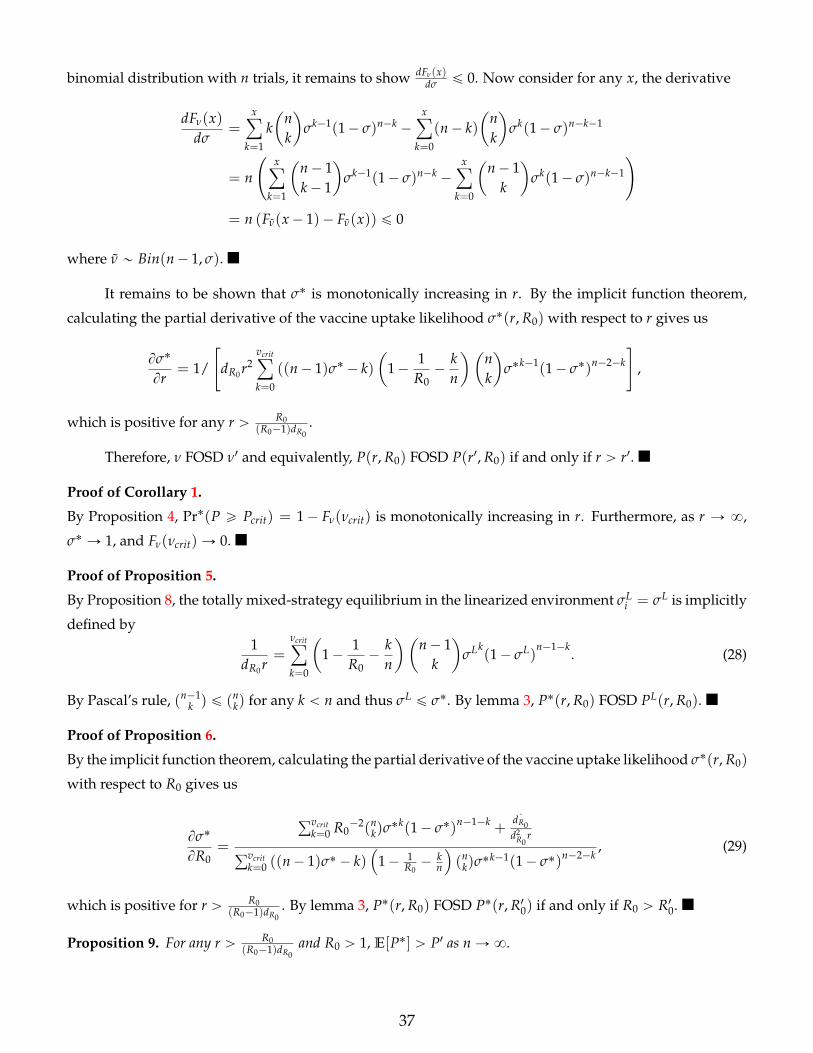
binomial distribution with n trials, it remains to show dFν(x)dσ ď 0. Now consider for any x, the derivative
dFν(x)dσ
=x
ÿ
k=1
k(
nk
)σk´1(1´ σ)n´k ´
xÿ
k=0
(n´ k)(
nk
)σk(1´ σ)n´k´1
= n
(x
ÿ
k=1
(n´ 1k´ 1
)σk´1(1´ σ)n´k ´
xÿ
k=0
(n´ 1
k
)σk(1´ σ)n´k´1
)= n (Fν(x´ 1)´ Fν(x)) ď 0
where ν „ Bin(n´ 1, σ).
It remains to be shown that σ˚ is monotonically increasing in r. By the implicit function theorem,
calculating the partial derivative of the vaccine uptake likelihood σ˚(r, R0) with respect to r gives us
Bσ˚
Br= 1/
[dR0r2
vcritÿ
k=0
((n´ 1)σ˚ ´ k)(
1´1
R0´
kn
)(nk
)σ˚k´1(1´ σ˚)n´2´k
],
which is positive for any r ą R0(R0´1)dR0
.
Therefore, ν FOSD ν1 and equivalently, P(r, R0) FOSD P(r1, R0) if and only if r ą r1.
Proof of Corollary 1.
By Proposition 4, Pr˚(P ě Pcrit) = 1´ Fν(νcrit) is monotonically increasing in r. Furthermore, as r Ñ 8,
σ˚ Ñ 1, and Fν(νcrit)Ñ 0.
Proof of Proposition 5.
By Proposition 8, the totally mixed-strategy equilibrium in the linearized environment σLi = σL is implicitly
defined by1
dR0r=
νcritÿ
k=0
(1´
1R0´
kn
)(n´ 1
k
)σLk
(1´ σL)n´1´k
. (28)
By Pascal’s rule, (n´1k ) ď (n
k) for any k ă n and thus σL ď σ˚. By lemma 3, P˚(r, R0) FOSD PL(r, R0).
Proof of Proposition 6.
By the implicit function theorem, calculating the partial derivative of the vaccine uptake likelihood σ˚(r, R0)
with respect to R0 gives us
Bσ˚
BR0=
řvcritk=0 R0
´2(nk)σ
˚k(1´ σ˚)n´1´k +˙dR0
d2R0
rřvcrit
k=0 ((n´ 1)σ˚ ´ k)(
1´ 1R0´ k
n
)(n
k)σ˚k´1(1´ σ˚)n´2´k
, (29)
which is positive for r ą R0(R0´1)dR0
. By lemma 3, P˚(r, R0) FOSD P˚(r, R10) if and only if R0 ą R10.
Proposition 9. For any r ą R0(R0´1)dR0
and R0 ą 1, E[P˚] ą P1 as n Ñ8.
37

Proof. In the totally mixed-strategy equilibrium, letting n approach infinity, we have for any i,
1µ
ui(R)´ Ci =1µ
ui(S)´ dR0 LiE[πP].
where the expectation is over a Poisson distribution with mean σ. By Markov’s inequality, it follows that,
for any σ P (0, 1],
E[πP] ě σ Pr[πP ě σ] = σ Pr[1´1
R0(1´ P)ě σ] = σF
(1´
1R0(1´ σ)
).
Note that, for any σ P (0, 1],
σF(
1´1
R0(1´ σ)
)ě 1´
1R0(1´ σ)
.
Define the function
h(σ) := e1´σ´ 1R0(1´σ)
(σ
1´ 1R0(1´σ)
)2´ 1R0(1´σ)
.
By Chernoff’s formula, it is equivalent to show that h(σ) ą 1 on (0, 1], which follows from h(0) ą 1 and
h(¨) being continuous and increasing in σ. Now, by the definition of the market equilibrium, we have
1µ
ui(S)´ dR0 LiπP1 =1µ
ui(S)´ dR0 LiE[πP] ă1µ
ui(S)´ dR0 LiπE[P].
since P1 ă Pcrit and πP is decreasing in P, we have E[P] ą P1 as n Ñ8.
38
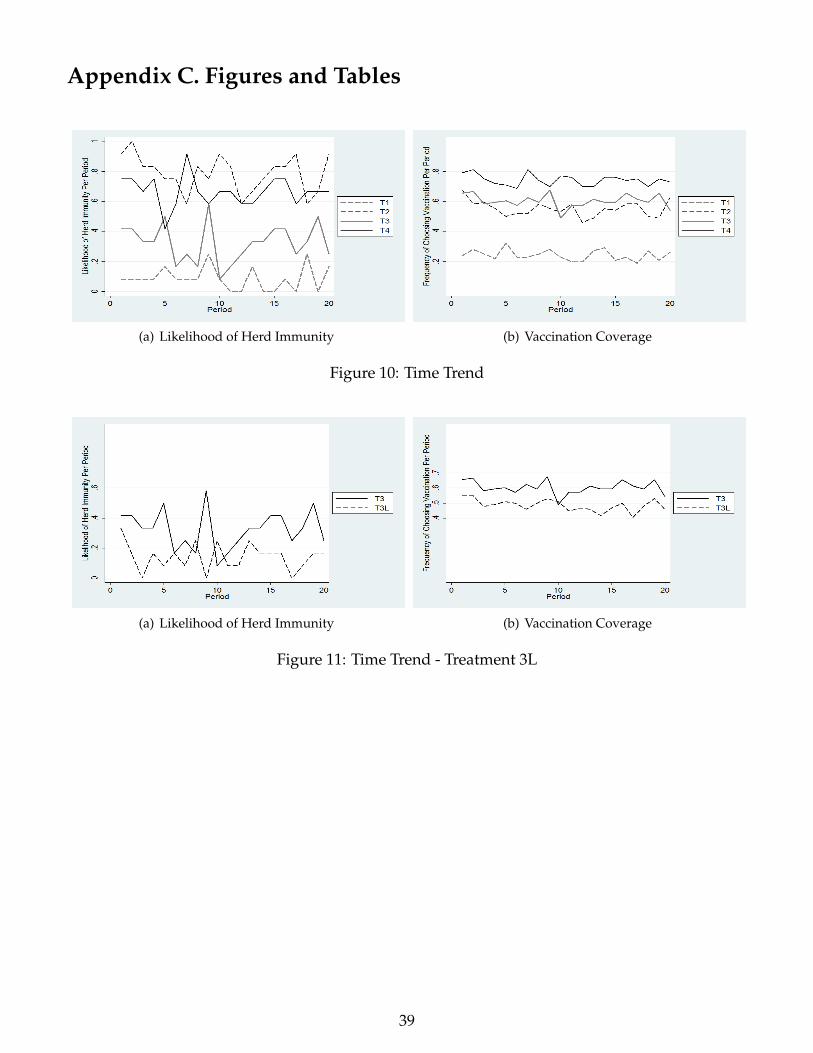
Appendix C. Figures and Tables
(a) Likelihood of Herd Immunity (b) Vaccination Coverage
Figure 10: Time Trend
(a) Likelihood of Herd Immunity (b) Vaccination Coverage
Figure 11: Time Trend - Treatment 3L
39

Appendix D. For Online Publication: Experimental Instructions –
Treatment 1
INSTRUCTION
Welcome to the experiment. This experiment studies decision making in groups of eight individuals. In
the following two hours or less, you will participate in 20 rounds of decision making. Please read the
instructions below carefully; the cash payment that you will receive at the end of the experiment depends
on how well you make your decisions according to these instructions. If you have a question at any point,
please raise your hand and wait for one of us to come over. We will then privately answer your question.
We ask that you turn off your mobile phone and any other electronic devices. Communication of any kind
with the other participants is not allowed.
Your Group
In each and every round, you will be randomly matched with seven other participants to form a group of
eight. You will not be told the identity of the participants with whom you are matched, nor will these
participants be told your identity—even after the end of the experiment. In each group, eight members
are required to make decisions that will affect their earnings in the round. Participants will be randomly
rematched after each round to form new groups.
Your Decision
Figure 12: Screen Shot – Your Decision
There are eight individuals (including yourself) in your group. Suppose that these eight individuals
are living in a village. Initially, every individual in the village begins with the same status of green. Figure
12 illustrates this situation. The green circle at the center represents yourself, and the other seven black
circles represent other individuals in the village. The red circle carries the source of redness from which
you want to protect yourself.
40

The only way for you to protect yourself from the redness is to purchase a shield. With the shield, you
will be immune to the redness and stay green; Without the shield, you will either turn red or remain green.
Without the shield, the chance of your turning ted depends on how many other individuals in the village
have the shield. Table 5 below (or the table at the top-right corner of Figure 12) presents the probability of
turning red. Note that, when four individuals or more in your village choose to buy the shield, everyone
will stay green regardless of whether he/she buys the shield or not.
If you choose “No Shield”# of others having the shield Chance of your turning red
0 50.0%1 42.9%2 33.3%3 20.0%4 0.00%5 0.00%6 0.00%7 0.00%
Table 5: Probability of your turning red
Each individual independently and simultaneously decides whether to buy the shield or not. You
will be prompted to make your decision by clicking one of the two buttons, “Shield” and “No Shield,”
presented at the bottom of your screen. Once you click one of the buttons, your decision in the round is
completed.
Your Earnings
Your earning in each round depends on: 1) whether or not you buy the shield; and 2) your status. Ta-
ble 6 below summarizes your earnings, in which the earnings are expressed in terms of the experimental
currency units (ECU).
Your decision Shield No ShieldYour status Green Green RedYour earning 75 80 72
Table 6: Your Earnings
Information Feedback
At the end of each round, the computer will provide a summary for the round: your decision (Shield or
No Shield), your final status (Green or Red), your earnings, and the number of people having the shield in
your group.
Your Cash Payment
The experimenter randomly selects 1 round to calculate your cash payment. Each round has an equal
chance of being selected (so it is in your best interest to consider each round seriously.) Your final cash
payment will be your earnings (1 ECU = 1 HKD) in the selected round, plus a HK$30 show-up fee.
41

Practice Rounds
To ensure your understanding of the instructions, we will provide you with a quiz and a practice round.
We will go through the quiz after you answer it on your own. You will then participate in 1 practice round.
The practice round is part of the instructions that are not relevant to your cash payment; its objective is to
familiarize you with the computer interface and the flow of the decisions in each round. Once the practice
round is over, the computer will tell you “The official rounds begin now!”
Administration
Your decisions, as well as your monetary payment, will be kept confidential. Remember that you must
make your decisions entirely on your own; please do not discuss your decisions with any of the other
participants. Upon finishing the experiment, you will receive your cash payment. You will be asked to sign
your name to acknowledge your receipt of the payment (which will not be used for tax purposes). You are
then free to leave. If you have any questions, please raise your hand now. We will answer your questions
individually. If there are no questions, we will proceed to the quiz.
Quiz
1. True or False: I will be matched with the same seven other players in all 20 rounds.
2. True or False: I will turn red for sure if I do not have the shield.
3. Suppose that you decide to buy the shield. Calculate your earnings.
4. Suppose that you decide not to buy the shield. It turns out that there are five other individuals in
your group who buy the shield. Calculate your earnings.
5. Suppose that you decide not to buy the shield. It turns out that there are two other individuals in
your group who buy the shield. What is the chance of your turning red?
42
References
Anderson, Roy M and Robert M May, Infectious diseases of humans: dynamics and control, Vol. 28, Wiley
Online Library, 1992.
Andreoni, James, “Cooperation in public-goods experiments: kindness or confusion?,” The American Eco-nomic Review, 1995, pp. 891–904.
Bagnoli, Mark and Michael McKee, “Voluntary contribution games: Efficient private provision of public
goods,” Economic Inquiry, 1991, 29 (2), 351–366.
Barrett, Scott, “Global disease eradication,” Journal of the European Economic Association, 2003, 1 (2-3), 591–
600.
Bauch, Chris T and David JD Earn, “Vaccination and the theory of games,” Proceedings of the NationalAcademy of Sciences of the United States of America, 2004, 101 (36), 13391–13394.
Boulier, Bryan L, Tejwant S Datta, and Robert S Goldfarb, “Vaccination externalities,” The BE Journal ofEconomic Analysis & Policy, 2007, 7 (1).
Bracha, Anat, Michael Menietti, and Lise Vesterlund, “Seeds to succeed?: Sequential giving to public
projects,” Journal of Public Economics, 2011, 95 (5), 416–427.
Brito, Dagobert L, Eytan Sheshinski, and Michael D Intriligator, “Externalities and compulsary vaccina-
tions,” Journal of Public Economics, 1991, 45 (1), 69–90.
Cambridge Dictionary, “Cambridge dictionaries online,” 2015.
Casari, Marco and Charles R Plott, “Decentralized management of common property resources: experi-
ments with a centuries-old institution,” Journal of Economic Behavior & Organization, 2003, 51 (2), 217–247.
Cason, Timothy N and Lata Gangadharan, “Promoting cooperation in nonlinear social dilemmas through
peer punishment,” Experimental Economics, 2015, 18 (1), 66–88.
Chen, Frederick and Flavio Toxvaerd, “The economics of vaccination,” Journal of theoretical biology, 2014,
363, 105–117.
Diekmann, Andreas, “Volunteer’s dilemma,” Journal of Conflict Resolution, 1985, pp. 605–610.
Dixit, Avinash and Mancur Olson, “Does voluntary participation undermine the Coase Theorem?,” Journalof Public Economics, 2000, 76 (3), 309–335.
Draief, Moez and Laurent Massoulie, “Epidemics and rumours in complex networks, volume 369 of Lon-
don Mathematical Society Lecture Notes,” Cambridge University Press, Cambridge, 2010, 1 (52), 103.
Farrell, Joseph and Garth Saloner, “Standardization, compatibility, and innovation,” The RAND Journal ofEconomics, 1985, pp. 70–83.
43
Fischbacher, Urs, “z-Tree: Zurich toolbox for ready-made economic experiments,” Experimental economics,
2007, 10 (2), 171–178.
Francis, Peter J, “Dynamic epidemiology and the market for vaccinations,” Journal of Public Economics, 1997,
63 (3), 383–406.
Galeotti, Andrea and Brian W Rogers, “Strategic Immunization and Group Structure,” American EconomicJournal: Microeconomics, 2013, 5 (2), 1–32.
Geoffard, Pierre-Yves and Tomas Philipson, “Disease eradication: private versus public vaccination,” TheAmerican Economic Review, 1997, pp. 222–230.
Gersovitz, Mark and Jeffrey S Hammer, “The Economical Control of Infectious Diseases,” The EconomicJournal, 2004, 114 (492), 1–27.
Goeree, Jacob K and Charles A Holt, “An explanation of anomalous behavior in binary-choice games:
Entry, voting, public goods, and the volunteers dilemma,” Unpublished paper, University of Virginia, 2000.
Goeree, Jacob K., Charles A. Holt, and Angela M. Smith, “An experimental examination of the volunteer’s
dilemma,” Games and Economic Behavior, 2017, 102, 303 – 315.
Heal, Geoffrey and Howard Kunreuther, “The vaccination game,” Risk Management and Decision ProcessesCenter Working Paper, 2005, (05-10).
Ibuka, Yoko, Meng Li, Jeffrey Vietri, Gretchen B Chapman, and Alison P Galvani, “Free-riding behavior
in vaccination decisions: An experimental study,” PloS one, 2014, 9 (1), e87164.
Isaac, R Mark and James M Walker, “Nash as an organizing principle in the voluntary provision of public
goods: Experimental evidence,” Experimental Economics, 1998, 1 (3), 191–206.
Jackson, Matthew O, Social and economic networks, Princeton university press, 2010.
Just, Winfried, Hannah Callender, M Drew LaMar, and R Robeva, “Disease transmission dynamics on
networks: Network structure vs. disease dynamics,” Algebraic and Discrete Mathematical Methods for Mod-ern Biology, 2015, pp. 217–235.
Katz, Michael L and Carl Shapiro, “Network externalities, competition, and compatibility,” The Americaneconomic review, 1985, 75 (3), 424–440.
Keeling, Matt J and Pejman Rohani, Modeling infectious diseases in humans and animals, Princeton University
Press, 2008.
Kermack, William O and Anderson G McKendrick, “A contribution to the mathematical theory of epi-
demics,” in “Proceedings of the Royal Society of London A: Mathematical, Physical and Engineering
Sciences,” Vol. 115 The Royal Society 1927, pp. 700–721.
Keser, Claudia, “Voluntary contributions to a public good when partial contribution is a dominant strat-
egy,” Economics Letters, 1996, 50 (3), 359–366.
44
Kretzschmar, Mirjam and Martina Morris, “Measures of concurrency in networks and the spread of infec-
tious disease,” Mathematical biosciences, 1996, 133 (2), 165–195.
Kureishi, Wataru, “Partial vaccination programs and the eradication of infectious diseases,” EconomicsBulletin, 2009, 29 (4), 2758–2769.
Laury, Susan K, James M Walker, and Arlington W Williams, “The voluntary provision of a pure public
good with diminishing marginal returns,” Public Choice, 1999, 99 (1), 139–160.
Laxminarayan, Ramanan, Anne J Mills, Joel G Breman, Anthony R Measham, George Alleyne, MariamClaeson, Prabhat Jha, Philip Musgrove, Jeffrey Chow, Sonbol Shahid-Salles et al., “Advancement of
global health: key messages from the Disease Control Priorities Project,” The Lancet, 2006, 367 (9517),
1193–1208.
Mas-Colell, Andreu, Michael Dennis Whinston, Jerry R Green et al., Microeconomic theory, Oxford uni-
versity press New York, 1995.
Ostrom, Elinor, Roy Gardner, and James Walker, Rules, games, and common-pool resources, University of
Michigan Press, 1994.
Palfrey, Thomas R and Howard Rosenthal, “Participation and the provision of discrete public goods: a
strategic analysis,” Journal of public Economics, 1984, 24 (2), 171–193.
Pastor-Satorras, Romualdo and Alessandro Vespignani, “Epidemic dynamics and endemic states in com-
plex networks,” Phys. Rev. E, May 2001, 63, 066117.
and , “Epidemic spreading in scale-free networks,” Physical review letters, 2001, 86 (14), 3200.
and , “Immunization of complex networks,” Physical review letters, Feb 2002, 65, 036104.
Reuben, Ernesto and Arno Riedl, “Enforcement of contribution norms in public good games with hetero-
geneous populations,” Games and Economic Behavior, 2013, 77 (1), 122–137.
Rosenthal, Robert W, “Sequences of games with varying opponents,” Econometrica: Journal of the Economet-ric Society, 1979, pp. 1353–1366.
Rudin, Walter, “Principles of Mathematical Analysis,” 1976.
Sattenspiel, Lisa and Carl P Simon, “The spread and persistence of infectious diseases in structured pop-
ulations,” Mathematical Biosciences, 1988, 90 (1-2), 341–366.
Sefton, Martin and Richard Steinberg, “Reward structures in public good experiments,” Journal of PublicEconomics, 1996, 61 (2), 263–287.
Shiller, Robert J, Stanley Fischer, and Benjamin M Friedman, “Stock prices and social dynamics,” Brook-ings papers on economic activity, 1984, 1984 (2), 457–510.
45

Stoneman, Paul, The economic analysis of technological change, Oxford [Oxfordshire]; New York: Oxford
University Press, 1983.
WHO Ebola Response Team, “West African Ebola epidemic after one year-slowing but not yet under
control,” N Engl J Med, 2015, 372 (6), 584–7.
46