Embed Size (px)
Citation preview
Heritability and Genome-Wide AssociationStudy to Assess Genetic Differencesbetween Advanced Age-related MacularDegeneration Subtypes
Lucia Sobrin, MD, MPH,1 Stephan Ripke, MD,2 Yi Yu, PhD,3 Jesen Fagerness, JD,2 Tushar R. Bhangale, PhD,4
Perciliz L. Tan, BSc,5 Eric H. Souied, MD, PhD,6,7 Gabriëlle H. S. Buitendijk, MD, MSc,8
Joanna E. Merriam, MD, PhD,9 Andrea J. Richardson, BSc,10 Soumya Raychaudhuri, MD, PhD,11
Robyn Reynolds, MPH,3 Kimberly A. Chin, BA,3 Aaron Y. Lee, MD,12 Nicolas Leveziel, MD, PhD,6,7
Donald J. Zack, MD, PhD,13,14,15 Peter Campochiaro, MD,13,14 R. Theodore Smith, MD, PhD,9
Gaetano R. Barile, MD,9 Ruth E. Hogg, PhD,16 Usha Chakravarthy, MD, PhD,16 Timothy W. Behrens, MD,17
André G. Uitterlinden, PhD,18 Cornelia M. van Duijn, PhD,19 Johannes R. Vingerling, MD, PhD,8
Milam A. Brantley, Jr, MD, PhD,20 Paul N. Baird, PhD,10 Caroline C. W. Klaver, MD, PhD,8
Rando Allikmets, PhD,9,21 Nicholas Katsanis, PhD,5 Robert R. Graham, PhD,17
John P. A. Ioannidis, MD, DSc,22,23,24 Mark J. Daly, PhD,2 Johanna M. Seddon, MD, ScM,3,25
Purpose: To investigate whether the 2 subtypes of advanced age-related macular degeneration (AMD),choroidal neovascularization (CNV), and geographic atrophy (GA) segregate separately in families and to identifywhich genetic variants are associated with these 2 subtypes.
Design: Sibling correlation study and genome-wide association study (GWAS).Participants: For the sibling correlation study, 209 sibling pairs with advanced AMD were included. For the
GWAS, 2594 participants with advanced AMD subtypes and 4134 controls were included. Replication cohortsincluded 5383 advanced AMD participants and 15 240 controls.
Methods: Participants had the AMD grade assigned based on fundus photography, examination, or both. Todetermine heritability of advanced AMD subtypes, a sibling correlation study was performed. For the GWAS,genome-wide genotyping was conducted and 6 036 699 single nucleotide polymorphisms (SNPs) were imputed.Then, the SNPs were analyzed with a generalized linear model controlling for genotyping platform and geneticancestry. The most significant associations were evaluated in independent cohorts.
Main Outcome Measures: Concordance of advanced AMD subtypes in sibling pairs and associationsbetween SNPs with GA and CNV advanced AMD subtypes.
Results: The difference between the observed and expected proportion of siblings concordant for the samesubtype of advanced AMD was different to a statistically significant degree (P � 4.2�10–5), meaning that insiblings of probands with CNV or GA, the same advanced subtype is more likely to develop. In the analysiscomparing participants with CNV to those with GA, a statistically significant association was observed at theARMS2/HTRA1 locus (rs10490924; odds ratio [OR], 1.47; P � 4.3�10–9), which was confirmed in the replicationsamples (OR, 1.38; P � 7.4�10–14 for combined discovery and replication analysis).
Conclusions: Whether CNV versus GA develops in a patient with AMD is determined in part by geneticvariation. In this large GWAS meta-analysis and replication analysis, the ARMS2/HTRA1 locus confers increasedrisk for both advanced AMD subtypes, but imparts greater risk for CNV than for GA. This locus explains a smallproportion of the excess sibling correlation for advanced AMD subtype. Other loci were detected with suggestiveassociations that differ for advanced AMD subtypes and deserve follow-up in additional studies.
Financial Disclosure(s): Proprietary or commercial disclosure may be found after the references.Ophthalmology 2012;119:1874–1885 © 2012 by the American Academy of Ophthalmology.
oit
Age-related macular degeneration (AMD) is the most com-mon cause of irreversible vision loss in older adults.1 Visionloss from AMD most often occurs when the disease pro-
gresses to 1 of 2 advanced forms, geographic atrophy (GA) g1874 © 2012 by the American Academy of OphthalmologyPublished by Elsevier Inc.
r choroidal neovascularization (CNV). Clinical character-stics and histologic features of GA and CNV suggest dis-inct pathologic pathways in their development.2,3 Geo-
raphic atrophy usually is slowly progressive and involvesISSN 0161-6420/12/$–see front matterhttp://dx.doi.org/10.1016/j.ophtha.2012.03.014

gvl
P
TDpPe
STswatsfsr(tvwFFCpefftlcbsCcetor
upc
Sobrin et al � Heritability and GWAS of Advanced AMD Subtypes
atrophy of the macular neurosensory cells, whereas CNVoften presents with acute vision loss and involves growth ofabnormal choroidal vessels under the macula. Both ad-vanced forms can be found in the same patient; GA andCNV can occur in the same eye or a patient may have GAin one eye and CNV in the other. Although there are alsosome predisposing pathophysiological changes in the extra-cellular matrix of the macula that are seen in both types ofAMD,3 it is unclear what causes eyes with early or inter-mediate AMD to progress to one advanced subtype or theother. Some differences given the effects of environmentalrisk factors, such as hypertension and cigarette smoking, onthe development of neovascular versus nonneovascularAMD have been suggested.4–6 However, these environ-mental risk factors alone do not explain the entire differencein development of the 2 subtypes.
The genetic predisposition of overall AMD has beendemonstrated clearly,1,7 and genetic association studieshave been successful in uncovering common variants atseveral loci that account for this.8–22 These case-controlassociation studies commonly have a combination of pa-tients with GA and patients with CNV together as advancedcases. Subgroup analyses performed as part of some of theseinvestigations generally have not found significant differ-ences in the risk allele frequencies for CNV versusGA,12,15,17,18,20 which may be the result of limited power,given the relatively small number of patients with GA inthese investigations. However, in the subgroup analyses forthe largest genome-wide association study (GWAS) per-formed to date and in a candidate gene study performed bythe authors’ group in a large sample, the ARMS2/HTRA1locus (rs10490924) was associated with a greater risk ofCNV compared with GA.21–23 Interestingly, no other locihave been proven to predispose specifically to one of theadvanced forms. Herein, new information is reported andprevious analyses of this subphenotype difference are ex-panded in the following ways: (1) including novel evidencefor sibling correlation, (2) investigating more than 6 millionadditional loci using genome-wide data with improved im-putation methods based on the 1000 Genomes Project,24 (3)adding in-depth analyses of the single nucleotide polymor-phisms (SNPs) associated with overall advanced AMD,including the recently reported FRK/COL10A1 and VEGFAloci,25 and (4) incorporating additional replication samples.The purposes of this study were to determine whetherdevelopment of CNV versus GA is heritable and to identify
Table 1. Sibling Correlation in Advanced
Siblings’ Worse Eye GradeNo.
ObservedPropor
Observe
Both siblings GA 29 13.One sibling CNV, One sibling GA 58 27.Both siblings CNV 122 58.
CNV � choroidal neovascularization; GA � geographic atrophy.P � 4.2�10–5. The P value for the chi square test was calculated by compaconcordant for the subtype of advanced age-related macular degeneration
heritability of the 2 subphenotypes of CNV and GA and were based solely onenetic variants that may explain differences in risk of CNVersus GA with an unbiased method of examining geneticoci across the genome.
atients and Methods
he methods used in this study conformed to the tenets of theeclaration of Helsinki. Informed consent was obtained from allarticipants, and this work complied with the Health Insuranceortability and Accountability Act. Institutional review board/thics committee approval was obtained.
ibling Correlation: Heritabilityo determine the heritability of GA and CNV, a sibling correlationtudy was performed. A sibling correlation analysis examineshether siblings are more likely to have the same subtype of
dvanced AMD than what would be expected by chance alone, ifhere were no shared genetic risk factors that contribute to theubtype development. Participants for this analysis were derivedrom the Family Study of AMD.26,27 Families with 2 or moreiblings reported to have AMD (large drusen, GA, or CNV) wereecruited from the AMD database of the principal investigatorJMS), from other ophthalmologists throughout the country, fromhe Age-Related Eye Disease Study Ancillary Study, and througharious media (newspapers, newsletters, brochures). All siblingsere assessed with ocular examination and fundus photography.or this analysis, 2 siblings were chosen from each family in theamily Study of AMD database. Both siblings had either GA orNV in at least 1 eye, and if bilateral advanced disease wasresent, they could not have GA in one eye and CNV in the otherye. If there were only 2 siblings with advanced AMD in theamily that met the criteria, those 2 siblings were chosen. If theamily had more than 2 siblings with advanced AMD who methe criteria, a computer-generated randomization algorithm se-ected the 2 siblings. The observed proportion of sibling pairs werealculated (1) who both had GA as their worse eye grade, (2) whooth had CNV as their worse eye grade, and (3) in which oneibling had GA as the worse eye grade and the other sibling hadNV as the worse grade. The expected proportions for these 3ategories were calculated based on the number of individuals withach eye grade, assuming that the occurrence of the 2 subpheno-ypes of CNV and GA was not heritable. The distributions of thebserved versus expected proportions of the 3 sibling pair catego-ies were compared using the chi-square test.
Because the ARMS2/HTRA1 locus has been shown to contrib-te to the potential heritability of the 2 subphenotypes, the ex-ected proportions for the 3 sibling pair categories also werealculated controlling for the ARMS2/HTRA1 genotype. For this
-Related Macular Degeneration Subtypes
)Proportion
Expected (%)Proportion Expected Controlling for
ARMS2/HTRA1 Genotype (%)
7.7 8.140.0 38.852.3 53.1
the difference between the observed and expected distributions of siblingsheir worse eye. The expected distributions were calculated assuming no
Age
tiond (%
884
ringin t
the number of individuals with each eye grade.
1875
ag
G
DcpR
Ophthalmology Volume 119, Number 9, September 2012
analysis, participants were divided into 3 groups based on theirobserved ARMS2/HTRA1 genotype group (GG, TG, and TT).Within each genotype group, each participant’s phenotype thenwas reassigned randomly to CNV or GA while preserving theobserved proportion of participants with CNV versus GA withineach genotype group. This random assignment was performed witha computer-generated algorithm. The proportion of siblings in eachcategory then was recalculated. This analysis was carried out toassess how much of the sibling correlation that was observed for
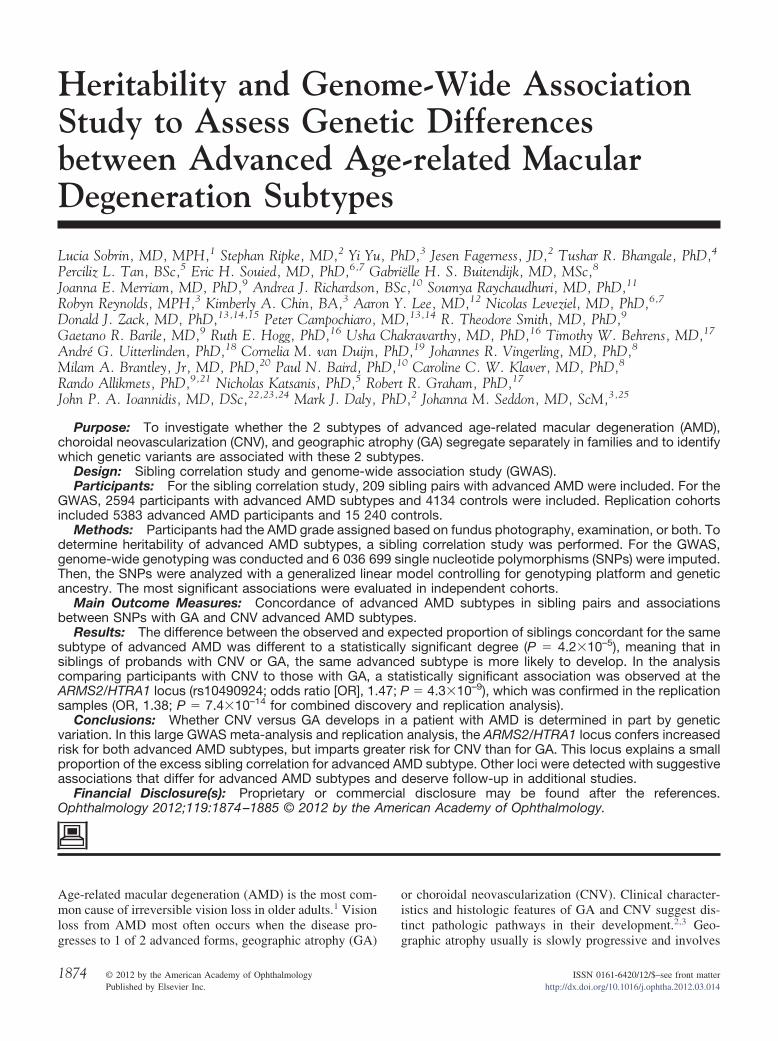
Figure 3. Manhattan plots for genome-wide association analyses of the diwith participants with choroidal neovascularization (n � 1775), (B) pardegeneration (AMD; n � 4134), and (C) participants with choroidal ntruncated at 1� 10–20. –log10(P) � negative logarithm (base 10) of thmaculopathy susceptibility 2/HtrA serine peptidase 1; CFH � complemen
CoA isomerase; C3 � complement component 3; CFI � complement factor I1876
dvanced AMD subtype could be explained by the ARMS2/HTRA1enotype.
enome-Wide Association Meta-analyses
iscovery Sample Description. For the GWAS, the cases andontrols were derived from the Tufts/Massachusetts General Hos-ital (MGH) GWAS Cohort Study21; the Michigan, Mayo, Age-elated Eye Disease Study, the Pennsylvania (MMAP) Cohort
ry cohort comparing (A) participants with geographic atrophy (n � 819)nts with geographic atrophy to participants with no age-related macularcularization to participants with no AMD. The y-axes of the plots aregle nucleotide polymorphism’s P value; ARMS2/HTRA1 � age-relatedtor H; CFB � complement factor B; PECI � peroxisomal D3,D2-enoyl-
scoveticipaeovase sint fac
.

(Gt3ipiamhPtnb
GieeSislscwmCapaeinttf
Sobrin et al � Heritability and GWAS of Advanced AMD Subtypes
Study22; as well as controls from the Myocardial Infarction Ge-netics Consortium (MIGen)28 and the Genetic Association Infor-mation Network (GAIN) Schizophrenia Study.29 Information onthe publicly available MMAP and GAIN dataset sources is avail-able in Appendix 1 (available at http://aaojournal.org). All patientswere of European ancestry. For the Tufts/MGH GWAS CohortStudy, AMD grade was assigned based on fundus photography andocular examination (Clinical Age-Related Maculopathy GradingSystem [CARMS] advanced AMD grades 4 and 5).30 The CARMSgrade 4 is defined as either GA with involvement of the macularcenter or noncentral GA at least 350 �m in size. The CARMSgrade 5 is defined as exudative AMD including nondrusenoidpigment epithelial detachments, serous or hemorrhagic retinal de-tachments, CNV with subretinal or subpigment epithelial hemor-rhage or fibrosis, or scarring consistent with the treatment ofAMD. If a patient had evidence of both GA and CNV in the sameeye, they were classified as having grade 5 (CNV) in that eye. Thefinal designation of grade for each participant was based on thehighest grade in either eye. Therefore, a patient who had grade 4(GA) in one eye and a grade 5 (CNV) in the other eye wasdesignated as having grade 5 (CNV) for the main analysis. Exam-ined participants without AMD were unrelated to cases, were 60years of age or older, and were defined as individuals withoutmacular degeneration, categorized as CARMS stage 1, based onfundus photography and ocular examination. Only MMAP caseswith GA or CNV were included in the analysis; early and inter-mediate AMD cases were excluded. The MIGen controls wereincluded in a previous GWAS study and were described in detail.21
Shared controls from the GAIN Schizophrenia Study have alsobeen previously described.29 The combined Tufts/MGH, MMAP,MIGen, and GAIN dataset is referred to as the Tufts/MMAP/MIGen/GAIN (TMMG) sample. This dataset has been describedpreviously in further detail.25
Genotyping. The Tufts/MGH and MIGen samples were geno-typed at the Broad Institute and National Center for ResearchResources Center for Genotyping and Analysis using the Af-fymetrix SNP 6.0 GeneChip (AFFY 6.0, 909622 SNPs, Af-fymetrix, Santa Clara, CA).31 Shared controls from the GAIN
Figure 3. (continued)
study obtained from the database of Genotypes and Phenotypes 1
dbGaP) also were genotyped by using the Affymetrix SNP 6.0eneChip. The MMAP samples obtained from dbGaP were geno-
yped on the Illumina HumanCNV370v1 Bead Array (ILMN 370,70404 SNPs; Illumina, Inc., San Diego, CA).22 All samplesncluded in this study met quality-control measures as describedreviously.21,22 For the meta-analysis of GWAS, only high-qualitymputed genotypes (information (INFO) scores �0.6) and minorllele frequency �0.01 were included.25 The INFO score is aeasure of imputation reliability. A consensus set of 6 036 699
igh-quality SNPs from each imputed dataset was analyzed byLINK using a generalized linear model controlling for the geno-
yping platform and genetic ancestry based on principal compo-ent analysis by EIGENSOFT. The imputed genotypes were codedy the allele dosage for each SNP in the analysis.
Genome-Wide Association Study Meta-analyses. Three mainWAS analyses were performed. First, individuals who had CNV
n at least 1 eye were compared with those with GA in at least 1ye. If a patient had GA in one eye and CNV in the contralateralye, they were classified as a CNV case for the primary analyses.econd, individuals who had GA in at least one eye and no CNV
n either eye (cases) were compared with individuals without anyigns of AMD (controls). Finally, individuals who had CNV in ateast 1 eye (cases) were compared with individuals without anyigns of AMD (controls). It is possible that some of these CNVases had GA in their contralateral eye. Also each of these analysesas performed adjusting for age at ascertainment and separately inen and women. To determine if the inclusion of patients who hadNV in one eye and GA in the other eye as CNV cases in the mainnalyses affected the association results, a sensitivity analysis waserformed. The sensitivity analysis consisted of repeating thenalysis with the subset of patients with grades available for bothyes and excluding the patients who had CNV in one eye and GAn the other eye. Patients with CNV and GA in the same eye wereot excluded for this sensitivity analysis because sufficiently de-ailed phenotyping information was not available for most patientso isolate these cases. For novel associations, the P value thresholdor significance in the GWAS was P � 5�10–8. For SNPs in the
3 loci that have been associated previously with overall advanced1877
pFsecwtlvlsgc
GA
CTpacidagseg
neova
Ophthalmology Volume 119, Number 9, September 2012
AMD, a P value threshold for significance of 0.0038 was deter-mined by the Bonferroni correction method.
Replication Samples and Genotyping. Replication of SNPswith the smallest P values from the CNV versus GA and CNVversus no AMD analyses was pursued in 10 independent cohortsfrom Johns Hopkins University, Columbia University, WashingtonUniversity, Genentech, the Rotterdam Study, Centre for Eye Re-search Australia, an independent replication sample from Tufts/MGH, Hôpital Intercommunal de Creteil, the Queen’s Universityof Belfast, and Complications of AMD Prevention Trial.25,32 Allreplication studies applied similar criteria for the diagnosis ofcases. The SNPs that met genotype quality control criteria inreplication cohorts were tested for association with a generalizedlinear model in PLINK. An additive model was used for each SNP(0, 1, or 2 minor alleles). A combined analysis was conducted forthe results of top SNPs in all participating cohorts using Cochran-Mantel-Haenszel pooling of the odds ratios (ORs) and a fixedeffects model with inverse-variance weighting.
Results
Sibling Correlation: Heritability
From the 390 families that are part of the Family Study of AMD,209 had sibling pairs who met the inclusion criteria for this siblingcorrelation analysis. The other 181 families did not meet criteriabecause they did not have 2 siblings with GA or CNV (n � 145)or at least 1 of the siblings had GA in one eye and CNV in the
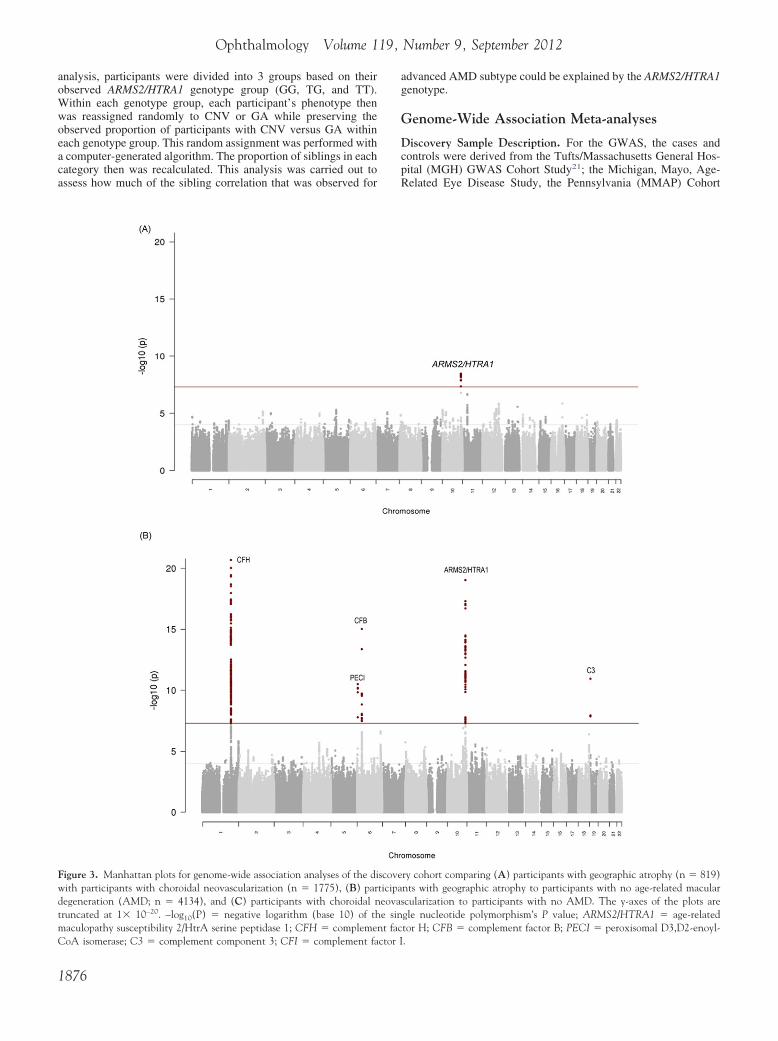
Table 2. Genome-wide association discovery analysis compparticipants with ge
CHR GENE SNP BP
Most highly associated SNPs10 ARMS2/HTRA1 rs10490924 12421444811 Near QSER1 rs4755455 3290331812 KCTD10 rs56209061 1099056852 Near BC017935 rs1108738 227078645
19 Near LILRA4 rs10405172 5485655012 Near NUDT4 rs7973431 936411985 Near RASA1 rs62367737 86393085
10 Near ADARB2 rs34167775 194215220 NFATC2 rs11697536 5010838917 Near UTP18 rs4794243 49449132
SNPs previously associated with overall advanced AMD (other than ARM16 CETP rs3764261 5699332422 TIMP3 rs9621532 3141451119 C3 rs2230199 67183876 C2 rs9332739 319038046 FRK/COL10A1 rs1999930 1163871343 COL8A1 rs13095226 993962721 CFH rs1061170 1966592376 VEGFA rs4711751 438285824 CFI rs10033900 1106590676 CFB rs641153 31914180
15 LIPC rs10468017 586785129 ABCA1 rs1883025 107664301
AMD � age-related macular degeneration; BP � base position; CHR � callele); Freq � frequency; INFO � information content; L95 � lower 95%U95 � upper 95% confidence interval.P values compared effective allele frequencies in patients with choroidal
other eye (n � 36). The distribution of gender in the 209 sibling g
1878
airs was in line with the overall female predominance in theamily Study of AMD: 15% were brother-brother pairs, 39% wereister-brother pairs, and 46% were sister-sister pairs. The differ-nce between the observed and expected distributions of siblingsoncordant for the subtype of advanced AMD in their worse eyeas statistically significant (P � 4.2�10–5; Table 1). This means
hat, if CNV develops in one sibling, the other sibling is moreikely to have CNV than GA if advanced AMD develops. Con-ersely, if GA develops in one sibling, the other sibling is moreikely to have GA than CNV if advanced AMD develops. Thisupported the rationale for continuing the analyses to look forenetic variants that exert a differential effect on the risk of GA asompared with CNV.
enome-Wide Association and Replicationnalyses
horoidal Neovascularization versus Geographic Atrophy. TheMMG dataset contained 819 participants with GA and 1775articipants with CNV (the discovery cohort). Figure 1 (avail-ble at http://aaojournal.org) shows a plot of the first 2 principalomponents from this analysis. Principal components analysiss a way to correct for population stratification (allele frequencyifferences between cases and controls because of systematicncestry differences) that can cause spurious associations inenetic association studies.33 The principal components analy-is for genetic association studies takes the genotype data fromach individual to infer their genetic ancestry. It plots thisenetic ancestry by individual principal components, or axes of
participants with choroidal neovascularization (CNV) tohic atrophy (GA)
FreqCNV
FreqGA INFO OR (L95, U95) P
0.438 0.364 0.92 1.47 (1.28, 1.69) 4.3�10�9
0.186 0.13 0.94 1.59 (1.33, 1.90) 2.1�10�7
0.052 0.083 0.97 0.55 (0.43, 0.70) 1.4�10�6
0.012 0.025 0.53 0.23 (0.12, 0.43) 3.2�10�6
0.818 0.787 0.33 1.85 (1.43, 2.39) 3.8�10�6
0.335 0.276 0.91 1.38 (1.20, 1.58) 3.9�10�6
0.914 0.889 0.38 2.12 (1.55, 2.90) 4.6�10�6
0.051 0.085 0.94 0.57 (0.45, 0.72) 5.0�10�6
0.04 0.03 0.16 7.61 (3.21, 18.03) 5.0�10�6
0.624 0.669 0.50 0.67 (0.56, 0.80) 5.5�10�6
TRA1 above)0.369 0.340 0.99 1.13 (1.00, 1.27) 0.0540.967 0.956 1 1.29 (0.96, 1.73) 0.100.239 0.254 0.59 0.87 (0.73, 1.04) 0.110.025 0.020 0.89 1.30 (0.84, 2.00) 0.240.262 0.253 0.95 1.05 (0.92, 1.20) 0.490.880 0.871 1 1.07 (0.89, 1.27) 0.490.394 0.384 0.99 1.03 (0.92, 1.16) 0.630.534 0.537 0.73 0.99 (0.86, 1.14) 0.860.52 0.521 0.85 0.99 (0.86, 1.14) 0.880.052 0.055 0.86 0.98 (0.74, 1.29) 0.900.257 0.256 0.80 1.01 (0.86, 1.18) 0.940.256 0.257 0.92 1.00 (0.86, 1.14) 0.95
osome; EA � Effective allele (frequency and odds ratios are based on thisence interval; OR � odds ratios; SNP � single nucleotide polymorphism;
scularization versus patients with geographic atrophy.
aringograp
EA
TCATTTAATT
S2/HAACCTTTTTATT
hromconfid
enetic variation, to determine if the cases and controls differ in

wwH5aArb1av
ceipwdttAbptG
ce we
Sobrin et al � Heritability and GWAS of Advanced AMD Subtypes
their genetic ancestry. Review of the first 2 principal compo-nents derived from the genetic data showed no obvious differ-ence between cases and controls, suggesting absence of anysignificant population stratification. Meta-analysis of GWAS Pvalues were plotted in quantile-quantile plots (Fig 2A, availableat http://aaojournal.org). Little statistical inflation was observedin the distribution of the association statistic (inflation factor�gc � 1.014). Figure 3A shows a Manhattan plot for thisanalysis. In the Manhattan plot, each dot represents 1 SNPtested in the GWAS. Each dot, or SNP, is plotted according toits location along the chromosomes of the human genome(horizontal axis) and its P value in the GWAS analysis (verticalaxis). The higher the dots, the stronger the genetic association.The red line indicates the genome-wide significance thresholdof 5�10– 8. The ARMS2/HTRA1 locus is the only one to meetthis significance threshold on the Manhattan plot of the GWASanalysis for CNV versus GA.
Table 2 includes the most statistically significant SNPs forindependent loci from the GA versus CNV comparison for newand previously reported AMD SNPs. A statistically significantassociation signal was observed at the ARMS2/HTRA1 locus(rs10490924; P � 4.3�10–9). Figure 2B (available at http://aaojournal.org) shows the quantile-quantile plot of the GWASmeta-analysis results after removal of the ARMS2/HTRA1 locuswhere the line became flattened to � � 0.999. Removal of the
Table 3. Replication Analyses Results for the Top Single NDegeneration
ChoroidalNeovascularization
Geographic Atrophy
Controls
SNP Gene AnalysisEffectiveAllele*
Newly identified SNPs from the discovery analysesrs8091635 Near BRUNOL4 CNV vs. control Trs4755455 Near QSER1 CNV vs. GA C
SNPs previously associated with overall advanced AMDrs10490924 ARMS2/HTRA1 CNV vs. GA Trs4711751 VEGFA CNV vs. GA Trs9332739 C2 CNV vs. GA Crs9621532 TIMP3 CNV vs. GA Ars13095226 COL8A1 CNV vs. GA Trs10468017 LIPC CNV vs. GA Trs1883025 ABCA1 CNV vs. GA Trs3764261 CETP CNV vs. GA Ars1061170 CFH CNV vs. GA Trs2230199 C3 CNV vs. GA Crs641153 CFB CNV vs. GA Ars10033900 CFI CNV vs. GA Trs1999930 FRK/COL10A1 CNV vs. GA T
CNV � choroidal neovascularization; GA � geographic atrophy; SNP �*Odds ratios are based on this allele.†Samples that participated in the combined analysis for each SNP are indicsamples); “b” represents Johns Hopkins University; “c” represents WashinStudy; “f” represents Centre for Eye Research Australia; “g” represents an inHôpital Intercommunal de Creteil; “i” represents the Queen’s UniversMeta-analysis was performed with fixed effects model with inverse-varian
gc
ARMS2/HTRA1 locus was done to visualize more easily if there 6
ere any other loci that are significantly associated. No other lociere associated at a genome-wide significant P value (�5�10–8).owever, several variants reached a significance level of.5�10–6 to 1.4�10–6, including SNPs in KCTD10 and NFATC2nd SNPs near QSER1, BC017935, LILRA4, NUDT4, RASA1,DARB2, and UTP18. After adjusting for age at ascertainment, the
esults were not significantly different, with ARMS2/HTRA1 againeing the only locus to achieve genome-wide significance (OR,.48; P � 3.6�10–9). None of the other SNPs that previously weressociated with overall AMD were significantly associated in CNVersus GA analysis.
When the contribution of the ARMS2/HTRA1 locus to siblingorrelation was evaluated for AMD subtype, a small amount of thexcess sibling correlation could be explained by genetic variationn this region (Table 1). For example, the proportion of siblingairs expected to be concordant for GA assuming no heritabilityas 7.7%, and the observed proportion was 13.8%, or a 6.1%ifference in the proportion observed versus expected. This meanshat there must be shared genetic or environmental factors, or both,hat increase the chance of 2 siblings having the same subtype ofMD (in this case, GA) by 6.1 percentage points over what woulde expected if there were no genetic or environmental factors atlay. When the effect of the ARMS2/HTRA1 locus was controlled,he proportion of the sibling pairs expected to be concordant forA was 8.1%, which explained 0.4% (8.1% minus 7.7%) of the
tide Polymorphisms Associated with Age-Related Macularphenotypes
eta–Genome-de Association
StudyReplication Meta-
analysisCombinedAnalysis
1775 4515 6290
819 868 1687
4134 15 240 19 374
dsio P Value
OddsRatio P Value
OddsRatio P Value Samples†
7 1.7�10�7 1.04 0.27 1.13 2.2�10�5 abcdefghijk9 2.1�10�7 0.96 0.63 1.18 0.003 abfghik
7 4.1�10�9 1.32 1.8�10�6 1.38 7.4�10�14 abcdefghijk9 0.86 1.12 0.04 1.07 0.13 abcdefghijk
0.24 1.19 0.53 1.26 0.19 adeghj9 0.1 1.01 0.95 1.15 0.20 abdeghjk7 0.49 1.05 0.62 1.06 0.40 acdghjk1 0.94 1.04 0.52 1.04 0.52 abcdefghijk0 0.94 0.94 0.43 0.97 0.56 abcdghijk3 0.054 0.93 0.21 1.02 0.59 abcdefghijk3 0.63 1.02 0.79 1.02 0.59 abcdefghijk7 0.11 1.05 0.52 0.97 0.59 adefghj8 0.9 0.90 0.51 0.94 0.59 adeghj9 0.88 0.99 0.88 0.99 0.84 adeghjk5 0.49 0.94 0.41 0.995 0.91 abcdefghijk
le nucleotide polymorphism.
y letters a through j. “a” represents Tufts/MMAP/MIGen/GAIN (TMMGniversity; “d” represents Columbia University; “e” represents Rotterdamdent replication sample from Tufts/Mass General Hospital; “h” representsBelfast; “j” represents the Complications of AMD Prevention Trial.
ighting.
ucleoSub
MWi
OdRat
1.21.5
1.40.91.31.21.01.01.01.11.00.80.90.91.0
sing
ated bgton Udepenity of
.1% difference. If 2 siblings both have at least 1 T allele at the
1879

evseuewats(
ctasrsPi
Ophthalmology Volume 119, Number 9, September 2012
ARMS2/HTRA1 locus, CNV is more likely than GA to develop inboth, although genetic similarity at this locus accounts for a smallpart of the reason that the siblings are more likely to share the sameAMD subtype.
The replication sample consisted of independent datasets notincluded in the above analyses. These were included to confirmthe associations detected in the discovery dataset. There were4515 participants with CNV, 868 participants with GA, and15 240 participants with no AMD in these additional datasets.In these samples, rs10490924 was examined further (Table 3).The direction of the effect for rs10490924 was consistent in most ofthe replication samples, with a final meta-analysis OR of 1.38 (95%confidence interval [CI], 1.27–1.51; P � 7.4�10–14). Meta-analysisfor the replication datasets alone yielded an OR of 1.32 (95%CI, 1.18 –1.48; P � 1.8�10– 6). The T allele at rs10490924 wasassociated with a higher risk of CNV compared with GA. Whenmeta-analysis of independent datasets is used to estimate acombined effect, confirmation is needed that the effects foundin the individual studies are similar enough that one can beconfident that a combined estimate will be a meaningful de-
Table 4. Ten most highly associated SNPs from the genome-wneovascularization (CNV) to participants with no age-related m
(GA) to participants with no
(A) CNV vs. no AMD
CHR GENE SNP BP EA
SNPs previously associated with overall advanced AMD10 ARMS2/HTRA1 rs10490924 124214448 T1 CFH rs1061170 196659237 T6 CFB rs641153 31914180 A
19 C3 rs2230199 6718387 C4 CFI rs10033900 110659067 T6 C2 rs9332739 31903804 C
Newly identified SNPs8 Near TRIB1 rs35691538 126714038 A
18 Near BRUNOL4 rs8091635 35857547 T7 Near TRA2A rs10262213 23591963 T5 ADAM19 rs59795197 156843157 T
(B) GA vs. no AMD
CHR GENE SNP BP EA
SNPs previously associated with overall advanced AMD1 CFH rs1061170 196659237 T
10 ARMS2/HTRA1 rs10490924 124214448 T19 C3 rs2230199 6718387 C6 CFB rs641153 31914180 A6 C2 rs9332739 31903804 C4 CFI rs10033900 110659067 T
Newly identified SNPs6 PECI rs582301 4124849 A6 Near SOD2 rs2842992 160071159 A
18 Near MBP rs1789110 74859044 A8 Near C8orf42 rs722782 516479 A
AMD � age-related macular degeneration; BP � base position; CHR �(frequency and odds ratios are based on this allele); Freq � frequency, Gconfidence interval; OR � odds ratios; SNP � single nucleotide polymor*The INFO score for rs2230199 is less than the QC threshold we used fobecause it is the one that has been previously reported to be associated wiscore �0.6, is in linkage disequilibrium with rs2230199, and was associateno AMD.
scription of the set of studies. The estimates for the effect of d
1880
ach SNP of individual studies will vary by chance, and someariation is expected. When heterogeneity is present amongtudies, it means that there is more variation than would bexpected by chance alone, and a combination of these studiessing meta-analysis techniques is not valid. There was novidence for heterogeneity in the meta-analyses for rs10490924ith P values for the Q test of heterogeneity of 0.07 (I2 � 41.7)
nd 0.07 (I2 � 42.7) for the analyses, including and excludinghe discovery cohort, respectively. That is, heterogeneity amongtudies was not present to a statistically significant degreeP � 0.05).
In the discovery cohort, a region on chromosome 11 thatontained several SNPs in LD with P � 5�10–6 also was de-ected, including rs4755455 (P � 2.1�10–7; Table 2). In age-djusted analyses, the association with rs4755455 also was con-istent with an OR of 1.59 (P � 3.1�10–7). This association ofs4755455 with advanced AMD subtype, however, was not con-istent across the replication samples, yielding meta-analysis
values of 0.003 and 0.63 for the analyses including and exclud-ng the discovery cohort, respectively (Table 3). There was evi-
ssociation analyses comparing (A) participants with choroidallar degeneration and (B) participants with geographic atrophyrelated macular degeneration
q CasesNV)
FreqControls INFO OR (L95, U95) P
.438 0.206 0.98 3.67 (3.33, 4.05) 1.5�10�138
.394 0.629 1 0.36 (0.33, 0.4) 1.2�10�108
.052 0.101 0.91 0.45 (0.38, 0.54) 1.0�10�17
.239 0.193 0.57* 1.61 (1.40, 1.85) 1.0�10�12
.52 0.463 0.8 1.31 (1.19, 1.44) 6.4�10�9
.025 0.045 0.9 0.48 (0.37, 0.62) 1.8�10�8
.045 0.032 0.72 1.95 (1.51, 2.52) 1.3�10�7
.399 0.349 0.9 1.27 (1.15, 1.4) 1.7�10�7
.119 0.151 0.97 0.73 (0.65, 0.82) 1.6�10�6
.089 0.117 0.94 0.71 (0.61, 0.83) 3.6�10�6
q CasesGA)
FreqControls INFO OR (L95, U95) P
.384 0.629 1 0.36 (0.32, 0.40) 4.8�10�67
.364 0.206 0.94 2.52 (2.24, 2.83) 7.1�10�47
.25 0.19 0.56* 1.83 (1.56, 2.14) 4.9�10�13
.055 0.101 0.92 0.47 (0.37, 0.59) 1.5�10�9
.02 0.045 0.89 0.38 (0.26, 0.56) 1.2�10�6
.521 0.463 0.79 1.32 (1.17, 1.48) 3.9�10�6
.021 0.006 0.91 4.77 (2.98, 7.64) 3.2�10�11
.743 0.797 0.88 0.70 (0.61, 0.80) 3.4�10�7
.563 0.625 0.90 0.75 (0.67, 0.84) 4.2�10�7
.067 0.106 1 0.60 (0.48, 0.74) 1.9�10�6
omosome; CNV � choroidal neovascularization; EA � Effective allelegeographic atrophy; INFO � information content; L95 � lower 95%
; U95 � upper 95% confidence interval.O Score for this analysis. We present the result for this SNP specificallyerall advanced AMD. Variant rs163494 upstream from C3 had an INFOh P � 3.8�10–12 for CNV vs. no AMD and P � 1.2�10–11 for GA vs.
ide aacu
age-
Fre(C
000000
0000
Fre(
000000
0000
chrA �
phismr INFth ovd wit
ence for heterogeneity in the meta-analysis for rs4755455 with a

atpaCorPPSfkw3riaoot
cocOAlissRSrracvtrrr
Sobrin et al � Heritability and GWAS of Advanced AMD Subtypes
P value for Q test of heterogeneity of 0.007 (I2 � 58.7). Whenthere is heterogeneity present in a meta-analysis, one approach isto incorporate it into a random effects model that involves theassumption that the effects being estimated in the different studiesare not identical, but follow a distribution. In a random effectsmeta-analysis, the P value for the association to rs4755455 was notsignificant (P � 0.75).
Table 2 also shows the meta-analysis GWAS results com-paring participants with GA with participants with CNV forSNPs previously associated with overall advanced AMD. Apartfrom ARMS2/HTRA1, none of the variants in other loci thatpreviously were associated with advanced AMD had a statisti-cally significant differential effect on risk of CNV versus GA.The estimates of the OR for the comparison of the 2 subtypes ofAMD in the GWAS were more than 1.10 for variants in the C2,CETP, and TIMP3 loci (OR estimates, 1.13–1.30). To furtherexplore these possible small differences in effect of the geneson CNV versus GA, the previously associated loci with addi-tional data, when available, from the replication cohorts wereexamined, and there was no statistically significant associationin this larger dataset other than the ARMS2/HTRA1 locus asso-ciation (Table 3). With the additional replication data, C2 andTIMP3 maintained ORs of more than 1.10, but still did notachieve statistical significance.
For the Tufts/MGH dataset, bilateral eye grades were available,and additional sensitivity analysis was performed in which caseswith CNV in one eye and GA in the other eye were excluded. Thisdataset included 481 patients with GA and 858 patients who hadCNV in at least one eye, of which 221 had CNV in one eye and GAin the other eye. With exclusion of these mixed cases from theanalysis, there was no significant change in the results, apart froma generalized decrease in the P values resulting from decreasedpower expected with removal of 25% of the CNV cases. Forrs10490924, the OR was 1.46 (95% CI, 1.24–1.71; P � 4.2�10–6)including the mixed cases and 1.38 (95% CI, 1.16–1.64; P �2.5�10–4) excluding the mixed cases.
Geographic Atrophy versus No Age-Related Macular Degen-eration and Choroidal Neovascularization versus No Age-Related Macular Degeneration.
Most Highly Associated Single Nucleotide Polymorphisms fromGenome-Wide Association Study. For the GA versus no AMD
Table 5. Results for Loci Previously Associated with OverallNeovascularization versus no Age-Related Macular Degener
Degenera
Locus
SingleNucleotide
Polymorphism
Choroidal Neovascularization vsMacular Degenerat
OddsRatio
Lower 95%Confidence
Interval
Upper 95Confiden
Interva
ARMS2/HTRA1 rs10490924 3.67 3.33 4.05CFH rs1061170 0.36 0.33 0.40CFB rs641153 0.45 0.38 0.54C3 rs2230199 1.61 1.40 1.85CFI rs10033900 1.31 1.19 1.44C2 rs9332739 0.48 0.37 0.62CETP rs3764261 1.22 1.12 1.33FRK/COL10A1 rs1999930 0.82 0.75 0.90TIMP3 rs9621532 1.55 1.25 1.93VEGFA rs4711751 1.20 1.09 1.33LIPC rs10468017 0.83 0.75 0.91ABCA1 rs1883025 0.86 0.78 0.95COL8A1 rs13095226 0.83 0.73 0.95
analysis, the TMMG dataset contained 819 participants with GA t
nd 4134 participants without AMD. Figure 3B shows a Manhat-an plot for the analysis comparing participants with GA witharticipants without AMD. As expected, several SNPs previouslyssociated with advanced AMD (CFH, CFB, ARMS2/HTRA1, and3) had P values less than the genome-wide significance thresholdf 5�10–8, as indicated by the red line on the plot. In addition, aegion on chromosome 6 was detected that contained 3 SNPs with� 1�10–10, including rs582301 in the PECI gene (OR, 4.77;� 3.2�10–11). Table 4 lists the most statistically significant
NPs for independent loci from this GWAS analysis; adjustmentor age at ascertainment showed similar results. Other than thenown genes and PECI, the following variants had P values thatere suggestive of association: rs2842992 (near SOD2) with P �.4�10–7, rs1789110 (near MBP) with P � 4.2�10–7, ands722782 (near C80rf42) with P � 1.9�10–6. Because rs582301n PECI was rare and imputed, direct genotyping was pursued insubset of the sample to try to validate the imputation. In a subsetf 21 individuals for whom imputation predicted the genotype AG,nly 2 actually had this genotype on direct genotyping, suggestinghis association is possibly the result of imputation error.
For the CNV versus no AMD analyses, the TMMG datasetontained 1775 participants with CNV and 4134 participants with-ut AMD. Figure 3C shows a Manhattan plot for the analysisomparing participants with CNV with participants without AMD.nly SNPs that previously had been associated with advancedMD—CFH, CFI, CFB, ARMS2/HTRA1, and C3—had P values
ess than the genome-wide significance threshold of 5�10–8, asndicated by the red line on the plot. Table 4 shows the mosttatistically significant SNPs in independent loci from this analy-is. Adjustment for age at ascertainment showed similar results.egions on chromosomes 8 and 18 were detected with severalNPs with P � 5�10–7, including rs35691538 (near TRIB1) ands8091635 (near BRUNOL4), P � 1.3�10–7 and P � 1.7�10–7,espectively. To investigate these regions further, replication wasttempted (Table 3). For rs8091635, the direction of effect was notonsistent in the replication sample, and after meta-analysis, the Palue decreased to 2.2�10–5. There was heterogeneity present inhe meta-analysis with P � 0.008 for the Q test (I2 � 65.6). In aandom effects meta-analysis, the P value for the association tos8091635 was 0.23. Because the minor allele of the other SNPs35691538 is rare and this SNP was not well imputed in replica-
anced Age-Related Macular Degeneration in the Choroidaland Geographic Atrophy versus No Age-Related Macular
Analyses
Age-Related Geographic Atrophy vs. No Age-Related MacularDegeneration
P ValueOddsRatio
Lower 95%Confidence
Interval
Upper 95%Confidence
Interval P Value
1.5�10�138 2.52 2.24 2.83 7.1�10�47
1.2�10�108 0.36 0.32 0.40 4.8�10�67
1.0�10�17 0.47 0.37 0.59 1.5�10�9
1.0�10�12 1.83 1.56 2.14 4.9�10�13
6.4�10�9 1.32 1.17 1.48 3.9�10�6
1.2�10�6 0.38 0.26 0.56 1.2�10�6
6.5�10�6 1.06 0.95 1.19 0.304.1�10�5 0.78 0.69 0.89 1.4�10�4
8.0�10�5 1.16 0.90 1.51 0.252.0�10�4 1.23 1.08 1.40 0.0022.4�10�4 0.84 0.73 0.96 0.008
0.002 0.88 0.78 0.99 0.0480.006 0.78 0.66 0.92 0.0036
Advationtion
. Noion
%cel
ion of GWAS datasets, no other replication cohorts with available
1881

AoclAaCsddoohCooaesaw
cbwothipa
ciHHaofeoagit
atdcsotfiifAr
Ophthalmology Volume 119, Number 9, September 2012
GWAS data had information to contribute regarding this SNP.Two other novel variants were suggestive for association withCNV compared with no AMD: rs10262213 (near TRA2A) andrs59795197 (ADAM19), with P values of 1.6�10–6 and 3.6�10–6,respectively.
Results for Single Nucleotide Polymorphisms Previously Asso-ciated with Overall Advanced Age-Related Macular Degeneration.Table 5 shows a side-by-side comparison of the results for the GAversus no AMD and the CNV versus no AMD comparisons forloci previously associated with overall advanced AMD. Significantassociation signals were observed (below the predeterminedthreshold for significance of 0.0038) for the CNV subtype versusno AMD comparison at SNPs in loci previously associated withoverall advanced AMD. These included LIPC (P � 2.4�10–4),TIMP3 (P � 8.0�10–5), CETP (P � 6.5�10–6), FRK/COL10A1(P � 4.1�10–5), VEGFA (P � 2.0�10–4), and ABCA1 (P �0.002). For the GA subtype versus no AMD comparison, signifi-cant association signals also were observed at SNPs in many of theloci previously associated with overall advanced AMD. ThoseSNPs that met the predetermined threshold for significance of0.0038 for known SNPs included VEGFA (P � 0.002), COL8A1(P � 0.0036), and FRK/COL10A1 (P � 1.4�10–4). For theARMS2/HTRA1 locus, the OR (95% CI) for GA versus no AMDwas 2.52 (2.23–2.83), and the OR (95% CI) for CNV versus noAMD was 3.67 (3.33–4.05). Of note, apart from this ARMS2/HTRA1 locus, the magnitude of the ORs related to the othergenes for the 2 advanced subtypes were similar with overlap-ping CIs.
Gender-Specific Analyses. Genome-wide association analy-ses were performed for each gender separately for the CNV versusGA, GA versus no AMD, and CNV versus no AMD comparisonsand did not reveal any additional novel associations. For theARMS2/HTRA1 locus in the CNV versus GA comparison, theassociation was similar in both men and women with an OR of1.52 (P � 1.57�10–6) in the women-only analysis and an OR of1.39 (P � 0.001) in the men-only analysis, showing a larger effectof this locus relative to other genetic loci on CNV versus GA inboth groups.
Discussion
Data from the sibling analysis provides novel evidence forsibling correlation of the major subphenotypes of AMD—CNV and GA—which can reflect shared genetic or envi-ronmental risk factors, or both.34,35 These results could beused to educate patients who have a family history of one ofthe advanced forms of AMD about the increased likelihoodof developing the same form as their siblings. Although thisreport provides evidence for an increased likelihood for thesame advanced AMD subtype among siblings, there can besubstantial AMD phenotypic heterogeneity in family mem-bers with AMD, and it is not uncommon to have severalAMD subphenotypes in 1 family.36
Having established excess sibling correlation of thesesubphenotypes and having demonstrated a difference be-tween CNV and GA genetic susceptibility for the ARMS2/HTRA1 locus previously,23 this analysis of GWAS datafrom a larger GWAS meta-analysis was undertaken to try touncover additional loci associated with an increased risk ofone advanced form over the other. The aggregate replicationcohort sample was the largest to date at the initiation ofanalyses for this type of subphenotype analysis, with 4515
CNV cases, 868 GA cases, and 15 240 controls with no s1882
MD. A definitive genome-wide significance of the previ-usly suggested increased risk for CNV was demonstratedompared with GA for the T allele of the ARMS2/HTRA1ocus (OR, 1.38; P � 7.4�10–14).23,37–39 The T allele at theRMS2/HTRA1 locus has previously been well establisheds a risk factor for overall advanced AMD defined as GA,NV, or both in either eye. The findings from this study
uggest that although the T allele increases the risk ofeveloping CNV, GA, or both, it increases the risk ofeveloping CNV to a greater degree than the risk of devel-ping GA in patients who develop advanced AMD. Basedn these results (OR, 1.38), for each T allele a participantad at the ARMS2/HTRA1 locus, their odds of havingNV in either or both eyes was 38% higher than theirdds of having only GA in either or both eyes at the timef phenotype ascertainment, which occurred after theylready had advanced AMD (GA or CNV) in at least 1ye. Adjusting for age at AMD ascertainment showed aimilar result. The GWAS analyses for each gender sep-rately also demonstrated similar results in men andomen.The patients in this study who were designated CNV
ases were primarily patients who only had CNV in one oroth eyes and no signs of GA in either eye. However, thereere some patients who had CNV in one eye and GA in thether eye. Inclusion of these mixed participants did not alterhe results. Therefore, even in patients who might currentlyave GA in one eye, each T allele they have confers anncreased odds of CNV developing in the second eye com-ared with a similar patient with GA who does not have thatllele.
There are some underlying biological mechanisms thatould explain why the ARMS2/HTRA1 locus confers thisncreased risk for CNV. There is evidence for a role of theTRA1 protein in the angiogenesis involved in CNV40; theTRA1 protein has been localized to vascular endothelium
nd may favor neovascularization by enhancing degradationf extracellular matrix components or by binding to trans-orming growth factor-�, an angiogenic factor.41,42 How-ver in this study, the ARMS2/HTRA1 locus accounts fornly a small amount of the excess sibling correlation fordvanced AMD subtype, suggesting there are additionalenetic or environmental factors, or both, including smok-ng and nutritional factors,38,39,43 that predispose patients tohese subtypes.
Although commercial genetic testing is currently avail-ble for the ARMS2/HTRA1 locus, it is not recommendedhat this be used routinely at this time for AMD patients toetermine their odds of CNV developing versus GA. Theontribution to the overall heritability of advanced AMDubtypes conferred by this locus is relatively small, and allf the genetic and environmental risk factors that contributeo subtype risk remain unknown. Therefore, genetic testingor ARMS2/HTRA1 alone in the clinical setting would givencomplete insight into a particular patient’s risk. As morenformation about additional genetic and environmental riskactors for advanced AMD subtypes are discovered, theRMS2/HTRA1 genotype could be part of a comprehensive
isk score in clinical practice that would affect monitoring
chedules or implementation of preventive treatments. The
Asplfivwmtls
R
1
1
1
1
1
Sobrin et al � Heritability and GWAS of Advanced AMD Subtypes
ARMS2/HTRA1 genotype could be used currently in clinicaltrials for preventive strategies aimed at CNV. Participantswith higher-risk genotypes for CNV development could beselected preferentially to improve the power to detect atherapeutic effect, potentially with a shorter follow-upperiod.44
A well-powered study looking at all the SNPs that havebeen associated definitely with overall AMD to date inGWAS is presented herein. Apart from ARMS2/HTRA1, noother new loci reached genome-wide significance for ininfluencing the risk of one advanced AMD subtype over theother. The recently discovered VEGFA polymorphism25
was a particularly interesting candidate gene in this analysis,given the important role of vascular endothelial growthfactor in the pathogenesis of CNV. However, the OR for theVEGFA polymorphism rs4711751 comparing GA withCNV, including the replication samples, was 1.06 (P �0.23). Two other known loci (C2 and TIMP3) showed ORsin the CNV versus GA analysis that cannot exclude thepossibility of small to modest differences in the magnitudeof the association of these loci with each AMD subpheno-type. A previous report that found CFH risk alleles weremore common in GA cases versus CNV cases could not beconfirmed,22 despite the fact that the current study is muchlarger and has more power statistically.
There were new variants that had P values at or neargenome-wide significance in the discovery cohort that didnot have consistent associations in the independent replica-tion samples: rs4755455 (near QSER1) in the CNV versusGA analysis and rs8091635 (BRUNOL4) in the CNV versusno AMD analysis. The inability to replicate these associa-tions could be the result of chance statistical fluctuations inthe discovery cohort, insufficient power in the replicationcohort, genotyping or imputation imprecision, or heteroge-neity between cohorts. Although the sample was the largestto date to evaluate these associations, it was underpoweredto detect variants with small effect sizes. To detect anassociation with a genotype relative risk of 1.10 for one ofthe AMD subphenotypes with 80% power, approximately9500 CNV and 9500 GA participants would be needed,assuming a 40% minor allele frequency for the variant(Genetic Power Calculator available at: pngu.mgh.harvard.edu/�purcell/gpc/; accessed June 8, 2011). In contrast, thislarge GWAS meta-analysis did have sufficient power todocument firmly the previous finding from a candidate genecase-control association study. In that prior study, theARMS2/HTRA1 locus had a moderate effect size with an ORof 1.37 that was quite consistent with the OR of 1.38observed in this study,23 suggesting approximately a 38%higher risk of developing CNV versus GA with each Tallele a participant harbors.
There were several other novel SNPs with associationsignals whose P values approached genome-wide signifi-cance in the GWAS analyses. For example, rs56209061 inKCTD10 in the CNV versus GA analysis and rs59795197 inADAM19 in the CNV versus no AMD analysis are SNPsthat may be related to advanced AMD subtypes and meritfollow-up.
In summary, this study found evidence for genetic sus-
ceptibility underlying development of one form of advancedMD over another. The largest GWAS for advanced AMDubphenotype analysis to date at the onset of the study waserformed. The stronger association of the chromosome 10ocus with CNV compared with GA was documentedrmly. Several other associated candidate loci for CNVersus GA, GA versus no AMD, and CNV versus no AMDere noted to be worthy of additional follow-up. Largereta-analysis efforts will be key to increasing power in
hese subtype analyses and may lead to replication of theseoci or identification of additional loci with smaller effectizes that differ between advanced AMD subtypes.
eferences
1. Seddon JM, Sobrin L. Epidemiology of age-related maculardegeneration. In: Albert DM, Miller JW, Azar DT, Blodi B,eds. Albert & Jakobiecs̀ Principles and Practice of Ophthal-mology. 3rd ed. vol. 1. Philadelphia: Saunders; 2008:413–22.
2. de Jong PT. Age-related macular degeneration. N Engl J Med2006;355:1474–85.
3. Zarbin MA. Current concepts in the pathogenesis of age-related macular degeneration. Arch Ophthalmol 2004;122:598–614.
4. Seddon JM, Willett WC, Speizer FE, Hankinson SE. A pro-spective study of cigarette smoking and age-related maculardegeneration in women. JAMA 1996;276:1141–6.
5. Hyman L, Schachat AP, He Q, Leske MC, Age-Related Mac-ular Degeneration Risk Factors Study Group. Hypertension,cardiovascular disease, and age-related macular degeneration.Arch Ophthalmol 2000;118:351–8.
6. Complications of Age-Related Macular Degeneration Preven-tion Trial (CAPT) Research Group. Risk factors for choroidalneovascularization and geographic atrophy in the Complica-tions of Age-Related Macular Degeneration Prevention Trial.Ophthalmology 2008;115:1474–9.
7. Haddad S, Chen CA, Santangelo SL, Seddon JM. The geneticsof age-related macular degeneration: a review of progress todate. Surv Ophthalmol 2006;51:316–63.
8. Klein RJ, Zeiss C, Chew EY, et al. Complement factor Hpolymorphism in age-related macular degeneration. Science2005;308:385–9.
9. Hageman GS, Anderson DH, Johnson LV, et al. A commonhaplotype in the complement regulatory gene factor H (HF1/CFH) predisposes individuals to age-related macular degen-eration. Proc Natl Acad Sci U S A 2005;102:7227–32.
0. Haines JL, Hauser MA, Schmidt S, et al. Complement factorH variant increases the risk of age-related macular degenera-tion. Science 2005;308:419–21.
1. Edwards AO, Ritter R III, Abel KJ, et al. Complement factorH polymorphism and age-related macular degeneration. Sci-ence 2005;308:421–4.
2. Rivera A, Fisher SA, Fritsche LG, et al. HypotheticalLOC387715 is a second major susceptibility gene for age-related macular degeneration, contributing independently ofcomplement factor H to disease risk. Hum Mol Genet 2005;14:3227–36.
3. Yang Z, Camp NJ, Sun H, et al. A variant of the HTRA1 geneincreases susceptibility to age-related macular degeneration.Science 2006;314:992–3.
4. Dewan A, Liu M, Hartman S, et al. HTRA1 promoter poly-morphism in wet age-related macular degeneration. Science
2006;314:989–92.1883

2
3
3
3
3
3
3
3
3
3
3
4
4
4
4
4
Ophthalmology Volume 119, Number 9, September 2012
15. Jakobsdottir J, Conley YP, Weeks DE, et al. Susceptibilitygenes for age-related maculopathy on chromosome 10q26.Am J Hum Genet 2005;77:389–407.
16. Gold B, Merriam JE, Zernant J, et al, AMD Genetics ClinicalStudy Group. Variation in factor B (BF) and complementcomponent 2 (C2) genes is associated with age-related mac-ular degeneration. Nat Genet 2006;38:458–62.
17. Maller J, George S, Purcell S, et al. Common variation in threegenes, including a noncoding variant in CFH, strongly influ-ences risk of age-related macular degeneration. Nat Genet2006;38:1055–9.
18. Maller JB, Fagerness JA, Reynolds RC, et al. Variation incomplement factor 3 is associated with risk of age-relatedmacular degeneration. Nat Genet 2007;39:1200–1.
19. Yates JR, Sepp T, Matharu BK, et al, Genetic Factors in AMDStudy Group. Complement C3 variant and the risk of age-relatedmacular degeneration. N Engl J Med 2007;357:553–61.
20. Fagerness JA, Maller JB, Neale BM, et al. Variation nearcomplement factor I is associated with risk of advanced AMD.Eur J Hum Genet 2009;17:100–4.
21. Neale BM, Fagerness J, Reynolds R, et al. Genome-wideassociation study of advanced age-related macular degenera-tion identifies a role of the hepatic lipase gene (LIPC). ProcNatl Acad Sci U S A 2010;107:7395–400.
22. Chen W, Stambolian D, Edwards AO, et al, Genetic variantsnear TIMP3 and high-density lipoprotein-associated loci in-fluence susceptibility to age-related macular degeneration.Proc Natl Acad Sci U S A 2010;107:7401–6.
23. Sobrin L, Reynolds R, Yu Y, et al. ARMS2/HTRA1 locus canconfer differential susceptibility to the advanced subtypes ofage-related macular degeneration. Am J Ophthalmol 2010;151:345–52.
24. Marth GT, Yu F, Indap AR, et al, 1000 Genomes Project. Thefunctional spectrum of low-frequency coding variation. Ge-nome Biol 2011;12:R84.
25. Yu Y, Bhangale TR, Fagerness J, et al. Common variants nearFRK/COL10A1 and VEGFA are associated with advancedage-related macular degeneration. Hum Mol Genet 2011;20:3699–709.
26. Seddon JM, Santangelo SL, Book K, et al. A genomewidescan for age-related macular degeneration provides evidencefor linkage to several chromosomal regions. Am J Hum Genet2003;73:780–90.
27. Sobrin L, Maller JB, Neale BM, et al. Genetic profile for fivecommon variants associated with age-related macular degen-eration in densely affected families: a novel analytic approach.Eur J Hum Genet 2010;18:496–501.
28. Myocardial Infarction Genetics Consortium. Genome-wideassociation of early-onset myocardial infarction with singlenucleotide polymorphisms and copy number variants. Nat
Genet 2009;41:334–41.Footnotes and Financial Disclosures
Broad Institute, Cambridge, Massachusetts.
3
tM
4
I
5
a
6
I
1884
9. GAIN Collaborative Research Group. New models of collabora-tion in genome-wide association studies: the Genetic AssociationInformation Network. Nat Genet 2007;39:1045–51.
0. Seddon JM, Sharma S, Adelman RA. Evaluation of the clin-ical age-related maculopathy staging system. Ophthalmology2006;113:260–6.
1. Korn JM, Kuruvilla FG, McCarroll SA, et al. Integrated ge-notype calling and association analysis of SNPs, commoncopy number polymorphisms and rare CNVs. Nat Genet 2008;40:1253–60.
2. Complications of Age-Related Macular Degeneration Preven-tion Trial Study Group. The Complications of Age-RelatedMacular Degeneration Prevention Trial (CAPT): rationale,design and methodology. Clin Trials 2004;1:91–107.
3. Price AL, Patterson NJ, Plenge RM, et al. Principal compo-nents analysis corrects for stratification in genome-wide asso-ciation studies. Nat Genet 2006;38:904–9.
4. Seddon JM, Ajani UA, Mitchell BD. Familial aggregation ofage-related maculopathy. Am J Ophthalmol 1997;123:199–206.
5. Klaver CC, Wolfs RC, Assink JJ, et al. Genetic risk ofage-related maculopathy: population-based familial aggrega-tion study. Arch Ophthalmol 1998;116:1646–51.
6. De la Paz MA, Pericak-Vance MA, Haines JL, Seddon JM.Phenotypic heterogeneity in families with age-related maculardegeneration. Am J Ophthalmol 1997;124:331–43.
7. Shuler RK Jr, Schmidt S, Gallins P, et al. Phenotype analysis ofpatients with the risk variant LOC387715 (A69S) in age-relatedmacular degeneration. Am J Ophthalmol 2008;145:303–7.
8. Seddon JM, Reynolds R, Maller J, et al. Prediction model forprevalence and incidence of advanced age-related maculardegeneration based on genetic, demographic, and environmen-tal variables. Invest Ophthalmol Vis Sci 2009;50:2044–53.
9. Seddon JM, Francis PJ, George S, et al. Association of CFHY402H and LOC387715 A69S with progression of age-relatedmacular degeneration. JAMA 2007;297:1793–800.
0. Jones A, Kumar S, Zhang N, et al. Increased expression ofmultifunctional serine protease, HTRA1, in retinal pigmentepithelium induces polypoidal choroidal vasculopathy inmice. Proc Natl Acad Sci U S A 2011;108:14578–83.
1. Ding X, Patel M, Chan CC. Molecular pathology of age-relatedmacular degeneration. Prog Retin Eye Res 2009;28:1–18.
2. An E, Sen S, Park SK, et al. Identification of novel substratesfor the serine protease HTRA1 in the human RPE secretome.Invest Ophthalmol Vis Sci 2010;51:3379–86.
3. Ho L, van Leeuwen R, Witteman JC, et al. Reducing thegenetic risk of age-related macular degeneration with dietaryantioxidants, zinc, and omega-3 fatty acids: the RotterdamStudy. Arch Ophthalmol 2011;129:758–66.
4. Seddon JM, Reynolds R, Yu Y, et al. Risk models for pro-gression to advanced age-related macular degeneration usingdemographic, environmental, genetic, and ocular factors. Oph-
thalmology 2011;118:2203–11.Originally received: September 23, 2011.Final revision: March 7, 2012.Accepted: March 7, 2012.Available online: June 15, 2012. Manuscript no. 2011-1405.
1 Department of Ophthalmology, Massachusetts Eye and Ear Infirmary,Harvard Medical School, Boston, Massachusetts.
2 Center for Human Genetic Research, Massachusetts General Hospital,Boston, Massachusetts, and Program in Medical and Population Genetics,
Ophthalmic Epidemiology and Genetics Service, New England Eye Cen-er, Tufts Medical Center, Tufts University School of Medicine, Boston,
assachusetts.
Department of Bioinformatics and Computational Biology, Genentech,nc, South San Francisco, California.
Center for Human Disease Modeling and Departments of Cell Biologynd Pediatrics, Duke University, Durham, North Carolina.
Department of Ophthalmology, University Paris Est Creteil, Hôpital
ntercommunal de Creteil, Creteil, France.
2
B
FTTTR
SSRsuPnWJRNA(esmMsSpwBSHRMMMtMEI
CJSi
Sobrin et al � Heritability and GWAS of Advanced AMD Subtypes
7 Department of Ophthalmology, Faculté de Médecine Henri Mondor,UPEC, Créteil, France.8 Department Ophthalmology, Department Epidemiology, Erasmus Medi-cal Center, Rotterdam, The Netherlands.9 Department of Ophthalmology, Columbia University, New York, NewYork.10 Centre for Eye Research Australia, University of Melbourne, RoyalVictorian Eye and Ear Hospital, East Melbourne, Victoria, Australia.11 Divisions of Genetics and Rheumatology, Brigham and Women’s Hos-pital, Boston, Massachusetts.12 Ophthalmology & Visual Sciences, Washington University School ofMedicine, and Barnes Retina Institute, St. Louis, Missouri.13 McKusick-Nathans Institute of Genetic Medicine, Department of Oph-thalmology, Wilmer Eye Institute, Johns Hopkins University School ofMedicine, Baltimore, Maryland.14 Department of Neuroscience, Johns Hopkins University School of Med-icine, Baltimore, Maryland.15 Department of Molecular Biology and Genetics and Institut de la Vision,UPMC, Paris, France.16 Center for Vision and Vascular Science, The Queen’s University, Bel-fast, Northern Ireland.17 Immunology Tissue Growth and Repair (ITGR) Human Genetics Group,Genentech, Inc., South San Francisco, California.18 Department Epidemiology, Department Internal Medicine, ErasmusMedical Center, Rotterdam, The Netherlands.19 Department Epidemiology, Erasmus Medical Center, Rotterdam, TheNetherlands.20 Deparment of Ophthalmology and Visual Sciences, Vanderbilt Univer-sity School of Medicine, Nashville, Tennessee.21 Department of Pathology and Cell Biology, Columbia University, NewYork, New York.22 Department of Hygiene and Epidemiology, University of IoanninaSchool of Medicine, Ioannina, Greece.23 Stanford Prevention Research Center, Department of Medicine, andDepartment of Health Research and Policy, Stanford University School ofMedicine, Stanford, California.24 Center for Genetic Epidemiology and Modeling, Institute for ClinicalResearch and Health Policy Studies (ICRHPS), and Tufts Clinical andTranslational Science Institute, Tufts Medical Center, Tufts University
School of Medicine, Boston, Massachusetts. t5 Department of Ophthalmology, Tufts University School of Medicine,oston, Massachusetts.
inancial Disclosure(s):he author(s) have made the following disclosure(s):ushar R. Bhangale - Employee - Genentech, Inc.imothy W. Behrens - Employee - Genentech, Inc.obert R. Graham - Employee - Genentech, Inc.
upported in part by an anonymous donor for the research of Johanna M.eddon; the National Institutes of Health, Bethesda, Maryland (grant nos.:01-EY11309, R01-EY13435, R24-EY017404, and K12-EY16335); Mas-
achusetts Lions Eye Research Fund, Inc., New Bedford, Massachusetts;nrestricted grants and a Career Development Award from Research torevent Blindness, Inc., New York, New York; Foundation Fighting Blind-ess, Owing Mills, Maryland; The Macula Vision Research Foundation,est Conshohocken, Pennsylvania; Kaplen Foundation, Tenafly, New
ersey; Widgeon Point Charitable Foundation, Armonk, New York; Alconesearch Institute, Fort Worth, Texas; Fight for Sight Postdoctoral Award,ew York, New York; National Health & Medical Research Council ofustralia Centre for Clinical Research Excellence, Canberra, Australia
grant no.: 529923, Translational Clinical Research in Major Eye Dis-ases); American Macular Degeneration Foundation, Northampton, Mas-achusetts; and the Macular Degeneration Research Fund of the Ophthal-ic Epidemiology and Genetics Service, New England Eye Center, Tuftsedical Center, Tufts University School of Medicine, Boston, Massachu-
etts. Centre for Eye Research Australia receives Operational Infrastructureupport from the Victoria Government, Victoria, Australia. Funding sup-ort for the NEI Study of Age-Related Macular Degeneration (NEI-AMD)as provided by the National Eye Institute, National Institutes of Health,ethesda, Maryland. Funding support for the Genome-Wide Association ofchizophrenia Study was provided by the National Institute of Mentalealth, Bethesda, Maryland (grant nos.: R01 MH67257, R01 MH59588,01 MH59571, R01 MH59565, R01 MH59587, R01 MH60870, R01H59566, R01 MH59586, R01 MH61675, R01 MH60879, R01H81800, U01 MH46276, U01 MH46289 U01 MH46318, U01H79469, and U01 MH79470). The funding organizations had no role in
he design or conduct of this research. Complications of Age-Relatedacular Degeneration Prevention Trial supported by Grants EY012211,
Y012261, and EY012279 from the National Eye Institute, Nationalnstitutes of Health, Bethesda, Maryland.
orrespondence:ohanna M. Seddon, MD, ScM, Ophthalmic Epidemiology and Geneticservice, Department of Ophthalmology, Tufts Medical Center, 800 Wash-
ngton Street, No. 450, Boston, MA 02111. E-mail: jseddon@
uftsmedicalcenter.org.1885


![Uveitic macular edema: a stepladder treatment paradigm€¦ · of macular edema [1,3–4], this review will focus on uveitic macular edema specifically. Uveitic macular edema Macular](https://img.pdfslide.net/doc/110x75/5ed770e44d676a3f4a7efe51/uveitic-macular-edema-a-stepladder-treatment-paradigm-of-macular-edema-13a4.jpg)