Embed Size (px)
Citation preview
Historical Biology, 2017https://doi.org/10.1080/08912963.2017.1337760
Heritability: the link between development and the microevolution of molar tooth form
P. David Pollya and Orin B. Mockb
aDepartment of Earth and atmospheric sciences, indiana University, Bloomington, iN, Usa; bDepartment of anatomy, Kirksville college of osteopathic Medicine, Kirksville, Mo, Usa
ABSTRACTThe developmental gene expression, morphogenesis, and population variation in mammalian molar teeth has become increasingly well understood, providing a model system for synthesizing evolution and developmental genetics. In this study, we estimated additive genetic covariances in molar shape (G) using parent-offspring regression in Cryptotis parva, the Least Shrew. We found that crown shape had an overall h2 value of 0.34 (±0.08), with higher heritabilities in molar cusps than notches. We compared the genetic covariances to phenotypic (P) and environmental (E) covariances, and to the covariances in crown features expected from the enamel knot developmental cascade (D). We found that G and D were not strongly correlated and that major axes of G (evolutionary lines of least resistance) are better predictors of evolutionary divergences in soricines than is D. We conclude that the enamel knot cascade does impose constraints on the evolution of molar shape, but that it is so permissive that the divergences among soricines (whose last common ancestor lived about 14 million years ago) do not fully explore its confines. Over tens of millions of years, G will be a better predictor of the major axes of evolution in molar shape than D.
© 2017 informa UK limited, trading as taylor & Francis group
KEYWORDSMolars; evolution and development; heritability; soricidae; geometric morphometrics
ARTICLE HISTORYreceived 29 May 2017 accepted 30 May 2017
CONTACT P. David Polly [email protected]
Introduction
Building on foundations laid by Butler (1941), (1956), (1995), studies of mammalian molar teeth have begun to bridge the gap between evolutionary developmental biology and quanti-tative genetics (Jernvall & Jung 2000; Tucker & Sharpe 2004; Polly 2005, 2015; Kavanagh et al. 2007; Gómez-Robles & Polly 2012; Jernvall & Thesleff 2012; Gomes Rodrigues et al. 2013; Jheon et al. 2013; Harjunmaa et al. 2014; Ungar & Hlusko 2016). Interest in the connections between developmental gene expression and quantitative models of variation, selection, and evolution have brought attention to genotype-phenotype maps that involve complex developmental interactions and how these processes constrain variation and influence the course of long-term evolution (Weiss 1993; Weiss & Fullerton 2000; Rice 2002, 2011; Wolf 2002; Klingenberg 2010; Salazar-Ciudad & Jernvall 2010; Goswami et al. 2014; Hlusko et al. 2016). In this paper, we measure the genetic, phenotypic, and developmental covariance structure in the tribosphenic lower molars of the Least shrew (Cryptotis parva) and assess how these three population-level components of variance are related to long-term phylogenetic divergence in molar shape.
Mammalian teeth are a notable example of a system in which the synthesis of molecular development, morphogenesis, adult morphology, and evolution is well underway. We now under-stand how gene products interact in the context of growing epi-thelial and mesenchymal tissues to create the topography of the
adult molar crown and its many cusps, ridges, and basins. A dynamic system of interactions folds the inner enamel epithelium of the tooth germ and expands its mesenchymal base (Butler 1956). Epithelial signaling centers called enamel knots influence the growth of individual cusps, the formation of other knots, and cell proliferation in the epithelium and mesenchyme (Jernvall et al. 1994, 1998; Jernvall & Thesleff 2000, 2012). This system is shared, in its broad aspects, by species with different tooth morphologies. Species differences in gene expression patterns are associated with their differences in molar form (Keränen et al. 1998; Jernvall et al. 2000). Even though the experimental work from which the enamel knot cascade model was developed was based on mice, histological observation (Butler 1956; Marshall & Butler 1966; Berkovitz 1967), empirical observations on patterns of variability in cusps positions (Polly 1998, 2005; Jernvall 2000), and computer-assisted modeling of these developmental param-eters (Salazar-Ciudad & Jernvall 2002, 2010; Salazar-Ciudad et al. 2003; Salazar-Ciudad & Marín-Riera 2013; Marin Riera et al. 2015) all suggest that the enamel knot cascade model is generalizable to explain the phenotypic changes observed during morphogenesis and evolution. These same models have empha-sized that development and evolution are not determined by gene expression alone, but that the changing three-dimensional topog-raphy of the tooth bud creates morphodynamic feedback systems that regulate developmental interactions. The cascade of interac-tions between enamel knots are expected to induce a predictable
2 P. D. POLLY AND O. B. MOCK
morphological differences in other shrew species to see whether phylogenetic divergences in morphology were related to genetic variances and, by extension, to developmental interactions.
Materials and methods
Molar shape data were collected from alcohol-preserved individuals of the Least Shrew, C. parva. These animals were from a long-term breeding colony at the Kirksville College of Osteopathic Medicine (KCOM, Kirksville, Missouri, USA) that has been maintained for more than 40 years (Mock 1982). The original stocks were trapped in central Missouri in the mid 1960s and early 1970s. The animals included in this study were products of up to 30 generations of breeding, including some inbreeding. No selection was applied, but indirect selective effects on molar width have been documented in Peromyscus when wild animals were bred in laboratory conditions (Leamy & Bader 1970). The colony was not maintained with the intention of studying her-itability, and our selection of offspring-parent pairs was limited by the number of carcasses that had been preserved and by the amount of wear on their teeth. In most cases only individuals with unworn teeth were used, but to increase the sample size a few individuals with moderately worn teeth were included when landmarks could be reliably identified. A total of 63 single off-spring- single parent pairs were available for this study.
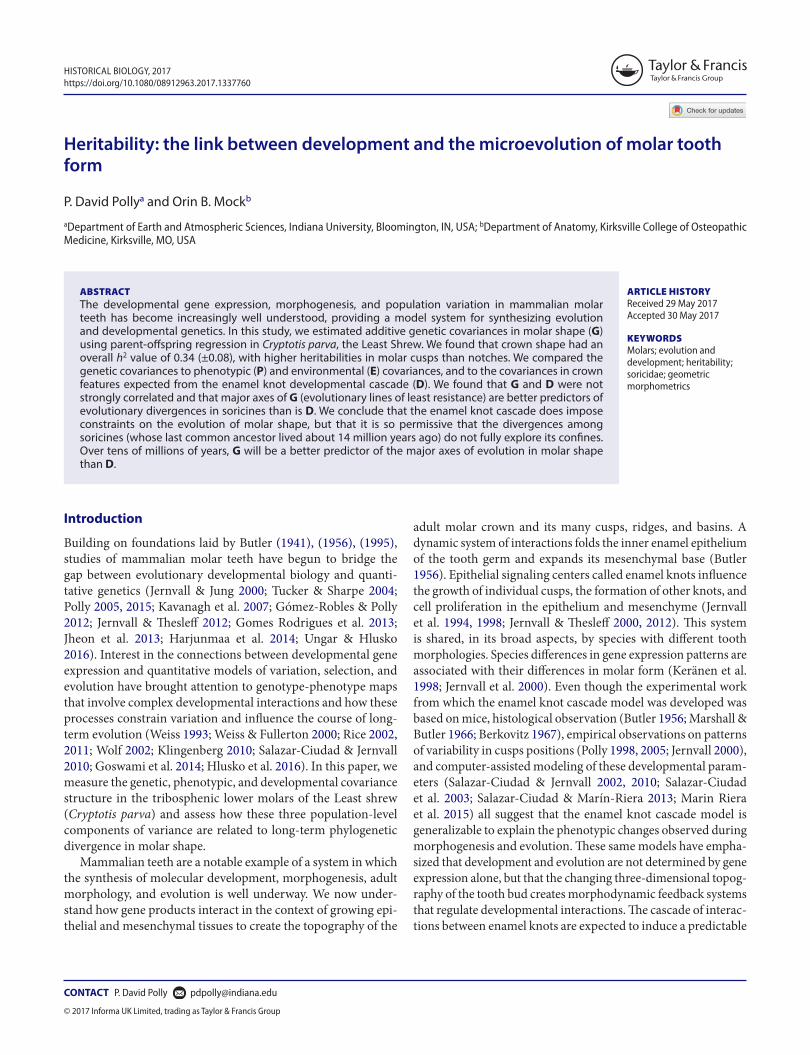
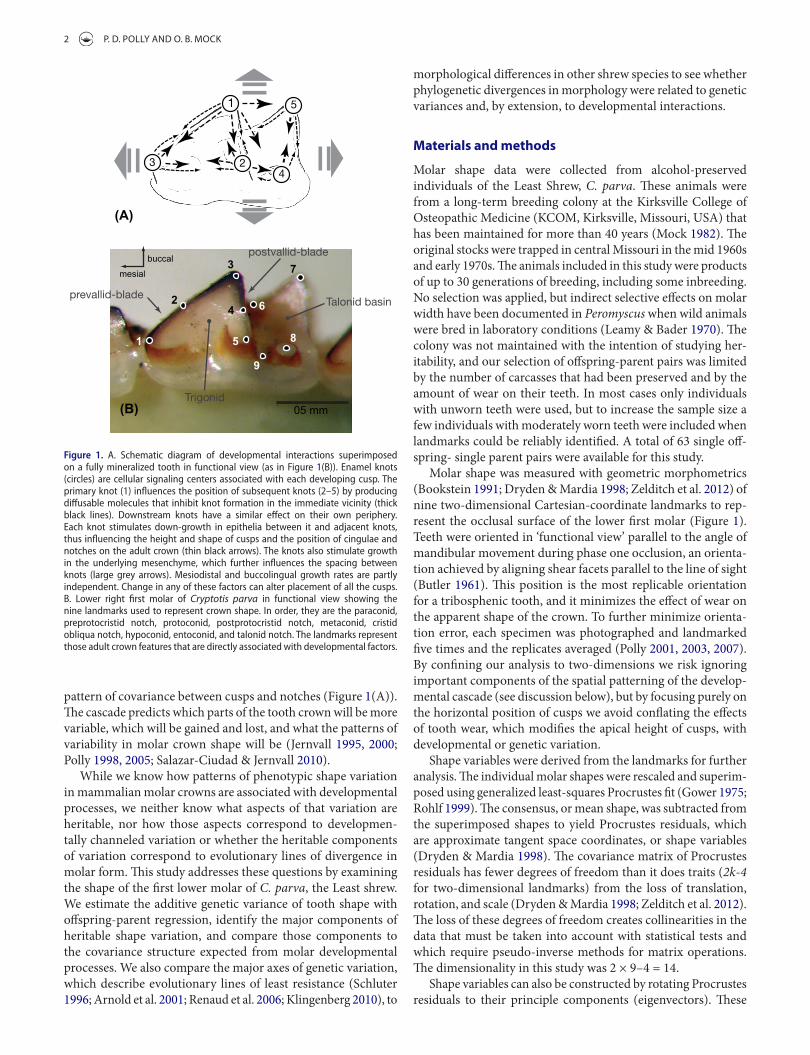
Molar shape was measured with geometric morphometrics (Bookstein 1991; Dryden & Mardia 1998; Zelditch et al. 2012) of nine two-dimensional Cartesian-coordinate landmarks to rep-resent the occlusal surface of the lower first molar (Figure 1). Teeth were oriented in ‘functional view’ parallel to the angle of mandibular movement during phase one occlusion, an orienta-tion achieved by aligning shear facets parallel to the line of sight (Butler 1961). This position is the most replicable orientation for a tribosphenic tooth, and it minimizes the effect of wear on the apparent shape of the crown. To further minimize orienta-tion error, each specimen was photographed and landmarked five times and the replicates averaged (Polly 2001, 2003, 2007). By confining our analysis to two-dimensions we risk ignoring important components of the spatial patterning of the develop-mental cascade (see discussion below), but by focusing purely on the horizontal position of cusps we avoid conflating the effects of tooth wear, which modifies the apical height of cusps, with developmental or genetic variation.
Shape variables were derived from the landmarks for further analysis. The individual molar shapes were rescaled and superim-posed using generalized least-squares Procrustes fit (Gower 1975; Rohlf 1999). The consensus, or mean shape, was subtracted from the superimposed shapes to yield Procrustes residuals, which are approximate tangent space coordinates, or shape variables (Dryden & Mardia 1998). The covariance matrix of Procrustes residuals has fewer degrees of freedom than it does traits (2k-4 for two-dimensional landmarks) from the loss of translation, rotation, and scale (Dryden & Mardia 1998; Zelditch et al. 2012). The loss of these degrees of freedom creates collinearities in the data that must be taken into account with statistical tests and which require pseudo-inverse methods for matrix operations. The dimensionality in this study was 2 × 9–4 = 14.
Shape variables can also be constructed by rotating Procrustes residuals to their principle components (eigenvectors). These
pattern of covariance between cusps and notches (Figure 1(A)). The cascade predicts which parts of the tooth crown will be more variable, which will be gained and lost, and what the patterns of variability in molar crown shape will be (Jernvall 1995, 2000; Polly 1998, 2005; Salazar-Ciudad & Jernvall 2010).
While we know how patterns of phenotypic shape variation in mammalian molar crowns are associated with developmental processes, we neither know what aspects of that variation are heritable, nor how those aspects correspond to developmen-tally channeled variation or whether the heritable components of variation correspond to evolutionary lines of divergence in molar form. This study addresses these questions by examining the shape of the first lower molar of C. parva, the Least shrew. We estimate the additive genetic variance of tooth shape with offspring-parent regression, identify the major components of heritable shape variation, and compare those components to the covariance structure expected from molar developmental processes. We also compare the major axes of genetic variation, which describe evolutionary lines of least resistance (Schluter 1996; Arnold et al. 2001; Renaud et al. 2006; Klingenberg 2010), to
1
2
3
4
5
6
7
8
9
05 mm
mesial
buccal
(A)
(B)
Figure 1. a. schematic diagram of developmental interactions superimposed on a fully mineralized tooth in functional view (as in Figure 1(B)). Enamel knots (circles) are cellular signaling centers associated with each developing cusp. the primary knot (1) influences the position of subsequent knots (2–5) by producing diffusable molecules that inhibit knot formation in the immediate vicinity (thick black lines). Downstream knots have a similar effect on their own periphery. Each knot stimulates down-growth in epithelia between it and adjacent knots, thus influencing the height and shape of cusps and the position of cingulae and notches on the adult crown (thin black arrows). the knots also stimulate growth in the underlying mesenchyme, which further influences the spacing between knots (large grey arrows). Mesiodistal and buccolingual growth rates are partly independent. change in any of these factors can alter placement of all the cusps. B. lower right first molar of Cryptotis parva in functional view showing the nine landmarks used to represent crown shape. in order, they are the paraconid, preprotocristid notch, protoconid, postprotocristid notch, metaconid, cristid obliqua notch, hypoconid, entoconid, and talonid notch. the landmarks represent those adult crown features that are directly associated with developmental factors.
HISTORICAL BIOLOGY 3
PC (principal components) scores have the advantage of being uncorrelated with one another and inhabiting a shape morphos-pace with dimensionality equal to the degrees of freedom (Rohlf 1993; Dryden & Mardia 1998). If R is the matrix of Procrustes residuals and P is its covariance matrix (the phenotypic covar-iance matrix), then UWV = SVD[P], where U is the matrix of eigenvectors of P, W is a diagonal matrix of eigenvalues, and V is the conjugate transpose of U. PC scores are obtained by R.U. The PC score shape variables are equivalent to the Procrustes residuals in all respects except their coordinate system has been rotated, which means that virtually all comparisons described in this paper can be done on either the Procrustes or the PC shape variables (Klingenberg & Leamy 2001). To make direct compari-sons between the two coordinate systems – for example, to com-pare a genetic covariance matrix estimated from the Procrustes coordinates with one estimated from PC scores – the U matrix must be used to rotate the data to the proper coordinate system.
Quantitative genetic parameters were estimated using off-spring-parent regression. The additive genetic covariance matrix G is
where RP is the matrix of parent Procrustes shape variables and RO is the matrix of corresponding offspring shape variables (Lynch & Walsh 1998; Arnold & Phillips 1999). The traits were the eighteen Procrustes residuals. G can also be estimated from PC shape variables (Klingenberg & Leamy 2001), which should be identical to the estimate based on Procrustes shape variables except for rotation of the coordinate system described above. The phenotypic covariance matrix (P) is estimated from the Procrustes residuals of the parent sample and the environmental covariance matrix E is P-G (Lynch & Walsh 1998).
An overall estimate of heritability (h2) is h2 = 2 VA/VP, where VA is the additive genetic variance and VP is the phenotypic variance, where the multiplier 2 is necessary because our esti-mate was made from the covariances between one parent and one offspring (Falconer & Mackay 1996; Lynch & Walsh 1998). Thus h2 = 2 tr[G]/tr[P], where tr is the trace of the covariance matrix. Note that this h2 represents a sort of average heritability for shape variation that is inherently multivariate (Klingenberg & Leamy 2001; Klingenberg 2003; Klingenberg & Monteiro 2005). Heritability of individual components or crown features could be either higher or lower than the overall h2.
Standard errors (SE) for G and h2 were estimated by boot-strap (Manly 2007; Kowalewski & Novack-Gottshall 2010). One thousand random samples of offspring-parent pairs were selected with replacement, and the various statistics recalculated. SE is the standard deviation of the resulting values.
A developmental covariance matrix for molar shape (D) was estimated using the modeling procedure described by Polly (2005), which is based on the enamel knot cascade and subse-quent epithelial growth in mammal teeth (Jernvall et al. 1994, 1998; Jernvall & Thesleff 2000, 2012). The model generates the nine molar landmarks (Figure 1) as a sequence of developmental events, each with random noise of similar magnitude as found in the KCOM sample of C. parva teeth. In the mode, the proto-conid cusp (Landmark 3) is treated as the fixed starting point of the developmental sequence because it represents the position
(1)Cov[
��, �
�
]
,
of the primary enamel knot in real tooth development (Jernvall et al. 1994, 1998). Paraconid and metaconid cusps (Landmarks 1 and 5), which are formed by the next enamel knots in the cas-cade, are positioned with random vectors whose distributions of angles and lengths were derived from the KCOM sample. The positions of the entoconid and hypoconid (Landmarks 4 and 5), which are controlled by enamel knots whose position is influ-enced by the metaconid enamel knot, were similarly chosen by random vectors extending from the position of the metaconid. The notches between cusps (Landmarks 2, 4, 6, and 9) form from down-growth of epithelium, so their positions were selected ran-domly based on the locations of their two adjacent cusps. The result is a set of nine landmarks, the positions of which covary according to this hierarchy of development. To compare this the-oretical developmental covariance structure to real tooth shapes, the modeled teeth were Procrustes superimposed along with the KCOM sample (see above). Superimposition redistributes the variance across landmarks, so the position of the protoconid appears to be variable in the superimposed sample even though it technically is not. The redistribution of variance does not affect comparisons of shape variation (Rohlf 1999; Klingenberg 2013; Bookstein 2016).
The shape variation associated with P, G, E, and D were mod-eled as shape deformations. P and G were each decomposed into orthogonal PC axes using singular-value decomposition (see above). Each of the components in the U matrix represents a por-tion of the total additive or phenotypic variance and covariance that is uncorrelated with other axes, and the singular values W represent the variance associated with each component. Shapes were modeled by multiplying the relevant column of U by the position along the axis and adding the vector of consensus values (Rohlf 1993; Dryden & Mardia 1998). Models were depicted as thin-plate spline deformations from the consensus (Bookstein 1989; Rohlf 1993). Each component was modeled between the values of −0.1 and 0.1, about two orders of magnitude greater than the actual variance, so that shape patterns were clearly vis-ible in the plots.
Comparative shape data from other 12 shrew taxa were com-pared to the shape variance associated with G, P, E, and D to evaluate the contribution of genetic and developmental variance to phylogenetic divergence. Museum samples were obtained for Cryptotis goldmani from Oxaca, Mexico (n = 6); C. goodwini from Guatamala (n = 9); C. gracilis from Costa Rica (n = 10); C. magna from Oxaca; Mexico (n = 8); C. mexicana from Oxaca, Mexico (n = 8); Blarina brevicauda brevicauda from Ontario, Canada (n = 14); B. b. manitobensis from Manitoba, Canada (n = 8); Sorex antinorii from Haslital, Switzerland (n = 21); S. ara-neus from Alice Holt Forest, England (n = 33); S. coronatus from Vercors, France (n = 9); S. granarius from Avila, Spain (n = 6); and S. samniticus from Abruzzo, Italy (n = 11). The same data collection procedure was used and mean taxon shapes estimated as the consensus of each sample. S is the covariance matrix of the species means, which contains the evolutionary covariances in shape. Some comparisons were made by projecting the C. parva specimens from which G and P were estimated and the shapes generated by the developmental model from which D was esti-mated into the PC morphospace of these 12 species (see above).
The statistical significance of matrix correlations between covariance matrices was tested with Mantel test (Mantel 1967;
4 P. D. POLLY AND O. B. MOCK
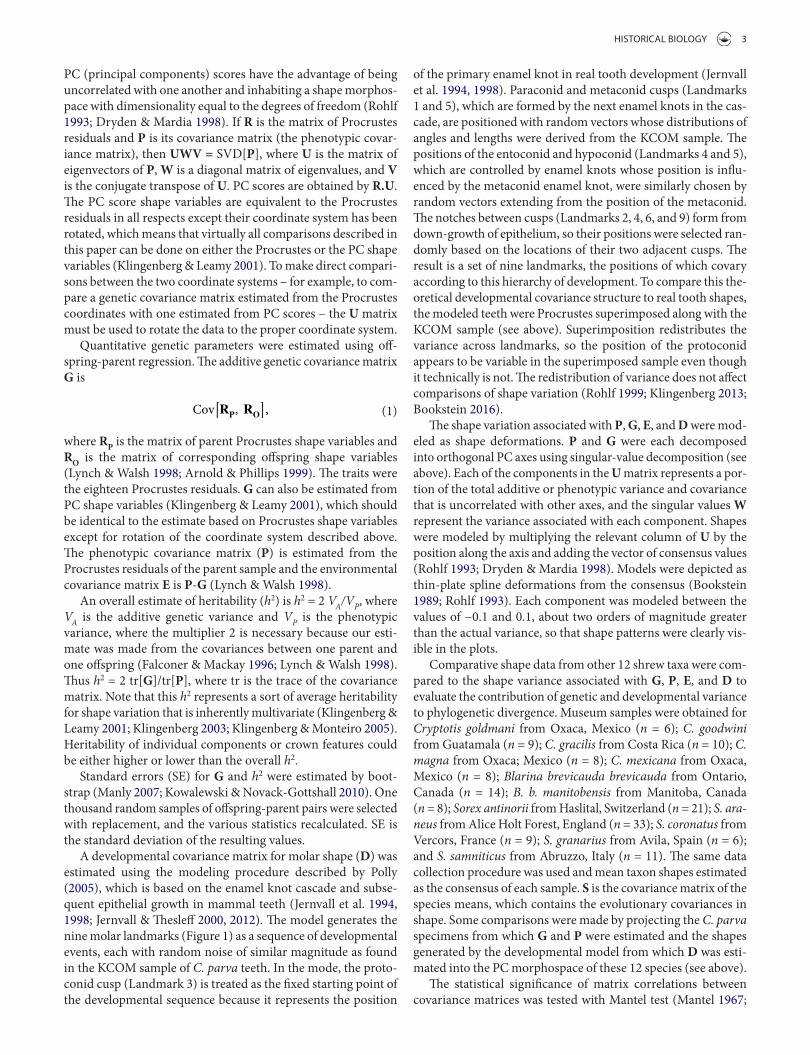
that P (phenotypic covariance) is the sum of G (genetic covari-ance) and E (environmental covariance), all three of which were derived from the KCOM colony of C. parva. The other two matri-ces (S, species covariances; D, developmental covariances) were derived independently.
The S matrix measures the evolutionary covariances among shrew species. Its first PC consists of mesiodistal elongation of the trigonid and buccolingual widening of the talonid. The sec-ond PC describes proportional changes length of the prevallid blade between the paraconid (Landmark 1) and protoconid (Landmark 2) relative to the postvallid blade between protoco-nid and metaconid (Landmark 5), which is correlated with the width of the talonid basin. Both factors correspond to increased sectorial morphology toward the positive end of the PC (thin black lines).
The P matrix measures phenotypic covariances within C. parva (specifically among the individuals of the parent genera-tion of the KCOM sample). Its first axis consists of mesiodistal lengthening of the trigonid correlated with shortening of the
Cheverud et al. 1989) including the diagonal elements as recom-mended for geometric morphometric datasets (Klingenberg & McIntyre 1998). Angles between eigevectors (PC axes) of covar-iance matrices were calculated as arccos[abs[ua
T ub], where abs is the absolute value, ua and ub are eigenvectors of matrices a, b, and T is transpose.
The amount of among-species variance explained by the first two eigenvectors (PC axes) of G, P, E, and D (R2) was estimated by projecting the scores of S onto the first two axes of each of the four covariance matrices, calculating the mean sum of squares of the projected points and dividing by the mean sum of squares of the full multivariate set of scores.
Results
Evolutionary, genetic, environmental, and developmental shape variation
The variation in shape associated with each of the five covariance matrices have some parallels in their major axes (Figure 2). Note
Figure 2. scree plots showing the proportion of variance explained by each of the Pcs of the five covariance matrices (first column), along with shape models for the first two Pcs (second and third columns). the landmarks on each model correspond to those in Figure 1.Notes: thick light grey lines represent the shape at the negative end of the Pc and thin black lines represent the shape at the positive end (see Figure 3(B)).
HISTORICAL BIOLOGY 5
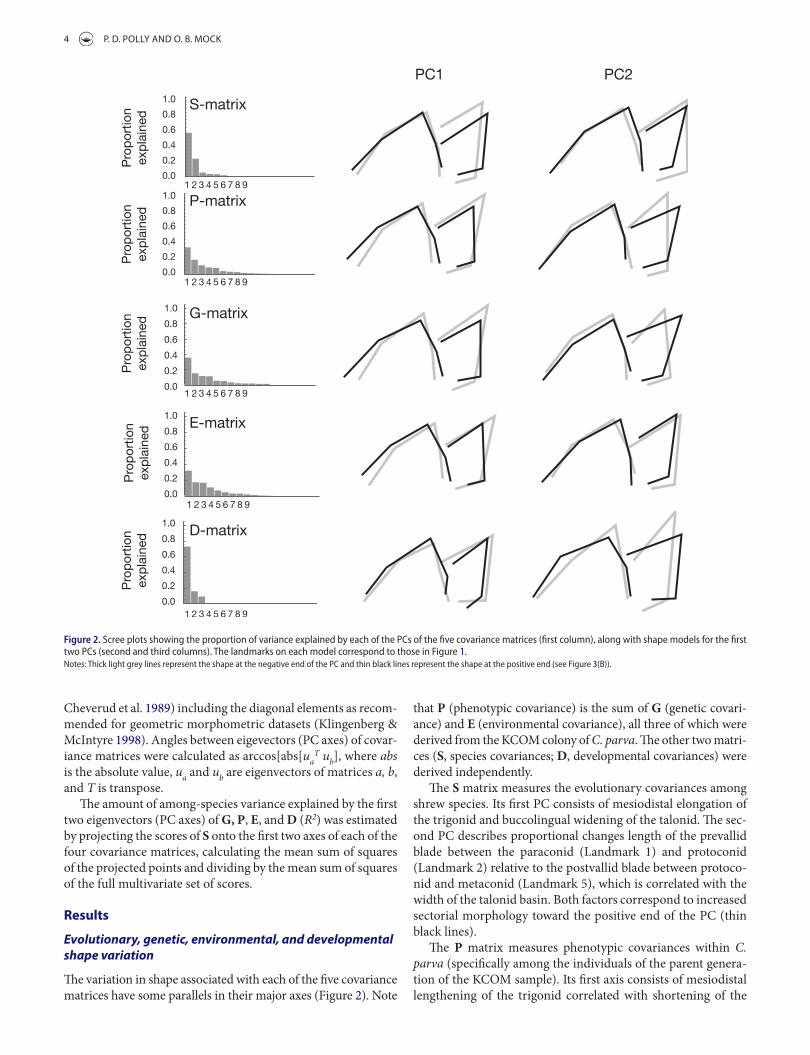
The heritabilities of positions of the individual crown features varied considerably. Cusp features had the highest h2 values, with a mean of 0.40, whereas notches had a mean of 0.12 (Figure 3(A)). Additive covariances among cusps were also higher with a mean of 0.000040 compared to 0.000020 among notch features (Figure 3(C)). Mean additive covariance between cusp and notch features was intermediate at 0.000027.
Correlations between S, G, P, E, and D and evolutionary lines of least resistance
All five matrices were significantly correlated (Mantel test p-val-ues <0.02 for all comparisons), but the magnitude of the corre-lation varied substantially from 0.97 (P and E) to 0.16 (D with S and G) (Table 1). Phenotypic covariances (P) were generally good predictors of genetic covariances (G; R = 0.73). Interestingly, the genetic and developmental covariance structures had lower correlations with the evolutionary covariances (S) than did the phenotypic and environmental covariances.
Because matrix correlation is a blunt instrument that does not assess whether covariance matrices share any common patterns, we also measured the relationships using vector angles between their major axes (Cheverud 1982; Klingenberg & McIntyre 1998; Goswami & Polly 2010). The major axes of each covari-ance matrix its principal components axes (eigenvectors), and the angle between eigenvectors from two covariance matrices measures the correlation between those particular factors. The
talonid basin in the same direction. The second P axis consists of buccolingual narrowing of the talonid basin and proportional shortening of the postvallid blade relative to the prevallid.
The G matrix measures the additive genetic covariances between parents and offspring in C. parva. The first G axis describes mesiodistal expansion of the trigonid relative to the talonid (similar in most respects to the first P axis). The sec-ond axis describes shortening of the postvallid blade relative to the prevallid and reorientation of the talonid basin into a more mesiodistal direction.
The E matrix measures non-genetic (or at least non-addi-tive) covariances in C. parva. The first E axis, similar to P and G, describes mesiodistal elongation of the trigonid relative to the talonid. The second axis describes proportional shortening of the postvallid blade and relative change in the angle of the talonid basin.
The D matrix describes the expected covariances that arise from the developmental cascade of enamel knot formation and epithelial growth. The first D axis describes the relative posi-tions of the notch landmarks relative to the cusps (which would, in principle, be driven primarily by changes in the epithelial growth). The second developmental axis describes buccolingual widening of the tooth (which would be driven by the placements of the second generation enamel knots relative to the protoco-nid knot). Developmental covariance patterns derived from our model are discussed in greater detail in Polly (2005).
Genetic variance of molar shape
The overall heritability (h2) of crown shape was 0.34 (±0.08), with VA (tr[G]) = 0.0094 (±0.00023) and VP (tr[P]) = 0.0057 (±0.00041). Note that the units of variance in geometric shape analysis are Procrustes units, which are arbitrarily determined by scaling all shapes to unit size and are thus comparable in magnitude to one another but not to other studies.
(A)
(B) (C)
Figure 3. a. Heritabilities (h2) of individual landmark coordinates. B. Diagrammatic rendering of the x and y coordinates of the nine landmarks for reference. c. Matrix showing in black those G matrix cells that have genetic variances or covariances that are significantly greater than zero.Notes: Diagonal elements are genetic variances and off-diagonal elements are genetic covariances. Note that genetic variance, like ordinary variance, is difficult to ascribe to particular landmarks in Procrustes superimposed data. Heritabilities should therefore be interpreted as the heritable relationship between that coordinate and all others. For example, one could argue that position of the protoconid (landmark 3) is not heritable per se because it marks the beginning of the developmental cascade, but that its y-axis position relative to the rest of the tooth is highly heritable.
Table 1. Matrix correlations between S, P, G, E, and D.
Note: all correlations are statistically greater than zero.
P G E D0.51 0.30 0.52 0.16 S
0.73 0.97 0.35 P0.53 0.16 G
0.37 D
6 P. D. POLLY AND O. B. MOCK
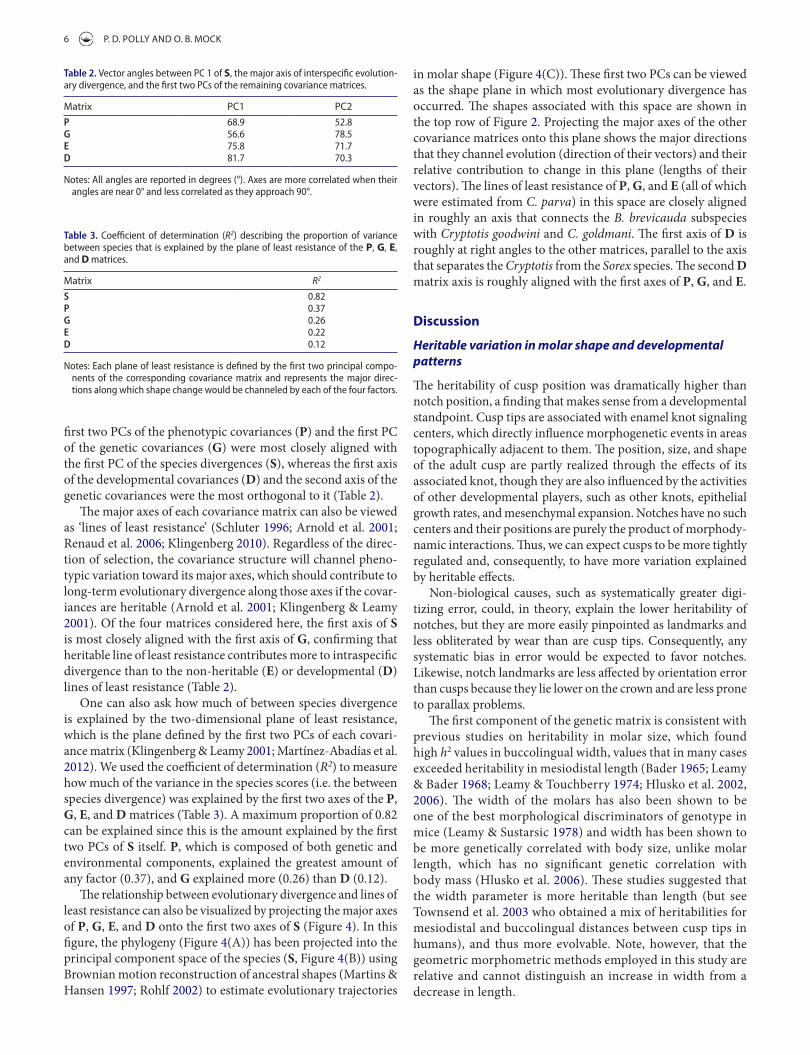
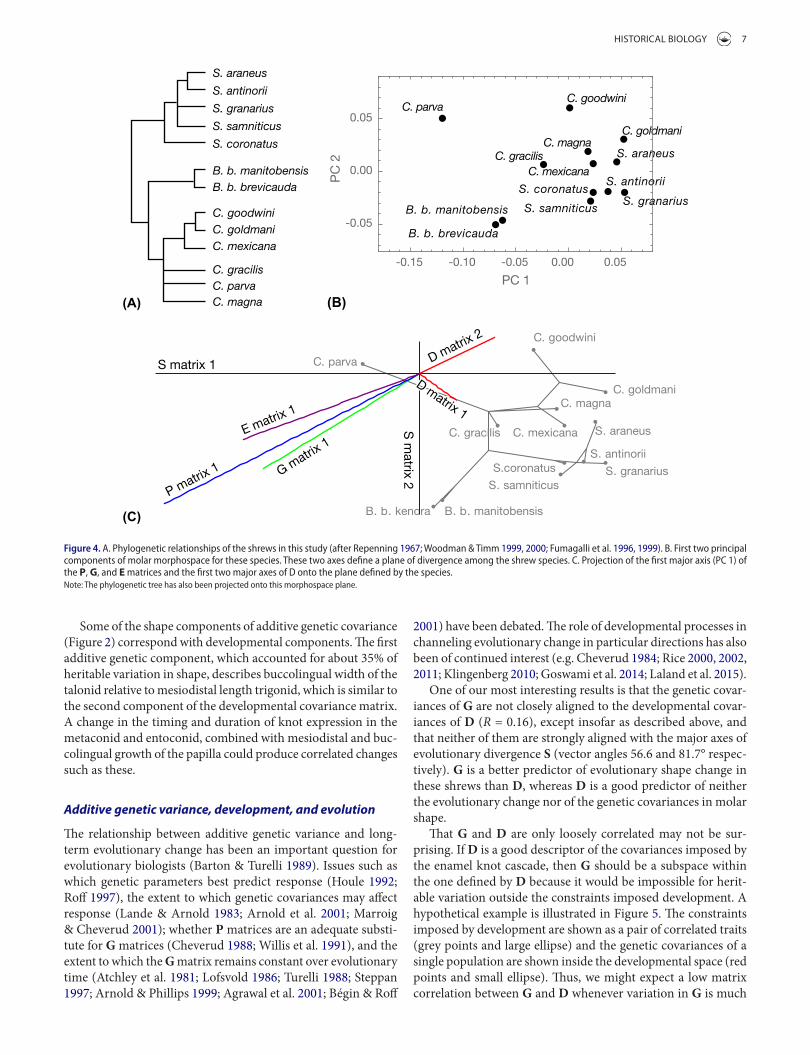
in molar shape (Figure 4(C)). These first two PCs can be viewed as the shape plane in which most evolutionary divergence has occurred. The shapes associated with this space are shown in the top row of Figure 2. Projecting the major axes of the other covariance matrices onto this plane shows the major directions that they channel evolution (direction of their vectors) and their relative contribution to change in this plane (lengths of their vectors). The lines of least resistance of P, G, and E (all of which were estimated from C. parva) in this space are closely aligned in roughly an axis that connects the B. brevicauda subspecies with Cryptotis goodwini and C. goldmani. The first axis of D is roughly at right angles to the other matrices, parallel to the axis that separates the Cryptotis from the Sorex species. The second D matrix axis is roughly aligned with the first axes of P, G, and E.
Discussion
Heritable variation in molar shape and developmental patterns
The heritability of cusp position was dramatically higher than notch position, a finding that makes sense from a developmental standpoint. Cusp tips are associated with enamel knot signaling centers, which directly influence morphogenetic events in areas topographically adjacent to them. The position, size, and shape of the adult cusp are partly realized through the effects of its associated knot, though they are also influenced by the activities of other developmental players, such as other knots, epithelial growth rates, and mesenchymal expansion. Notches have no such centers and their positions are purely the product of morphody-namic interactions. Thus, we can expect cusps to be more tightly regulated and, consequently, to have more variation explained by heritable effects.
Non-biological causes, such as systematically greater digi-tizing error, could, in theory, explain the lower heritability of notches, but they are more easily pinpointed as landmarks and less obliterated by wear than are cusp tips. Consequently, any systematic bias in error would be expected to favor notches. Likewise, notch landmarks are less affected by orientation error than cusps because they lie lower on the crown and are less prone to parallax problems.
The first component of the genetic matrix is consistent with previous studies on heritability in molar size, which found high h2 values in buccolingual width, values that in many cases exceeded heritability in mesiodistal length (Bader 1965; Leamy & Bader 1968; Leamy & Touchberry 1974; Hlusko et al. 2002, 2006). The width of the molars has also been shown to be one of the best morphological discriminators of genotype in mice (Leamy & Sustarsic 1978) and width has been shown to be more genetically correlated with body size, unlike molar length, which has no significant genetic correlation with body mass (Hlusko et al. 2006). These studies suggested that the width parameter is more heritable than length (but see Townsend et al. 2003 who obtained a mix of heritabilities for mesiodistal and buccolingual distances between cusp tips in humans), and thus more evolvable. Note, however, that the geometric morphometric methods employed in this study are relative and cannot distinguish an increase in width from a decrease in length.
first two PCs of the phenotypic covariances (P) and the first PC of the genetic covariances (G) were most closely aligned with the first PC of the species divergences (S), whereas the first axis of the developmental covariances (D) and the second axis of the genetic covariances were the most orthogonal to it (Table 2).
The major axes of each covariance matrix can also be viewed as ‘lines of least resistance’ (Schluter 1996; Arnold et al. 2001; Renaud et al. 2006; Klingenberg 2010). Regardless of the direc-tion of selection, the covariance structure will channel pheno-typic variation toward its major axes, which should contribute to long-term evolutionary divergence along those axes if the covar-iances are heritable (Arnold et al. 2001; Klingenberg & Leamy 2001). Of the four matrices considered here, the first axis of S is most closely aligned with the first axis of G, confirming that heritable line of least resistance contributes more to intraspecific divergence than to the non-heritable (E) or developmental (D) lines of least resistance (Table 2).
One can also ask how much of between species divergence is explained by the two-dimensional plane of least resistance, which is the plane defined by the first two PCs of each covari-ance matrix (Klingenberg & Leamy 2001; Martínez-Abadías et al. 2012). We used the coefficient of determination (R2) to measure how much of the variance in the species scores (i.e. the between species divergence) was explained by the first two axes of the P, G, E, and D matrices (Table 3). A maximum proportion of 0.82 can be explained since this is the amount explained by the first two PCs of S itself. P, which is composed of both genetic and environmental components, explained the greatest amount of any factor (0.37), and G explained more (0.26) than D (0.12).
The relationship between evolutionary divergence and lines of least resistance can also be visualized by projecting the major axes of P, G, E, and D onto the first two axes of S (Figure 4). In this figure, the phylogeny (Figure 4(A)) has been projected into the principal component space of the species (S, Figure 4(B)) using Brownian motion reconstruction of ancestral shapes (Martins & Hansen 1997; Rohlf 2002) to estimate evolutionary trajectories
Table 2. Vector angles between Pc 1 of S, the major axis of interspecific evolution-ary divergence, and the first two Pcs of the remaining covariance matrices.
Notes: all angles are reported in degrees (°). axes are more correlated when their angles are near 0° and less correlated as they approach 90°.
Matrix PC1 PC2P 68.9 52.8G 56.6 78.5E 75.8 71.7D 81.7 70.3
Table 3. coefficient of determination (R2) describing the proportion of variance between species that is explained by the plane of least resistance of the P, G, E, and D matrices.
Notes: Each plane of least resistance is defined by the first two principal compo-nents of the corresponding covariance matrix and represents the major direc-tions along which shape change would be channeled by each of the four factors.
Matrix R2
S 0.82P 0.37G 0.26E 0.22D 0.12
HISTORICAL BIOLOGY 7
2001) have been debated. The role of developmental processes in channeling evolutionary change in particular directions has also been of continued interest (e.g. Cheverud 1984; Rice 2000, 2002, 2011; Klingenberg 2010; Goswami et al. 2014; Laland et al. 2015).
One of our most interesting results is that the genetic covar-iances of G are not closely aligned to the developmental covar-iances of D (R = 0.16), except insofar as described above, and that neither of them are strongly aligned with the major axes of evolutionary divergence S (vector angles 56.6 and 81.7° respec-tively). G is a better predictor of evolutionary shape change in these shrews than D, whereas D is a good predictor of neither the evolutionary change nor of the genetic covariances in molar shape.
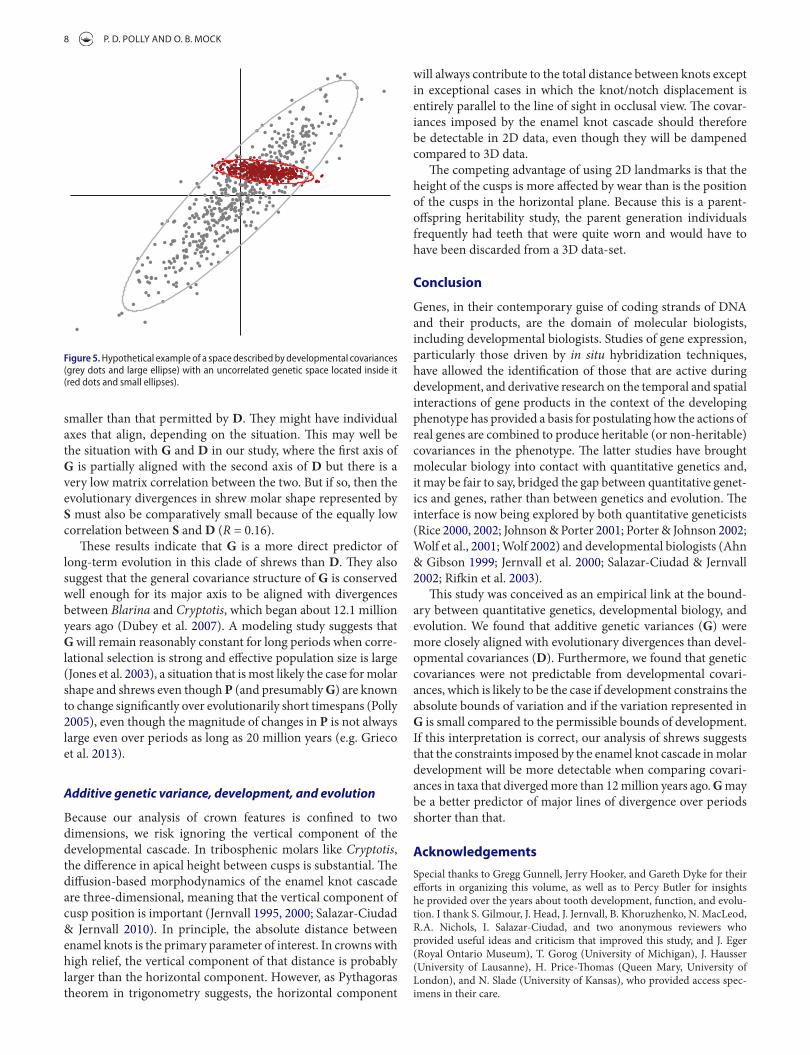
That G and D are only loosely correlated may not be sur-prising. If D is a good descriptor of the covariances imposed by the enamel knot cascade, then G should be a subspace within the one defined by D because it would be impossible for herit-able variation outside the constraints imposed development. A hypothetical example is illustrated in Figure 5. The constraints imposed by development are shown as a pair of correlated traits (grey points and large ellipse) and the genetic covariances of a single population are shown inside the developmental space (red points and small ellipse). Thus, we might expect a low matrix correlation between G and D whenever variation in G is much
Some of the shape components of additive genetic covariance (Figure 2) correspond with developmental components. The first additive genetic component, which accounted for about 35% of heritable variation in shape, describes buccolingual width of the talonid relative to mesiodistal length trigonid, which is similar to the second component of the developmental covariance matrix. A change in the timing and duration of knot expression in the metaconid and entoconid, combined with mesiodistal and buc-colingual growth of the papilla could produce correlated changes such as these.
Additive genetic variance, development, and evolution
The relationship between additive genetic variance and long-term evolutionary change has been an important question for evolutionary biologists (Barton & Turelli 1989). Issues such as which genetic parameters best predict response (Houle 1992; Roff 1997), the extent to which genetic covariances may affect response (Lande & Arnold 1983; Arnold et al. 2001; Marroig & Cheverud 2001); whether P matrices are an adequate substi-tute for G matrices (Cheverud 1988; Willis et al. 1991), and the extent to which the G matrix remains constant over evolutionary time (Atchley et al. 1981; Lofsvold 1986; Turelli 1988; Steppan 1997; Arnold & Phillips 1999; Agrawal et al. 2001; Bégin & Roff
(A) (B)
(C)
Figure 4. a. Phylogenetic relationships of the shrews in this study (after repenning 1967; Woodman & timm 1999, 2000; Fumagalli et al. 1996, 1999). B. First two principal components of molar morphospace for these species. these two axes define a plane of divergence among the shrew species. c. Projection of the first major axis (Pc 1) of the P, G, and E matrices and the first two major axes of D onto the plane defined by the species.Note: the phylogenetic tree has also been projected onto this morphospace plane.
8 P. D. POLLY AND O. B. MOCK
will always contribute to the total distance between knots except in exceptional cases in which the knot/notch displacement is entirely parallel to the line of sight in occlusal view. The covar-iances imposed by the enamel knot cascade should therefore be detectable in 2D data, even though they will be dampened compared to 3D data.
The competing advantage of using 2D landmarks is that the height of the cusps is more affected by wear than is the position of the cusps in the horizontal plane. Because this is a parent- offspring heritability study, the parent generation individuals frequently had teeth that were quite worn and would have to have been discarded from a 3D data-set.
Conclusion
Genes, in their contemporary guise of coding strands of DNA and their products, are the domain of molecular biologists, including developmental biologists. Studies of gene expression, particularly those driven by in situ hybridization techniques, have allowed the identification of those that are active during development, and derivative research on the temporal and spatial interactions of gene products in the context of the developing phenotype has provided a basis for postulating how the actions of real genes are combined to produce heritable (or non-heritable) covariances in the phenotype. The latter studies have brought molecular biology into contact with quantitative genetics and, it may be fair to say, bridged the gap between quantitative genet-ics and genes, rather than between genetics and evolution. The interface is now being explored by both quantitative geneticists (Rice 2000, 2002; Johnson & Porter 2001; Porter & Johnson 2002; Wolf et al., 2001; Wolf 2002) and developmental biologists (Ahn & Gibson 1999; Jernvall et al. 2000; Salazar-Ciudad & Jernvall 2002; Rifkin et al. 2003).
This study was conceived as an empirical link at the bound-ary between quantitative genetics, developmental biology, and evolution. We found that additive genetic variances (G) were more closely aligned with evolutionary divergences than devel-opmental covariances (D). Furthermore, we found that genetic covariances were not predictable from developmental covari-ances, which is likely to be the case if development constrains the absolute bounds of variation and if the variation represented in G is small compared to the permissible bounds of development. If this interpretation is correct, our analysis of shrews suggests that the constraints imposed by the enamel knot cascade in molar development will be more detectable when comparing covari-ances in taxa that diverged more than 12 million years ago. G may be a better predictor of major lines of divergence over periods shorter than that.
AcknowledgementsSpecial thanks to Gregg Gunnell, Jerry Hooker, and Gareth Dyke for their efforts in organizing this volume, as well as to Percy Butler for insights he provided over the years about tooth development, function, and evolu-tion. I thank S. Gilmour, J. Head, J. Jernvall, B. Khoruzhenko, N. MacLeod, R.A. Nichols, I. Salazar-Ciudad, and two anonymous reviewers who provided useful ideas and criticism that improved this study, and J. Eger (Royal Ontario Museum), T. Gorog (University of Michigan), J. Hausser (University of Lausanne), H. Price-Thomas (Queen Mary, University of London), and N. Slade (University of Kansas), who provided access spec-imens in their care.
smaller than that permitted by D. They might have individual axes that align, depending on the situation. This may well be the situation with G and D in our study, where the first axis of G is partially aligned with the second axis of D but there is a very low matrix correlation between the two. But if so, then the evolutionary divergences in shrew molar shape represented by S must also be comparatively small because of the equally low correlation between S and D (R = 0.16).
These results indicate that G is a more direct predictor of long-term evolution in this clade of shrews than D. They also suggest that the general covariance structure of G is conserved well enough for its major axis to be aligned with divergences between Blarina and Cryptotis, which began about 12.1 million years ago (Dubey et al. 2007). A modeling study suggests that G will remain reasonably constant for long periods when corre-lational selection is strong and effective population size is large (Jones et al. 2003), a situation that is most likely the case for molar shape and shrews even though P (and presumably G) are known to change significantly over evolutionarily short timespans (Polly 2005), even though the magnitude of changes in P is not always large even over periods as long as 20 million years (e.g. Grieco et al. 2013).
Additive genetic variance, development, and evolution
Because our analysis of crown features is confined to two dimensions, we risk ignoring the vertical component of the developmental cascade. In tribosphenic molars like Cryptotis, the difference in apical height between cusps is substantial. The diffusion-based morphodynamics of the enamel knot cascade are three-dimensional, meaning that the vertical component of cusp position is important (Jernvall 1995, 2000; Salazar-Ciudad & Jernvall 2010). In principle, the absolute distance between enamel knots is the primary parameter of interest. In crowns with high relief, the vertical component of that distance is probably larger than the horizontal component. However, as Pythagoras theorem in trigonometry suggests, the horizontal component
Figure 5. Hypothetical example of a space described by developmental covariances (grey dots and large ellipse) with an uncorrelated genetic space located inside it (red dots and small ellipses).
HISTORICAL BIOLOGY 9
with S. samniticus, as inferred from mtDNA sequences. Hereditas. 125:191–199.
Fumagalli L, Taberlet P, Stewart DT, Gielly L, Hausser J, Vogel P. 1999. Molecular phylogeny and evolution of Sorex shrews (Soricidae: Insectivora) inferred from mitochondrial DNA sequence data. Mol Phylog Evol. 11:222–235.
Gomes Rodrigues H, Renaud S, Charles C, Le Poul Y, Solé F, Aguilar JP, Michaux J, Tafforeau P, Headon D, Jernvall J, Viriot L. 2013. Roles of dental development and adaptation in rodent evolution. Nat Comm. 4:2504.
Gómez-Robles A, Polly PD. 2012. Morphological integration in the hominin dentition: evolutionary, developmental, and functional factors. Evolution. 66:1024–1043.
Goswami A, Polly PD. 2010. Methods for studying morphological integration, modularity and covariance evolution. In: Alroy J, Hunt G, editors. Quantitative methods in paleobiology. p. 213–243. Paleontological Society Short Course; The Paleontological Society Papers, 16, 2010 Oct 30.
Goswami A, Smaers JB, Soligo C, Polly PD. 2014. The macroevolutionary consequences of phenotypic integration: from development to deep time. Phil Trans R Soc B. 369:20130254.
Gower JC. 1975. Generalized procrustes analysis. Psychometrika. 40:33–51.
Grieco TM, Rizk OT, Hlusko LJ. 2013. A modular framework characterizes micro- and macroevolution of old world monkey dentitions. Evolution. 67:241–259.
Harjunmaa E, Seidel K, Häkkinen T, Renvoisé E, Corfe IJ, Kallonen A, Zhang ZQ, Evans AR, Mikkola ML, Salazar-Ciudad I, Klein OD. 2014. Replaying evolutionary transitions from the dental fossil record. Nature. 512:44–48.
Hlusko LJ, Weiss KM, Mahaney MC. 2002. Statistical genetic comparison of two techniques for assessing molar crown size in pedigreed baboons. Am J Phys Anthro. 117:182–189.
Hlusko LJ, Lease LR, Mahaney MC. 2006. Evolution of genetically correlated traits: tooth size and body size in baboons. Am J Phys Anthrop. 131:420–427.
Hlusko LJ, Schmitt CA, Monson TA, Brasil MF, Mahaney MC. 2016. The integration of quantitative genetics, paleontology, and neontology reveals genetic underpinnings of primate dental evolution. Proc Natl Acad Sci. 113:9262–9267.
Houle D. 1992. Comparing evolvability and variability of quantitative traits. Genetics. 130:195–204.
Jernvall J. 1995. Mammalian molar cusp patterns. Acta Zool Fenn. 198: 1–61.
Jernvall J. 2000. Linking development with generation of novelty in mammalian teeth. Proc Natl Acad Sci USA. 97:2641–2645.
Jernvall J, Jung HS. 2000. Genotype, phenotype, and developmental biology of molar tooth characters. Yearb Phys Anthro. 43:171–190.
Jernvall J, Thesleff I. 2000. Reiterative signaling and patterning during mammalian tooth morphogenesis. Mech Devel. 92:19–29.
Jernvall J, Thesleff I. 2012. Tooth shape formation and tooth renewal: evolving with the same signals. Development. 139:3487–3497.
Jernvall J, Kettunen P, Karavanova I, Martin LB, Thesleff I. 1994. Evidence for the role of the enamel knot as a control center in mammalian tooth cusp formation: non-dividing cells express growth stimulating Fgf-4 gene. Int J Dev Biol. 38:463–469.
Jernvall J, Åberg T, Kettunen P, Keränen S, Thesleff I. 1998. The life history of an embryonic signaling center: BMP-4 induces p21 and is associated with apoptosis in the mouse tooth enamel knot. Development. 125:161–169.
Jernvall J, Keränen SVE, Thesleff I. 2000. Evolutionary modification of development in mammalian teeth: quantifying gene expression patterns and topography. Proc Natl Acad Sci USA. 97:14444–14448.
Jheon AH, Seidel K, Biehs B, Klein OD. 2013. From molecules to mastication: the development and evolution of teeth. Wiley Interdiscip Rev Dev Biol. 2:165–182.
Johnson NA, Porter AH. 2001. Toward a new synthesis: population genetics and evolutionary developmental biology. Genetica. 112–113:45–58.
Jones AG, Arnold SJ, Bürger R. 2003. Stability of the G-matrix in a population experiencing pleiotropic mutation, stabilizing selection, and genetic drift. Evolution. 57:1747–1760.
Disclosure statementNo potential conflict of interest was reported by the authors.
FundingThis research was funded in part by NERC [grant number GR8/03692] and [grant number GR3/12996] and by NSF [grant number EAR 1338298] to PDP.
ReferencesAgrawal AF, Brodie ED III, Rieseberg LH. 2001. Possible consequences
of genes of major effect: transient changes in the G-matrix. Genetica. 112–113:33–43.
Ahn DG, Gibson G. 1999. Expression patterns of threespine stickleback Hox genes and insights into the evolution of the vertebrate body axis. Dev Gen Evol. 209:482–494.
Arnold SJ, Phillips PC. 1999. Hierarchical comparison of genetic variance-covariance matrices. I. Using the Flury hierarchy. Evolution. 53:1516–1527.
Arnold SJ, Pfrender ME, Jones AG. 2001. The adaptive landscape as a conceptual bridge between micro- and macroevolution. Genetica. 112–113:9–32.
Atchley WR, Rutledge JJ, Cowley DE. 1981. Genetic components of size and shape. II. Multivariate covariance patterns in the rat and mouse skull. Evolution. 35:1037–1055.
Bader RS. 1965. Heritability of dental characters in the house mouse. Evolution. 19:378–384.
Barton NH, Turelli M. 1989. Evolutionary quantitative genetics: how little do we know? Ann Rev Genet. 23:337–370.
Bégin M, Roff DA. 2001. An analysis of G matrix variation in two closely related cricket species, Gryllus firmus and G. pennsylvanicus. J Evol Biol. 14:1–13.
Berkovitz BKB. 1967. An account of the enamel cord in Setonix brachyurus (marsupialia) and on the presence of an enamel knot in Trichosurus vulpecula. Arch Oral Biol. 12:49–58.
Bookstein FL. 1989. Principal warps: thin-plate splines and the decomposition of deformations. IEEE Trans Patt Anal Mach Intel. 11:567–585.
Bookstein FL. 1991. Morphometric tools for landmark data. Cambridge: Cambridge University Press.
Bookstein FL. 2016. The inappropriate symmetries of multivariate statistical analysis in geometric morphometrics. Evol Biol. 43:277–313.
Butler PM. 1941. A theory of the evolution of mammalian molar teeth. Am J Sci. 239:421–450.
Butler PM. 1956. The ontogeny of molar pattern. Biol Rev. 31:30–69.Butler PM. 1961. Relationships between upper and lower molar patterns.
In: Vanderbroek G, editor. International colloquium on the evolution of lower and non-specialized mammals. Brussels, Belgium: Koninklijke Vlaamse Academie voor Wetenschappen, Letteren en Schone Kunsten van België; p. 117–126.
Butler PM. 1995. Ontogenetic aspects of dental evolution. Int J Dev Biol. 39:25–34.
Cheverud JM. 1982. Relationships among ontogenetic, static, and evolutionary allometry. Am J Phys Anthropol. 59:139–149.
Cheverud JM. 1984. Quantitative genetics and developmental constraints on evolution by selection. J Theor Biol. 110:155–171.
Cheverud JM. 1988. A comparison of genetic and phenotypic correlations. Evolution. 42:958–968.
Cheverud JM, Wagner GP, Dow MM. 1989. Methods for the comparative analysis of variation patterns. Syst Zool. 38:201–213.
Dryden IL, Mardia KV. 1998. Statistical shape analysis. Chichester: Wiley.Dubey S, Salamin N, Ohdachi SD, Barrière P, Vogel P. 2007. Molecular
phylogenetics of shrews (Mammalia: Soricidae) reveal timing of transcontinental colonizations. Mol Phylog Evol. 44:126–137.
Falconer DS, Mackay TFC. 1996. Introduction to quantitative genetics. Harlow: Addison Wesley Longman.
Fumagalli L, Hausser J, Taberlet P, Gielly L, Stewart DT. 1996. Phylogenetic structures of the holarctic Sorex araneus group and its relationships
10 P. D. POLLY AND O. B. MOCK
Polly PD. 2001. On morphological clocks and paleophylogeography: towards a timescale for Sorex hybrid zones. Genetica. 112–113:339–357.
Polly PD. 2003. Paleophylogeography of Sorex araneus: molar shape as a morphological marker for fossil shrews. Mammalia. 68:233–243.
Polly PD. 2005. Development, geography, and sample size in P matrix evolution: molar-shape change in island populations of Sorex araneus. Evol Dev. 7:29–41.
Polly PD. 2007. Phylogeographic differentiation in Sorex araneus: morphology in relation to geography and karyotype. Russ J Theriol. 6:73–84.
Polly PD. 2015. Gene networks, occlusal clocks, and functional patches: new understanding of pattern and process in the evolution of the dentition. Odontology. 103:117–125.
Porter AH, Johnson NA. 2002. Speciation despite gene flow when developmental pathways evolve. Evolution. 56:2103–2111.
Renaud S, Auffray JC, Michaux J. 2006. Conserved phenotypic variation patterns, evolution along lines of least resistance, and departure due to selection in fossil rodents. Evolution. 60:1701–1717.
Repenning CA. 1967. Subfamilies and genera of the Soricidae. USGS Prof Paper. 565:1–74.
Rice SH. 2000. The evolution of developmental interactions: epistasis, canalization, and integration. In: Wolf JB, Brodie ED III, Wade MJ, editors. Epistatis and the evolutionary process. Oxford: Oxford University Press; p. 82–98.
Rice SH. 2002. A general population genetic theory for the evolution of developmental interactions. Proc Natl Acad Sci USA. 99:15518–15523.
Rice SH. 2011. The place of development in mathematical evolutionary theory. J Exp Zool. 314B:480–488.
Rifkin SA, Kim J, White KP. 2003. Evolution of gene expression in the Drosophila melanogaster subgroup. Nat Genet. 33:138–144.
Roff DA. 1997. Evolutionary quantitative genetics. New York, NY: Chapman & Hall.
Rohlf FJ. 1993. Relative warp analysis and an example of its application to mosquito wings. In: Marcus LF, Bello E, Garcia-Valdecasas A, editors. Contributions to Morphometrics, Madrid. Mus Nac Cienc Nat.
Rohlf FJ. 1999. Shape statistics: procrustes superimpositions and tangent spaces. J Class. 16:197–223.
Rohlf FJ. 2002. Geometric morphometrics and phylogeny. In: Macleod N, Forey P, editors. Morphology, shape, and phylogenetics. Abingdon: Taylor and Francis; p. 175–193.
Salazar-Ciudad I, Jernvall J. 2002. A gene network model accounting for development and evolution of mammalian teeth. Proc Nat Acad Sci USA. 99:8116–8120.
Salazar-Ciudad I, Jernvall J. 2010. A computational model of teeth and the developmental origins of morphological variation. Nature. 464:583–586.
Salazar-Ciudad I, Marín-Riera M. 2013. Adaptive dynamics under development-based genotype-phenotype maps. Nature. 497:361–364.
Salazar-Ciudad I, Jernvall J, Newman SA. 2003. Mechanisms of pattern formation in development and evolution. Development. 130:2027–2037.
Schluter D. 1996. Adaptive radiation along genetic lines of least resistance. Evolution. 50:1766–1774.
Steppan SJ. 1997. Phylogenetic analysis of phenotypic covariance structure. I. Contrasting results from matrix correlation and common principal component analysis. Evolution. 51:571–586.
Townsend G, Richards L, Hughes T. 2003. Molar intercuspal dimensions: genetic input to phenotypic variation. J Dent Res. 82:350–355.
Tucker A, Sharpe PT. 2004. The cutting-edge of mammalian development; how the embryo makes teeth. Nat Rev Gen. 5:499–508.
Turelli M. 1988. Phenotypic evolution, constant covariances, and the maintenance of additive variance. Evolution. 42:1342–1347.
Ungar PS, Hlusko LJ. 2016. The evolutionary path of least resistance. Science. 353:29–30.
Weiss KM. 1993. A tooth, a toe, and a vertebra: the genetic dimensions of complex morphological traits. Evol Anthro. 2:121–134.
Weiss KM, Fullerton SM. 2000. Phenogenetic drift and the evolution of genotype–phenotype relationships. Theor Popul Biol. 57:187–195.
Willis JH, Coyne JA, Kirkpatrick M. 1991. can one predict the evolution of quantitative characters without genetics? Evolution. 45:441–444.
Kavanagh KD, Evans AR, Jernvall J. 2007. Predicting evolutionary patterns of mammalian teeth from development. Nature. 449:427–432.
Keränen S, Åberg T, Kettunen P, Thesleff I, Jernvall J. 1998. Association of developmental regulatory genes with the development of different molar tooth shapes in two species of rodents. Dev Gene Evol. 208:477–486.
Klingenberg CP. 2003. Quantitative genetics of geometric shape: heritability and the pitfalls of the univariate approach. Evolution. 57:191–195.
Klingenberg CP. 2010. Evolution and development of shape: integrating quantitative approaches. Nat Rev Genet. 11:623–635.
Klingenberg CP. 2013. Visualizations in geometric morphometrics: how to read and how to make graphs showing shape changes. Hystrix. 24:15–24.
Klingenberg CP, Leamy LJ. 2001. Quantitative genetics of geometric shape in the mouse mandible. Evolution. 55:2342–2352.
Klingenberg CP, McIntyre GS. 1998. Geometric morphometrics of developmental instability: analyzing patterns of fluctuating asymmetry with procrustes methods. Evolution. 52:1363–1375.
Klingenberg CP, Monteiro LR. 2005. Distances and directions in multidimensional shape spaces: implications for morphometric applications. Syst Biol. 54:678–688.
Kowalewski M, Novack-Gottshall P. 2010. Resampling methods in paleontology. In: Alroy J, Hunt G, editors. Quantitative methods in paleobiology. p. 19–54. Paleontological Society Papers, 16.
Laland KN, Uller T, Feldman MW, Sterelny K, Müller GB, Moczek A, Jablonka E, Odling-Smee J. 2015. The extended evolutionary synthesis: its structure, assumptions and predictions. Proc R Soc B. 282:20151019.
Lande R, Arnold SJ. 1983. The measurement of selection on correlated characters. Evolution. 37:1210–1226.
Leamy LJ, Bader RS. 1968. Components of variance of odontometric traits in a wild-derived population of peromyscus leucopus. Evolution. 22:826–834.
Leamy LJ, Bader RS. 1970. Stabilizing selection for odontometric traits in Peromyscus Leucopus. Am Mid Nat. 84:521–536.
Leamy LJ, Sustarsic SS. 1978. A morphometric discriminant analysis of agouti genotypes in C57BL/6 house mice. Syst Zool. 27:49–60.
Leamy LJ, Touchberry RW. 1974. Additive and non-additive genetic variance in odontometric traits in crosses of seven inbred lines of house mice. Genet Res. 23:207–217.
Lofsvold D. 1986. Quantitative genetics of morphological differentiation in Peromyscus. I. Tests of the homogeneity of genetic covariance structure among species and subspecies. Evolution. 40:559–573.
Lynch M, Walsh B. 1998. Genetics and analysis of quantitative traits. Sunderland, MA: Sinauer Associates.
Manly BFJ. 2007. Randomization, bootstrap, and Monte Carlo methods in biology. Boca Raton (FL): CRC Press.
Mantel N. 1967. The detection of disease clustering and a generalized regression approach. Cancer Res. 27:209–220.
Marin Riera M, Brun Usan M, Zimm R, Välikangas T, Salazar Ciudad I. 2015. Computational modeling of development by epithelia, mesenchyme, and their interactions: a unified model. Bioinformatics. 32:219–225.
Marroig G, Cheverud JM. 2001. A comparison of phenotypic variation and covariation patterns and the role of phylogeny, ecology, and ontogeny during cranial evolution of new world monkeys. Evolution. 55:2576–2600.
Marshall PM, Butler PM. 1966. Molar cusp development in the bat, Hipposideros beatus, with reference to the ontogenetic basis of occlusion. Arch Oral Biol. 11:949–965.
Martínez-Abadías N, Esparza M, Sjøvold T, González-José R, Santos M, Hernández M, Klingenberg CP. 2012. Pervasive genetic integration directs the evolution of human skull shape. Evolution. 66:1010–1023.
Martins EP, Hansen TF. 1997. Phylogenies and the comparative method: a general approach to incorporating phylogenetic information into the analysis of interspecific data. Am Nat. 149:646–667.
Mock OB. 1982. The least shrew (Cryptotis parva) as a laboratory animal. Lab Anim Sci. 32:177–179.
Polly PD. 1998. Variability, selection, and constraints: development and evolution in viverravid (Carnivora, Mammalia) molar morphology. Paleobiology. 24:409–429.

HISTORICAL BIOLOGY 11
Woodman N, Timm RM. 2000. Taxonomy and evolutionary relationships of Phillips’ small-eared shrew, Cryptotis phillipsii (Schaldach, 1966), from Oaxaca, Mexico (Mammalia: Insectivora: Soricidae). Proc Biol Soc Wash. 113:339–355.
Zelditch ML, Swiderski DL, Sheets HD, Fink WL. 2012. Geometric morphometrics for biologists: a primer. San Diego, CA: Elsevier Academic Press.
Wolf JB. 2002. The geometry of phenotypic evolution in developmental hyperspace. Proc Nat Acad Sci USA. 99:15849–15851.
Wolf JB, Frankino WA, Agrawal AF, Brodie ED III, Moore AJ. 2001. Developmental interactions and the constituents of quantitative variation. Evolution. 55:232–245.
Woodman N, Timm RM. 1999. Geographic variation and evolutionary relationships among broad-clawed shrews of the Cryptotis goldmani–group (Mammalia: Insectivora: Soricidae). Field Zool. 91:1–35.