Embed Size (px)
Citation preview

HERSHEY CO ( HSY )
100 CRYSTAL A DRIVEHERSHEY, PA, 17033−0810717−534−4200www.thehersheycompany.com
10−QQuarterly report pursuant to sections 13 or 15(d)Filed on 8/11/2010 Filed Period 7/4/2010
UNITED STATES SECURITIES AND EXCHANGE COMMISSIONWashington, D.C. 20549
FORM 10−Q
x QUARTERLY REPORT PURSUANT TO SECTION 13 OR 15(d) OF THE SECURITIES EXCHANGE ACT OF 1934
For the quarterly period ended July 4, 2010
OR
o TRANSITION REPORT PURSUANT TO SECTION 13 OR 15(d) OF THE SECURITIES EXCHANGE ACT OF 1934
For the transition periodfrom ______to_______
Commission file number 1−183
THE HERSHEY COMPANY100 Crystal A DriveHershey, PA 17033
Registrant's telephone number: 717−534−4200
State of Incorporation IRS Employer Identification No.Delaware 23−0691590
Indicate by check mark whether the registrant (1) has filed all reports required to be filed by Section 13 or 15(d) of the Securities Exchange Act of1934 during the preceding 12 months (or for such shorter period that the registrant was required to file such reports), and (2) has been subject to such filingrequirements for the past 90 days. Yes x No o
Indicate by check mark whether the registrant has submitted electronically and posted on its corporate Web site, if any, every Interactive Data Filerequired to be submitted and posted pursuant to Rule 405 of Regulation S−T (§232.405 of this chapter) during the preceding 12 months (or for such shorterperiod that the registrant was required to submit and post such files). Yes x No o
Indicate by check mark whether the registrant is a large accelerated filer, an accelerated filer, a non−accelerated filer, or a smaller reportingcompany. See the definitions of “large accelerated filer,” “accelerated filer” and “smaller reporting company” in Rule 12b−2 of the Exchange Act.
Large accelerated filer x Accelerated filer oNon−accelerated filer o (Do not check if a smaller reporting company) Smaller reporting company o
Indicate by check mark whether the registrant is a shell company (as defined in Rule 12b−2 of the Exchange Act). Yes o No x
Indicate the number of shares outstanding of each of the issuer's classes of common stock, as of the latest practicable date.Common Stock, $1 par value – 166,411,570 shares, as of July 23, 2010. Class B Common Stock,$1 par value – 60,707,919 shares, as of July 23, 2010.
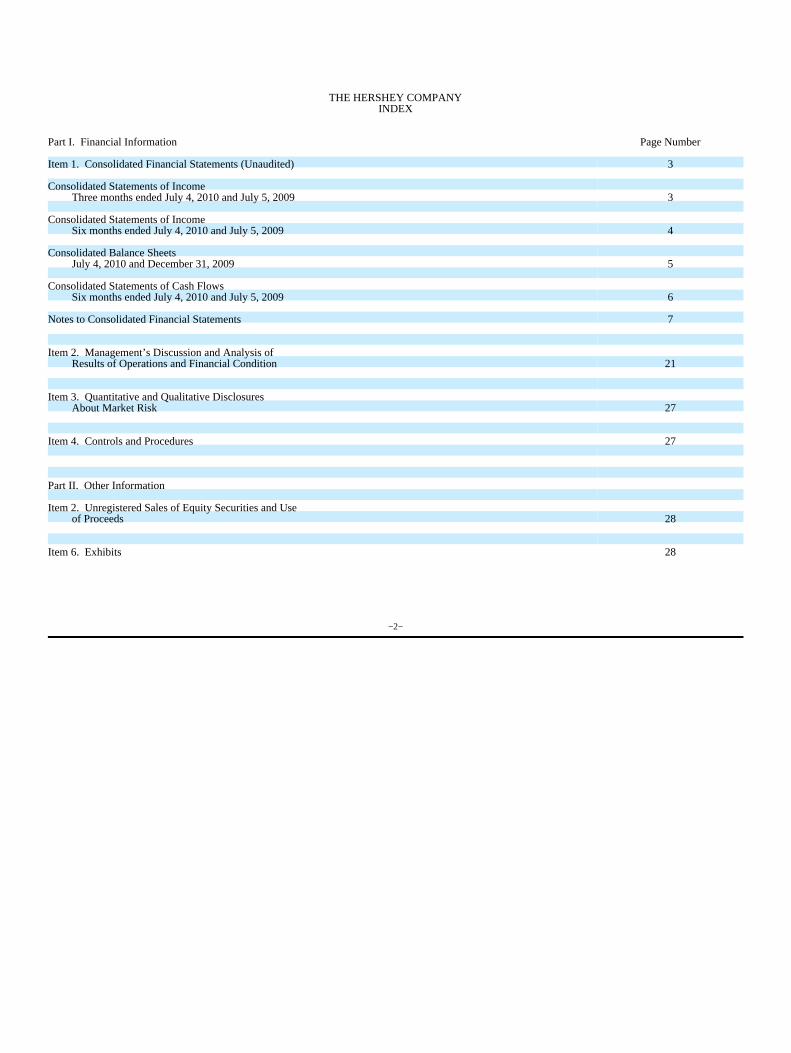
THE HERSHEY COMPANYINDEX
Part I. Financial Information Page Number
Item 1. Consolidated Financial Statements (Unaudited) 3
Consolidated Statements of IncomeThree months ended July 4, 2010 and July 5, 2009 3
Consolidated Statements of IncomeSix months ended July 4, 2010 and July 5, 2009 4
Consolidated Balance SheetsJuly 4, 2010 and December 31, 2009 5
Consolidated Statements of Cash FlowsSix months ended July 4, 2010 and July 5, 2009 6
Notes to Consolidated Financial Statements 7
Item 2. Management’s Discussion and Analysis ofResults of Operations and Financial Condition 21
Item 3. Quantitative and Qualitative DisclosuresAbout Market Risk 27
Item 4. Controls and Procedures 27
Part II. Other Information
Item 2. Unregistered Sales of Equity Securities and Useof Proceeds 28
Item 6. Exhibits 28
−2−

PART I − FINANCIAL INFORMATION
Item 1. Consolidated Financial Statements (Unaudited)
THE HERSHEY COMPANYCONSOLIDATED STATEMENTS OF INCOME
(in thousands except per share amounts)
For the Three Months EndedJuly 4,2010
July 5,2009
Net Sales $ 1,233,242 $ 1,171,183
Costs and Expenses:Cost of sales 686,704 717,893Selling, marketing and administrative 336,980 298,710Business realignment and impairment charges, net 85,134 37,904
Total costs and expenses 1,108,818 1,054,507
Income before Interest and Income Taxes 124,424 116,676
Interest expense, net 22,780 22,734
Income before Income Taxes 101,644 93,942
Provision for income taxes 54,921 22,644
Net Income $ 46,723 $ 71,298
Earnings Per Share − Basic − Class B Common Stock $ .19 $ .29
Earnings Per Share − Diluted − Class B Common Stock $ .19 $ .29
Earnings Per Share − Basic − Common Stock $ .21 $ .32
Earnings Per Share − Diluted − Common Stock $ .20 $ .31
Average Shares Outstanding − Basic − Common Stock 166,882 166,846
Average Shares Outstanding − Basic − Class B Common Stock 60,708 60,710
Average Shares Outstanding − Diluted 230,324 228,489
Cash Dividends Paid Per Share:Common Stock $ .3200 $ .2975Class B Common Stock $ .2900 $ .2678
The accompanying notes are an integral part of these consolidated financial statements.
−3−

THE HERSHEY COMPANYCONSOLIDATED STATEMENTS OF INCOME
(in thousands except per share amounts)
For the Six Months EndedJuly 4,2010
July 5,2009
Net Sales $ 2,641,085 $ 2,407,214
Costs and Expenses:Cost of sales 1,500,567 1,513,696Selling, marketing and administrative 677,626 573,166Business realignment and impairment charges, net 85,134 50,742
Total costs and expenses 2,263,327 2,137,604
Income before Interest and Income Taxes 377,758 269,610
Interest expense, net 46,529 46,630
Income before Income Taxes 331,229 222,980
Provision for income taxes 137,112 75,788
Net Income $ 194,117 $ 147,192
Earnings Per Share − Basic − Class B Common Stock $ .79 $ .60
Earnings Per Share − Diluted − Class B Common Stock $ .79 $ .60
Earnings Per Share − Basic − Common Stock $ .87 $ .66
Earnings Per Share − Diluted − Common Stock $ .84 $ .64
Average Shares Outstanding − Basic − Common Stock 167,079 166,817
Average Shares Outstanding − Basic − Class B Common Stock 60,708 60,710
Average Shares Outstanding − Diluted 229,946 228,396
Cash Dividends Paid Per Share:Common Stock $ .6400 $ .5950Class B Common Stock $ .5800 $ .5356
The accompanying notes are an integral part of these consolidated financial statements.
−4−

THE HERSHEY COMPANYCONSOLIDATED BALANCE SHEETS
(in thousands of dollars)
ASSETSJuly 4,2010
December 31,2009
Current Assets:Cash and cash equivalents $ 249,070 $ 253,605Accounts receivable − trade 321,051 410,390Inventories 603,728 519,712Deferred income taxes 67,841 39,868Prepaid expenses and other 173,298 161,859
Total current assets 1,414,988 1,385,434Property, Plant and Equipment, at cost 3,245,579 3,242,868
Less−accumulated depreciation and amortization (1,867,067) (1,838,101)Net property, plant and equipment 1,378,512 1,404,767
Goodwill 517,416 571,580Other Intangibles 123,062 125,520Deferred Income Taxes 10,720 4,353Other Assets 175,289 183,377
Total assets $ 3,619,987 $ 3,675,031
LIABILITIES AND STOCKHOLDERS' EQUITY
Current Liabilities:Accounts payable $ 304,993 $ 287,935Accrued liabilities 530,011 546,462Accrued income taxes — 36,918Short−term debt 28,968 24,066Current portion of long−term debt 12,037 15,247
Total current liabilities 876,009 910,628Long−term Debt 1,501,335 1,502,730Other Long−term Liabilities 508,086 501,334Deferred Income Taxes 2,055 —
Total liabilities 2,887,485 2,914,692Stockholders' Equity:
The Hershey Company Stockholders’ EquityPreferred Stock, shares issued: none in 2010 and 2009 — —Common Stock, shares issued: 299,193,825 in 2010 and
299,192,836 in 2009 299,193 299,192Class B Common Stock, shares issued: 60,707,919 in 2010 and
60,708,908 in 2009 60,708 60,709Additional paid−in capital 420,028 394,678Retained earnings 4,200,758 4,148,353Treasury−Common Stock shares at cost: 132,853,510 in 2010 and 131,903,468 in 2009 (4,040,873) (3,979,629)Accumulated other comprehensive loss (242,446) (202,844)
The Hershey Company stockholders’ equity 697,368 720,459Noncontrolling interests in subsidiaries 35,134 39,880
Total stockholders' equity 732,502 760,339Total liabilities and stockholders' equity $ 3,619,987 $ 3,675,031
The accompanying notes are an integral part of these consolidated balance sheets.
−5−
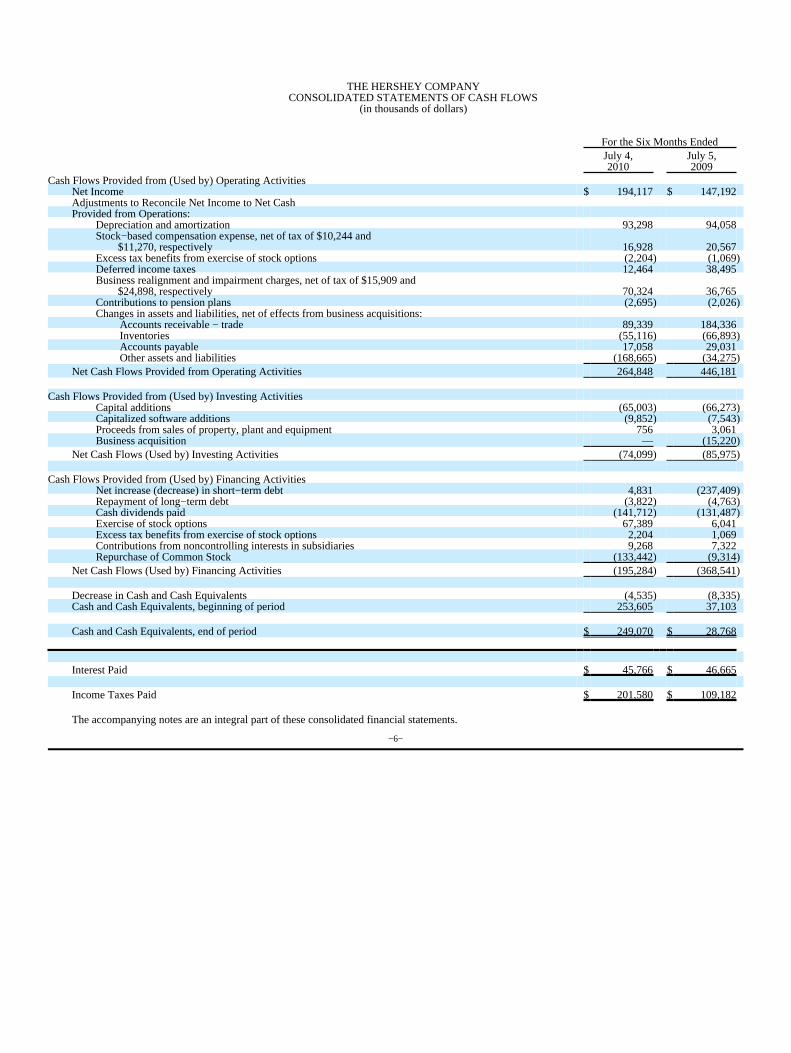
THE HERSHEY COMPANYCONSOLIDATED STATEMENTS OF CASH FLOWS
(in thousands of dollars)
For the Six Months EndedJuly 4,2010
July 5,2009
Cash Flows Provided from (Used by) Operating ActivitiesNet Income $ 194,117 $ 147,192Adjustments to Reconcile Net Income to Net CashProvided from Operations:
Depreciation and amortization 93,298 94,058Stock−based compensation expense, net of tax of $10,244 and $11,270, respectively 16,928 20,567Excess tax benefits from exercise of stock options (2,204) (1,069)Deferred income taxes 12,464 38,495Business realignment and impairment charges, net of tax of $15,909 and $24,898, respectively 70,324 36,765Contributions to pension plans (2,695) (2,026)Changes in assets and liabilities, net of effects from business acquisitions:
Accounts receivable − trade 89,339 184,336Inventories (55,116) (66,893)Accounts payable 17,058 29,031Other assets and liabilities (168,665) (34,275)
Net Cash Flows Provided from Operating Activities 264,848 446,181
Cash Flows Provided from (Used by) Investing ActivitiesCapital additions (65,003) (66,273)Capitalized software additions (9,852) (7,543)Proceeds from sales of property, plant and equipment 756 3,061Business acquisition — (15,220)
Net Cash Flows (Used by) Investing Activities (74,099) (85,975)
Cash Flows Provided from (Used by) Financing ActivitiesNet increase (decrease) in short−term debt 4,831 (237,409)Repayment of long−term debt (3,822) (4,763)Cash dividends paid (141,712) (131,487)Exercise of stock options 67,389 6,041Excess tax benefits from exercise of stock options 2,204 1,069Contributions from noncontrolling interests in subsidiaries 9,268 7,322Repurchase of Common Stock (133,442) (9,314)
Net Cash Flows (Used by) Financing Activities (195,284) (368,541)
Decrease in Cash and Cash Equivalents (4,535) (8,335)Cash and Cash Equivalents, beginning of period 253,605 37,103
Cash and Cash Equivalents, end of period $ 249,070 $ 28,768
Interest Paid $ 45,766 $ 46,665
Income Taxes Paid $ 201,580 $ 109,182
The accompanying notes are an integral part of these consolidated financial statements.
−6−

THE HERSHEY COMPANYNOTES TO CONSOLIDATED FINANCIAL STATEMENTS
1. BASIS OF PRESENTATION
Our unaudited consolidated financial statements provided in this report include the accounts of the Company and our majority−owned subsidiariesand entities in which we have a controlling financial interest after the elimination of intercompany accounts and transactions. We have a controllingfinancial interest if we own a majority of the outstanding voting common stock and the noncontrolling shareholders do not have substantive participatingrights, or we have significant control over an entity through contractual or economic interests in which we are the primary beneficiary. We prepared thesestatements in accordance with the instructions to Form 10−Q. The financial statements were prepared in accordance with U.S. generally acceptedaccounting principles (“GAAP”) for interim financial reporting. These statements do not include all of the information and footnotes required by GAAP forcomplete financial statements.
Our significant interim accounting policies include the recognition of a pro rata share of certain estimated annual amounts primarily for raw materialpurchase price variances, advertising expense, incentive compensation expenses and the effective income tax rate.
We included all adjustments (consisting only of normal recurring accruals) which we believe were considered necessary for a fair presentation. Wereclassified certain prior year amounts to conform to the 2010 presentation. Operating results for the six months ended July 4, 2010 may not be indicativeof the results that may be expected for the year ending December 31, 2010, because of the seasonal effects of our business. For more information, refer tothe consolidated financial statements and notes included in our 2009 Annual Report on Form 10−K.
2. BUSINESS ACQUISITION
In March 2009, the Company completed the acquisition of the Van Houten Singapore consumer business. The acquisition from Barry Callebaut,AG provides the Company with an exclusive license of the Van Houten brand name and related trademarks in Asia and the Middle East for the retail andduty−free distribution channels. The purchase price for the acquisition of Van Houten Singapore and the licensing agreement was approximately $15.2million.
We included results subsequent to the acquisition date in the consolidated financial statements. If we had included the results of the acquisition inthe consolidated financial statements for each of the periods presented, the effect would not have been material.
3. NONCONTROLLING INTERESTS IN SUBSIDIARIES
In May 2007, we entered into an agreement with Godrej Beverages and Foods, Ltd., one of India’s largest consumer goods, confectionery and foodcompanies, to manufacture and distribute confectionery products, snacks and beverages across India. Under the agreement, we own a 51% controllinginterest in Godrej Hershey Ltd. In January 2009, the Company contributed cash of approximately $8.7 million to Godrej Hershey Ltd. and owners of thenoncontrolling interests in Godrej Hershey Ltd. contributed approximately $7.3 million. In June 2010, the Company and the noncontrolling interestsexecuted a rights agreement with Godrej Hershey Ltd. in the form of unsecured compulsorily and fully convertible debentures. The Company contributedcash of approximately $11.1 million and the noncontrolling interests contributed $9.3 million associated with the rights agreement. The ownership interestpercentages in Godrej Hershey Ltd. did not change significantly as a result of the contributions in 2009 and 2010. The noncontrolling interests in GodrejHershey Ltd. are included in the equity section of the Consolidated Balance Sheets.
We also own a 51% controlling interest in Hershey do Brasil under a cooperative agreement with Pandurata Alimentos LTDA (“Bauducco”), aleading manufacturer of baked goods in Brazil whose primary brand is Bauducco. The noncontrolling interest in Hershey do Brasil is included in the equitysection of the Consolidated Balance Sheets.
The decrease in noncontrolling interests in subsidiaries from $39.9 million as of December 31, 2009 to $35.1 million as of July 4, 2010 reflected thenoncontrolling interests’ share of losses of these entities, including the noncontrolling interests’ share of the goodwill impairment charge recorded forGodrej Hershey Ltd. and the impact of currency translation adjustments, partially offset by the noncontrolling interests’ contribution associated with theJune 2010 rights agreement described above. The adjustment to exclude the losses of noncontrolling interests in subsidiaries increased income by$5.4 million for the six months ended July 4, 2010 and by $2.4 million for the six months ended July 5, 2009 and was included in selling, marketing andadministrative expenses.
−7−
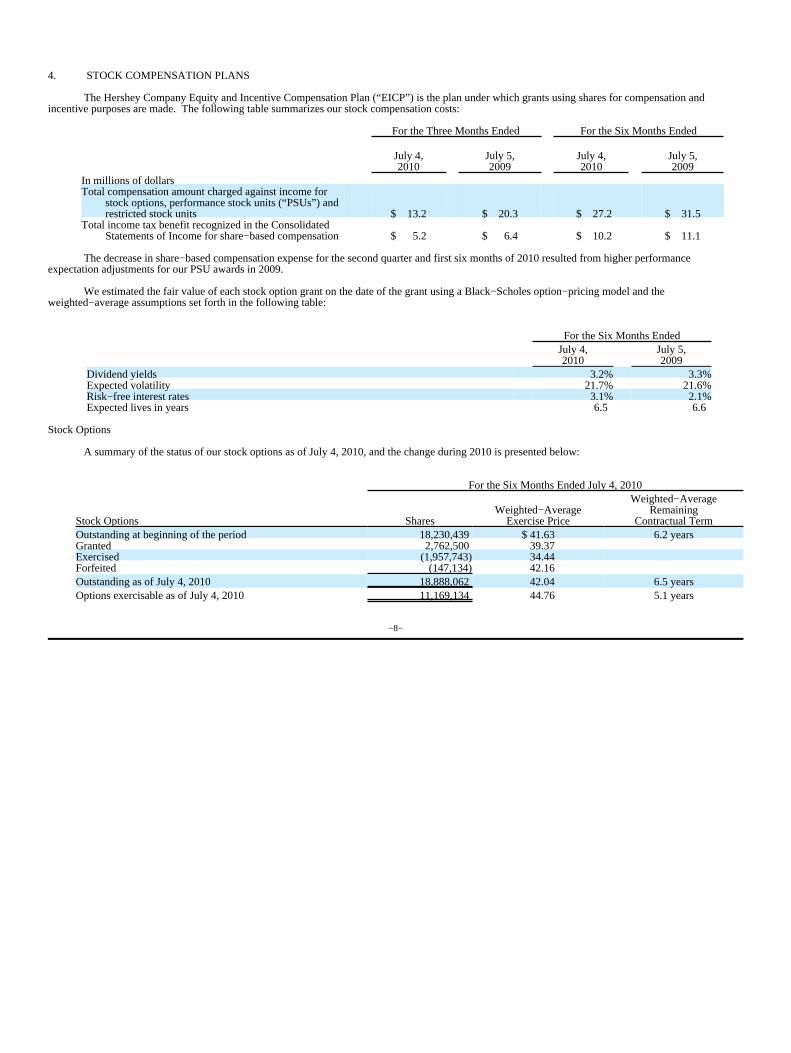
4. STOCK COMPENSATION PLANS
The Hershey Company Equity and Incentive Compensation Plan (“EICP”) is the plan under which grants using shares for compensation andincentive purposes are made. The following table summarizes our stock compensation costs:
For the Three Months Ended For the Six Months Ended
July 4,2010
July 5,2009
July 4,2010
July 5,2009
In millions of dollarsTotal compensation amount charged against income for
stock options, performance stock units (“PSUs”) andrestricted stock units $ 13.2 $ 20.3 $ 27.2 $ 31.5
Total income tax benefit recognized in the ConsolidatedStatements of Income for share−based compensation $ 5.2 $ 6.4 $ 10.2 $ 11.1
The decrease in share−based compensation expense for the second quarter and first six months of 2010 resulted from higher performanceexpectation adjustments for our PSU awards in 2009.
We estimated the fair value of each stock option grant on the date of the grant using a Black−Scholes option−pricing model and theweighted−average assumptions set forth in the following table:
For the Six Months EndedJuly 4,2010
July 5,2009
Dividend yields 3.2% 3.3%Expected volatility 21.7% 21.6%Risk−free interest rates 3.1% 2.1%Expected lives in years 6.5 6.6
Stock Options
A summary of the status of our stock options as of July 4, 2010, and the change during 2010 is presented below:
For the Six Months Ended July 4, 2010
Stock Options SharesWeighted−Average
Exercise Price
Weighted−AverageRemaining
Contractual TermOutstanding at beginning of the period 18,230,439 $ 41.63 6.2 yearsGranted 2,762,500 39.37Exercised (1,957,743) 34.44Forfeited (147,134) 42.16Outstanding as of July 4, 2010 18,888,062 42.04 6.5 yearsOptions exercisable as of July 4, 2010 11,169,134 44.76 5.1 years
−8−

For the Six Months EndedJuly 4,2010
July 5,2009
Weighted−average fair value of options granted (per share) $ 6.85 $ 5.31Intrinsic value of options exercised (in millions of dollars) $ 21.2 $ 2.1
As of July 4, 2010, the aggregate intrinsic value of options outstanding was $155.7 million and the aggregate intrinsic value of options exercisablewas $74.8 million.
As of July 4, 2010, there was $33.4 million of total unrecognized compensation cost related to non−vested stock option compensation arrangementsgranted under our stock option plans. That cost is expected to be recognized over a weighted−average period of 2.6 years.
Performance Stock Units and Restricted Stock Units
A summary of the status of our performance stock units and restricted stock units as of July 4, 2010, and the change during 2010 is presented below:
Performance Stock Units and Restricted Stock Units
For the SixMonths EndedJuly 4, 2010
Weighted−average grant datefair value for equity awards or
market value for liabilityawards
Outstanding at beginning of year 1,530,464 $ 37.11Granted 616,969 38.98Performance assumption change 370,397 35.77Vested (340,064) 37.48Forfeited (13,472) 42.94Outstanding as of July 4, 2010 2,164,294 $ 37.57
As of July 4, 2010, there was $47.6 million of unrecognized compensation cost relating to non−vested performance stock units and restricted stockunits. We expect to recognize that cost over a weighted−average period of 2.4 years.
For the Six Months EndedJuly 4,2010
July 5,2009
Intrinsic value of share−based liabilities paid, combined with the fair valueof shares vested (in millions of dollars) $ 14.2 $ 8.1
Deferred performance stock units, deferred restricted stock units, and directors’ fees and accumulated dividend amounts representing deferred stockunits totaled 427,925 units as of July 4, 2010. Each unit is equivalent to one share of the Company’s Common Stock.
No stock appreciation rights were outstanding as of July 4, 2010.
For more information on our stock compensation plans, refer to the consolidated financial statements and notes included in our 2009 Annual Reporton Form 10−K and our proxy statement for the 2010 annual meeting of stockholders.
−9−

5. INTEREST EXPENSE
Net interest expense consisted of the following:
For the Six Months EndedJuly 4,2010
July 5,2009
In thousands of dollarsInterest expense $ 48,025 $ 48,466Interest income (492) (545)Capitalized interest (1,004) (1,291)
Interest expense, net $ 46,529 $ 46,630
6. BUSINESS REALIGNMENT AND IMPAIRMENT CHARGES
In February 2007, we announced a comprehensive, three−year global supply chain transformation program (the “Global Supply ChainTransformation program” or “GSCT”). Total pre−tax charges and non−recurring project implementation costs were $629.1 million for the GSCT whichwas essentially complete as of December 31, 2009. Total costs of $99.1 million were recorded during 2009, costs of $130.0 million were recorded in 2008and costs of $400.0 million were recorded in 2007 for this program. The current trends of employee lump sum withdrawals from the defined benefitpension plans could result in additional non−cash pension settlement losses of $12 million to $18 million in 2010. In addition, the manufacturing facilitiesin Naugatuck, Connecticut and Smiths Falls, Ontario have been closed and are being held for sale. The carrying value of these facilities was $10.0 millionat July 4, 2010. Actual proceeds from the sale of these facilities could differ from expected proceeds which could cause additional charges or credits in2010.
In June 2010, we announced Project Next Century (“Next Century program”) as part of our ongoing efforts to create an advantaged supply chainand competitive cost structure. As part of the program, production will transition from the Company's century−old facility at 19 East Chocolate Avenue inHershey, Pennsylvania, to a planned expansion of the West Hershey facility, which was built in 1992. Production from the 19 East Chocolate Avenue plant,as well as a portion of the workforce, will be relocated to the West Hershey facility. This change is expected to result in the reduction of approximately 500to 600 jobs at the two facilities as investments in technology and automation result in enhanced efficiency.
We estimate that the Next Century program will incur pre−tax charges and non−recurring project implementation costs of $140 million to $170million over the next three years. This estimate includes $120 million to $150 million in pre−tax business realignment and impairment charges andapproximately $20 million in project implementation and start−up costs.
During the second quarter of 2010, we completed an impairment evaluation of goodwill and other intangible assets associated with GodrejHershey Ltd. Based on this evaluation, we recorded a non−cash goodwill impairment charge of $44.7 million, including a reduction to reflect the share ofthe charge associated with the noncontrolling interests.
−10−

Business realignment and impairment charges recorded during the three−month and six−month periods ended July 4, 2010 and July 5, 2009 wereas follows:
For the ThreeMonths Ended
For the SixMonths Ended
July 4,2010
July 5,2009
July 4,2010
July 5,2009
In thousands of dollarsCost of sales
Global supply chain transformation program $ — $ 3,116 $ — $ 7,167Next Century program 976 — 976 —
Total cost of sales 976 3,116 976 7,167
Selling, marketing and administrative Global supply chain transformation program — 1,671 — 3,754Next Century program 123 — 123 —
Total selling, marketing and administrative 123 1,671 123 3,754
Business realignment and impairment charges, netGlobal supply chain transformation program
Fixed asset impairment and plant closure expenses — 6,546 — 16,889Employee separation costs — 383 — 2,878Pension settlement loss — 30,555 — 30,555Contract termination costs — 420 — 420
Next Century programFixed asset impairment charges 4,304 — 4,304 —Employee separation costs 36,138 — 36,138 —
Godrej Hershey Ltd. goodwill impairment 44,692 — 44,692 —Total business realignment andimpairment charges, net 85,134 37,904 85,134 50,742
Total business realignment and impairment charges $ 86,233 $ 42,691 $ 86,233 $ 61,663
A charge of $1.0 million was recorded in cost of sales during the second quarter of 2010 related to accelerated depreciation of fixed assets over areduced remaining useful life associated with the Next Century program. A charge of $.1 million was recorded in selling, marketing and administrativeexpenses in the second quarter of 2010 for project administration. In determining the costs related to fixed asset impairments, fair value was estimatedbased on the expected sales proceeds. Fixed asset impairments and plant closure expenses of $4.3 million were recorded in the second quarter of2010. Employee separation costs of $36.1 million in the second quarter of 2010 were related to expected voluntary and involuntary terminations at the twomanufacturing facilities.
As a result of recent operating performance that was below expectations, we completed an impairment evaluation of goodwill and otherintangible assets of Godrej Hershey Ltd. during the second quarter of 2010. While Godrej Hershey Ltd. has achieved growth, it has been less than initialexpectations due to slower realization of development plans and changes in input costs, as well as the macroeconomic environment which has delayeddistribution expansion and the implementation of new price points. As a result of reduced expectations for future cash flows from lower than expectedprofitability, we determined that the carrying amount of Godrej Hershey Ltd. exceeded its fair value. The assumptions we used to estimate fair value werebased on the past performance of Godrej Hershey Ltd. and reflected the projections and assumptions included in current operating plans. We alsoconsidered assumptions that market participants may use. Such assumptions are subject to change due to changing economic and competitiveconditions. We recorded a non−cash goodwill impairment charge of $44.7 million to reduce the carrying value of Godrej Hershey Ltd. to its fair value,including a reduction to reflect the share of the charge associated with the noncontrolling interests. There was no tax benefit associated with this charge.
−11−

The charge of $3.1 million recorded in cost of sales during the second quarter of 2009 related primarily to the accelerated depreciation of fixedassets over a reduced estimated remaining useful life and start−up costs associated with the Global Supply Chain Transformation program. The $1.7 millionrecorded in selling, marketing and administrative expenses related to project administration for the Global Supply Chain Transformation program. The $6.5million of fixed asset impairments and plant closure expenses for 2009 related primarily to the preparation of plants for sale and production line removalcosts. In determining the costs related to fixed asset impairments, fair value was estimated based on the expected sales proceeds. The Global Supply ChainTransformation program employee separation costs were related to involuntary terminations at the manufacturing facilities of Artisan Confections Companywhich were being closed. A pension settlement loss of $30.6 million was recorded reflecting the increased level of lump sum withdrawals from a definedbenefit pension plan related to employee departures associated with the Global Supply Chain Transformation program.
The charge of $7.2 million recorded in cost of sales during the first six months of 2009 related to the accelerated depreciation of fixed assets overa reduced estimated remaining useful life and start−up costs associated with the Global Supply Chain Transformation program. The $3.8 million recordedin selling, marketing and administrative expenses related primarily to project administration for the Global Supply Chain Transformation program. The$16.9 million of fixed asset impairments and plant closure expenses related primarily to the preparation of plants for sale and production line removal costs.In determining the costs related to fixed asset impairments, fair value was estimated based on the expected sales proceeds. The Global Supply ChainTransformation program employee separation costs were related to involuntary terminations at the manufacturing facilities of Artisan Confections Companywhich were being closed.
The July 4, 2010 liability balance relating to the Global Supply Chain Transformation program was $3.7 million for employee separation costs tobe paid during the remainder of 2010. During the first six months of 2010, we made payments against the liabilities recorded for the GSCT of $5.5 millionprincipally related to employee separation costs. The July 4, 2010 liability balance relating to the Next Century program was $36.1 million for estimatedemployee separation costs which were recorded in the second quarter of 2010 and will be paid in 2012 and early 2013 as production transitions to theexpanded West Hershey facility.
7. EARNINGS PER SHARE
We compute Basic and Diluted Earnings Per Share based on the weighted−average number of shares of the Common Stock and the Class BCommon Stock outstanding as follows:
For the ThreeMonths Ended
For the SixMonths Ended
July 4,2010
July 5,2009
July 4,2010
July 5,2009
In thousands except per share amountsNet income $ 46,723 $ 71,298 $ 194,117 $ 147,192Weighted−average shares − Basic
Common Stock 166,882 166,846 167,079 166,817Class B Common Stock 60,708 60,710 60,708 60,710
Total weighted−average shares − Basic 227,590 227,556 227,787 227,527Effect of dilutive securities:
Employee stock options 2,089 648 1,548 620Performance and restricted stock units 645 285 611 249
Weighted−average shares − Diluted 230,324 228,489 229,946 228,396
Earnings Per Share − BasicClass B Common Stock $ .19 $ .29 $ .79 $ .60Common Stock $ .21 $ .32 $ .87 $ .66
Earnings Per Share − DilutedClass B Common Stock $ .19 $ .29 $ .79 $ .60Common Stock $ .20 $ .31 $ .84 $ .64
−12−

The Class B Common Stock is convertible into Common Stock on a share−for−share basis at any time. The calculation of earnings pershare−diluted for the Class B Common Stock was performed using the two−class method and the calculation of earnings per share−diluted for the CommonStock was performed using the if−converted method.
For the Three Months Ended For the Six Months EndedJuly 4, 2010
July 5,2009
July 4 , 2010
July 5,2009
In millionsStock options excluded from diluted earnings per share
calculation because the effect would have beenantidilutive 5.9 15.6 8.7 17.1
8. DERIVATIVE INSTRUMENTS AND HEDGING ACTIVITIES
We account for derivative instruments in accordance with Financial Accounting Standards Board accounting standards, which require us torecognize all derivative instruments at fair value. We classify derivatives as assets or liabilities on the balance sheet. As of July 4, 2010 and December 31,2009, we classified all of our derivative instruments as cash flow hedges.
The fair value of derivative instruments in the Consolidated Balance Sheet as of July 4, 2010 was as follows:
Balance Sheet CaptionInterest Rate Swap
Agreements
Foreign ExchangeForward Contracts
and Options
CommoditiesFutures and
OptionsContracts
In thousands of dollarsPrepaid expense and other current assets $ — $ 4,259 $ 567Other assets $ — $ 2,626 $ —Accrued liabilities $ — $ 3,445 $ 9,211Other long−term liabilities $ 7,349 $ 935 $ —
The fair value of derivative instruments in the Consolidated Balance Sheet as of December 31, 2009 was as follows:
Balance Sheet CaptionInterest Rate Swap
Agreements
Foreign ExchangeForward Contracts
and Options
CommoditiesFutures and
OptionsContracts
In thousands of dollarsPrepaid expense and other current assets $ — $ 2,872 $ 11,835Other assets $ 9,171 $ — $ —Accrued liabilities $ — $ 7,708 $ 3,228
The fair value of the interest rate swap agreements represents the difference in the present values of cash flows calculated at the contracted interestrates and at current market interest rates at the end of the period. We calculate the fair value of interest rate swap agreements quarterly based on the quotedmarket price for the same or similar financial instruments.
We define the fair value of foreign exchange forward contracts and options as the amount of the difference between the contracted and currentmarket foreign currency exchange rates at the end of the period. We estimate the fair value of foreign exchange forward contracts and options on aquarterly basis by obtaining market quotes of spot and forward rates for contracts with similar terms, adjusted where necessary for maturity differences. Asof July 4, 2010, the fair value of foreign exchange forward contracts with gains totaled $6.9 million and the fair value of foreign exchange forward contractswith losses totaled $4.4 million.
As of July 4, 2010, prepaid expense and other current assets were associated with the fair value of commodity options contracts. Accrued liabilitieswere related to cash transfers payable on commodities futures contracts reflecting the change in quoted market prices on the last trading day for theperiod. We make or receive cash transfers to or from commodity futures brokers on a daily basis reflecting changes in the value of futures contracts on theIntercontinentalExchange or various other exchanges. These changes in value represent unrealized gains and losses.
−13−

The effect of derivative instruments on the Consolidated Statements of Income for the six months ended July 4, 2010 was as follows:
Cash Flow Hedging DerivativesInterest Rate Swap
Agreements
Foreign ExchangeForward Contracts
and Options
CommoditiesFutures and
OptionsContracts
In thousands of dollarsGains (losses) recognized in other comprehensive income
(“OCI”) (effective portion) $ (16,520) $ 2,451 $ (32,419)Gains (losses) reclassified from accumulated OCI into income
(effective portion) (a) $ — $ (4,629) $ 32,500Gains (losses) recognized in income (ineffective portion) (b) $ — $ — $ 1,303
The effect of derivative instruments on the Consolidated Statements of Income for the six months ended July 5, 2009 was as follows:
Cash Flow Hedging DerivativesInterest Rate Swap
Agreements
Foreign ExchangeForward Contracts
and Options
CommoditiesFutures and
OptionsContracts
In thousands of dollarsGains (losses) recognized in other comprehensive income
(“OCI”) (effective portion) $ 8,623 $ 1,634 $ 2,615Gains (losses) reclassified from accumulated OCI into income
(effective portion) (a) $ — $ 5,419 $ (11,400)Gains (losses) recognized in income (ineffective portion) (b) $ — $ — $ (431)
(a) Gains (losses) reclassified from accumulated OCI into earnings were included in cost of sales for commodities futures and options contracts andfor foreign exchange forward contracts and options designated as hedges of intercompany purchases of inventory. Other gains and losses forforeign exchange forward contracts and options were included in selling, marketing and administrative expenses.
(b) Gains (losses) recognized in earnings were included in cost of sales.
All gains (losses) recognized in earnings were related to the ineffective portion of the hedging relationship. We recognized no components of gainsand losses on cash flow hedging derivatives in income due to excluding such components from the hedge effectiveness assessment.
The amount of net gains on cash flow hedging derivatives, including foreign exchange forward contracts, interest rate swap agreements andcommodities futures and options contracts, expected to be reclassified into earnings in the next twelve months was approximately $18.7 million after tax asof July 4, 2010. This amount was primarily associated with commodities futures and options contracts.
For more information, refer to the consolidated financial statements and notes included in our 2009 Annual Report on Form 10−K.
−14−
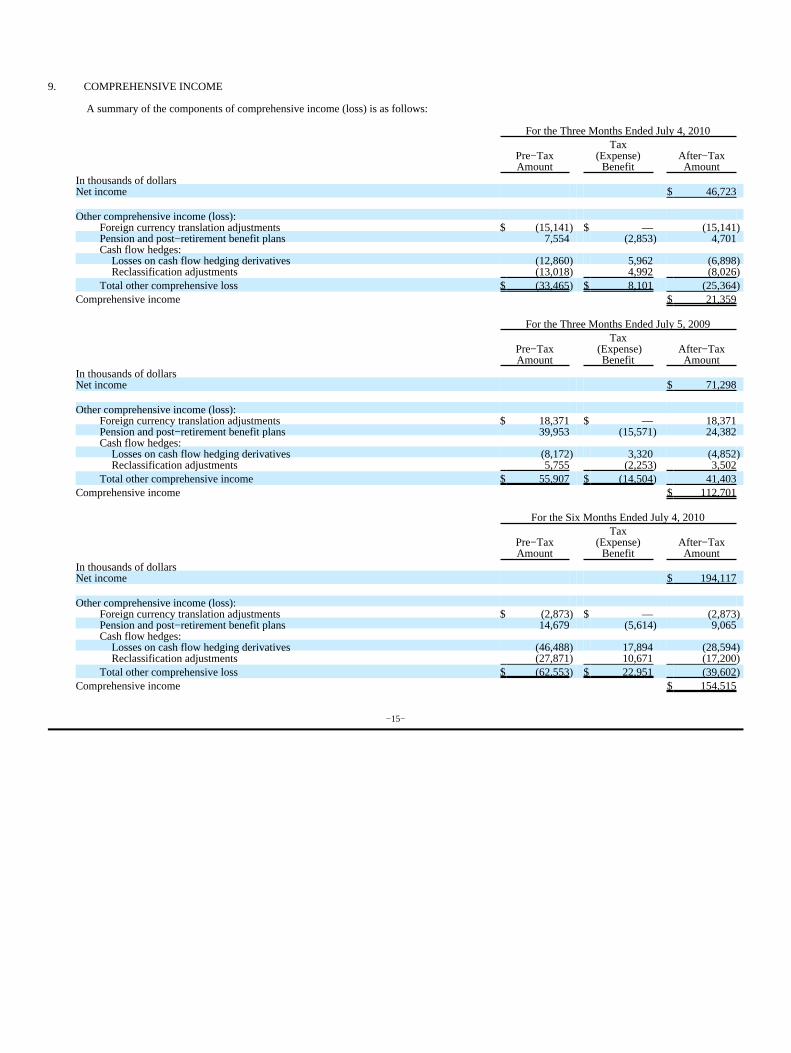
9. COMPREHENSIVE INCOME
A summary of the components of comprehensive income (loss) is as follows:
For the Three Months Ended July 4, 2010
Pre−TaxAmount
Tax(Expense)
BenefitAfter−TaxAmount
In thousands of dollarsNet income $ 46,723
Other comprehensive income (loss):Foreign currency translation adjustments $ (15,141) $ — (15,141)Pension and post−retirement benefit plans 7,554 (2,853) 4,701Cash flow hedges:
Losses on cash flow hedging derivatives (12,860) 5,962 (6,898)Reclassification adjustments (13,018) 4,992 (8,026)
Total other comprehensive loss $ (33,465) $ 8,101 (25,364)Comprehensive income $ 21,359
For the Three Months Ended July 5, 2009
Pre−TaxAmount
Tax (Expense)
BenefitAfter−TaxAmount
In thousands of dollarsNet income $ 71,298
Other comprehensive income (loss):Foreign currency translation adjustments $ 18,371 $ — 18,371Pension and post−retirement benefit plans 39,953 (15,571) 24,382Cash flow hedges:
Losses on cash flow hedging derivatives (8,172) 3,320 (4,852)Reclassification adjustments 5,755 (2,253) 3,502
Total other comprehensive income $ 55,907 $ (14,504) 41,403Comprehensive income $ 112,701
For the Six Months Ended July 4, 2010
Pre−TaxAmount
Tax(Expense)
BenefitAfter−TaxAmount
In thousands of dollarsNet income $ 194,117
Other comprehensive income (loss):Foreign currency translation adjustments $ (2,873) $ — (2,873)Pension and post−retirement benefit plans 14,679 (5,614) 9,065Cash flow hedges:
Losses on cash flow hedging derivatives (46,488) 17,894 (28,594)Reclassification adjustments (27,871) 10,671 (17,200)
Total other comprehensive loss $ (62,553) $ 22,951 (39,602)Comprehensive income $ 154,515
−15−
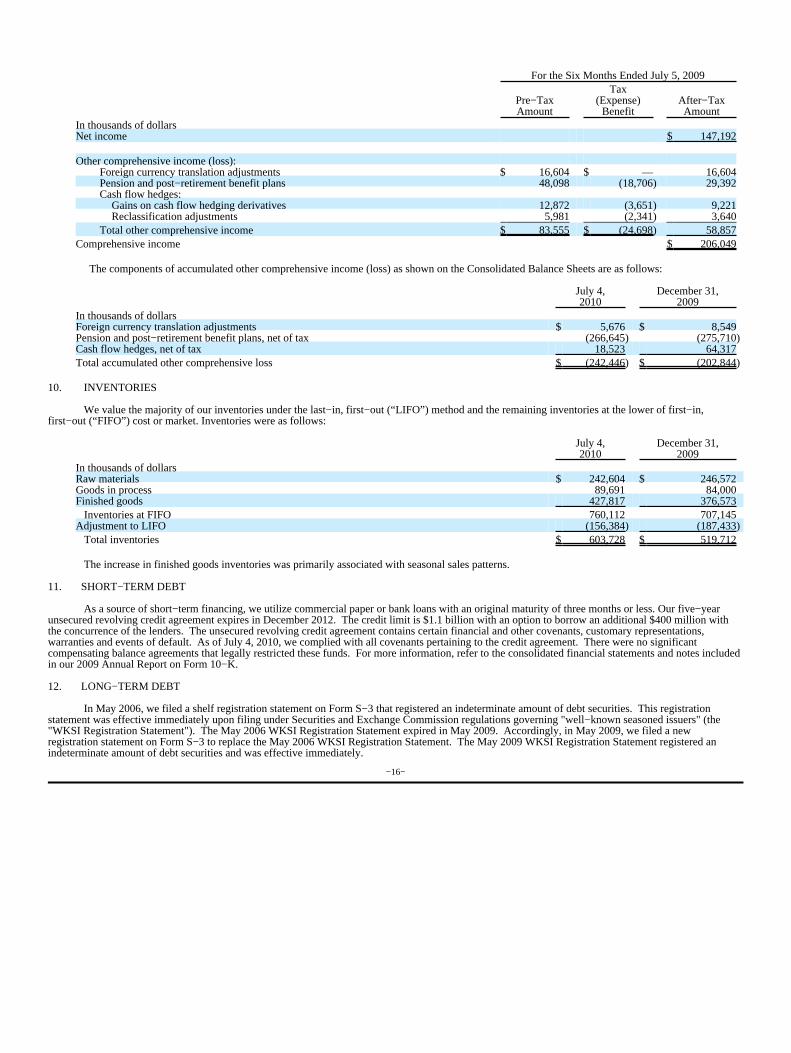
For the Six Months Ended July 5, 2009
Pre−TaxAmount
Tax(Expense)
BenefitAfter−TaxAmount
In thousands of dollarsNet income $ 147,192
Other comprehensive income (loss):Foreign currency translation adjustments $ 16,604 $ — 16,604Pension and post−retirement benefit plans 48,098 (18,706) 29,392Cash flow hedges:
Gains on cash flow hedging derivatives 12,872 (3,651) 9,221Reclassification adjustments 5,981 (2,341) 3,640
Total other comprehensive income $ 83,555 $ (24,698) 58,857Comprehensive income $ 206,049
The components of accumulated other comprehensive income (loss) as shown on the Consolidated Balance Sheets are as follows:
July 4,2010
December 31,2009
In thousands of dollarsForeign currency translation adjustments $ 5,676 $ 8,549Pension and post−retirement benefit plans, net of tax (266,645) (275,710)Cash flow hedges, net of tax 18,523 64,317Total accumulated other comprehensive loss $ (242,446) $ (202,844)
10. INVENTORIES
We value the majority of our inventories under the last−in, first−out (“LIFO”) method and the remaining inventories at the lower of first−in,first−out (“FIFO”) cost or market. Inventories were as follows:
July 4,2010
December 31,2009
In thousands of dollarsRaw materials $ 242,604 $ 246,572Goods in process 89,691 84,000Finished goods 427,817 376,573 Inventories at FIFO 760,112 707,145Adjustment to LIFO (156,384) (187,433) Total inventories $ 603,728 $ 519,712
The increase in finished goods inventories was primarily associated with seasonal sales patterns.
11. SHORT−TERM DEBT
As a source of short−term financing, we utilize commercial paper or bank loans with an original maturity of three months or less. Our five−yearunsecured revolving credit agreement expires in December 2012. The credit limit is $1.1 billion with an option to borrow an additional $400 million withthe concurrence of the lenders. The unsecured revolving credit agreement contains certain financial and other covenants, customary representations,warranties and events of default. As of July 4, 2010, we complied with all covenants pertaining to the credit agreement. There were no significantcompensating balance agreements that legally restricted these funds. For more information, refer to the consolidated financial statements and notes includedin our 2009 Annual Report on Form 10−K.
12. LONG−TERM DEBT
In May 2006, we filed a shelf registration statement on Form S−3 that registered an indeterminate amount of debt securities. This registrationstatement was effective immediately upon filing under Securities and Exchange Commission regulations governing "well−known seasoned issuers" (the"WKSI Registration Statement"). The May 2006 WKSI Registration Statement expired in May 2009. Accordingly, in May 2009, we filed a newregistration statement on Form S−3 to replace the May 2006 WKSI Registration Statement. The May 2009 WKSI Registration Statement registered anindeterminate amount of debt securities and was effective immediately.
−16−

13. FINANCIAL INSTRUMENTS
The carrying amounts of financial instruments including cash and cash equivalents, accounts receivable, accounts payable and short−term debtapproximated fair value as of July 4, 2010 and December 31, 2009, because of the relatively short maturity of these instruments.
The carrying value of long−term debt, including the current portion, was $1,513.4 million as of July 4, 2010, compared with a fair value of$1,731.3 million, an increase of $217.9 million over the carrying value, based on quoted market prices for the same or similar debt issues.
Interest Rate Swaps
In order to minimize financing costs and to manage interest rate exposure, the Company, from time to time, enters into interest rate swapagreements. In March 2009, the Company entered into forward starting interest rate swap agreements to hedge interest rate exposure related to theanticipated $250 million of term financing expected to be executed during 2011 to repay $250 million of 5.3% Notes maturing in September 2011. Theweighted−average fixed rate on the forward starting swap agreements was 3.5%. The fair value of interest rate swap agreements was a net liability of $7.3million as of July 4, 2010. The Company’s risk related to interest rate swap agreements is limited to the cost of replacing such agreements at prevailingmarket rates. For more information, see Note 8. Derivative Instruments and Hedging Activities.
Foreign Exchange Forward Contracts
The following table summarizes our foreign exchange activity:
July 4, 2010ContractAmount Primary Currencies
In millions of dollars
Foreign exchange forward contracts topurchase foreign currencies $ 93.2
EurosCanadian dollars
Foreign exchange forward contracts tosell foreign currencies $ 119.7 Canadian dollars
Our foreign exchange forward contracts mature in 2010, 2011 and 2012. For more information, see Note 8. Derivative Instruments and HedgingActivities.
14. FAIR VALUE ACCOUNTING
We use certain derivative instruments, from time to time, to manage interest rate, foreign currency exchange rate and commodity market price riskexposures, all of which are recorded at fair value based on quoted market prices or rates.
A summary of our cash flow hedging derivative assets and liabilities measured at fair value on a recurring basis as of July 4, 2010, is as follows:
DescriptionFair Value as
of July 4, 2010
Quoted Pricesin Active
Markets ofIdentical Assets
(Level 1)
Significant OtherObservable
Inputs (Level 2)
SignificantUnobservable
Inputs(Level 3)
In thousands of dollarsAssetsCash flow hedging derivatives $ 7,452 $ 567 $ 6,885 $ —
LiabilitiesCash flow hedging derivatives $ 20,940 $ 9,211 $ 11,729 $ —
−17−

As of July 4, 2010, cash flow hedging derivative Level 1 assets were associated with the fair value of commodity options contracts. Cash flowhedging derivative Level 1 liabilities were related to cash transfers payable on commodities futures contracts reflecting the change in quoted market priceson the last trading day for the period. We make or receive cash transfers to or from commodity futures brokers on a daily basis reflecting changes in thevalue of futures contracts on the IntercontinentalExchange or various other exchanges. These changes in value represent unrealized gains and losses.
As of July 4, 2010, cash flow hedging derivative Level 2 assets were related to the fair value of foreign exchange forward contracts withgains. Cash flow hedging derivative Level 2 liabilities were related to the fair value of interest rate swap agreements and foreign exchange forwardcontracts with losses. For more information, see Note 8. Derivative Instruments and Hedging Activities.
A summary of our cash flow hedging derivative assets and liabilities measured at fair value on a recurring basis as of December 31, 2009, is asfollows:
DescriptionFair Value as of
December 31, 2009
Quoted Prices inActive Markets
of IdenticalAssets (Level 1)
Significant OtherObservable
Inputs (Level 2)
SignificantUnobservable
Inputs(Level 3)
In thousands of dollarsAssetsCash flow hedging derivatives $ 23,878 $ 11,835 $ 12,043 $ —
LiabilitiesCash flow hedging derivatives $ 10,936 $ 3,228 $ 7,708 $ —
As of December 31, 2009, cash flow hedging derivative Level 1 assets were associated with the fair value of commodity options contracts. As ofDecember 31, 2009, cash flow hedging derivative Level 1 liabilities were related to cash transfers payable on commodities futures contracts reflecting thechange in quoted market prices on the last trading day for the period. We make or receive cash transfers to or from commodity futures brokers on a dailybasis reflecting changes in the value of futures contracts on the IntercontinentalExchange or various other exchanges. These changes in value representunrealized gains and losses.
As of December 31, 2009, cash flow hedging derivative Level 2 assets were related to the fair value of interest rate swap agreements and foreignexchange forward contracts with gains. Cash flow hedging derivative Level 2 liabilities were related to the fair value of foreign exchange forward contractswith losses. We define the fair value of foreign exchange forward contracts as the amount of the difference between the contracted and current marketforeign currency exchange rates at the end of the period. We estimate the fair value of foreign exchange forward contracts on a quarterly basis by obtainingmarket quotes of spot and forward rates for contracts with similar terms, adjusted where necessary for maturity differences.
15. INCOME TAXES
The number of years with open tax audits varies depending on the tax jurisdiction. Our major taxing jurisdictions include the United States (federaland state), Canada and Mexico. During the second quarter of 2009, the U.S. Internal Revenue Service (“IRS”) completed its audit of our U.S. income taxreturns for 2005 and 2006, resulting in the resolution of tax contingencies associated with the 2004, 2005 and 2006 tax years. During the fourth quarter2009, the IRS commenced its audit of our U.S. income tax returns for 2007 and 2008. Tax examinations by various state taxing authorities could generallybe conducted for years beginning in 2004. We are no longer subject to Canadian federal income tax examinations by the Canada Revenue Agency (“CRA”)for years before 1999, and we are no longer subject to Mexican federal income tax examinations by Servicio de Administracion Tributaria (“SAT”) foryears before 2004. U.S., Canadian and Mexican federal audit issues typically involve the timing of deductions and transfer pricing adjustments. We workwith the IRS, the CRA and the SAT to resolve proposed audit adjustments and to minimize the amount of adjustments. We do not anticipate that anypotential tax adjustments will have a significant impact on our financial position or results of operations. We reasonably expect reductions in the liabilityfor unrecognized tax benefits of approximately $10.0 million within the next 12 months because of the expiration of statutes of limitations and settlementsof tax audits.
−18−
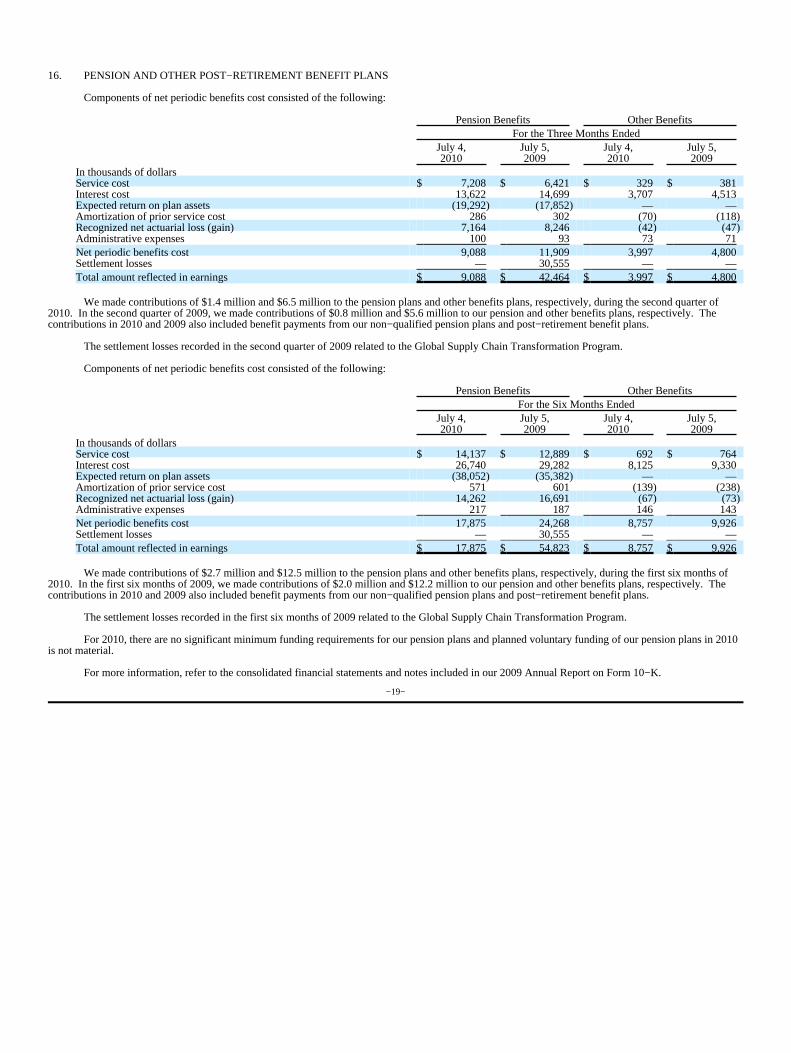
16. PENSION AND OTHER POST−RETIREMENT BENEFIT PLANS
Components of net periodic benefits cost consisted of the following:
Pension Benefits Other BenefitsFor the Three Months Ended
July 4,2010
July 5,2009
July 4,2010
July 5,2009
In thousands of dollarsService cost $ 7,208 $ 6,421 $ 329 $ 381Interest cost 13,622 14,699 3,707 4,513Expected return on plan assets (19,292) (17,852) — —Amortization of prior service cost 286 302 (70) (118)Recognized net actuarial loss (gain) 7,164 8,246 (42) (47)Administrative expenses 100 93 73 71Net periodic benefits cost 9,088 11,909 3,997 4,800Settlement losses — 30,555 — —Total amount reflected in earnings $ 9,088 $ 42,464 $ 3,997 $ 4,800
We made contributions of $1.4 million and $6.5 million to the pension plans and other benefits plans, respectively, during the second quarter of2010. In the second quarter of 2009, we made contributions of $0.8 million and $5.6 million to our pension and other benefits plans, respectively. Thecontributions in 2010 and 2009 also included benefit payments from our non−qualified pension plans and post−retirement benefit plans.
The settlement losses recorded in the second quarter of 2009 related to the Global Supply Chain Transformation Program.
Components of net periodic benefits cost consisted of the following:
Pension Benefits Other BenefitsFor the Six Months Ended
July 4,2010
July 5,2009
July 4,2010
July 5,2009
In thousands of dollarsService cost $ 14,137 $ 12,889 $ 692 $ 764Interest cost 26,740 29,282 8,125 9,330Expected return on plan assets (38,052) (35,382) — —Amortization of prior service cost 571 601 (139) (238)Recognized net actuarial loss (gain) 14,262 16,691 (67) (73)Administrative expenses 217 187 146 143Net periodic benefits cost 17,875 24,268 8,757 9,926Settlement losses — 30,555 — —Total amount reflected in earnings $ 17,875 $ 54,823 $ 8,757 $ 9,926
We made contributions of $2.7 million and $12.5 million to the pension plans and other benefits plans, respectively, during the first six months of2010. In the first six months of 2009, we made contributions of $2.0 million and $12.2 million to our pension and other benefits plans, respectively. Thecontributions in 2010 and 2009 also included benefit payments from our non−qualified pension plans and post−retirement benefit plans.
The settlement losses recorded in the first six months of 2009 related to the Global Supply Chain Transformation Program.
For 2010, there are no significant minimum funding requirements for our pension plans and planned voluntary funding of our pension plans in 2010is not material.
For more information, refer to the consolidated financial statements and notes included in our 2009 Annual Report on Form 10−K.
−19−
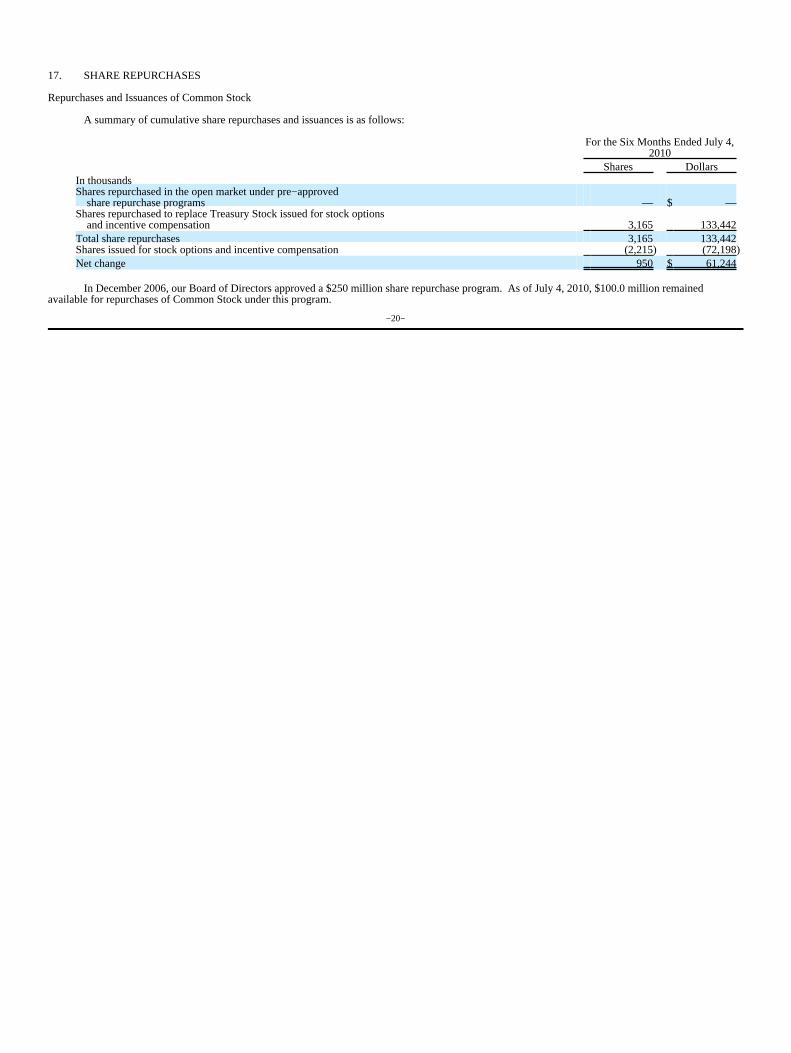
17. SHARE REPURCHASES
Repurchases and Issuances of Common Stock
A summary of cumulative share repurchases and issuances is as follows:
For the Six Months Ended July 4,2010
Shares DollarsIn thousandsShares repurchased in the open market under pre−approved share repurchase programs — $ —Shares repurchased to replace Treasury Stock issued for stock options and incentive compensation 3,165 133,442Total share repurchases 3,165 133,442Shares issued for stock options and incentive compensation (2,215) (72,198)Net change 950 $ 61,244
In December 2006, our Board of Directors approved a $250 million share repurchase program. As of July 4, 2010, $100.0 million remainedavailable for repurchases of Common Stock under this program.
−20−
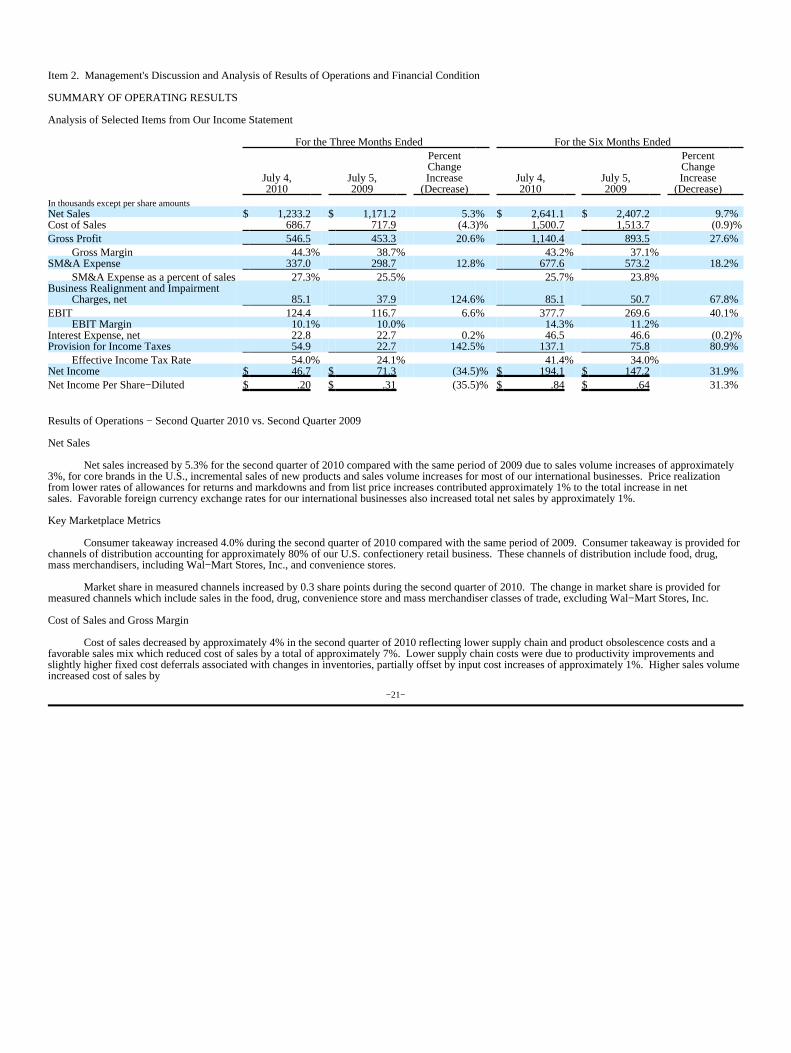
Item 2. Management's Discussion and Analysis of Results of Operations and Financial Condition
SUMMARY OF OPERATING RESULTS
Analysis of Selected Items from Our Income Statement
For the Three Months Ended For the Six Months Ended
July 4,2010
July 5,2009
PercentChangeIncrease
(Decrease)July 4,2010
July 5,2009
PercentChangeIncrease
(Decrease)In thousands except per share amountsNet Sales $ 1,233.2 $ 1,171.2 5.3% $ 2,641.1 $ 2,407.2 9.7%Cost of Sales 686.7 717.9 (4.3)% 1,500.7 1,513.7 (0.9)%Gross Profit 546.5 453.3 20.6% 1,140.4 893.5 27.6%
Gross Margin 44.3% 38.7% 43.2% 37.1%SM&A Expense 337.0 298.7 12.8% 677.6 573.2 18.2%
SM&A Expense as a percent of sales 27.3% 25.5% 25.7% 23.8%Business Realignment and Impairment
Charges, net 85.1 37.9 124.6% 85.1 50.7 67.8%EBIT 124.4 116.7 6.6% 377.7 269.6 40.1%
EBIT Margin 10.1% 10.0% 14.3% 11.2%Interest Expense, net 22.8 22.7 0.2% 46.5 46.6 (0.2)%Provision for Income Taxes 54.9 22.7 142.5% 137.1 75.8 80.9%
Effective Income Tax Rate 54.0% 24.1% 41.4% 34.0%Net Income $ 46.7 $ 71.3 (34.5)% $ 194.1 $ 147.2 31.9%Net Income Per Share−Diluted $ .20 $ .31 (35.5)% $ .84 $ .64 31.3%
Results of Operations − Second Quarter 2010 vs. Second Quarter 2009
Net Sales
Net sales increased by 5.3% for the second quarter of 2010 compared with the same period of 2009 due to sales volume increases of approximately3%, for core brands in the U.S., incremental sales of new products and sales volume increases for most of our international businesses. Price realizationfrom lower rates of allowances for returns and markdowns and from list price increases contributed approximately 1% to the total increase in netsales. Favorable foreign currency exchange rates for our international businesses also increased total net sales by approximately 1%.
Key Marketplace Metrics
Consumer takeaway increased 4.0% during the second quarter of 2010 compared with the same period of 2009. Consumer takeaway is provided forchannels of distribution accounting for approximately 80% of our U.S. confectionery retail business. These channels of distribution include food, drug,mass merchandisers, including Wal−Mart Stores, Inc., and convenience stores.
Market share in measured channels increased by 0.3 share points during the second quarter of 2010. The change in market share is provided formeasured channels which include sales in the food, drug, convenience store and mass merchandiser classes of trade, excluding Wal−Mart Stores, Inc.
Cost of Sales and Gross Margin
Cost of sales decreased by approximately 4% in the second quarter of 2010 reflecting lower supply chain and product obsolescence costs and afavorable sales mix which reduced cost of sales by a total of approximately 7%. Lower supply chain costs were due to productivity improvements andslightly higher fixed cost deferrals associated with changes in inventories, partially offset by input cost increases of approximately 1%. Higher sales volumeincreased cost of sales by
−21−

approximately 3%. Business realignment charges of $1.0 million were included in cost of sales in the second quarter of 2010 compared with $3.1 million inthe second quarter of 2009.
Gross margin increased by 5.6%. Lower supply chain costs increased gross margin by almost 4%, while price realization and lower productobsolescence costs each increased gross margin by about 1%. Slightly higher input costs reduced gross margin by about 1%. Business realignment andimpairment charges had the effect of decreasing gross margin by 0.2% as compared with 2009.
Selling, Marketing and Administrative
Higher selling, marketing and administrative costs were associated with increased advertising and other marketing expenses which increased $35.7million compared with 2009. Advertising expense increased approximately 50% from last year. Employee−related costs, selling and legal expensesincreased, but were substantially offset by lower incentive compensation expense, due to the impact of adjustments to long−term incentive compensationexpense for improved company performance recorded in the second quarter of 2009. Business realignment charges of $0.1 million were included in selling,marketing and administrative expenses in the second quarter of 2010 compared with $1.7 million in the second quarter of 2009.
Business Realignment and Impairment Charges
Total pre−tax business realignment and impairment charges of $85.1 million were recorded in the second quarter of 2010, including a non−cashgoodwill impairment charge of $44.7 million related to our Godrej Hershey Ltd. joint venture and $40.4 million associated with the Project Next Centuryprogram related to estimated employee severance and asset retirement costs. Charges of $37.9 million were recorded in the second quarter of 2009associated with the Global Supply Chain Transformation program related to pension settlement charges, fixed asset impairment and plant closure expenses.
Income Before Interest and Income Taxes and EBIT Margin
EBIT increased in the second quarter of 2010 compared with the second quarter of 2009 as a result of higher gross profit, offset by increased selling,marketing and administrative expenses and higher business realignment and impairment charges. Net pre−tax business realignment and impairment chargesof $86.2 million were recorded in the second quarter of 2010 compared with $42.7 million recorded in the second quarter of 2009.
EBIT margin increased from 10.0% for the second quarter of 2009 to 10.1% for the second quarter of 2010. The increase was attributable to thehigher gross margin, offset by higher selling, marketing and administrative expense as a percentage of sales. The impact of net business realignment andimpairment charges reduced EBIT margin by 7% in 2010 and by 3.6% in 2009.
Interest Expense, Net
Net interest expense in 2010 was essentially even with the prior year. Lower interest expense was offset by a decrease in capitalized interest.
Income Taxes and Effective Tax Rate
Our effective income tax rate was 54.0% for the second quarter of 2010 compared with 24.1% for the same period of 2009. The increased tax ratefor the second quarter of 2010 reflected the comparison to the impact of a favorable resolution of tax contingencies associated with the 2004, 2005 and 2006tax years which reduced the 2009 tax rate by approximately 11.2%. The impact of tax rates associated with business realignment and impairment chargesincreased the effective income tax rate by 16.3% in 2010 and decreased the effective income tax rate by 4.2% in 2009.
Net Income and Net Income Per Share
Earnings per share−diluted in the second quarter of 2010 decreased $0.11, or 35.5% as compared with the second quarter of 2009. Net income inthe second quarter of 2010 was reduced by $70.3 million, or $0.31 per share−diluted, and was reduced by $26.7 million, or $0.12 per share−diluted, in thesecond quarter of 2009 as a result of business realignment and impairment charges. Excluding the impact of business realignment and impairment charges,earnings per share−diluted increased $0.08 or 18.6% due to lower supply chain costs, sales volume increases and net price realization, partially offset byhigher advertising and other selling, marketing and administrative expenses, along with the higher effective income tax rate.
−22−

Results of Operations – First Six Months 2010 vs. First Six Months 2009
Net Sales
An increase in net sales of 9.7% in the first six months of 2010 compared with the same period in 2009 was attributable to sales volume increases ofabout 6% primarily for core brands in the U.S. and sales of new products, along with price realization of approximately 3%. Sales volume increases andprice realization for our international businesses contributed 1% to the total net sales increase, along with the favorable impact of foreign currency exchangerates which also increased net sales by approximately 1%. The acquisition of Van Houten Singapore increased net sales by $1.4 million in the first sixmonths of 2010.
Key Marketplace Metrics
Consumer takeaway increased 5.6% during the first six months of 2010 compared with the same period of 2009. Consumer takeaway is providedfor channels of distribution accounting for approximately 80% of our U.S. confectionery retail business. These channels of distribution include food, drug,mass merchandisers, including Wal−Mart Stores, Inc., and convenience stores.
Market share in measured channels improved by 0.3 share points during the first six months of 2010. The change in market share is provided formeasured channels which include sales in the food, drug, convenience store and mass merchandiser classes of trade, excluding Wal−Mart Stores, Inc.
Cost of Sales and Gross Margin
The cost of sales decrease of 0.9% in the first six months of 2010 compared with 2009 was associated with lower supply chain costs, primarilyreflecting productivity improvements, and cost decreases resulting from a favorable sales mix, along with lower input and product obsolescence costs whichreduced cost of sales by a total of 7%. These decreases were partially offset by sales volume increases resulting in higher cost of sales of about 6%. Lowerbusiness realignment and impairment charges included in cost of sales in 2010 compared with 2009 also contributed to the cost of sales decrease. Businessrealignment and impairment charges of $1.0 million were included in cost of sales in the first six months of 2010, compared with $7.2 million in the prioryear.
The gross margin improvement of 6.1% resulted from favorable price realization of about 3%, supply chain productivity improvements ofapproximately 2% and lower product obsolescence costs of 1%. The impact of business realignment and impairment charges recorded in 2010 comparedwith 2009 also contributed to the gross margin increase.
Selling, Marketing and Administrative
Selling, marketing and administrative expenses in the first six months of 2010 increased primarily as a result of higher advertising and othermarketing expenses which increased $72.7 million, or 39.8%. Advertising expense for the first six months of 2010 increased 58.5% compared with thesame period of 2009. An increase in other selling, marketing and administrative expenses were associated with higher legal expenses, investments toimprove our selling capabilities, employee−related expenses and costs related to the consideration of a transaction with Cadbury plc. Business realignmentcharges of $3.8 million were included in selling, marketing and administrative expenses in 2009 compared with $0.1 million in 2010.
Business Realignment and Impairment Charges
Total pre−tax business realignment and impairment charges of $85.1 million were recorded in the second quarter of 2010, including a non−cashgoodwill impairment charge of $44.7 related to our Godrej Hershey Ltd. joint venture and $40.4 million associated with the Project Next Century programrelated to estimated employee severance and asset retirement costs. Charges of $50.7 million were recorded in the first six months of 2009 associated withthe Global Supply Chain Transformation program related to pension settlement charges, plant closure expenses, fixed asset impairment and employeeseparation costs.
−23−

Income Before Interest and Income Taxes and EBIT Margin
EBIT increased in the first six months of 2010 compared with the first six months of 2009 as a result of higher gross profit, partially offset byincreased selling, marketing and administrative expenses. Net pre−tax business realignment and impairment charges of $86.2 million were recorded in thefirst six months of 2010 compared with $61.7 million recorded in the first six months of 2009, an increase of $24.5 million.
EBIT margin increased from 11.2% for the first six months of 2009 to 14.3% for the first six months of 2010. The increase in EBIT margin was theresult of the higher gross margin, partially offset by higher selling, marketing and administrative expense as a percentage of sales. Business realignment andimpairment charges in the first six months of 2010 reduced EBIT margin by 3.3% and in the first six months of 2009 reduced EBIT margin by 2.6%.
Interest Expense, Net
Net interest expense in the first six months of 2010 was essentially even with the comparable period of 2009 as lower interest expense was offset bya decrease in capitalized interest.
Income Taxes and Effective Tax Rate
Our effective income tax rate was 41.4% for the first six months of 2010 compared with 34.0% for the first six months of 2009. The effectiveincome tax rate was increased by 4.7% as a result of the effective tax rate associated with business realignment and impairment charges recorded during thefirst six months of 2010. The effective income tax rate related to business realignment and impairment charges recorded in 2009 reduced the rate by1.4%. We expect our effective income tax rate for the full year 2010 to be approximately 35.0%, excluding the impact of tax rates associated with businessrealignment and impairment charges during the year.
Net Income and Net Income Per Share
Earnings per share−diluted for the first six months of 2010 increased $0.20, or 31.3% compared with the same period of the prior year. Net incomein the first six months of 2010 was reduced by $70.3 million, or $0.31 per share−diluted, and was reduced by $36.8 million, or $0.17 per share−diluted, inthe first six months of 2009 as a result of business realignment and impairment charges. Excluding the impact of business realignment and impairmentcharges in each period, earnings per share−diluted in the first six months of 2010 increased $0.34 or 42.0% as compared with the first six months of 2009.
Liquidity and Capital Resources
Historically, our major source of financing has been cash generated from operations. Domestic seasonal working capital needs, which typicallypeak during the summer months, generally have been met by issuing commercial paper. Commercial paper may also be issued from time to time to financeongoing business transactions such as the repayment of long−term debt, business acquisitions and for other general corporate purposes. During the first sixmonths of 2010, cash and cash equivalents decreased by $4.5 million to $249.1 million.
Cash provided from operations and other cash inflows during the first six months of 2010 were sufficient to fund dividend payments of$141.7 million, the repurchase of Common Stock of $133.4 million and capital additions and capitalized software expenditures of $74.9 million.
Net cash provided from operating activities was $264.8 million in 2010 and $446.2 million in 2009. The decrease was attributable to the change incash used by other assets and liabilities and lower cash provided from changes in accounts receivable, partially offset by higher net income in 2010. Cashused by changes in other assets and liabilities increased to $168.7 million for the first six months of 2010 from $34.3 million for the same period of2009. The increase in the amount of cash used by other assets and liabilities from 2009 to 2010 reflected the effect of hedging transactions of$133.4 million. Cash provided from working capital was $51.3 million in 2010 and $146.5 million in 2009. The decrease was principally related to higheraccounts receivable resulting from higher sales in 2010.
In March 2009, the Company completed the acquisition of the Van Houten Singapore consumer business. The acquisition from Barry Callebaut,AG provides the Company with an exclusive license of the Van Houten brand name and related trademarks in Asia and the Middle East for the retail andduty−free distribution channels. The purchase price for the acquisition of Van Houten Singapore and the licensing agreement was approximately $15.2million.
Interest paid was $45.8 million during the first six months of 2010 versus $46.7 million for the comparable period of 2009. Income taxes paid were$201.6 million during the first six months of 2010 versus $109.2 million for the comparable period of 2009. The increase in taxes paid in 2010 wasprimarily related to the impact of higher annualized taxable income in 2010.
−24−
The ratio of current assets to current liabilities increased to 1.6:1.0 as of July 4, 2010 from 1.5:1.0 as of December 31, 2009. The capitalization ratio(total short−term and long−term debt as a percent of stockholders' equity, short−term and long−term debt) increased to 68% as of July 4, 2010 from 67% asof December 31, 2009.
Generally, our short−term borrowings are in the form of commercial paper or bank loans with an original maturity of three months orless. However, at the end of the second quarter of 2010, no commercial paper borrowings were outstanding. Our five−year unsecured revolving creditagreement expires in December 2012. The credit limit is $1.1 billion with an option to borrow an additional $400 million with the concurrence of thelenders.
Outlook
The outlook section contains a number of forward−looking statements, all of which are based on current expectations. Actual results may differmaterially. Refer to the Safe Harbor Statement below as well as Risk Factors and other information contained in our 2009 Annual Report on Form 10−K forinformation concerning the key risks to achieving future performance goals.
We expect the economic environment to continue to be challenging for the remainder of 2010. In this environment, we will continue to build ourbusiness by focusing on a consumer−driven approach to core brand investment and new product innovation in North America, along with investments in ourstrategic international businesses.
For the full year 2010, we now expect net sales growth of about 7%, including an approximate 1% benefit from foreign currency exchange rates.
We now expect to increase advertising investment by 45% to 50% in 2010 behind our core brands and new product introductions. We will alsocontinue to invest in consumer insights, in−store selling, new innovation on our Reese’s and Hershey’s franchises and quality merchandising andprogramming to drive profitable growth for both our Company and our customers.
We expect our cost structure to remain at elevated levels in 2010. Key commodity markets remain volatile, however, we have good visibility intoour full−year cost structure for 2010. We also expect to continue to achieve productivity and efficiency improvements, resulting in enhanced margins forthe full year, but not at the rate achieved in the first six months of the year. Specifically, the comparison of expected results for the remainder of 2010 toresults for the last six months of 2009 will reflect less net price realization as we have completely lapped the August 2008 price increase. We have alsorealized all of the targeted GSCT savings. In addition, we anticipate a shift in seasonal orders out of the fourth quarter of 2010 into the first quarter of 2011due to the timing and refinement of logistical requirements. We do not expect year−end LIFO inventory to be as favorable in 2010 as it was in2009. Earnings per share−diluted is expected to be in the $2.04 to $2.12 range for 2010. Excluding business realignment and impairment charges, weexpect to achieve adjusted gross margin and adjusted EBIT margin expansion for the full year that will result in adjusted earnings per share−diluted in the$2.47 to $2.52 range, an increase of low−to−mid teens on a percentage basis, versus adjusted earnings per share−diluted for 2009.
We expect total capital additions to be in the $190 million to $210 million range, with $140 million to $160 million for operating capital additionsand approximately $55 million for Project Next Century.
Note: In the Outlook above, the Company has provided income measures excluding certain items, in addition to net income determined inaccordance with GAAP. These non−GAAP financial measures are used in evaluating results of operations for internal purposes. These non−GAAPmeasures are not intended to replace the presentation of financial results in accordance with GAAP. Rather, the Company believes exclusion of such itemsprovides additional information to investors to facilitate the comparison of past and present operations.
In 2009, the Company recorded GAAP charges, including non−cash pension settlement charges, of $99.1 million, or $0.27 per share−diluted,attributable to the GSCT program. Except for possible non−cash pension settlement charges, the Company does not expect any significant charges relatedto the GSCT program in 2010. In 2010, the Company expects to record total GAAP charges of about $75 million to $85 million, or $0.20 to $0.23 pershare−diluted, attributable to Project Next Century. Additionally, in the second quarter of 2010, the Company recorded a non−cash goodwill impairmentcharge of $44.7 million, or $0.20 per share−diluted, related to the Godrej Hershey Ltd. joint venture.
−25−
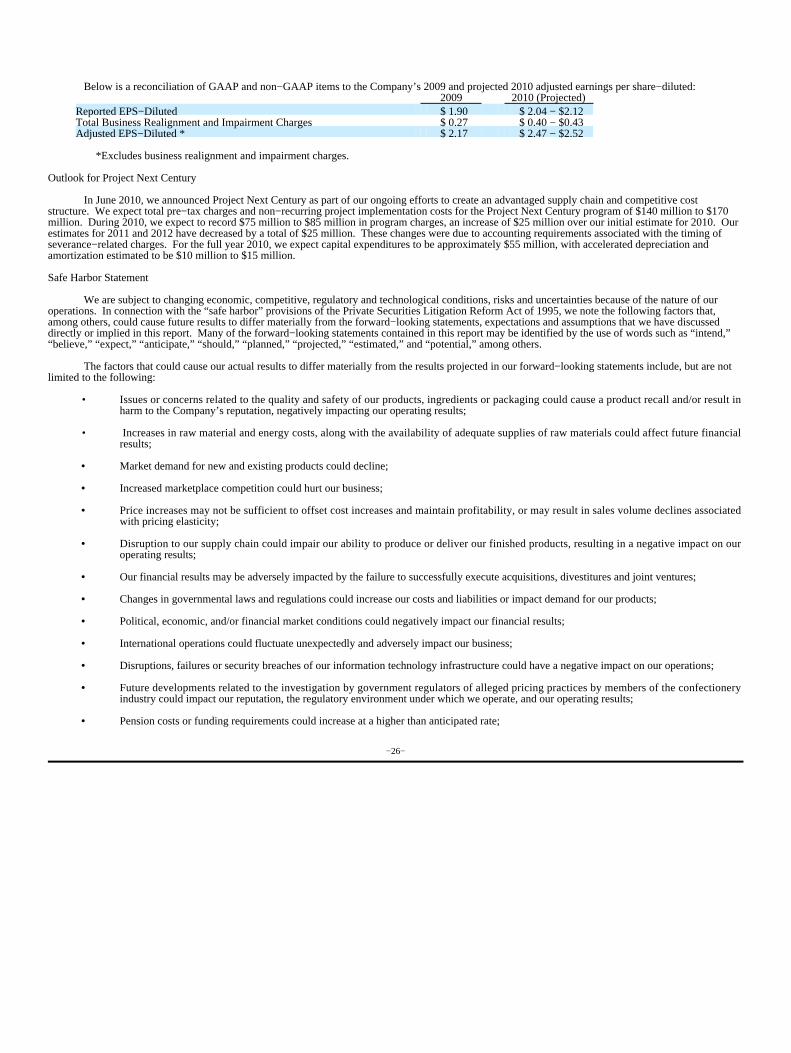
Below is a reconciliation of GAAP and non−GAAP items to the Company’s 2009 and projected 2010 adjusted earnings per share−diluted:2009 2010 (Projected)
Reported EPS−Diluted $ 1.90 $ 2.04 − $2.12Total Business Realignment and Impairment Charges $ 0.27 $ 0.40 − $0.43Adjusted EPS−Diluted * $ 2.17 $ 2.47 − $2.52
*Excludes business realignment and impairment charges.
Outlook for Project Next Century
In June 2010, we announced Project Next Century as part of our ongoing efforts to create an advantaged supply chain and competitive coststructure. We expect total pre−tax charges and non−recurring project implementation costs for the Project Next Century program of $140 million to $170million. During 2010, we expect to record $75 million to $85 million in program charges, an increase of $25 million over our initial estimate for 2010. Ourestimates for 2011 and 2012 have decreased by a total of $25 million. These changes were due to accounting requirements associated with the timing ofseverance−related charges. For the full year 2010, we expect capital expenditures to be approximately $55 million, with accelerated depreciation andamortization estimated to be $10 million to $15 million.
Safe Harbor Statement
We are subject to changing economic, competitive, regulatory and technological conditions, risks and uncertainties because of the nature of ouroperations. In connection with the “safe harbor” provisions of the Private Securities Litigation Reform Act of 1995, we note the following factors that,among others, could cause future results to differ materially from the forward−looking statements, expectations and assumptions that we have discusseddirectly or implied in this report. Many of the forward−looking statements contained in this report may be identified by the use of words such as “intend,”“believe,” “expect,” “anticipate,” “should,” “planned,” “projected,” “estimated,” and “potential,” among others.
The factors that could cause our actual results to differ materially from the results projected in our forward−looking statements include, but are notlimited to the following:
• Issues or concerns related to the quality and safety of our products, ingredients or packaging could cause a product recall and/or result inharm to the Company’s reputation, negatively impacting our operating results;
• Increases in raw material and energy costs, along with the availability of adequate supplies of raw materials could affect future financialresults;
• Market demand for new and existing products could decline;
• Increased marketplace competition could hurt our business;
• Price increases may not be sufficient to offset cost increases and maintain profitability, or may result in sales volume declines associatedwith pricing elasticity;
• Disruption to our supply chain could impair our ability to produce or deliver our finished products, resulting in a negative impact on ouroperating results;
• Our financial results may be adversely impacted by the failure to successfully execute acquisitions, divestitures and joint ventures;
• Changes in governmental laws and regulations could increase our costs and liabilities or impact demand for our products;
• Political, economic, and/or financial market conditions could negatively impact our financial results;
• International operations could fluctuate unexpectedly and adversely impact our business;
• Disruptions, failures or security breaches of our information technology infrastructure could have a negative impact on our operations;
• Future developments related to the investigation by government regulators of alleged pricing practices by members of the confectioneryindustry could impact our reputation, the regulatory environment under which we operate, and our operating results;
• Pension costs or funding requirements could increase at a higher than anticipated rate;
−26−

• Implementation of our Project Next Century program may not occur within the anticipated timeframe and/or may exceed our cost estimates;
• Annual savings from initiatives to transform our supply chain and advance our value−enhancing strategy may be less than we expect; and
• Such other matters as discussed in our Annual Report on Form 10−K for 2009.
Item 3. Quantitative and Qualitative Disclosures About Market Risk
The potential net loss in fair value of interest rate swap agreements of ten percent resulting from a hypothetical near−term adverse change in marketrates was $3.7 million as of July 4, 2010 and was $4.9 million as of December 31, 2009. The potential net loss in fair value of foreign exchange forwardcontracts and options of ten percent resulting from a hypothetical near−term adverse change in market rates was $21.2 million as of July 4, 2010 and was$10.9 million as of December 31, 2009. The market risk resulting from a hypothetical adverse market price movement of ten percent associated with theestimated average fair value of net commodity positions increased from $36.3 million as of December 31, 2009, to $47.8 million as of July 4, 2010. Marketrisk represents ten percent of the estimated average fair value of net commodity positions at four dates prior to the end of each period.
Item 4. Controls and Procedures
Disclosure controls and procedures are controls and other procedures that are designed to ensure that information required to be disclosed in ourreports filed or submitted under the Securities Exchange Act of 1934 (the "Exchange Act") is recorded, processed, summarized and reported within the timeperiods specified in the Securities and Exchange Commission's rules and forms. Disclosure controls and procedures include, without limitation, controlsand procedures designed to ensure that information required to be disclosed in our reports filed under the Exchange Act is accumulated and communicatedto management, including the Company's Chief Executive Officer and Chief Financial Officer, as appropriate, to allow timely decisions regarding requireddisclosure.
As of the end of the period covered by this quarterly report, we conducted an evaluation of the effectiveness of the design and operation of ourdisclosure controls and procedures, as required by Rule 13a−15 under the Exchange Act. This evaluation was carried out under the supervision and with theparticipation of the Company's management, including our Chief Executive Officer and Chief Financial Officer. Based upon that evaluation, our ChiefExecutive Officer and Chief Financial Officer concluded that the Company's disclosure controls and procedures are effective. There has been no changeduring the most recent fiscal quarter in our internal control over financial reporting identified in connection with the evaluation that has materially affected,or is reasonably likely to materially affect, our internal control over financial reporting.
−27−

PART II − OTHER INFORMATION
Items 1, 1A, 3 and 5 have been omitted as not applicable.
Item 2 − Unregistered Sales of Equity Securities and Use of Proceeds
Issuer Purchases of Equity Securities
Period
(a) Total Numberof SharesPurchased
(b) Average PricePaid
per Share
(c) Total Numberof Shares
Purchased as Partof Publicly
Announced Plansor Programs
(d) ApproximateDollar Value ofShares that May
Yet Be PurchasedUnder the Plans or
ProgramsApril 5 throughMay 2, 2010 — $ — — $ 100,017
May 3 throughMay 30, 2010 1,434,800 $ 46.66 — $ 100,017
May 31 throughJuly 4, 2010 50,000 $ 46.98 — $ 100,017
Total 1,484,800 $ 46.67 —
Item 4 − Reserved
Item 6 − Exhibits
The following items are attached or incorporated herein by reference:
ExhibitNumber
Description
12.1 Statement showing computation of ratio of earnings to fixed charges for the six months ended July 4, 2010 and July 5, 2009.
31.1 Certification of David J. West, Chief Executive Officer, pursuant to Section 302 of the Sarbanes−Oxley Act of 2002.
31.2 Certification of Humberto P. Alfonso, Chief Financial Officer, pursuant to Section 302 of the Sarbanes−Oxley Act of 2002.
32.1 Certification of David J. West, Chief Executive Officer, and Humberto P. Alfonso, Chief Financial Officer, pursuant to Section 906 ofthe Sarbanes−Oxley Act of 2002.
101.INS XBRL Instance Document
101.SCH XBRL Taxonomy Extension Schema
101.CAL XBRL Taxonomy Extension Calculation Linkbase
101.LAB XBRL Taxonomy Extension Label Linkbase
101.PRE XBRL Taxonomy Extension Presentation Linkbase
101.DEF XBRL Taxonomy Extension Definition Linkbase
−28−

SIGNATURES
Pursuant to the requirements of the Securities Exchange Act of 1934, the Company has duly caused this report to be signed on its behalf by the undersignedthereunto duly authorized.
THE HERSHEY COMPANY(Registrant)
Date: August 11, 2010 /s/Humberto P. Alfonso Humberto P. Alfonso Chief Financial Officer
Date: August 11, 2010 /s/David W. Tacka David W. Tacka Chief Accounting Officer
−29−

EXHIBIT INDEX
Exhibit 12.1 Computation of Ratio of Earnings to Fixed Charges
Exhibit 31.1 Certification of David J. West, Chief Executive Officer, pursuant to Section 302 of the Sarbanes−Oxley Act of 2002
Exhibit 31.2 Certification of Humberto P. Alfonso, Chief Financial Officer, pursuant to Section 302 of the Sarbanes−Oxley Act of 2002
Exhibit 32.1 Certification of David J. West, Chief Executive Officer, and Humberto P. Alfonso, Chief Financial Officer, pursuant to Section 906 ofthe Sarbanes−Oxley Act of 2002
Exhibit 101.INS XBRL Instance Document
Exhibit 101.SCH XBRL Taxonomy Extension Schema
Exhibit 101.CAL XBRL Taxonomy Extension Calculation Linkbase
Exhibit 101.LAB XBRL Taxonomy Extension Label Linkbase
Exhibit 101.PRE XBRL Taxonomy Extension Presentation Linkbase
Exhibit 101.DEF XBRL Taxonomy Extension Definition Linkbase
−30−


EXHIBIT 12.1THE HERSHEY COMPANY
COMPUTATION OF RATIO OF EARNINGS TO FIXED CHARGES(in thousands of dollars except for ratios)
(Unaudited)
For the Six Months EndedJuly 4,2010
July 5,2009
Earnings:
Income before income taxes $ 331,229 $ 222,980
Add (deduct):Interest on indebtedness 48,025 48,466Portion of rents representative of the interest factor (a) 3,474 4,454Amortization of debt expense 497 498Amortization of capitalized interest 592 726Adjustment to exclude noncontrolling interests in subsidiaries and income from equity investee (4,596) (3,316)
Earnings as adjusted $ 379,221 $ 273,808
Fixed Charges:
Interest on indebtedness $ 48,025 $ 48,466Portion of rents representative of the interest factor (a) 3,474 4,454Amortization of debt expense 497 498Capitalized interest 1,004 1,291
Total fixed charges $ 53,000 $ 54,709
Ratio of earnings to fixed charges 7.16 5.00
NOTE:
(a) Portion of rents representative of the interest factor consists of one−third of rental expense for operating leases.


Exhibit 31.1
CERTIFICATION
I, David J. West, certify that:
1. I have reviewed this Quarterly Report on Form 10−Q of The Hershey Company;
2. Based on my knowledge, this report does not contain any untrue statement of a material fact or omit to state a material fact necessary to make thestatements made, in light of the circumstances under which such statements were made, not misleading with respect to the period covered by thisreport;
3. Based on my knowledge, the financial statements, and other financial information included in this report, fairly present in all material respects thefinancial condition, results of operations and cash flows of the registrant as of, and for, the periods presented in this report;
4. The registrant's other certifying officer(s) and I are responsible for establishing and maintaining disclosure controls and procedures (as defined inExchange Act Rules 13a−15(e) and 15d−15(e)) and internal control over financial reporting (as defined in Exchange Act Rules 13a−15(f) and15d−15(f)) for the registrant and have:
(a) Designed such disclosure controls and procedures, or caused such disclosure controls and procedures to be designed under our supervision, toensure that material information relating to the registrant, including its consolidated subsidiaries, is made known to us by others within thoseentities, particularly during the period in which this report is being prepared;
(b) Designed such internal control over financial reporting, or caused such internal control over financial reporting to be designed under oursupervision, to provide reasonable assurance regarding the reliability of financial reporting and the preparation of financial statements forexternal purposes in accordance with generally accepted accounting principles;
(c) Evaluated the effectiveness of the registrant's disclosure controls and procedures and presented in this report our conclusions about theeffectiveness of the disclosure controls and procedures, as of the end of the period covered by this report based on such evaluation; and
(d) Disclosed in this report any change in the registrant’s internal control over financial reporting that occurred during the registrant’s most recentfiscal quarter (the registrant’s fourth fiscal quarter in the case of an annual report) that has materially affected, or is reasonably likely to materiallyaffect, the registrant’s internal control over financial reporting; and
5. The registrant's other certifying officer(s) and I have disclosed, based on our most recent evaluation of internal control over financial reporting, to theregistrant's auditors and the audit committee of the registrant's board of directors (or persons performing the equivalent functions):
(a) All significant deficiencies and material weaknesses in the design or operation of internal control over financial reporting which are reasonablylikely to adversely affect the registrant's ability to record, process, summarize and report financial information; and
(b) Any fraud, whether or not material, that involves management or other employees who have a significant role in the registrant's internal controlover financial reporting.
Date: August 11, 2010 /s/ David J. WestDavid J. WestChief Executive Officer

Exhibit 31.2
CERTIFICATION
I, Humberto P. Alfonso, certify that:
1. I have reviewed this Quarterly Report on Form 10−Q of The Hershey Company;
2. Based on my knowledge, this report does not contain any untrue statement of a material fact or omit to state a material fact necessary to make thestatements made, in light of the circumstances under which such statements were made, not misleading with respect to the period covered by thisreport;
3. Based on my knowledge, the financial statements, and other financial information included in this report, fairly present in all material respects thefinancial condition, results of operations and cash flows of the registrant as of, and for, the periods presented in this report;
4. The registrant's other certifying officer(s) and I are responsible for establishing and maintaining disclosure controls and procedures (as defined inExchange Act Rules 13a−15(e) and 15d−15(e)) and internal control over financial reporting (as defined in Exchange Act Rules 13a−15(f) and15d−15(f)) for the registrant and have:
(a) Designed such disclosure controls and procedures, or caused such disclosure controls and procedures to be designed under our supervision, toensure that material information relating to the registrant, including its consolidated subsidiaries, is made known to us by others within thoseentities, particularly during the period in which this report is being prepared;
(b) Designed such internal control over financial reporting, or caused such internal control over financial reporting to be designed under oursupervision, to provide reasonable assurance regarding the reliability of financial reporting and the preparation of financial statements forexternal purposes in accordance with generally accepted accounting principles;
(c) Evaluated the effectiveness of the registrant's disclosure controls and procedures and presented in this report our conclusions about theeffectiveness of the disclosure controls and procedures, as of the end of the period covered by this report based on such evaluation; and
(d) Disclosed in this report any change in the registrant’s internal control over financial reporting that occurred during the registrant’s most recentfiscal quarter (the registrant’s fourth fiscal quarter in the case of an annual report) that has materially affected, or is reasonably likely to materiallyaffect, the registrant’s internal control over financial reporting; and
5. The registrant's other certifying officer(s) and I have disclosed, based on our most recent evaluation of internal control over financial reporting, to theregistrant's auditors and the audit committee of the registrant's board of directors (or persons performing the equivalent functions):
(a) All significant deficiencies and material weaknesses in the design or operation of internal control over financial reporting which are reasonablylikely to adversely affect the registrant's ability to record, process, summarize and report financial information; and
(b) Any fraud, whether or not material, that involves management or other employees who have a significant role in the registrant's internal controlover financial reporting.
Date: August 11, 2010 /s/ Humberto P. Alfonso Humberto P. AlfonsoChief Financial Officer

Exhibit 32.1
CERTIFICATION
Pursuant to Section 906 of the Sarbanes−Oxley Act of 2002, the undersigned officers of The Hershey Company (the “Company”) hereby certify that theCompany’s Quarterly Report on Form 10−Q for the quarter ended July 4, 2010 (the “Report”) fully complies with the requirements of Section 13(a) or15(d), as applicable, of the Securities Exchange Act of 1934 and that the information contained in the Report fairly presents, in all material respects, thefinancial condition and results of operations of the Company.
Date: August 11, 2010 /s/ David J. West David J. WestChief Executive Officer
Date: August 11, 2010 /s/ Humberto P. Alfonso Humberto P. AlfonsoChief Financial Officer
A signed original of this written statement required by Section 906, or other document authenticating, acknowledging, or otherwise adopting the signaturethat appears in typed form within the electronic version of this written statement required by Section 906, has been provided to the Company and will beretained by the Company and furnished to the Securities and Exchange Commission or its staff upon request.