Embed Size (px)
Citation preview
HESSI Imaging Capability
Pre Environmental Review
Brian R. Dennis
GSFC
Tuesday, February 29, 2000
Brian R. Dennis 2/29/2000
Pre Environmental Review
HESSI Imaging
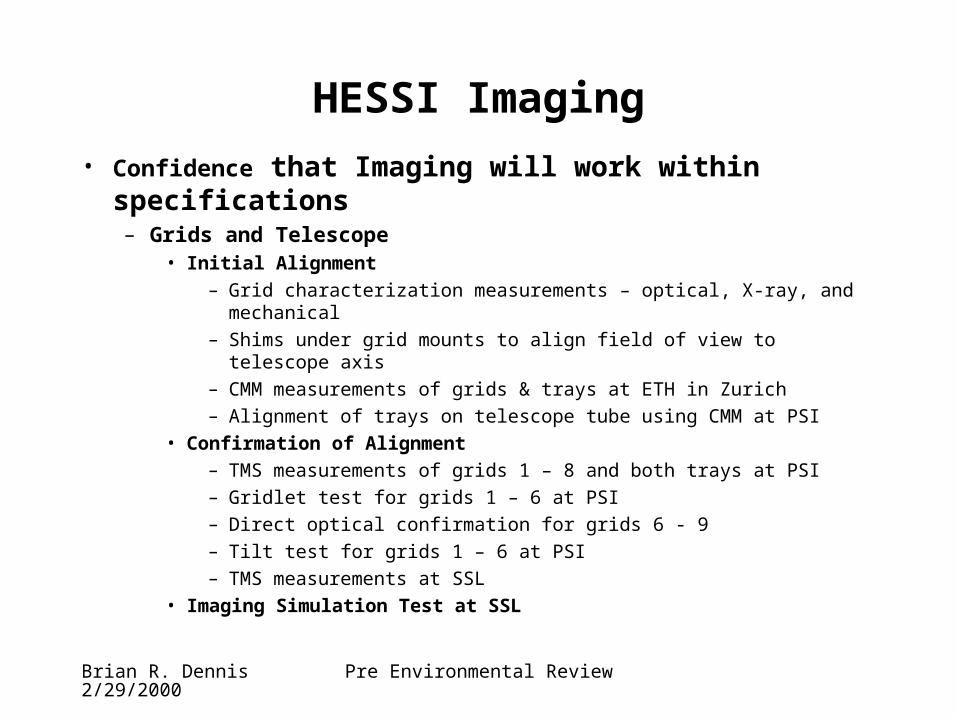
• Confidence that Imaging will work within specifications– Grids and Telescope
• Initial Alignment
– Grid characterization measurements – optical, X-ray, and mechanical
– Shims under grid mounts to align field of view to telescope axis
– CMM measurements of grids & trays at ETH in Zurich
– Alignment of trays on telescope tube using CMM at PSI
• Confirmation of Alignment
– TMS measurements of grids 1 – 8 and both trays at PSI
– Gridlet test for grids 1 – 6 at PSI
– Direct optical confirmation for grids 6 - 9
– Tilt test for grids 1 – 6 at PSI
– TMS measurements at SSL
• Imaging Simulation Test at SSL

Brian R. Dennis 2/29/2000
Pre Environmental Review
HESSI Imaging Confidence that Imaging will work within specifications
Solar Aspect System (SAS) - Functional• SAS solar exposures at PSI with 3 CCD’s
– <0.5 arcsecond (1) spatial resolution verified• Functional electrical tests on spacecraft at SSL
– Baseline read-out speed = 128 Hz– Dark level negligable (<1 ch – 0.5 mV)– Not affected by any noise source on spacecraft
• SAS generated ACS signal for S/C (redundancy for FSS) tested at PSI
SAS Alignment• Optical axis measurements of SAS lenses at Fisba (Switzerland) to 2 – 3 m
• CMM measurements of SAS CCD pixels and lens fiducials at ETH in Zurich
Brian R. Dennis 2/29/2000
Pre Environmental Review
HESSI Imaging
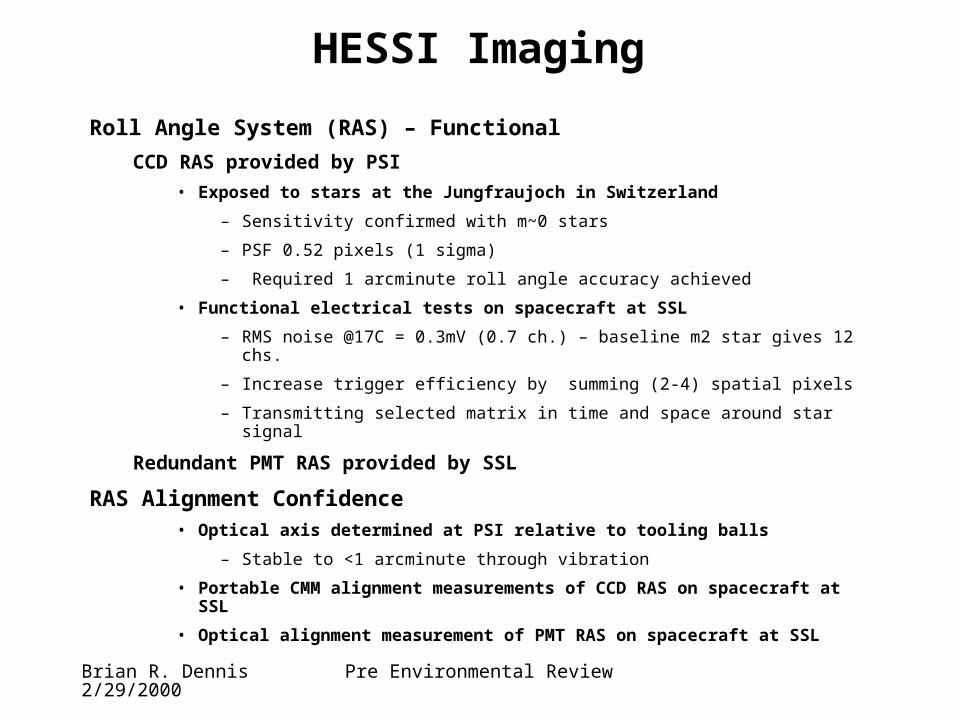
Roll Angle System (RAS) – Functional
CCD RAS provided by PSI
• Exposed to stars at the Jungfraujoch in Switzerland
– Sensitivity confirmed with m~0 stars
– PSF 0.52 pixels (1 sigma)
– Required 1 arcminute roll angle accuracy achieved
• Functional electrical tests on spacecraft at SSL
– RMS noise @17C = 0.3mV (0.7 ch.) – baseline m2 star gives 12 chs.
– Increase trigger efficiency by summing (2-4) spatial pixels
– Transmitting selected matrix in time and space around star signal
Redundant PMT RAS provided by SSL
RAS Alignment Confidence• Optical axis determined at PSI relative to tooling balls
– Stable to <1 arcminute through vibration
• Portable CMM alignment measurements of CCD RAS on spacecraft at SSL
• Optical alignment measurement of PMT RAS on spacecraft at SSL
Brian R. Dennis 2/29/2000
Pre Environmental Review
HESSI Imaging
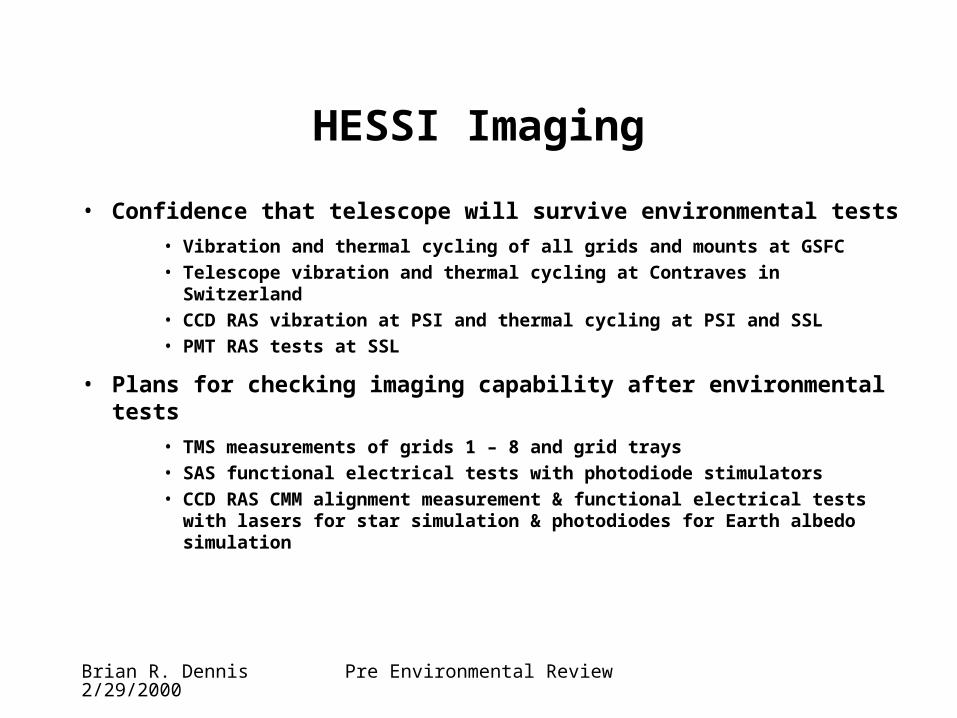
• Confidence that telescope will survive environmental tests
• Vibration and thermal cycling of all grids and mounts at GSFC
• Telescope vibration and thermal cycling at Contraves in Switzerland
• CCD RAS vibration at PSI and thermal cycling at PSI and SSL
• PMT RAS tests at SSL
• Plans for checking imaging capability after environmental tests
• TMS measurements of grids 1 – 8 and grid trays
• SAS functional electrical tests with photodiode stimulators
• CCD RAS CMM alignment measurement & functional electrical tests with lasers for star simulation & photodiodes for Earth albedo simulation
Brian R. Dennis 2/29/2000
Pre Environmental Review
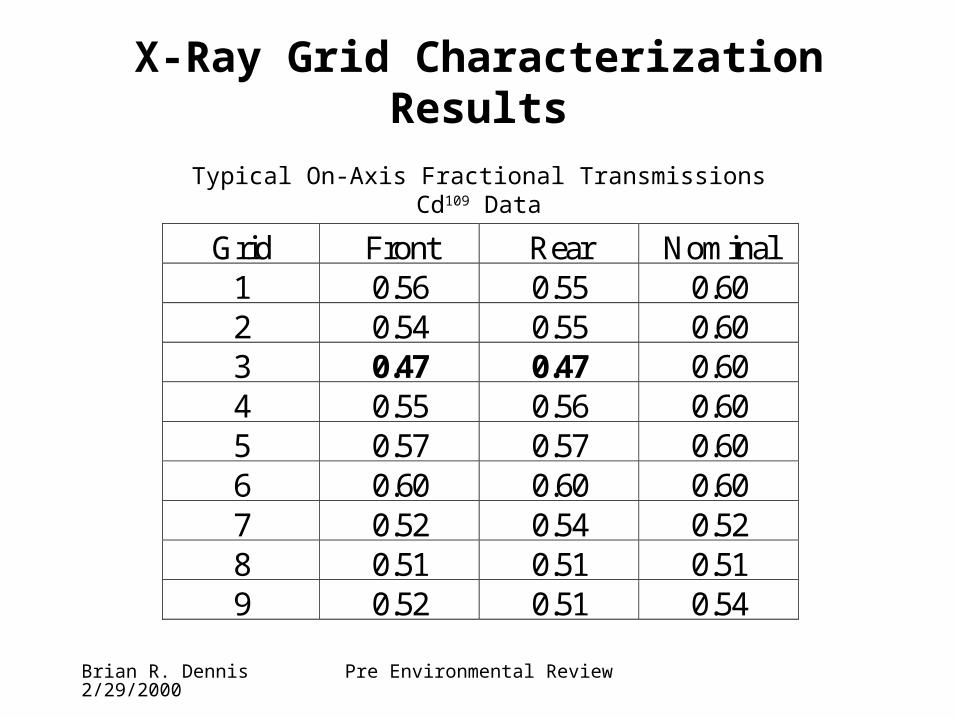
X-Ray Grid Characterization Results
Typical On-Axis Fractional TransmissionsCd109 Data
Grid Front Rear Nominal 1 0.56 0.55 0.60 2 0.54 0.55 0.60 3 0.47 0.47 0.60 4 0.55 0.56 0.60 5 0.57 0.57 0.60 6 0.60 0.60 0.60 7 0.52 0.54 0.52 8 0.51 0.51 0.51 9 0.52 0.51 0.54

Brian R. Dennis 2/29/2000
Pre Environmental Review
P A U L S C H E R R E R I N S T I T U T
Laboratory for Astrophysics
Principle of Twist Monitoring System TMS
Rear Grids: 4 Laser DiodesFront Grids: 2 Annuli 3mm Dia
Interference Pattern on CCD Camera

Brian R. Dennis 2/29/2000
Pre Environmental Review
TMS SUMMARYGrids 1 - 4
-80
-60
-40
-20
0
20
40
60
80
0 1 2 3 4
GRID
TW
IST
[a
rcse
c]
TMS Measurement Limits
Grids 4 - 8
-400
-300
-200
-100
0
100
200
300
400
4 5 6 7 8
GRID
TW
IST
[
arc
se
c]

Brian R. Dennis 2/29/2000
Pre Environmental Review
History of TMS Results
-20
-10
0
10
20
30
40
2-Aug-99 1-Sep-99 1-Oct-99 31-Oct-99 30-Nov-99 30-Dec-99 29-Jan-00 28-Feb-00
TW
IST
(a
rcs
ec
)
Grid1 Grid2 Grid3 Grid4 Tray
Gridlet Test
Sept. 8
CM M 2
Vibration and
Thermal Cycling
CM M 1
Brian R. Dennis 2/29/2000
Pre Environmental Review
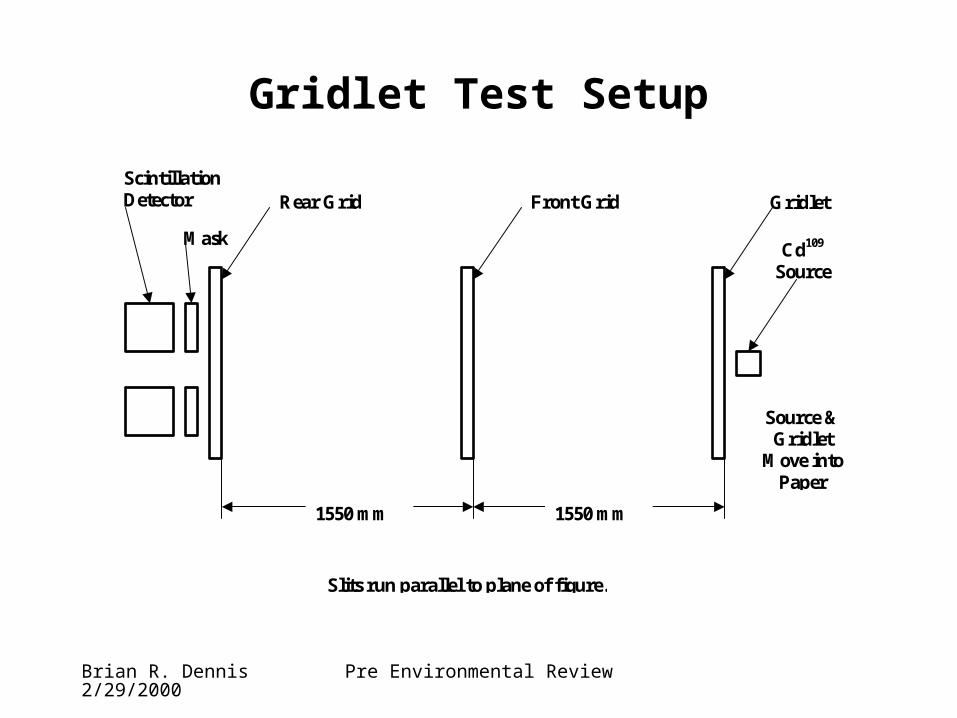
Gridlet Test Setup
1550 mm 1550 mm
Scintillation Detector Front Grid
Grid Gridlet
Cd109 Source
Mask
Rear Grid Grid
Slits run parallel to plane of figure. paper.
Source & Gridlet
Move into Paper
Brian R. Dennis 2/29/2000
Pre Environmental Review
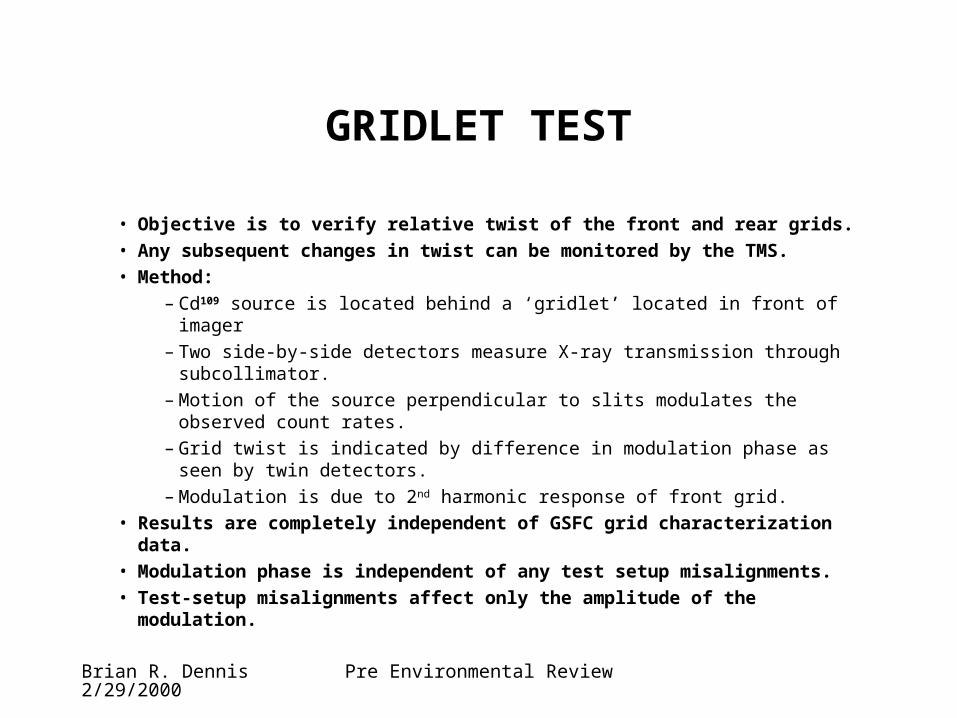
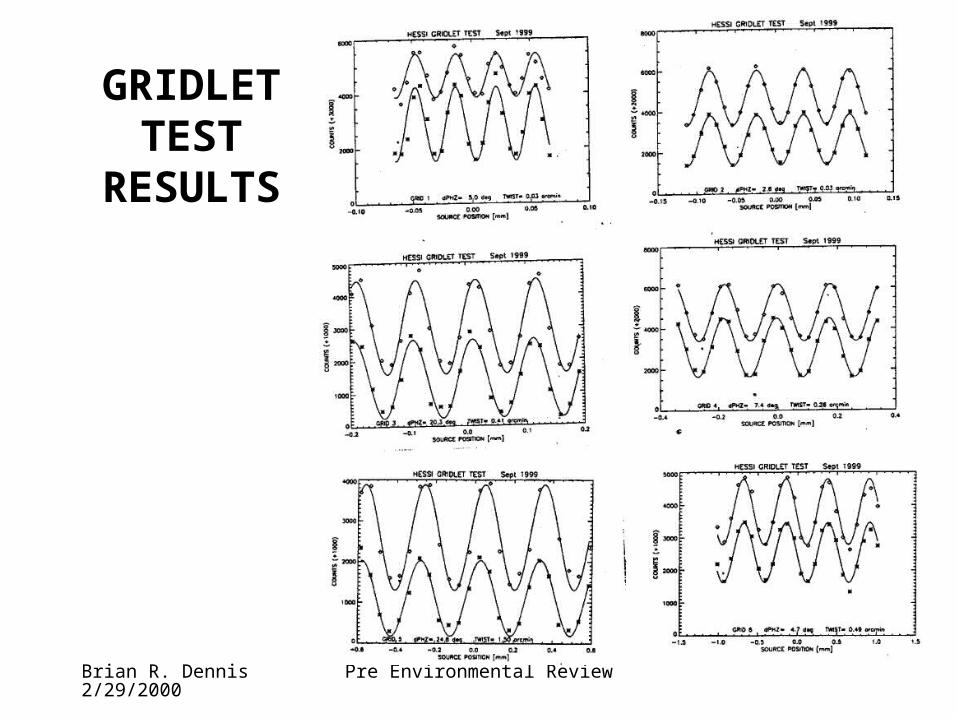
GRIDLET TEST
• Objective is to verify relative twist of the front and rear grids.
• Any subsequent changes in twist can be monitored by the TMS.
• Method:
– Cd109 source is located behind a ‘gridlet’ located in front of imager
– Two side-by-side detectors measure X-ray transmission through subcollimator.
– Motion of the source perpendicular to slits modulates the observed count rates.
– Grid twist is indicated by difference in modulation phase as seen by twin detectors.
– Modulation is due to 2nd harmonic response of front grid.
• Results are completely independent of GSFC grid characterization data.
• Modulation phase is independent of any test setup misalignments.
• Test-setup misalignments affect only the amplitude of the modulation.

Brian R. Dennis 2/29/2000
Pre Environmental Review
GRIDLET TEST RESULTS
Brian R. Dennis 2/29/2000
Pre Environmental Review
GRIDLET TEST
RESULTS
Brian R. Dennis 2/29/2000
Pre Environmental Review
GRIDLET TEST RESULTS
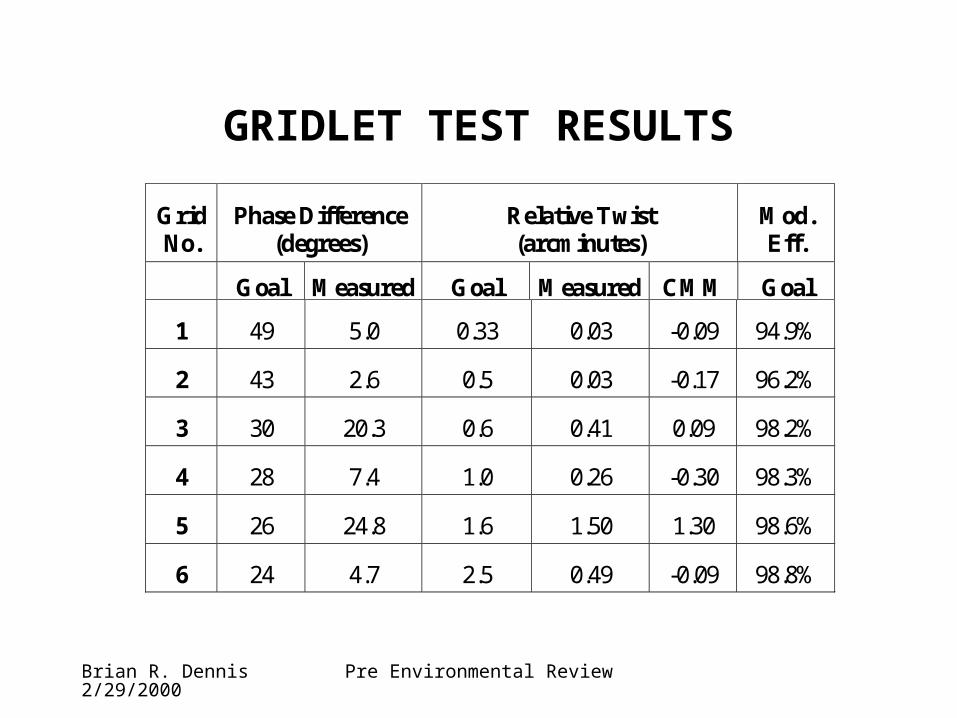
Grid No.
Phase Difference (degrees)
Relative Twist (arcminutes)
Mod. Eff.
Goal Measured Goal Measured CMM Goal
1 49 5.0 0.33 0.03 -0.09 94.9%
2 43 2.6 0.5 0.03 -0.17 96.2%
3 30 20.3 0.6 0.41 0.09 98.2%
4 28 7.4 1.0 0.26 -0.30 98.3%
5 26 24.8 1.6 1.50 1.30 98.6%
6 24 4.7 2.5 0.49 -0.09 98.8%

Brian R. Dennis 2/29/2000
Pre Environmental Review
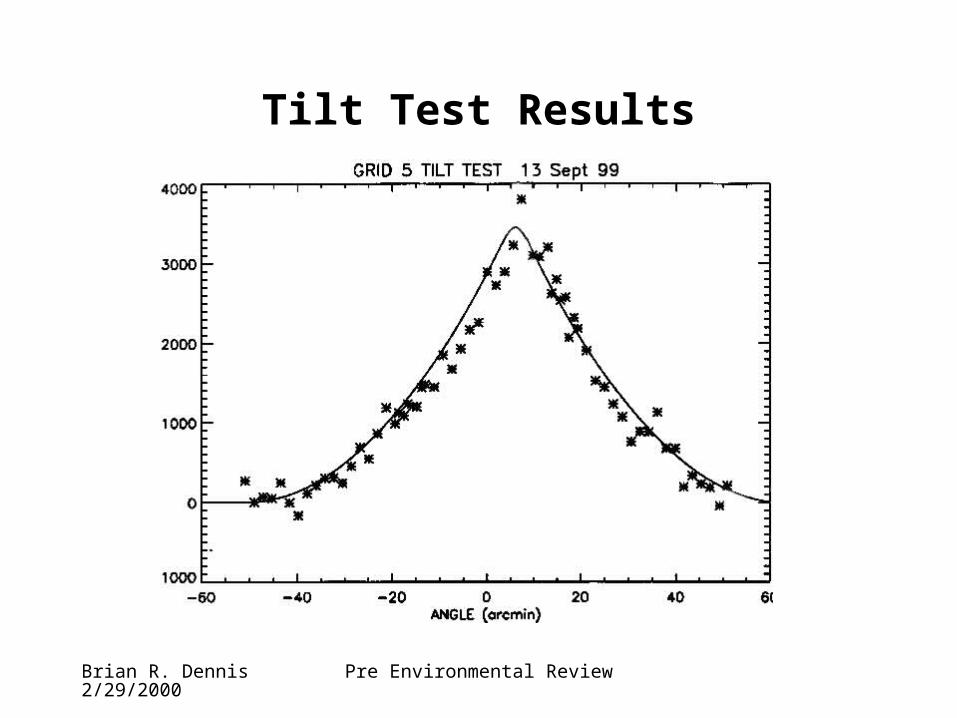
GRID TILT TEST
– Objective is to measure the angle between the direction of maximum grid throughput and the imager axis.
– Tilt test results verify:• Correct calculation and installation of shims;
• Flatness of trays;
• Absence of tilt due to grid-frame distortion.
– Test setup is same as for gridlet test, except:• Gridlet tray is removed.
• Source displacement steps are ~cm, instead of ~microns
• Slit over detector to limit range of angles
– Correct tilt is confirmed if maximum count rate is achieved when source is positioned on subcollimator axis.

Brian R. Dennis 2/29/2000
Pre Environmental Review
RESULTS OF SEPTEMBER 1999 TILT TESTS AT PSI
<Residual Tilt> arcminutes
Grid No.
XGCF Tilt Test Req’mnt
FOV arcmins
1 -0.4 1 12 60 2 -0.5 -2 12 60 3 -0.6 +2 12 60 4 -0.8 -2 12 60 5 -5.5 -8.3 12 60 6 -0.6 -4.3 12 60 7 2.1 n/a 12 264 8 1.8 n/a 12 450 9 -2.1 n/a 12 168
Brian R. Dennis 2/29/2000
Pre Environmental Review
Tilt Test Results
Brian R. Dennis 2/29/2000
Pre Environmental Review
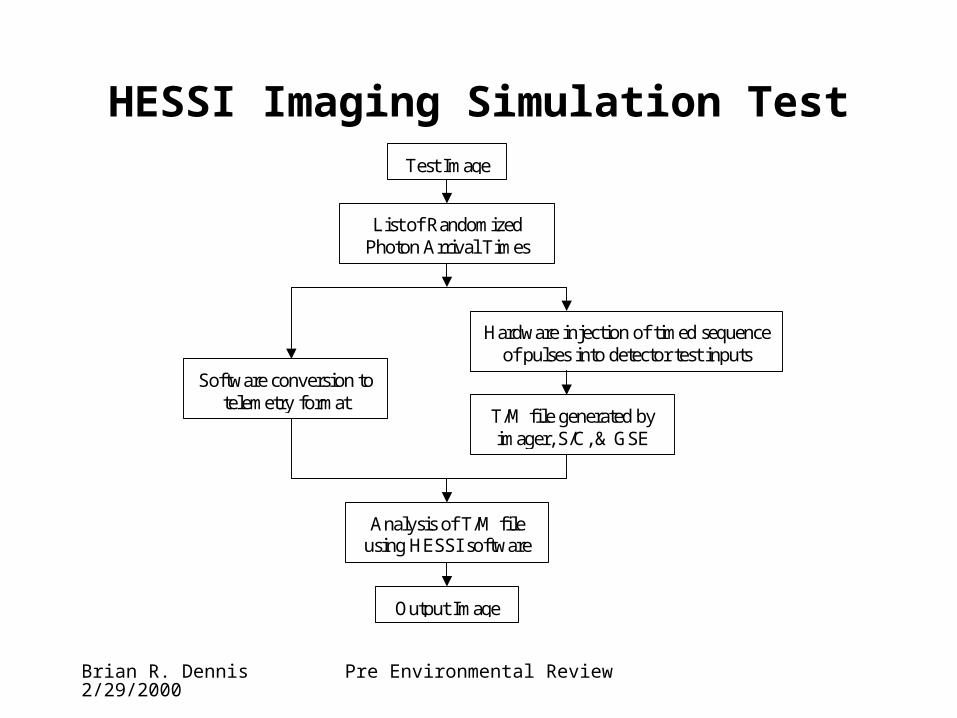
HESSI Imaging Simulation Test Test Image
List of Randomized Photon Arrival Times
Hardware injection of timed sequence of pulses into detector test inputs
T/M file generated by imager, S/C, & GSE
Analysis of T/M file using HESSI software
analysis package
Output Image
Software conversion to telemetry format

Brian R. Dennis 2/29/2000
Pre Environmental Review
Imaging Simulation Test ResultsSingle gaussian source, 2 arcseconds wide, 10,000 photons/s/collimator for 4 s
Test Image Output Image