Embed Size (px)
Citation preview
-1-
HETEROGENEITY IN DISCRIMINATION?: A FIELD EXPERIMENT*
Katherine L. Milkman The Wharton School, University of Pennsylvania
3730 Walnut Street 566 Jon M. Huntsman Hall
Philadelphia, PA 19104 [email protected].
Phone: 215-573-9646; Fax: 215-898-3664
Modupe Akinola Columbia Business School, Columbia University
New York, NY 10027 [email protected]
Dolly Chugh
Stern School of Business, New York University New York, NY 10012 [email protected]
ABSTRACT: We provide evidence from the field that levels of discrimination are heterogeneous across contexts in which we might expect to observe bias. We explore how discrimination varies in its extent and source through an audit study including over 6,500 professors at top U.S. universities drawn from 89 disciplines and 258 institutions. Faculty in our field experiment received meeting requests from fictional prospective doctoral students who were randomly assigned identity-signaling names (Caucasian, Black, Hispanic, Indian, Chinese; male, female). Faculty response rates indicate that discrimination against women and minorities is both prevalent and unevenly distributed in academia. Discrimination varies meaningfully by discipline and is more extreme in higher paying disciplines and at private institutions. These findings raise important questions for future research about how and why pay and institutional characteristics may relate to the manifestation of bias. They also suggest that past audit studies may have underestimated the prevalence of discrimination in the United States. Finally, our documentation of heterogeneity in discrimination suggests where targeted efforts to reduce discrimination in academia are most needed and highlights that similar research may help identify areas in other industries where efforts to reduce bias should focus. JEL Codes: D03, J71, I20 *We thank Max Bazerman, Eric Bradlow, Stephan Meier, Ruth Milkman, Michael Norton and Amanda Pallais for their insightful feedback. We also thank seminar participants at Cornell, Harvard, the University of Pennsylvania, UCLA, Columbia, NYU, Rutgers, the 2010 Society for Judgment and Decision Making conference, the 2011 Behavioral Economics Annual Meeting, the 2011 Stanford Institute for Theoretical Economics, the 2011 Subjective Probability, Utility and Decision Making Conference, and the 2011 Academy of Management Conference. We are grateful to Fabiano Prestes, Stan Liu, and many incredible RAs for their research assistance. This research was conducted with support from the Russell Sage Foundation and the Wharton Dean’s Research Fund. All data collection and analysis was conducted by the first two authors with IRB approval.
-2-
1. Introduction
Discrimination based on race and gender remains an insidious problem, and its presence in the
field has been rigorously documented (Ayres and Siegelman, 1995; Altoni and Blank, 1999; Goldin and
Rouse, 2000; Bertrand and Mullainathan, 2004; List, 2004; Pager, Western and Bonikowski, 2009;
Milkman, Akinola and Chugh, in press). Further, psychology research conducted in the laboratory has
demonstrated that the severity of discrimination can differ depending on features of both the evaluator
and the evaluation context (e.g. beliefs, values, personality characteristics, gender, ingroup / outgroup
membership, relative status) (Fershtman and Gneezy, 2001; Yzerbyt and Demoulin, 2010). In other
words, we have evidence from the field that levels of discrimination meaningfully affect outcomes for
women and minorities, and we have evidence from the laboratory showing that in a controlled
environment, levels of discrimination vary systematically across contexts. Together, these two robust sets
of findings suggest that discrimination is unlikely to be evenly distributed across society. However, field
research to date has focused almost exclusively on documenting the presence of discrimination, without
devoting close attention to measuring whether its severity varies meaningfully as a function of the context
examined.
In this paper, we present an analysis of data collected through an audit study set in academia. We
show that discrimination is not evenly distributed across academic disciplines and universities, but
instead, is more extreme in higher paying academic disciplines and private institutions. The heterogeneity
we identify in discrimination advances our understanding of what drives bias against women and
minorities, suggests that bias may have been underestimated in some past audit studies, and indicates
where anti-discrimination policies are most needed in the academy.
Evidence from recent audit studies indicates that across a wide range of settings, discrimination
continues to dramatically disadvantage minorities and women relative to Caucasian males with the same
credentials. For example, white job candidates receive a 50% higher callback rate for interviews than
identical Black job candidates (Bertrand and Mullainathan, 2004); Black and Latino job applicants with
clean records are treated like whites just released from prison (Pager, Western and Bonikowski, 2009);
white males receive significantly lower price quotes on new cars than do Blacks or females (Ayres and
Siegelman, 1995); and Black, Hispanic, Chinese, Indian and female prospective PhD students receive less
attention from faculty than Caucasian males (Milkman, Akinola and Chugh, in press). Further, one
important type of heterogeneity in discrimination has been well-documented in the field: minorities
generally exhibit less bias against members of their own racial group. Referees in basketball and baseball
make less biased calls against players who share their race (Price and Wolfers, 2010; Parsons, Sulaemon,
Yates and Hammermesh, 2011), and professors exhibit less discrimination against prospective minority
students of their race (Milkman, Akinola and Chugh, in press).
-3-
However, beyond the research exploring same-race bias, there are limited results from the field
exploring heterogeneity in discrimination. In the context of housing, audit studies have revealed some
differences in discrimination across markets, with Hispanic homebuyers experiencing dramatically more
discrimination in New York City than Los Angeles, though Black homebuyers face similar levels of bias
across metropolitan areas (Fix and Struyk, 1993). In medicine, there is evidence that second year medical
students exhibit more discrimination towards Black patients than first year medical students (Rubineau
and Kang, in press). Yet, in the context of employment, while audit research in Boston and Chicago
showed that Black entry-level job applicants experience discrimination relative to white applicants, there
were no detectable differences in levels of bias across occupation, industry or employer size (Bertrand
and Mullainathan, 2004).
These limited findings may be largely attributable to the constraints of the data that has been
collected in most past research designed to explore discrimination in the field. Many past audit studies
have involved relatively small samples, which have prevented researchers from extensively exploring
heterogeneity in levels of bias (Ayres and Siegelman, 1995; Pager, Western and Bonikowski, 2009;
Altoni and Blank, 1999; Fix and Struyk, 1993). The employment audit study described above relied on a
large sample of 1,300 employers, but it included only those employers advertising in the Boston Globe or
Chicago Tribune for positions in sales, administrative support, clerical and customer services, and limited
data was collected on employer heterogeneity (Bertrand and Mullainathan, 2004). For instance, important
variables such as employer demographics, employer specialty, or who specifically made hiring decisions
were not available. Given these data limitations, it may not be surprising that so little heterogeneity in
levels of race and gender discrimination has been documented in past field research.
Understanding heterogeneity in race and gender discrimination is important for several reasons.
First, furthering our understanding may shed light on the extent to which levels of race and gender bias
documented in past audit studies can be assumed to generalize across settings. If variables like salary, for
instance, have an important impact on levels of bias, then past audit studies that have focused primarily
on low-paying professions may have under- or over-estimated the degree of bias in the population
(Bertrand and Mullainathan; Pager, Western and Bonikowski, 2009; Altoni and Blank, 1999). Second,
by studying heterogeneity we can identify areas experiencing the most bias where policy makers should
focus on deploying anti-discrimination policies. Finally, documenting heterogeneity in discrimination
may point to likely moderators of discrimination that are worthy of further study because they may help
explain why discrimination persists in society and how it can be reduced.
In this paper, we explore whether U.S. university professors in particular disciplines and
institutions are more likely to discriminate against prospective doctoral students. Academia is a
promising context for exploring where discrimination is most severe because academics are
-4-
heterogeneous along a number of interesting and observable dimensions. Professors are heterogeneous in
their areas of academic specialization (e.g., economics, chemical engineering, history, nursing), and each
specialty differs measurably in its average salary as well as its student and faculty race and gender
composition. Furthermore, professors work for institutions that vary in meaningful ways including their
perceived quality/rigor, whether they are publicly or privately funded, and the diversity of their student
bodies. By exploring where discrimination is most severe in academia, we are able to examine the impact
of a wide range of potential moderators of race and gender discrimination with implications for theories
about what drives discrimination.
Another benefit of studying academia is that it is an environment where the societal costs of
discrimination are meaningful. Increasing female and minority representation among university faculty is
associated with higher educational attainment for female and minority students, respectively (Trower and
Chait, 2002). Currently, the majority (60%) of full professors at U.S. postsecondary institutions are white
males while 28% are female, 7% are Asian, 3% are Black, and 3% are Hispanic (U.S. Department of
Education, 2010), which sends an important signal to students about who can climb to the highest levels
of the academic ladder. Understanding where discrimination is most severe in academia has the potential
to yield direct policy recommendations for addressing the important question of how to increase the
diversity of the academy. Specifically, by identifying academic settings where discrimination is most
prevalent, we can inform policy makers about where interventions aimed at reducing discrimination in the
academy are most needed.
Additionally, academia offers a pragmatically unique context for a field experiment of this nature
due to the ease of building a database describing its workforce. Information about virtually all faculty
members is easily retrievable via the internet. This made it feasible to build our audit study’s participant
sample from the full universe of faculty at the U.S. universities of interest and to obtain data on each
faculty member’s race, gender, disciplinary affiliation, institutional affiliation, and tenure status.
Additionally, reliable surveys exist describing the average salary levels and demographic makeup of
academics by discipline and type of institution, furthering our ability to conduct interesting analyses with
our data. To our knowledge, few (if any) other professions are as richly described as academia by
publicly available records.
To evaluate whether discrimination is spread evenly throughout academia, we conducted an audit
study. Our audit study included a random sample of 6,548 professors from 6,300 different Ph.D. granting
departments at 258 top-ranked U.S. universities. We report on new analyses of the data gathered from
this experiment (previously described in Milkman, Akinola and Chugh (in press)). We experimentally
examined faculty responsiveness to meeting requests emailed by prospective male and female doctoral
students of varying races who expressed an interest in working with the contacted professor. This gateway

-5-
to the academy, through which prospective students receive informal, but critical encouragement, or
discouragement, to formally apply to doctoral programs, has been left unexamined. Instead, past research
on gateways to the academy has primarily focused on student performance at universities (Fletcher and
Tienda, 2010) and admissions outcomes (Carnevale and Rose, 2004).
Each professor in our study was emailed by a single, (fictional) prospective student interested in
doctoral study. Following past research (Bertrand and Mullainathan, 2004), students’ names were
randomly assigned to signal race (Caucasian, Black, Hispanic, Chinese, or Indian) and gender. The
outcome of interest was whether a given email elicited a response within one week of its receipt. We
examine whether the difference in professors’ response rates to minorities and women relative to
Caucasian males (the “discriminatory gap”), varies as a function of a faculty member’s academic
discipline (classified using the 11 broad and 133 narrow categories recognized by the National Study of
Postsecondary Faculty (NSOPF) (U.S. Department of Education, 2004) and university affiliation. We
find that the discriminatory gap is largest at private universities and in the highest-paid academic
disciplines, indicating where anti-discrimination programs are most needed and suggesting avenues for
future research on where and why bias is most severe.
2. Methods
2.1 Subjects
We began by constructing a faculty subject pool for inclusion in our audit study. The primary
criteria for selecting faculty participants was their affiliation with a doctoral program at one of the 260
National U.S. Universities that U.S. News and World Report ranked in their 2010 “Best Colleges” issue
(Best Colleges 2010: National Universities, 2010). The one exception to this selection criteria was that
the two schools ranked by U.S. News that were located outside of the mainland of the United States (the
University of Hawaii Manoa and the University of Alaska Fairbanks) were excluded. At the top 258 U.S.
universities in our final study sample, we identified 6,300 doctoral programs and approximately 200,000
faculty affiliated with those programs. We then selected one to two faculty from each doctoral program,
yielding 6,548 faculty subjects. From university websites, we collected each professor’s email address,
rank (full, associate, assistant or n/a), gender, race (Caucasian, Black, Hispanic, Chinese, Indian, or
Other), as well as university and department affiliations. Table I presents summary statistics describing
our study’s faculty subject pool.
Research assistants determined the gender of faculty study participants by studying the faculty
names, visiting their websites, examining photos, and reading research summaries containing gendered
statements (e.g., “she studies”). An automated technique was initially used for racial classification
followed by manual validation by research assistants. The automated technique relied on lists of: (a) the
639 highest-frequency Hispanic surnames as of 1996 (Word and Perkins, 1996), and (b) 1,200 Chinese
-6-
and 2,690 Indian surnames (Lauderdale and Kestenbaum, 2000). These lists were compared to the
surnames of each faculty member, and if a surname match was identified, a faculty member was classified
as a member of the associated racial group. Next, these automated classifications were validated for
Hispanic, Indian and Chinese faculty by research assistants who again visited faculty websites. Further,
research assistants generated racial classifications for faculty who were Caucasian, Black or another race
besides Hispanic, Indian or Chinese by visiting faculty websites, examining faculty CV’s, and relying on
Google image searches to find pictures of faculty on the internet. In rare instances when research
assistants determined it was not possible to reliably classify a faculty member’s race, another professor
whose race could be validated was chosen as a replacement representative of the doctoral program in
question.
In sample construction, we sought adequate statistical power to investigate how minority faculty
respond to students of their own race as well as students in other groups (see analyses in (Milkman,
Akinola and Chugh, in press)). 4,375 professors were selected at random (87% Caucasian, 2% Hispanic,
1% Black, 3% Indian, 4% Chinese, 3% Other; 68% Male). We then oversampled non-Caucasians and
constructed a second group composed of 2,173 minority professors (29% Hispanic, 21% Black, 21%
Indian, 29% Chinese; 68% Male)1. The final sample of faculty included in the study was composed of
43% full professors, 27% associate professors, 25% associate professors, and 5% professors who were
either of emeritus or unknown rank. Fifty five percent of professors in the final sample were located in
the EST time-zone, 28% were located in CST, 5% in MST and 12% in PST.
In all graphs and summary statistics reported here, observations are sample weighted to account
for the oversampling of minority faculty members in our study and unbalanced random assignment of
faculty to conditions (same-race faculty-student pairs were over-represented in our random assignment
algorithm, details in Section 2.2). Thus, all graphs and summary statistics can be interpreted as reporting
results from a representative faculty sample (Cochran, 1963).
2.2 Experimental Stimuli
Generating appropriate names for the fictitious students contacting faculty was a critical
component of our experimental design. We relied on previous research to help generate names signaling
both the gender and race (Caucasian, Black, Hispanic, Indian, Chinese) of these fictional students
(Bertrand and Mullainathan, 2004; Lauderdale and Kestenbaum, 2000). We also looked to U.S. Census
data documenting the frequency with which common surnames belong to Caucasian, Black and Hispanic
citizens and examined websites recommending baby names targeted at different racial groups. These
1 While an ideal sample would have had the same representation for each minority group, identifying Hispanic and Chinese faculty with automated techniques was easier than identifying Indian and Black faculty, leading to different success rates with our oversampling strategy.
-7-
sources provided a guide for generating a list of 90 names for potential use in our study: 9 of each race
and gender of interest.
We pre-tested each of these 90 names by surveying 38 people, all of whom had a Masters Degree
(87.5%) or a PhD (12.5%) and who had signed up through Qualtrics to complete online polls for pay. We
asked 18 of these survey respondents to complete a survey about the gender conveyed by each of the 90
names in our sample, and we asked 20 respondents to complete a survey about the race conveyed by each
of the 90 names in our sample. Participants in the gender survey were asked to “Please make your best
guess as to the identity of a person with the following name:” and were required to choose between
“Male” and “Female” for each name. Participants in the race survey were also asked to “Please make
your best guess as to the identity of a person with the following name:” and were required to choose
between “Caucasian”, “Black”, “Hispanic”, “Chinese”, “Indian” and “Other” for each name. Both the
gender and the race survey were 10 pages long with questions about a randomly ordered set of 9 names
presented on each survey page.
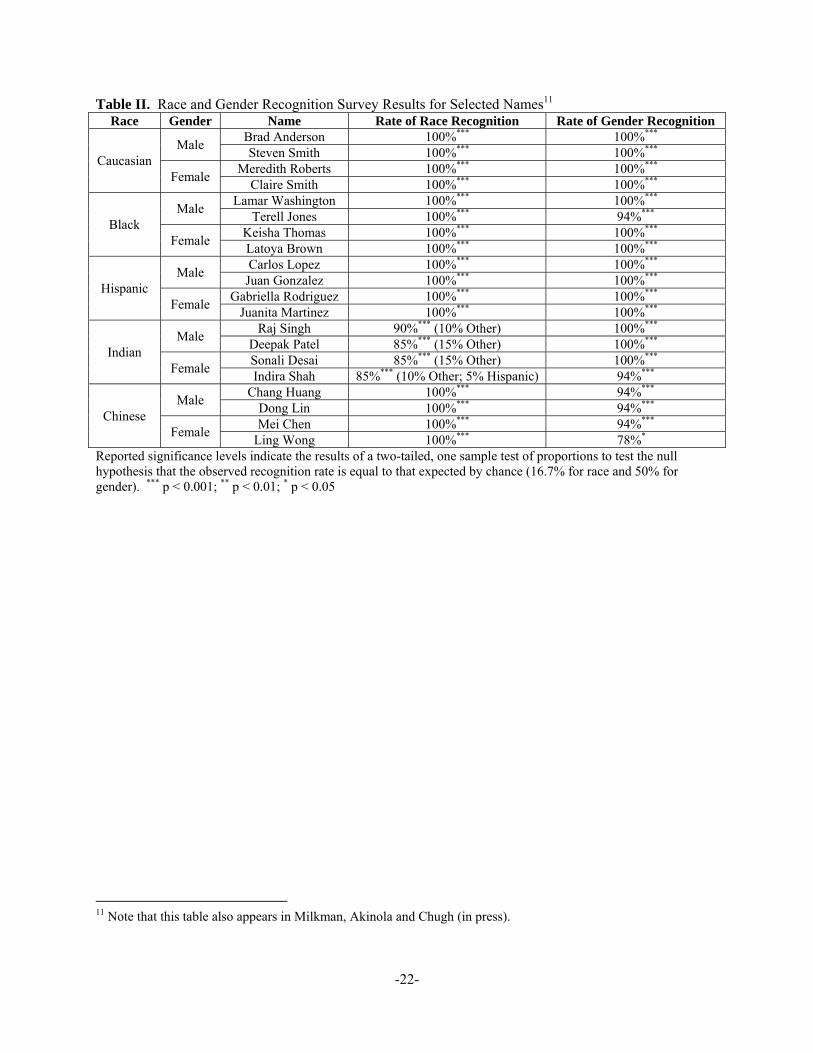
The responses generated by the above survey were tabulated, and we selected the two names for
use in our study of each race and gender with the highest net race and gender recognition rates. Table II
presents a list of the names used in our study along with their correct race and gender recognition rates in
the survey pre-test described above. Respondents accurately identified the selected names at an average
rate of 97% and 98% for race and gender respectively.
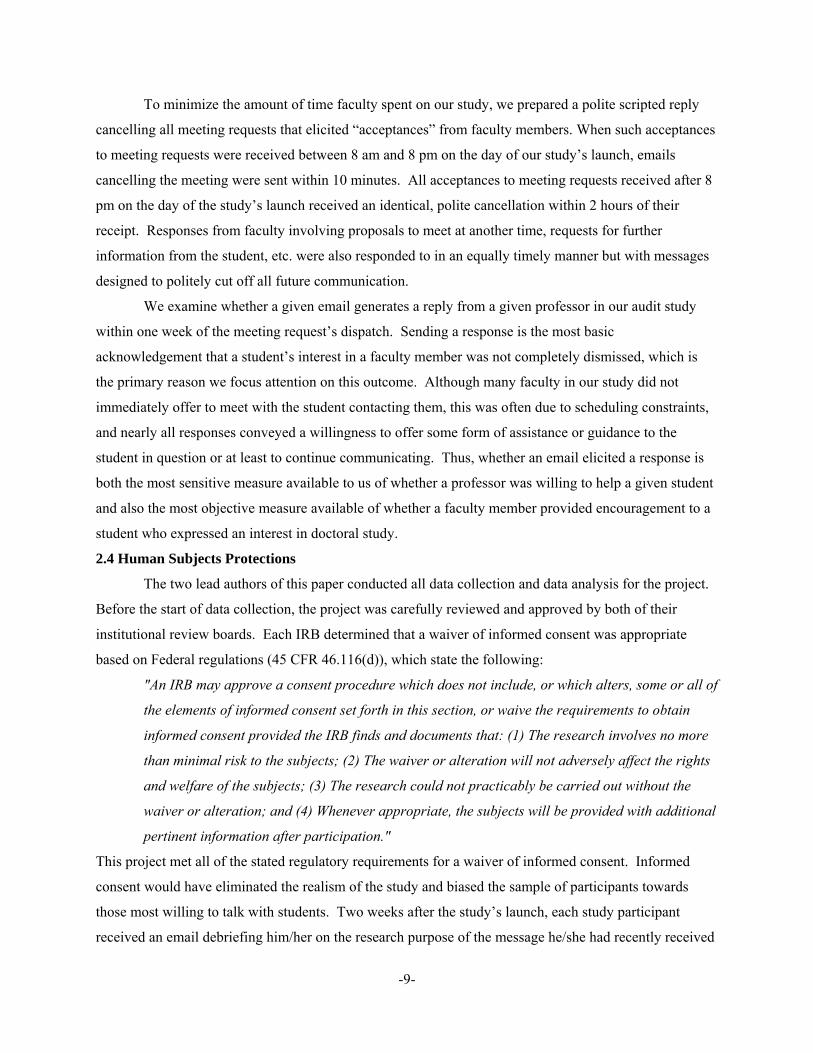
2.3 Experimental Procedures
Emails requesting a meeting with a professor were all sent to faculty subjects in our audit study
on a Monday during the academic school year. The emails were identical except for two components.
The race (Caucasian, Black, Hispanic, Indian, Chinese) and gender signaled by the name of the sender
was randomly assigned. Also, half of the emails requested a meeting for today, while half requested a
meeting one week in the future (next Monday). The emails were worded as follows:
Subject Line: Prospective Doctoral Student (On Campus Today/[Next Monday])
Dear Professor [Surname of Professor Inserted Here],
I am writing you because I am a prospective doctoral student with considerable interest in your research. My plan is to apply to doctoral programs this coming fall, and I am eager to learn as much as I can about research opportunities in the meantime.
I will be on campus today/[next Monday], and although I know it is short notice, I was wondering if you might have 10 minutes when you would be willing to meet with me to briefly talk about your work and any possible opportunities for me to get involved in your research. Any time that would be convenient for you would be fine with me, as meeting with you is my first priority during this campus visit.
Thank you in advance for your consideration.
Sincerely, [Student’s Full Name Inserted Here]
-8-
A single domain name was purchased for use in our study (which we will refer to as
“domain.com” to ensure that the revelation of the actual domain could not identify any faculty
participants in our study). Emails from prospective doctoral students were sent from email addresses
configured to include the first and last name of the student in question separated by a period
([email protected]), such as [email protected]. Emails were also set up to
ensure that the prospective student’s name would appear in a faculty member’s inbox as the message’s
sender (e.g., From: “Latoya Brown”). Finally, accounts were configured and tested to verify that spam
filters would not capture emails from domain.com.
Two thirds of the Caucasian faculty from the representative sample of 4,375 professors, and all
non-Caucasian faculty from this representative sample, were randomly assigned to one of the
gender/race/timing conditions in our study with equal probability (e.g., Female/Black/today). No
professors in this group were assigned to receive an email from a student who shared their race, however.
Assignment of faculty to conditions was stratified by their gender, race, rank and time zone (EST, CST,
MST and PST) to ensure balance on these dimensions across conditions.
All oversampled non-Caucasian faculty (N=2,173) as well as the final third of Caucasian faculty
(N=1,294) received emails from students of their race (e.g., oversampled Hispanic faculty received emails
from Hispanic students). Both the gender of the prospective student and the timing of the student’s
request (today vs. next week) were randomized. Assignment of faculty to conditions was again stratified
by their gender, rank and time zone (EST, CST, MST and PST) to ensure balance across conditions. As
mentioned in Section 2.1 and described in detail in Section 2.6.2, in all graphs and summary statistics
reported here, observations are sample weighted so they can be interpreted as reporting results from a
representative faculty sample with balanced random assignment to experimental conditions (Cochran,
1963).
In total, 6,548 emails were sent from fictional prospective doctoral students requesting a meeting
with a faculty member, or one per professor included in this study. All emails were placed in a queue in
random order and designated for sending at 8 am in the time zone corresponding to the relevant faculty
member’s University. These emails were then sent from four servers at a rate of approximately 100 per
minute, and the timestamps when each email left our servers were precisely recorded. To addressees in
the EST time zone, 3,584 emails were sent out between 8:00 am and 8:33 am (the timestamp on the last
email sent in EST). To addressees in the CST time zone, 1,823 emails were sent out between 8:00 am
and 8:16 am (the timestamp on the last email sent in CST). To those in the MST time zone, 325 emails
were sent, and they all went out between 8:00 am and 8:03 am MST. Finally, 816 emails were sent to
faculty in the PST time zone, and the last email sent in this time zone left our server at 8:07 am PST.
-9-
To minimize the amount of time faculty spent on our study, we prepared a polite scripted reply
cancelling all meeting requests that elicited “acceptances” from faculty members. When such acceptances
to meeting requests were received between 8 am and 8 pm on the day of our study’s launch, emails
cancelling the meeting were sent within 10 minutes. All acceptances to meeting requests received after 8
pm on the day of the study’s launch received an identical, polite cancellation within 2 hours of their
receipt. Responses from faculty involving proposals to meet at another time, requests for further
information from the student, etc. were also responded to in an equally timely manner but with messages
designed to politely cut off all future communication.
We examine whether a given email generates a reply from a given professor in our audit study
within one week of the meeting request’s dispatch. Sending a response is the most basic
acknowledgement that a student’s interest in a faculty member was not completely dismissed, which is
the primary reason we focus attention on this outcome. Although many faculty in our study did not
immediately offer to meet with the student contacting them, this was often due to scheduling constraints,
and nearly all responses conveyed a willingness to offer some form of assistance or guidance to the
student in question or at least to continue communicating. Thus, whether an email elicited a response is
both the most sensitive measure available to us of whether a professor was willing to help a given student
and also the most objective measure available of whether a faculty member provided encouragement to a
student who expressed an interest in doctoral study.
2.4 Human Subjects Protections
The two lead authors of this paper conducted all data collection and data analysis for the project.
Before the start of data collection, the project was carefully reviewed and approved by both of their
institutional review boards. Each IRB determined that a waiver of informed consent was appropriate
based on Federal regulations (45 CFR 46.116(d)), which state the following:
"An IRB may approve a consent procedure which does not include, or which alters, some or all of
the elements of informed consent set forth in this section, or waive the requirements to obtain
informed consent provided the IRB finds and documents that: (1) The research involves no more
than minimal risk to the subjects; (2) The waiver or alteration will not adversely affect the rights
and welfare of the subjects; (3) The research could not practicably be carried out without the
waiver or alteration; and (4) Whenever appropriate, the subjects will be provided with additional
pertinent information after participation."
This project met all of the stated regulatory requirements for a waiver of informed consent. Informed
consent would have eliminated the realism of the study and biased the sample of participants towards
those most willing to talk with students. Two weeks after the study’s launch, each study participant
received an email debriefing him/her on the research purpose of the message he/she had recently received
-10-
from a prospective doctoral student. Every piece of information that could have been used to identify the
faculty participants in our study was deleted from all study databases within two weeks of the study’s
conclusion.
2.5 Supplementary Data
2.5.1 Data about Academic Disciplines
In order to categorize the academic disciplines of the faculty in our study, we relied on categories
created by the U.S. National Center for Education Statistics. This center conducts a National Study of
Postsecondary Faculty (NSOPF) at regular intervals (most recently in 2004) and classifies faculty into
one of 11 broad and 133 narrow academic disciplines (see: http://nces.ed.gov/surveys/nsopf/). The
NSOPF survey results were available in the form of summary statistics describing various characteristics
of survey respondents both by broad and narrow academic discipline.
In order to merge data from the NSOPF survey with data from our study, a research assistant
examined each participant’s academic department and classified that faculty member into one of the
NSOPF’s 11 broad and 133 narrow disciplinary categories. Of the 6,548 faculty in our study, 29 worked
in fields that either could not be classified or identified, and these professors were thus dropped from our
analyses. The remaining professors were classified into one of 10 of the NSOPF’s 11 broad disciplinary
categories (the category with no representation was Vocational Education) and into one of 110 of the
NSOPF’s 133 narrow disciplinary categories. Twenty-one of the 110 narrow disciplinary categories in
which faculty included in our study were classified were disciplines for which the 2004 NSOFP survey
reported no data. These observations corresponded to 313 data points from our study, which we excluded
from our analyses, leaving us with a total of 89 unique narrow disciplines to examine and 6,206
observations including information about characteristics of a faculty member’s narrow academic
discipline for inclusion in our regression analyses.
We examine how several variables collected by the NSOFP’s 2004 survey affect levels of
discrimination in our study. The first variable we explore is the average pay in a discipline (mean =
$59,372; std. dev. = $13,265). Second, we examine the percentage of faculty in the discipline who are
female (mean = 38%; std. dev. = 21%), as well as the percentage that are Caucasian (mean = 85%; std.
dev. = 8%), Black (mean = 6%; std. dev. = 4%), Hispanic (mean = 3%; std. dev. = 3%), and Asian (mean
= 10%; std. dev. = 8%). Finally, we examine the percentage of Ph.D. students in the discipline who are
Caucasian (mean = 76%; std. dev. = 4%), Black (mean = 10%; std. dev. = 3%), Hispanic (mean = 7%;
std. dev. = 2%), and Asian (mean = 7%; std. dev. = 2%).2
2 Note that the NSOFP does not include statistics about the percentage of students who are female.
-11-
2.5.2 Data about Universities
For each of the 260 national U.S. universities ranked by U.S. News and World Report in their
2010 “Best Colleges” issue, U.S. News collects and reports a number of facts describing the university
during the 2009-2010 academic school year that were merged with our experimental data. First, each
school’s ranking is reported (1-260). Second, U.S. News reports on whether each school is a private or
public institution (37% of the universities in our sample are private, and 63% are public). Third, U.S.
News reports on the percentage of the undergraduate student body that is female (mean = 52%; std. dev. =
9%), as well as the percentage that is Caucasian (mean = 68%; std. dev. = 19%), Black (mean = 11%; std.
dev. = 16%), Hispanic (mean = 8%; std. dev. = 9%), and Asian (mean = 9%; std. dev. = 9%). We
examine the relationship between each of these university characteristics and the degree of faculty
discrimination in response to emails from white males versus women and minorities. For 12 of the
universities studied, information is missing about the student body’s composition. This missing data
leads us to drop 354 data points when we include these predictors in our analysis.
2.6 Statistical Analyses
2.6.1 Regression Spefications
To study the effects of various potential moderators (i.e., department and university
characteristics) on the level of responsiveness to emails form women and minorities relative to Caucasian
males, we use the following ordinary least squares (OLS) regression specification:
response_receivedj = α + ß1*moderatori + ß2*min-femi*moderatori + ß3*blacki + ß4*hispanici +
ß5*indiani + ß6*chinesei + ß7*femalei + ß8*blacki*femalei + ß9*hispanici*femalei
+ ß10*indian*femalei + ß11*chinesei*femalei + θ’*Xj
where response_receivedi is an indicator variable that takes on a value of one when faculty member i
responded to the email requesting a meeting and zero otherwise, min-femi is an indicator variable that
takes on a value of one when a meeting request is from a racial minority or female student and a value of
zero otherwise, moderatori is a (standardized) variable that corresponds to a given moderator of interest
(e.g., the pay received by faculty in a given academic discipline), blacki is an indicator variable taking on
a value of one when a meeting request comes from a Black student and zero otherwise, hispanici is an
indicator variable taking on a value of one when a meeting request comes from a Hispanic student and
zero otherwise, and so on for the indicator variables indiani, chinesei, and femalei, and Xi is a vector of
other control variables. This vector of control variables includes indicators for whether the professor
contacted was: Black; Hispanic; Indian; Chinese; a member of another minority group besides those listed
previously; male; an assistant professor; an associate professor, another rank besides assistant, associate
or full professor; the same race as the student emailing and Black; the same race as the student emailing
and Hispanic; the same race as the student emailing and Indian; the same race as the student emailing and
-12-
Chinese; and asked to meet with the student today (as opposed to next week)3. The additional variables
included in this vector of control variables were: the university’s U.S. News and World Report 2010
ranking (standardized) and an interaction between the “meeting today” indicator and min-femi7.
We estimate the equation described above using an OLS regression and cluster standard errors by
a faculty member’s academic discipline and university affiliation. We rely on OLS regression models to
evaluate this data because our primary focus is on the interpretation of interaction terms, and Ai and
Norton (2003) have demonstrated that standard errors on interaction terms in logistic regressions are often
biased and therefore unreliable. However, our findings are qualitatively similar if the analyses presented
are repeated using logistic regression models.
Our primary regression results (in Table IV) are presented without sample weights but instead
including controls for the various variables used to select our sample and allocate assignment to
conditions, which controls for our experiment’s unbalanced random assignment (Winship and Radbill,
1994). All regression results are robust to the inclusion of sample weights to account for oversampling
minority faculty and unbalanced randomization.
2.6.2 Sample Weighting
A sample weight is assigned to each faculty participant to account for the oversampling of
minority faculty members in our study and unbalanced random assignment of faculty to conditions (as
described in Section 2.3, same-race faculty-student pairs were over-represented in our random assignment
algorithm). In robustness checks including sample weights and in all summary statistics reported (which
are always sample-weighted), sample weights are determined for a given observation as a function of the
race of the faculty member contacted, r, his or her academic discipline, d, and the race of the student who
contacted the faculty member, s, as follows. First, the expected representative number of faculty in a
given academic discipline, d, of a given race, r, is calculated (e.g., since professors in Ph.D. granting
departments in Engineering and Computer Science are 77.8% Caucasian and the study included 1,125
Engineering and Computer Science faculty, the expected number of Caucasian Engineering and
Computer Science faculty is 1,125*0.778 = 875).4 We refer to this quantity as er,d. Next, the expected
number of faculty of a given race, r, in a given discipline, d, receiving emails from students of a given
race, s, is calculated assuming balanced randomization. This is simply er,d/5 since there are five student
races represented in our study (e.g., the expected number of Caucasian faculty in Computer Science and
3 This predictor is included because (Milkman, Akinola and Chugh, in press) demonstrates that the interaction between this predictor and min-femi is a strong predictor of faculty responsiveness to emails from prospective doctoral students. 4 Note that the “true” percentage of professors in a given discipline of a given race is estimated by examining the representative sample of faculty selected for study participation.
-13-
Engineering departments receiving emails from Caucasian students is 875/5 = 175). We refer to this
quantity as er,s,d. Finally, we calculate the actual number of faculty in a given discipline, d, of a given
race, r, receiving emails from students of a given race, s (e.g., 151 Caucasian faculty in Engineering and
Computer Science departments actually received emails from Caucasian students). We refer to this
quantity as ar,s,d. Sample weights are then constructed by taking the ratio: er,s,d/ar,s,d. Thus, the sample
weight for Caucasian faculty of Engineering and Computer Science is 175/151 = 1.1592.
3. Results
Sixty-seven percent of the emails sent to faculty from (fictional) prospective doctoral students in
our study elicited a response within one week across experimental conditions, indicating that the emails
sent to faculty were seen as highly compelling. Notably, all underrepresented groups studied experienced
lower response rates than Caucasian males, as reported in a previous paper (Milkman, Akinola and
Chugh, in press).
3.1 Confirming Similarity between Names of Matched Race and Gender
In order to confirm that no pair of names of the same race and gender in our study (e.g., Brad
Anderson and Steven Smith) yielded significantly different response patterns from one another, we
conducted a series of statistical tests. First, we ran a logistic regression in which the outcome variable
was response_received and the predictor variables were 0/1 indicators for each of the twenty names in our
study. We then conducted ten Wald tests – one for each pair of same-gender and race names. These tests
evaluated the linear hypothesis that the difference between the coefficient estimates on two names of a
given race and gender was equal to zero (e.g., βbrad_anderson – βsteven_smith = 0). None of the ten tests
conducted revealed a significant difference in the paired names at a p-value of 0.10 or below, and thus,
we grouped each pair of same gender/race names into a single treatment condition in our analyses (e.g.,
Brad Anderson and Steven Smith were collapsed into a single “Caucasian Male” treatment condition).
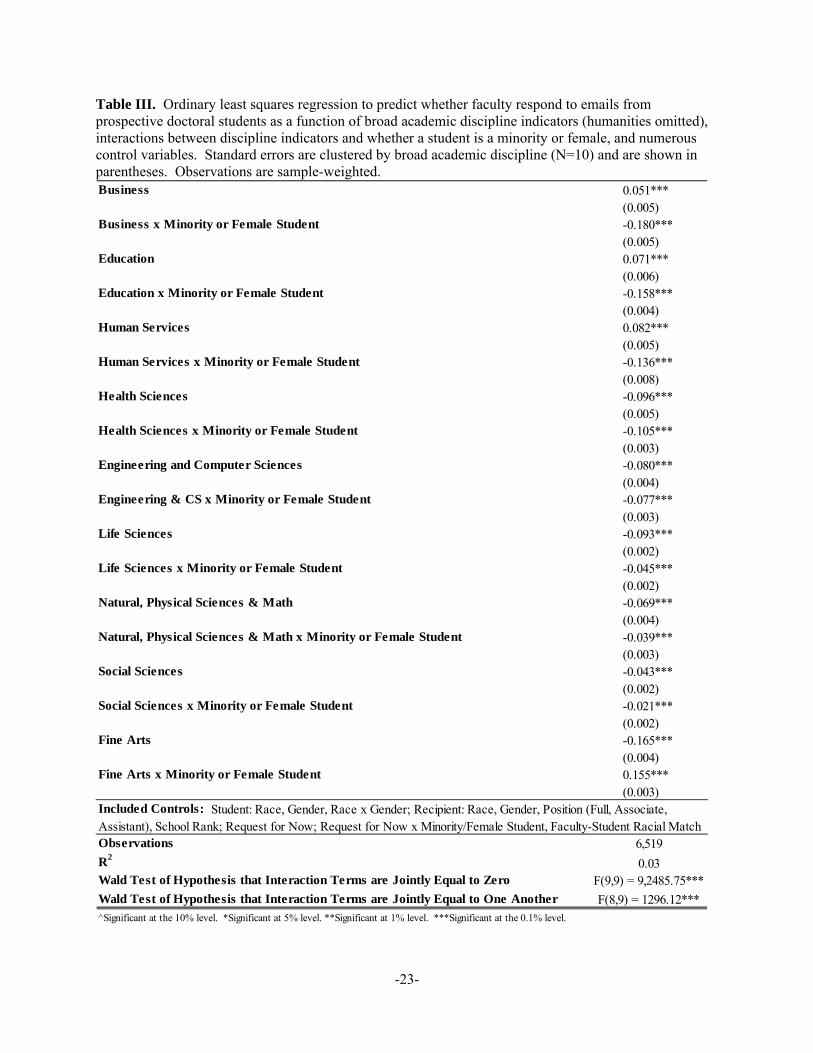
3.2 Heterogeneity in Discrimination
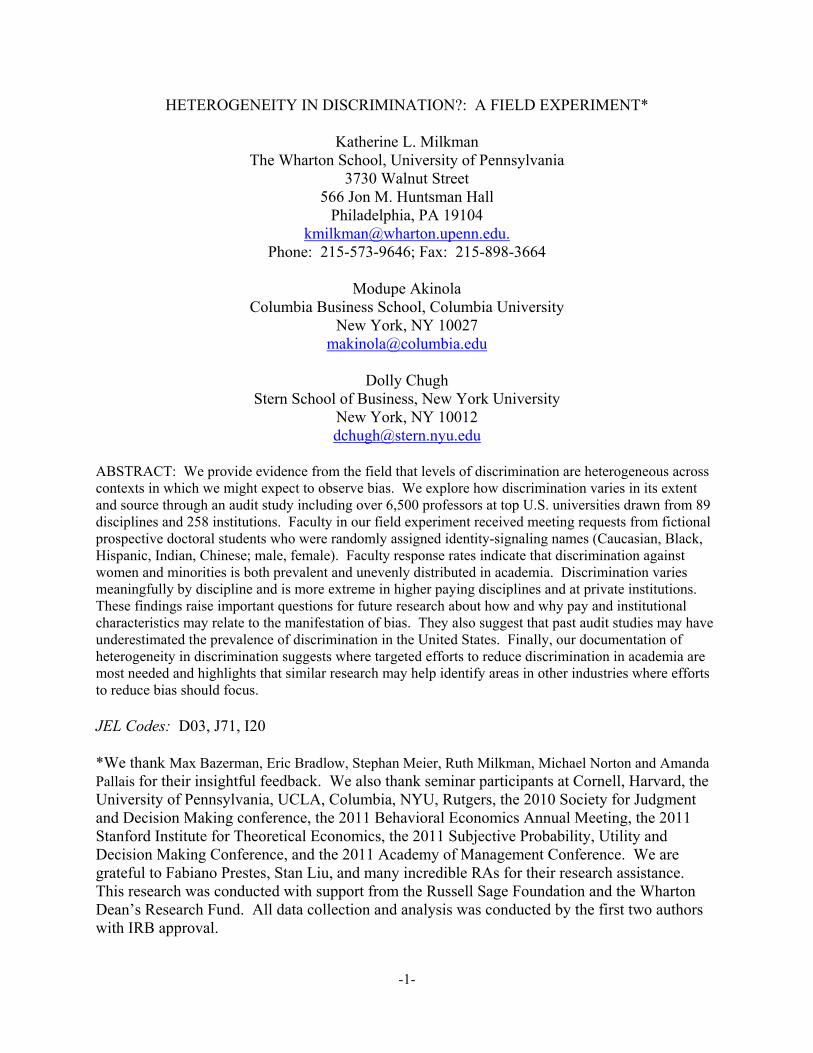
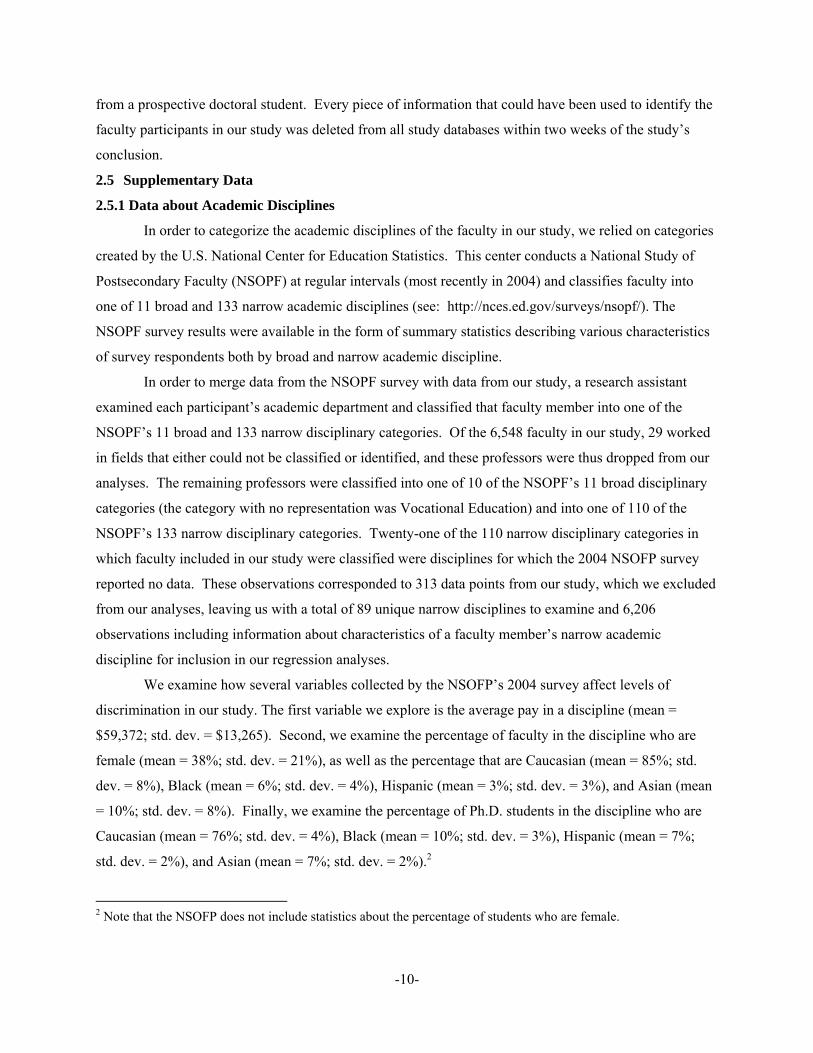
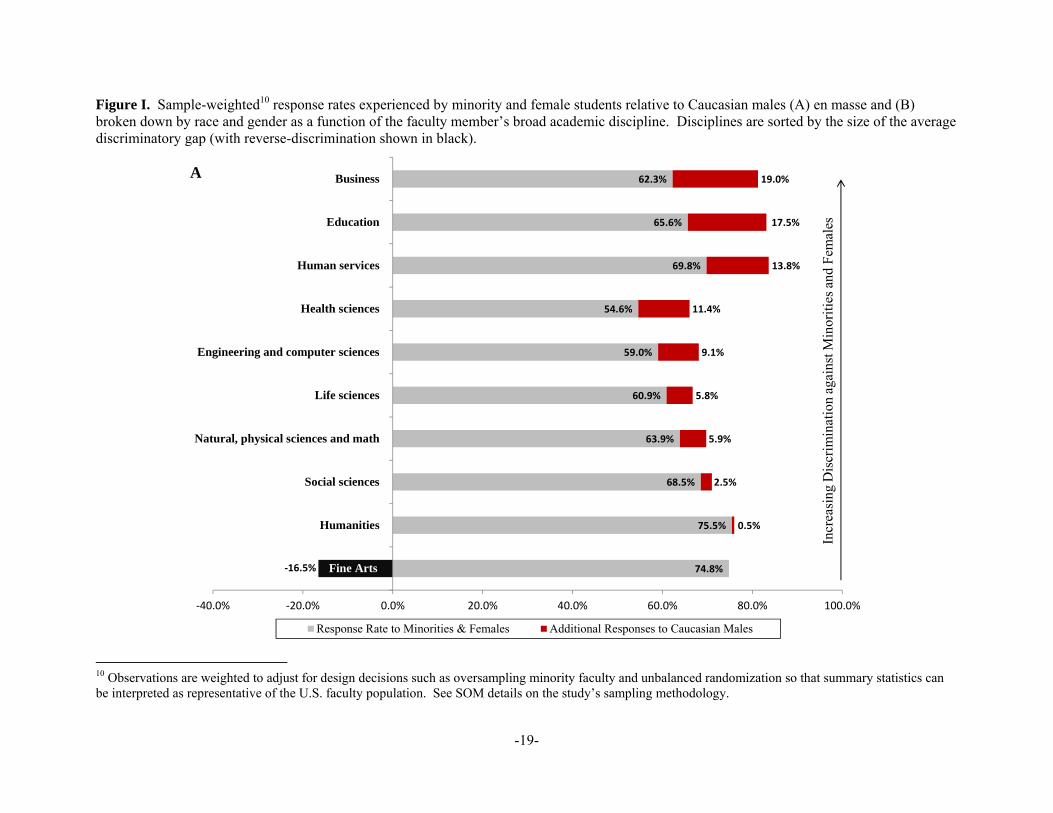
We find that the severity of bias exhibited by faculty varies considerably across disciplines.
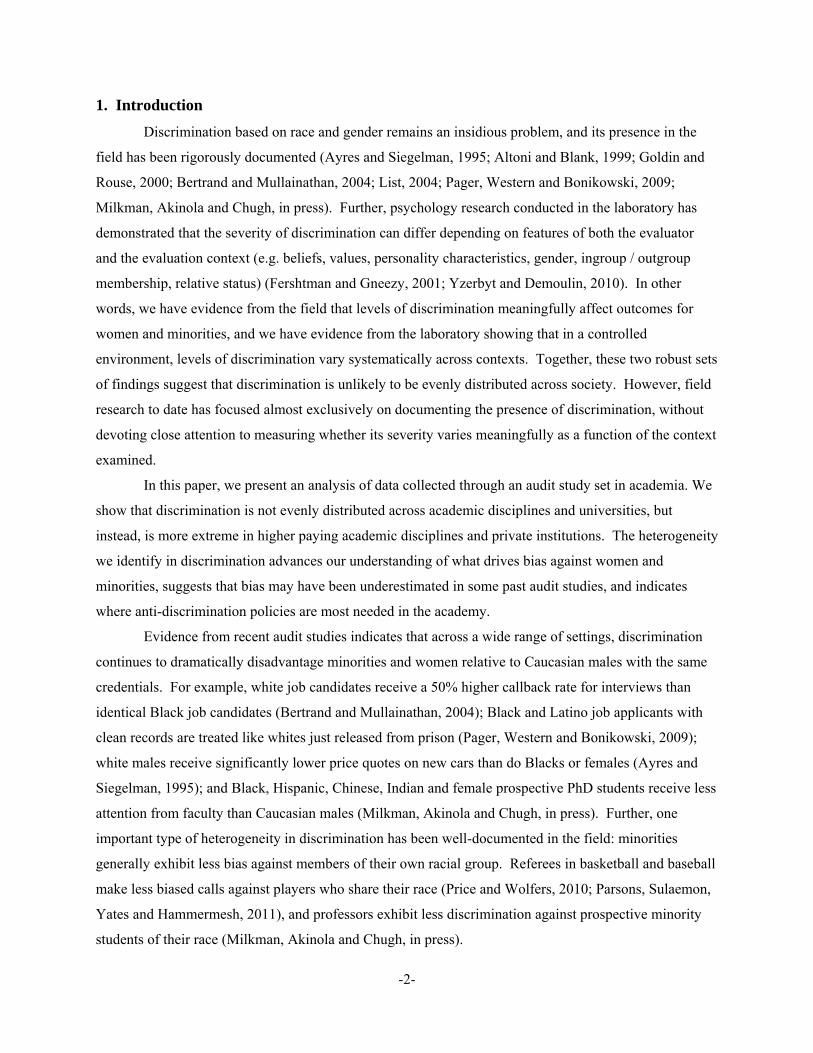
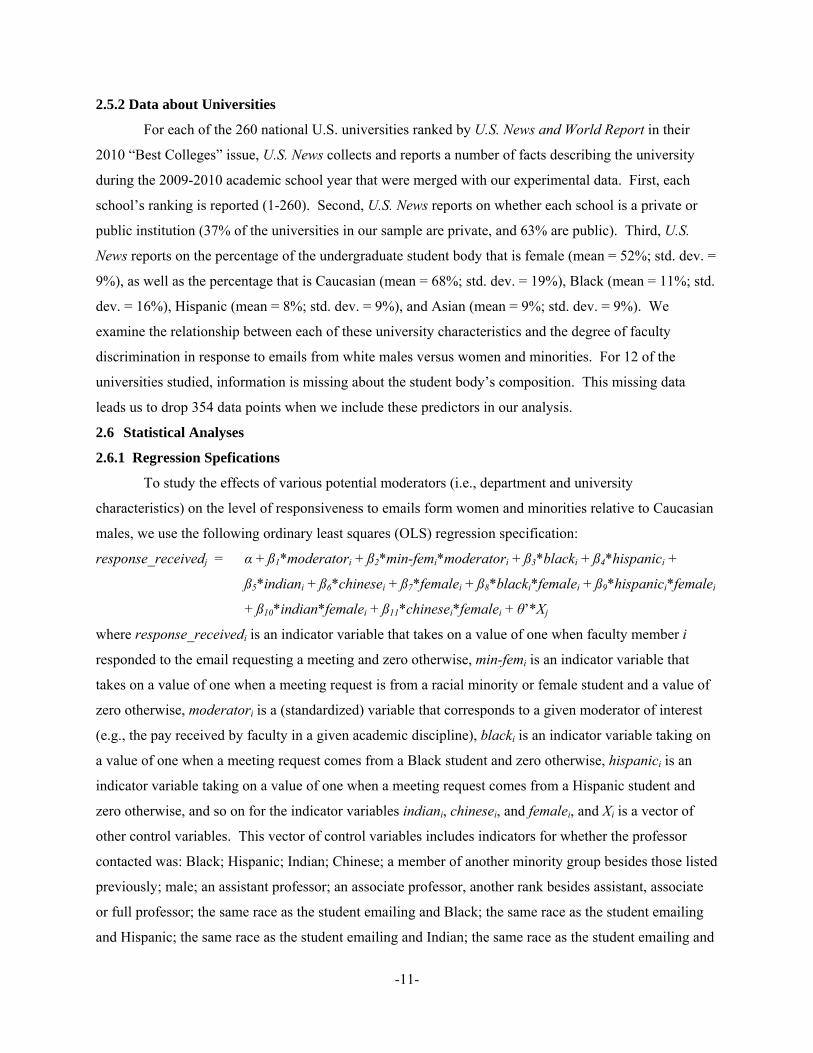
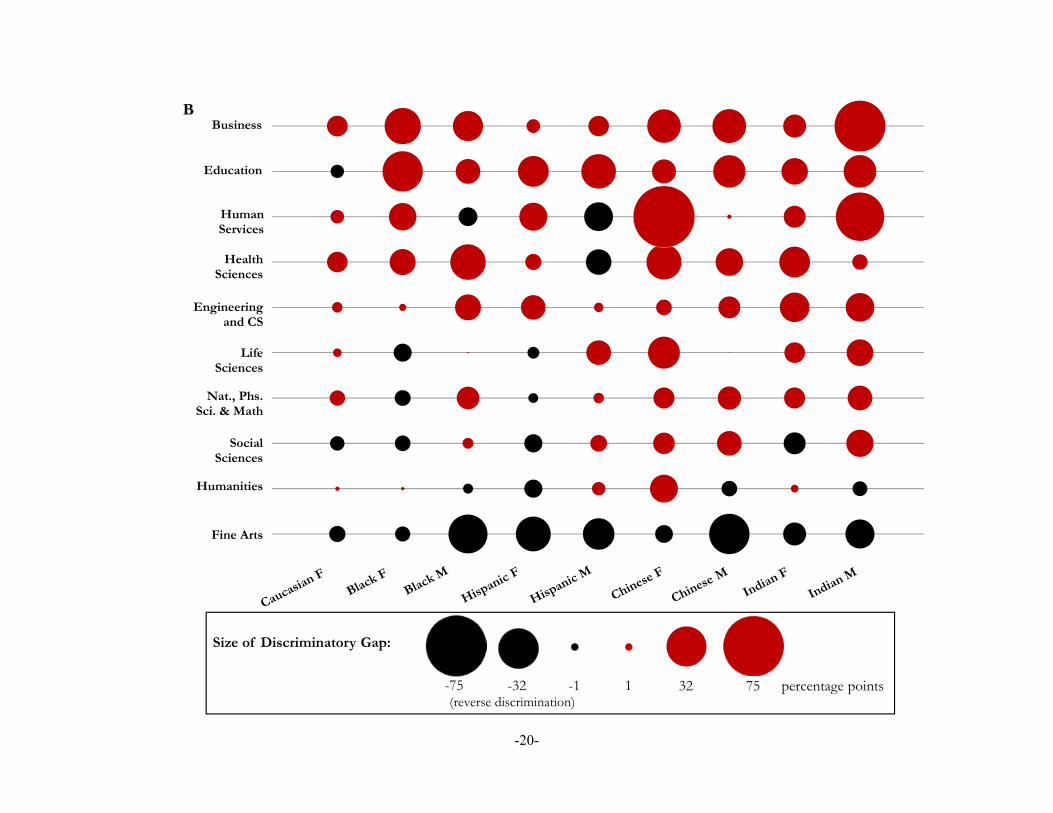
Figure IA illustrates large differences in the discriminatory gap by broad academic discipline.5 Figure IB
illustrates these discriminatory gaps by race/gender, demonstrating that the pattern in Figure IA is not
driven by outliers. To evaluate the statistical significance of these patterns, we conduct an ordinary least
squares regression to predict whether a given faculty member responds to a given student’s email as a
function of the student’s race and gender, the faculty member’s broad discipline, and an interaction
between discipline and whether the student is a minority or female, controlling for all observable
5 Of the 6,548 faculty in our study, 28 worked in fields that could not be classified into disciplines, and these professors are thus dropped from our analyses. Faculty in our sample represented 89 of the 133 narrow NSOPF disciplines and 10 of the 11 broad NSOPF disciplines.
-14-
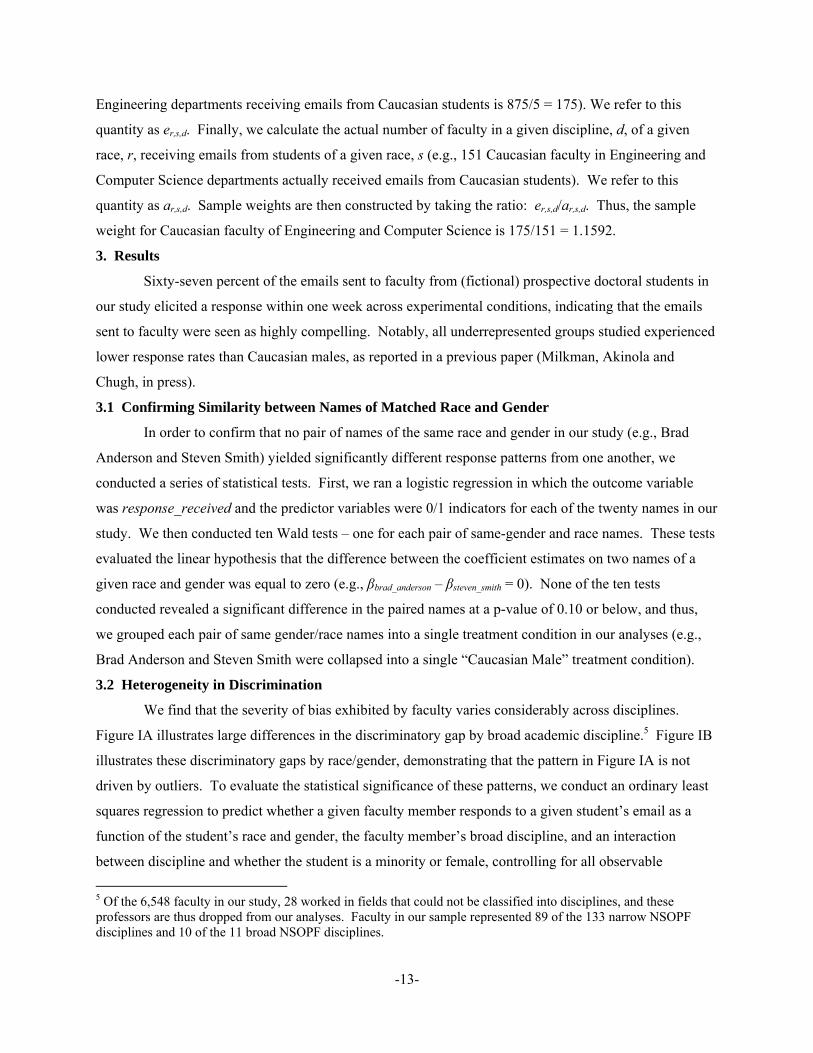
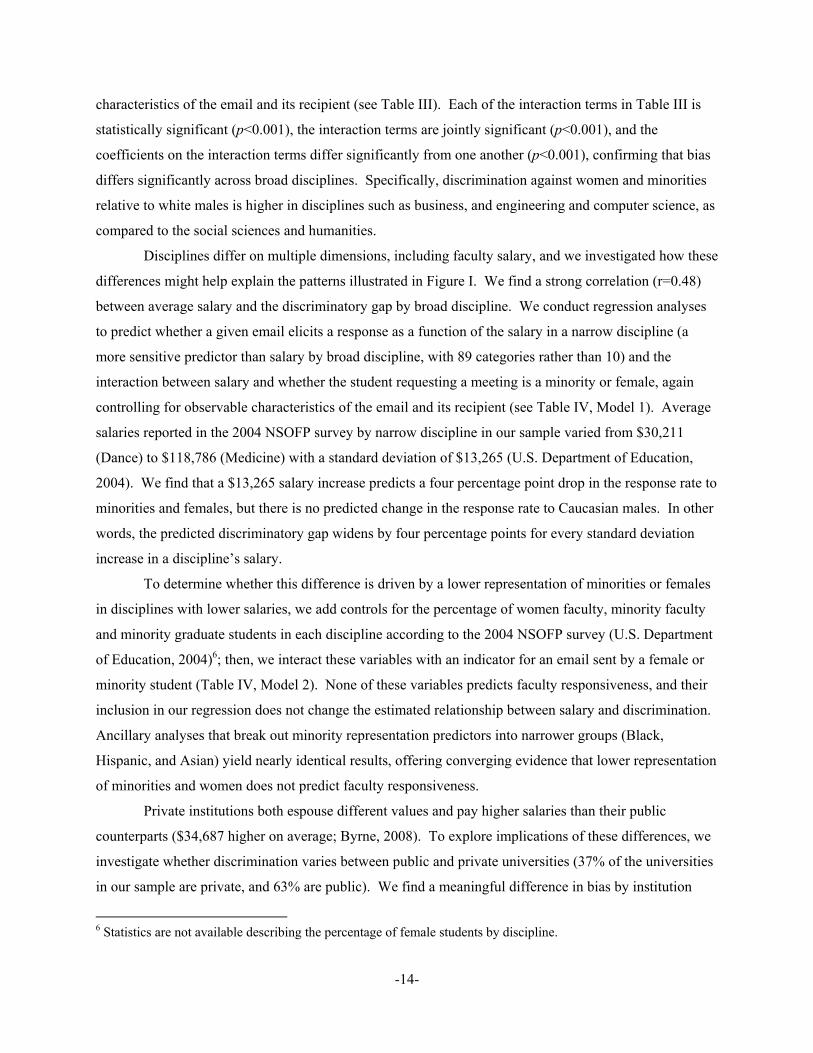
characteristics of the email and its recipient (see Table III). Each of the interaction terms in Table III is
statistically significant (p<0.001), the interaction terms are jointly significant (p<0.001), and the
coefficients on the interaction terms differ significantly from one another (p<0.001), confirming that bias
differs significantly across broad disciplines. Specifically, discrimination against women and minorities
relative to white males is higher in disciplines such as business, and engineering and computer science, as
compared to the social sciences and humanities.
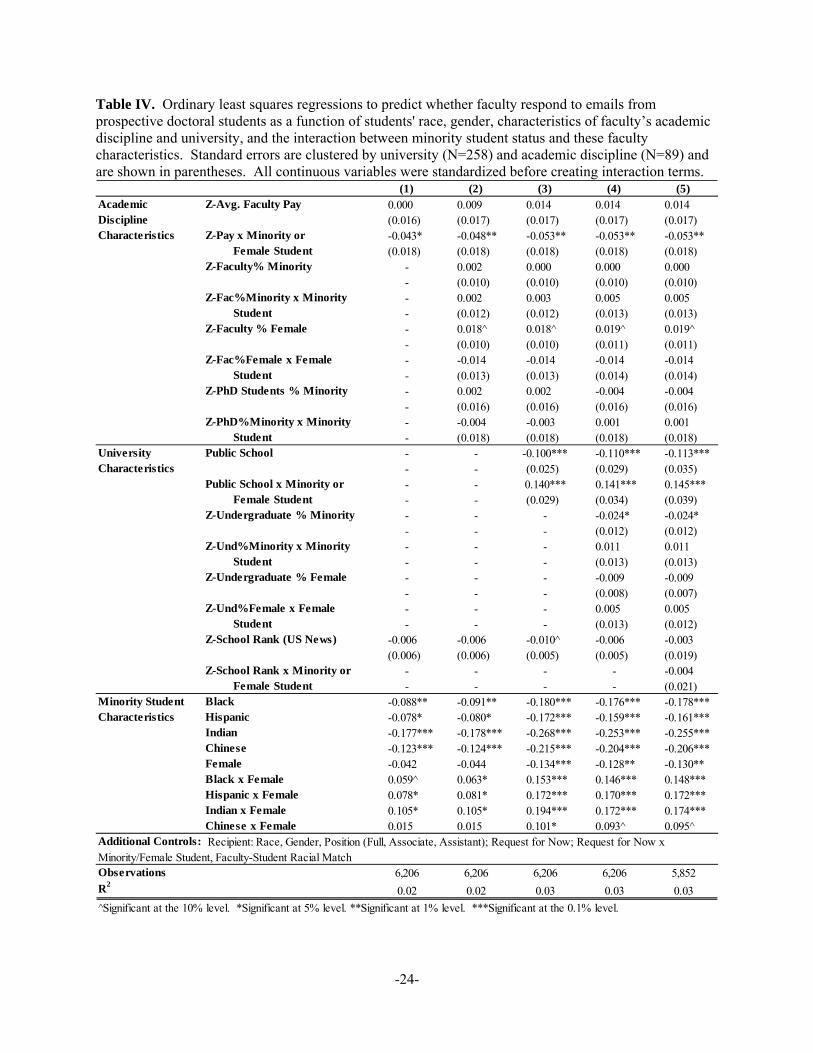
Disciplines differ on multiple dimensions, including faculty salary, and we investigated how these
differences might help explain the patterns illustrated in Figure I. We find a strong correlation (r=0.48)
between average salary and the discriminatory gap by broad discipline. We conduct regression analyses
to predict whether a given email elicits a response as a function of the salary in a narrow discipline (a
more sensitive predictor than salary by broad discipline, with 89 categories rather than 10) and the
interaction between salary and whether the student requesting a meeting is a minority or female, again
controlling for observable characteristics of the email and its recipient (see Table IV, Model 1). Average
salaries reported in the 2004 NSOFP survey by narrow discipline in our sample varied from $30,211
(Dance) to $118,786 (Medicine) with a standard deviation of $13,265 (U.S. Department of Education,
2004). We find that a $13,265 salary increase predicts a four percentage point drop in the response rate to
minorities and females, but there is no predicted change in the response rate to Caucasian males. In other
words, the predicted discriminatory gap widens by four percentage points for every standard deviation
increase in a discipline’s salary.
To determine whether this difference is driven by a lower representation of minorities or females
in disciplines with lower salaries, we add controls for the percentage of women faculty, minority faculty
and minority graduate students in each discipline according to the 2004 NSOFP survey (U.S. Department
of Education, 2004)6; then, we interact these variables with an indicator for an email sent by a female or
minority student (Table IV, Model 2). None of these variables predicts faculty responsiveness, and their
inclusion in our regression does not change the estimated relationship between salary and discrimination.
Ancillary analyses that break out minority representation predictors into narrower groups (Black,
Hispanic, and Asian) yield nearly identical results, offering converging evidence that lower representation
of minorities and women does not predict faculty responsiveness.
Private institutions both espouse different values and pay higher salaries than their public
counterparts ($34,687 higher on average; Byrne, 2008). To explore implications of these differences, we
investigate whether discrimination varies between public and private universities (37% of the universities
in our sample are private, and 63% are public). We find a meaningful difference in bias by institution
6 Statistics are not available describing the percentage of female students by discipline.
-15-
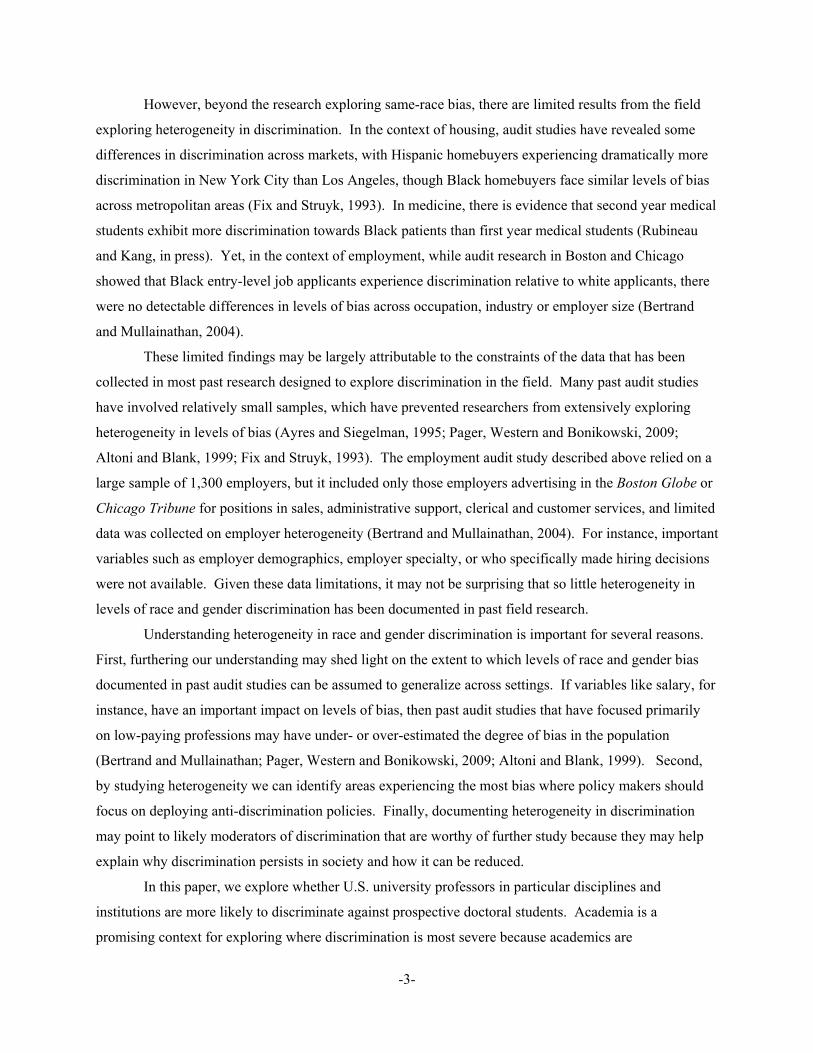
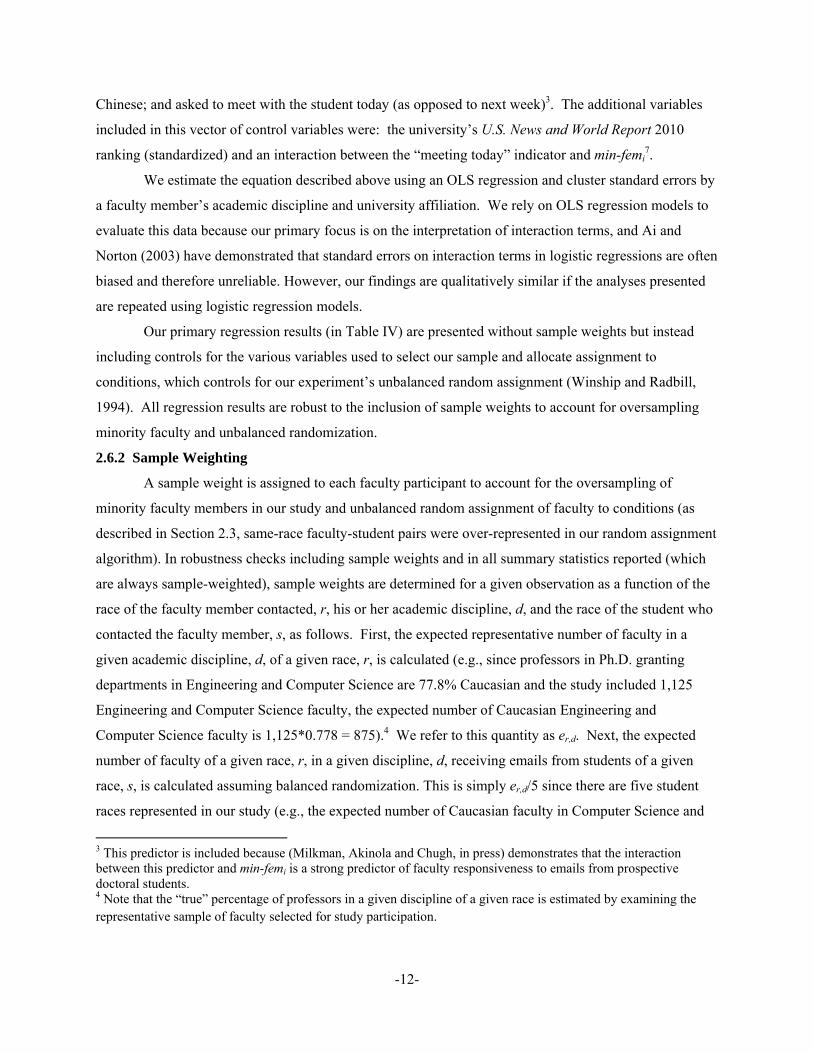
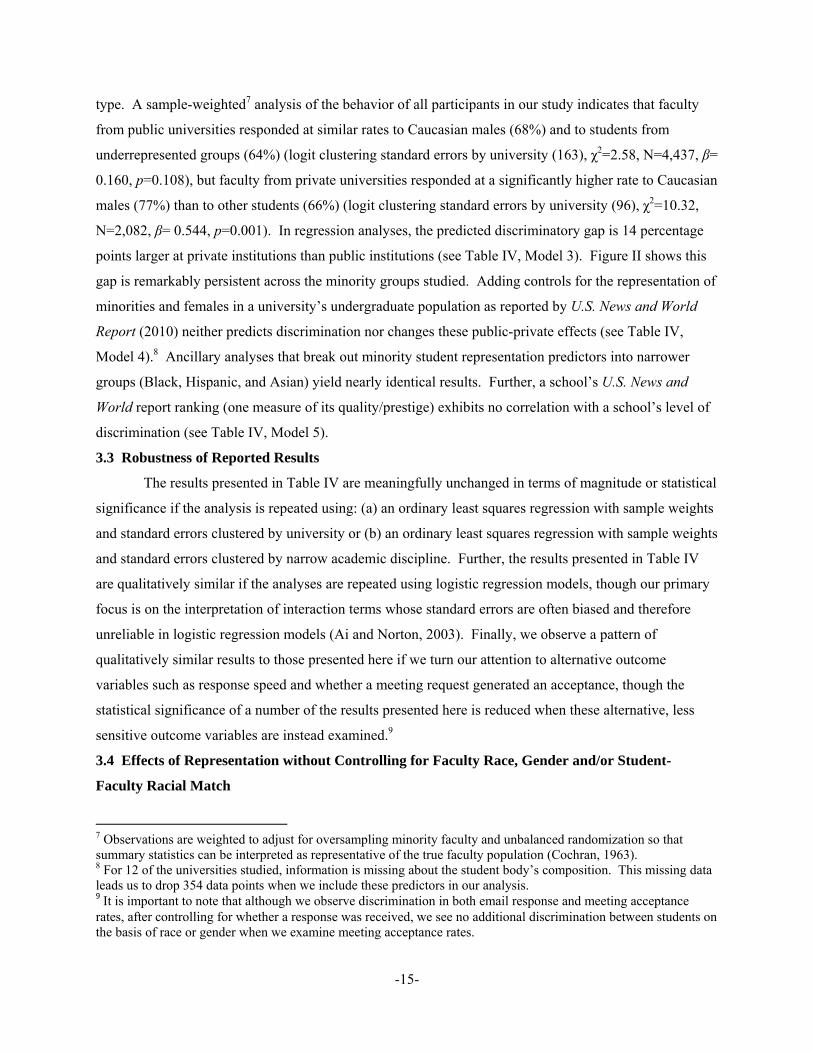
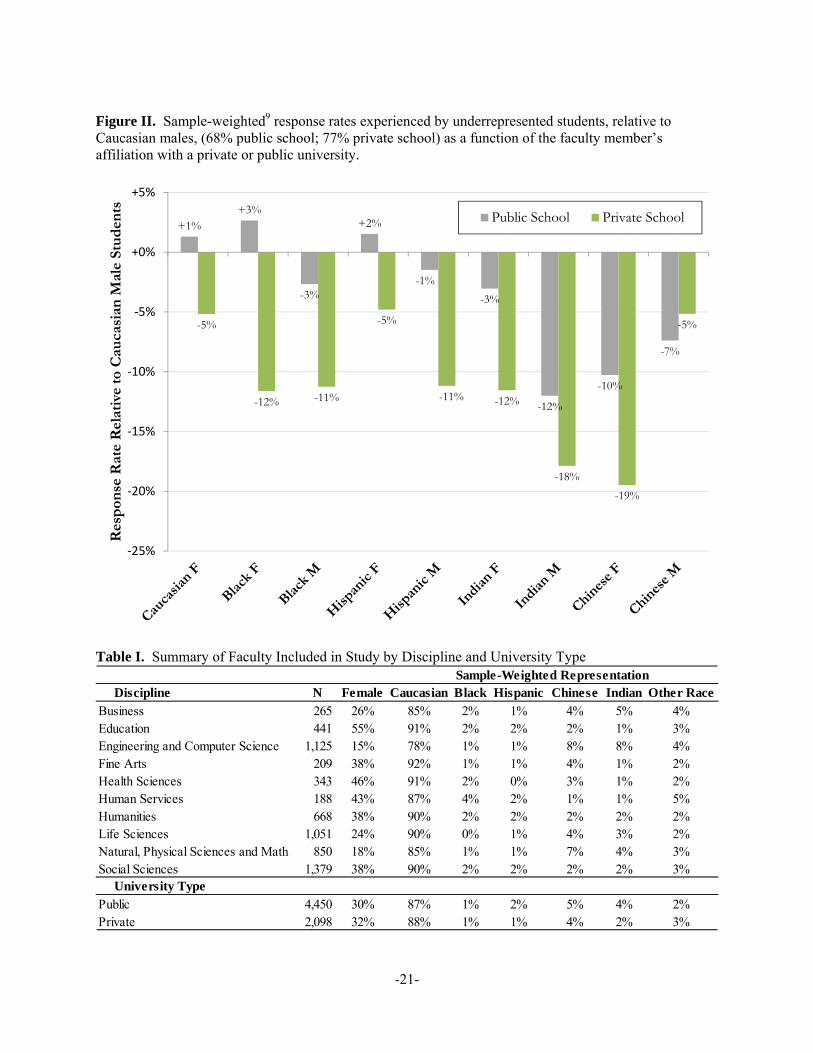
type. A sample-weighted7 analysis of the behavior of all participants in our study indicates that faculty
from public universities responded at similar rates to Caucasian males (68%) and to students from
underrepresented groups (64%) (logit clustering standard errors by university (163), χ2=2.58, N=4,437, β=
0.160, p=0.108), but faculty from private universities responded at a significantly higher rate to Caucasian
males (77%) than to other students (66%) (logit clustering standard errors by university (96), χ2=10.32,
N=2,082, β= 0.544, p=0.001). In regression analyses, the predicted discriminatory gap is 14 percentage
points larger at private institutions than public institutions (see Table IV, Model 3). Figure II shows this
gap is remarkably persistent across the minority groups studied. Adding controls for the representation of
minorities and females in a university’s undergraduate population as reported by U.S. News and World
Report (2010) neither predicts discrimination nor changes these public-private effects (see Table IV,
Model 4).8 Ancillary analyses that break out minority student representation predictors into narrower
groups (Black, Hispanic, and Asian) yield nearly identical results. Further, a school’s U.S. News and
World report ranking (one measure of its quality/prestige) exhibits no correlation with a school’s level of
discrimination (see Table IV, Model 5).
3.3 Robustness of Reported Results
The results presented in Table IV are meaningfully unchanged in terms of magnitude or statistical
significance if the analysis is repeated using: (a) an ordinary least squares regression with sample weights
and standard errors clustered by university or (b) an ordinary least squares regression with sample weights
and standard errors clustered by narrow academic discipline. Further, the results presented in Table IV
are qualitatively similar if the analyses are repeated using logistic regression models, though our primary
focus is on the interpretation of interaction terms whose standard errors are often biased and therefore
unreliable in logistic regression models (Ai and Norton, 2003). Finally, we observe a pattern of
qualitatively similar results to those presented here if we turn our attention to alternative outcome
variables such as response speed and whether a meeting request generated an acceptance, though the
statistical significance of a number of the results presented here is reduced when these alternative, less
sensitive outcome variables are instead examined.9
3.4 Effects of Representation without Controlling for Faculty Race, Gender and/or Student-
Faculty Racial Match
7 Observations are weighted to adjust for oversampling minority faculty and unbalanced randomization so that summary statistics can be interpreted as representative of the true faculty population (Cochran, 1963). 8 For 12 of the universities studied, information is missing about the student body’s composition. This missing data leads us to drop 354 data points when we include these predictors in our analysis. 9 It is important to note that although we observe discrimination in both email response and meeting acceptance rates, after controlling for whether a response was received, we see no additional discrimination between students on the basis of race or gender when we examine meeting acceptance rates.

-16-
In the primary analyses presented in Table IV, it is important to note that we control for the race
and gender of the faculty member contacted as well as whether the student contacting a faculty member in
question shares the faculty member’s race (e.g., both the faculty member and student are Black). Thus,
these analyses control for any increase in faculty responsiveness as a function of minority representation
in a discipline that might be due to increased responsiveness of faculty to students in their demographic
group. The only path through which the analyses presented in Table IV allows representation to impact
student outcomes is one whereby high rates of minority representation in a given discipline lead faculty of
other races to exhibit less bias towards minority students. However, past research has shown that
minorities are more helpful to other minorities who share their race (Price and Wolfers, 2010; Milkman,
Akinola and Chugh, in press). Thus, it is important to test for this possible pathway whereby increasing
representation might reduce discrimination in a discipline via increases in same-race or same-gender
helping. We re-run our primary analyses without including controls for faculty race, gender or faculty-
student racial match, but sample-weighting our results to adjust for oversampling of minority faculty. In
these analyses, we still observe a null effect of minority or female representation in a field or at a
university on the size of the discriminatory gap. This is likely due to the fact that even an increase from,
for example, 0% Black faculty in our Life Sciences sample (the lowest in-sample Black representation
observed) to 4% Black faculty in our Human Services sample (the highest in-sample Black representation
observed) is not a substantial enough shift to alter patterns of discrimination meaningfully.
Our experiment and analyses cannot account for the possibility that minority faculty are not only
more responsive to same-race student requests but might actively recruit same-race students, which is
another important way in which increased minority representation in a discipline might alter bias. Thus, it
is important to recognize that this experiment in no way rules out the possibility that some forms of
discrimination are reduced in disciplines with greater minority or female representation.
4. Discussion
In this paper, we identify meaningful sources of heterogeneity in discrimination. Specifically, we
demonstrate that discrimination is not evenly distributed in academia but rather, varies significantly
between disciplines and types of institutions. Importantly, our findings offer key insights into the
question of where discrimination is most severe. One answer to that question appears to be: the highest-
paid disciplines. However, the heightened levels of discrimination observed in higher-paying academic
disciplines raise the critical question of whether this relationship is causal or whether some third variable
influences both salaries and discrimination. Higher salaries may lead directly to increased discrimination,
or, pay may be higher in disciplines with some other characteristic (e.g., more of a practitioner focus,
higher status) that itself increases discrimination for reasons independent of pay. Alternatively,
-17-
individuals who show higher levels of prejudice could simply be attracted to better compensated
professions, either because of the pay or some other dimension.
Regardless of the cause, if higher pay is associated with higher levels of bias both inside and
outside of the academy, this finding has important implications. First, it calls into question the
interpretation of several of the most influential audit studies conducted in recent years measuring levels of
employment discrimination, which have explored bias in low-wage environments (Bertrand and
Mullainathan, 2004; Pager, Western and Bonikowski, 2009; Altoni and Blank, 1999; Pager and Quillian,
2005). Our findings raise questions about whether levels of bias may have been underestimated in these
papers because the employment settings studied were relatively low-income. Second, our findings have
implications for the interpretation of persistent male-female and minority-white wage gaps (Altoni and
Blank, 1999). If discrimination is greater in higher-paying fields, this may have equilibrium effects,
pushing women and minorities into lower-income professions and potentially helping to explain
persistent wage gaps. Further, recent data indicates that the male-female wage gap is larger in higher-paid
professions (Rampell, 2009), and our findings suggest that this could be due to increased gender
discrimination in higher-salary industries.
Our data also offers a second answer to the question of where discrimination is most severe:
private institutions. But why do professors at private schools discriminate more against minorities and
females than public school professors? One possible explanation is that the populations of faculty who
work at public and private institutions have different values and priorities, and thus faculty selection may
explain our findings. Another possibility is that pay (which is $34,687 higher on average at private
schools; Byrne, 2008) explains both differences in discrimination across disciplines and between public
versus private schools. For example, faculty may view pay as a signal of how valuable their time is,
which may lead higher paid faculty to be more discriminating about who they assist. A third possibility is
that university policies that differ between private and public institutions are responsible for the
differences detected. Our data strongly suggests that institutional differences, perhaps related to status,
values, or policies, can lead to varying patterns of bias, and the causal explanation should be examined in
future research.
For policy makers with an interest in improving the diversity of post-secondary institutions, our
findings highlight the fact that efforts to change the skewed demographics of the academy must
acknowledge multiple causes of underrepresentation. The best known programs aiming to change the
face of the academy do so by focusing on specific disciplines, and they assume the appropriate disciplines
to target are those where underrepresentation is most severe (e.g., STEM). Our findings suggest that
underrepresentation is just one factor that should inform where efforts to reduce bias are focused and that
discrimination is not meaningfully linked to the proportion of minority or female faculty or students in a
-18-
discipline. Therefore, in addition to focusing resources on disciplines where underrepresentation is most
pronounced, programs and policies need to be targeted specifically towards disciplines where bias is the
most acute (according to our research: business, education, human services, health sciences and
engineering). Further, our findings suggest that eliminating under-representation of women and
minorities is not likely to be a panacea for eliminating race and gender discrimination.
Broadly, the findings we present highlight the importance of looking beyond whether
discrimination exists and gaining deeper insights into where discrimination is most prevalent. Such
research can help identify where policies designed to combat discrimination are most needed, inform our
interpretation of past and future audit research, and advance our understanding of what drives
discrimination. We hope this work will inspire future studies designed to disentangle the different
possible causal explanations for the heterogeneity in discrimination detected by our audit experiment.
-19-
Figure I. Sample-weighted10 response rates experienced by minority and female students relative to Caucasian males (A) en masse and (B) broken down by race and gender as a function of the faculty member’s broad academic discipline. Disciplines are sorted by the size of the average discriminatory gap (with reverse-discrimination shown in black).
74.8%
75.5%
68.5%
63.9%
60.9%
59.0%
54.6%
69.8%
65.6%
62.3%
‐16.5%
0.5%
2.5%
5.9%
5.8%
9.1%
11.4%
13.8%
17.5%
19.0%
‐40.0% ‐20.0% 0.0% 20.0% 40.0% 60.0% 80.0% 100.0%
Fine arts
Humanities
Social sciences
Natural, physical sciences and math
Life sciences
Engineering and computer sciences
Health sciences
Human services
Education
Business
Response Rate to Minorities & Females Additional Responses to Caucasian Males
Incr
easi
ngD
iscr
imin
atio
n ag
ains
t Min
oriti
es a
nd F
emal
es
Fine Arts
10 Observations are weighted to adjust for design decisions such as oversampling minority faculty and unbalanced randomization so that summary statistics can be interpreted as representative of the U.S. faculty population. See SOM details on the study’s sampling methodology.
A
-20-
Business
Education
Human Services
HealthSciences
Engineering and CS
Life Sciences
Nat., Phs.Sci. & Math
SocialSciences
Humanities
Fine Arts
7532 percentage points1
Size of Discriminatory Gap:
-1-32-75(reverse discrimination)
B
-21-
Figure II. Sample-weighted9 response rates experienced by underrepresented students, relative to Caucasian males, (68% public school; 77% private school) as a function of the faculty member’s affiliation with a private or public university.
+1%+3%
-3%
+2%
-1%-3%
-12%
-10%
-7%
-5%
-12% -11%
-5%
-11% -12%
-18%-19%
-5%
‐25%
‐20%
‐15%
‐10%
‐5%
+0%
+5%
Res
pon
se R
ate
Rel
ativ
e to
Cau
casi
an M
ale
Stu
den
ts Public School Private School
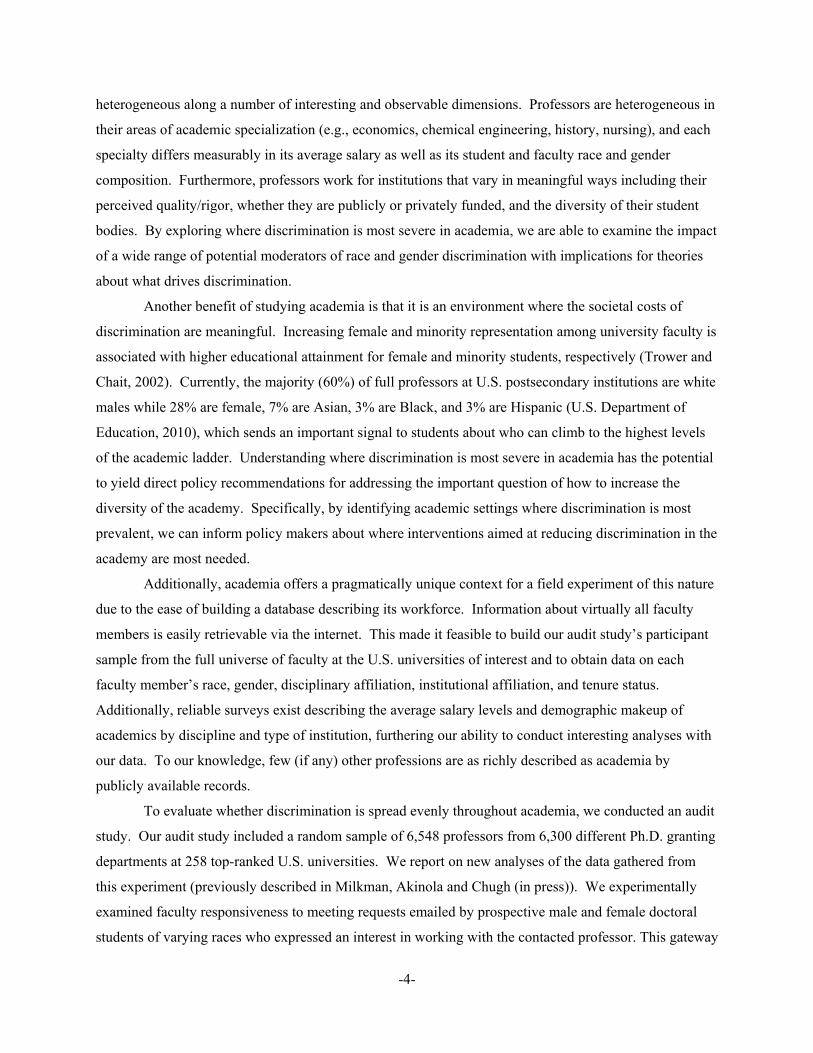
Table I. Summary of Faculty Included in Study by Discipline and University Type
Discipline N Female Caucasian Black Hispanic Chinese Indian Other RaceBusiness 265 26% 85% 2% 1% 4% 5% 4%Education 441 55% 91% 2% 2% 2% 1% 3%Engineering and Computer Science 1,125 15% 78% 1% 1% 8% 8% 4%Fine Arts 209 38% 92% 1% 1% 4% 1% 2%Health Sciences 343 46% 91% 2% 0% 3% 1% 2%Human Services 188 43% 87% 4% 2% 1% 1% 5%Humanities 668 38% 90% 2% 2% 2% 2% 2%Life Sciences 1,051 24% 90% 0% 1% 4% 3% 2%Natural, Physical Sciences and Math 850 18% 85% 1% 1% 7% 4% 3%Social Sciences 1,379 38% 90% 2% 2% 2% 2% 3%
University TypePublic 4,450 30% 87% 1% 2% 5% 4% 2%Private 2,098 32% 88% 1% 1% 4% 2% 3%
Sample-Weighted Representation
-22-
Table II. Race and Gender Recognition Survey Results for Selected Names11 Race Gender Name Rate of Race Recognition Rate of Gender Recognition
Caucasian Male
Brad Anderson 100%*** 100%*** Steven Smith 100%*** 100%***
Female Meredith Roberts 100%*** 100%***
Claire Smith 100%*** 100%***
Black Male
Lamar Washington 100%*** 100%*** Terell Jones 100%*** 94%***
Female Keisha Thomas 100%*** 100%*** Latoya Brown 100%*** 100%***
Hispanic Male
Carlos Lopez 100%*** 100%*** Juan Gonzalez 100%*** 100%***
Female Gabriella Rodriguez 100%*** 100%***
Juanita Martinez 100%*** 100%***
Indian Male
Raj Singh 90%*** (10% Other) 100%*** Deepak Patel 85%*** (15% Other) 100%***
Female Sonali Desai 85%*** (15% Other) 100%*** Indira Shah 85%*** (10% Other; 5% Hispanic) 94%***
Chinese Male
Chang Huang 100%*** 94%*** Dong Lin 100%*** 94%***
Female Mei Chen 100%*** 94%***
Ling Wong 100%*** 78%*** Reported significance levels indicate the results of a two-tailed, one sample test of proportions to test the null hypothesis that the observed recognition rate is equal to that expected by chance (16.7% for race and 50% for gender). *** p < 0.001; ** p < 0.01; * p < 0.05
11 Note that this table also appears in Milkman, Akinola and Chugh (in press).
-23-
Table III. Ordinary least squares regression to predict whether faculty respond to emails from prospective doctoral students as a function of broad academic discipline indicators (humanities omitted), interactions between discipline indicators and whether a student is a minority or female, and numerous control variables. Standard errors are clustered by broad academic discipline (N=10) and are shown in parentheses. Observations are sample-weighted. Business 0.051***
(0.005)Business x Minority or Female Student -0.180***
(0.005)Education 0.071***
(0.006)Education x Minority or Female Student -0.158***
(0.004)Human Services 0.082***
(0.005)Human Services x Minority or Female Student -0.136***
(0.008)Health Sciences -0.096***
(0.005)Health Sciences x Minority or Female Student -0.105***
(0.003)Engineering and Computer Sciences -0.080***
(0.004)Engineering & CS x Minority or Female Student -0.077***
(0.003)Life Sciences -0.093***
(0.002)Life Sciences x Minority or Female Student -0.045***
(0.002)Natural, Physical Sciences & Math -0.069***
(0.004)Natural, Physical Sciences & Math x Minority or Female Student -0.039***
(0.003)Social Sciences -0.043***
(0.002)Social Sciences x Minority or Female Student -0.021***
(0.002)Fine Arts -0.165***
(0.004)Fine Arts x Minority or Female Student 0.155***
(0.003)
Observations 6,519
R20.03
Wald Test of Hypothesis that Interaction Terms are Jointly Equal to Zero F(9,9) = 9,2485.75***
Wald Test of Hypothesis that Interaction Terms are Jointly Equal to One Another F(8,9) = 1296.12***^Significant at the 10% level. *Significant at 5% level. **Significant at 1% level. ***Significant at the 0.1% level.
Included Controls: Student: Race, Gender, Race x Gender; Recipient: Race, Gender, Position (Full, Associate, Assistant), School Rank; Request for Now; Request for Now x Minority/Female Student, Faculty-Student Racial Match
-24-
Table IV. Ordinary least squares regressions to predict whether faculty respond to emails from prospective doctoral students as a function of students' race, gender, characteristics of faculty’s academic discipline and university, and the interaction between minority student status and these faculty characteristics. Standard errors are clustered by university (N=258) and academic discipline (N=89) and are shown in parentheses. All continuous variables were standardized before creating interaction terms.
(1) (2) (3) (4) (5)Academic Z-Avg. Faculty Pay 0.000 0.009 0.014 0.014 0.014Discipline (0.016) (0.017) (0.017) (0.017) (0.017)Characteristics Z-Pay x Minority or -0.043* -0.048** -0.053** -0.053** -0.053**
Female Student (0.018) (0.018) (0.018) (0.018) (0.018)Z-Faculty% Minority - 0.002 0.000 0.000 0.000
- (0.010) (0.010) (0.010) (0.010)Z-Fac%Minority x Minority - 0.002 0.003 0.005 0.005
Student - (0.012) (0.012) (0.013) (0.013)Z-Faculty % Female - 0.018^ 0.018^ 0.019^ 0.019^
- (0.010) (0.010) (0.011) (0.011)Z-Fac%Female x Female - -0.014 -0.014 -0.014 -0.014
Student - (0.013) (0.013) (0.014) (0.014)Z-PhD Students % Minority - 0.002 0.002 -0.004 -0.004
- (0.016) (0.016) (0.016) (0.016)Z-PhD%Minority x Minority - -0.004 -0.003 0.001 0.001
Student - (0.018) (0.018) (0.018) (0.018)University Public School - - -0.100*** -0.110*** -0.113***Characteristics - - (0.025) (0.029) (0.035)
Public School x Minority or - - 0.140*** 0.141*** 0.145***Female Student - - (0.029) (0.034) (0.039)
Z-Undergraduate % Minority - - - -0.024* -0.024*- - - (0.012) (0.012)
Z-Und%Minority x Minority - - - 0.011 0.011Student - - - (0.013) (0.013)
Z-Undergraduate % Female - - - -0.009 -0.009- - - (0.008) (0.007)
Z-Und%Female x Female - - - 0.005 0.005Student - - - (0.013) (0.012)
Z-School Rank (US News) -0.006 -0.006 -0.010^ -0.006 -0.003(0.006) (0.006) (0.005) (0.005) (0.019)
Z-School Rank x Minority or - - - - -0.004Female Student - - - - (0.021)
Minority Student Black -0.088** -0.091** -0.180*** -0.176*** -0.178***Characteristics Hispanic -0.078* -0.080* -0.172*** -0.159*** -0.161***
Indian -0.177*** -0.178*** -0.268*** -0.253*** -0.255***Chinese -0.123*** -0.124*** -0.215*** -0.204*** -0.206***Female -0.042 -0.044 -0.134*** -0.128** -0.130**Black x Female 0.059^ 0.063* 0.153*** 0.146*** 0.148***Hispanic x Female 0.078* 0.081* 0.172*** 0.170*** 0.172***Indian x Female 0.105* 0.105* 0.194*** 0.172*** 0.174***Chinese x Female 0.015 0.015 0.101* 0.093^ 0.095^
Observations 6,206 6,206 6,206 6,206 5,852R2
0.02 0.02 0.03 0.03 0.03
^Significant at the 10% level. *Significant at 5% level. **Significant at 1% level. ***Significant at the 0.1% level.
Additional Controls: Recipient: Race, Gender, Position (Full, Associate, Assistant); Request for Now; Request for Now x Minority/Female Student, Faculty-Student Racial Match
-25-
References Ai, C., E.C. Norton (2003). Interaction Terms in Logit and Probit Models. Economic Letters. 80, 123-9.
Altoni, J.G., R.M. Blank (1999). Chapter 48: Race and Gender in the Labor Market. In O. Ashenfelter,
D. Card (Eds.), Handbook of Labor Economics. (Vol. 3, pp. 3143-3259): Elsevier Science.
Ayres, I., P. Siegelman (1995). Race and Gender Discrimination in Bargaining for a New Car. The
American Economic Review. 85(3), 304–321.
Bertrand, M., S. Mullainathan (2004). Are Emily and Greg More Employable than Lakisha and Jamal?
A Field Experiment on Labor Market Discrimination. American Economic Review. 94 (4), 991-
1013.
Best Colleges 2010: National Universities (2010). U.S. News and World Report.
http://colleges.usnews.rankingsandreviews.com/best-colleges/national-universities-rankings
Accessed January 2010.
Byrne, R. (2008). Gap Persists Between Faculty Salaries at Public and Private Institutions. Chronicle of
Higher Education, 18 Apr 2008.
Carnevale, A.P., S.J. Rose (2004). Socioeconomic Status, Race/Ethnicity, and Selective College
Admissions. In R. D. Kahlenberg (Ed.), America's Untapped Resource: Low-Income Students in
Higher Education. New York: The Century Foundation.
Cochran, W.G. (1963). Sampling Techniques. New York: Wiley.
Fershtman, C., U. Gneezy (2001). Discrimination in a Segmented Society: An Experimental Approach,
Quarterly Journal of Economics, February 2001, 351-377.
Fix, M. R.J. Struyk (1993). An Overview of Auditing Discrimination. Clear and Convincing Evidence:
Measurement of Discrimination in America. The Urban Institute Press: Lanham, MD.
Fletcher, J., M. Tienda (2010). Race and Ethnic Differences in College Achievement: Does High School
Attended Matter? The Annals of the American Academy of Political and Social Science, 627(1),
144-166.
Goldin, C., C. Rouse (2000). Orchestrating Impartiality: The Impact of Blind Auditions on Female
Musicians. American Economic Review. 90(4), 715-41.
Lauderdale, D. S., B. Kestenbaum (2000). Asian American Ethnic Identification by Surname.
Population Research and Policy Review. 19(3), 283-300.
List, J. (2004). The Nature and Extent of Discrimination in the Marketplace: Evidence from the Field.
Quarterly Journal of Economics. 119(1), 49-89.
Milkman, K.L., M. Akinola, D. Chugh (in press). Temporal Distance and Discrimination: An Audit
Study in Academia. Psychological Science.
-26-
Pager, D., B. Western, B. Bonikowski (2009). Discrimination in a Low-Wage Labor Market: A Field
Experiment. American Sociological Review. 74, 777-799.
Pager, D., L. Quillian (2005). Walking the Talk? What Employers Say Versus What they Do. American
Sociological Review, 70, 355-380.
Parsons, C.A., J. Sulaemon, M.C. Yates, D.S. Hamermesh (2011). Strike Three: Discrimination,
Incentives and Evaluation. American Economic Review. 101(4), 1410-1435.
Price, J., J. Wolfers (2010). Racial Discrimination among MBA Referees. Quarterly Journal of
Economics. 125(4), 1859-1887.
Rampell, C. (2009). Women Earn Less Than Men, Especially at the Top. The New York Times,
Economix: Explaining the Science of Everyday Life, 16 Nov 2009.
http://economix.blogs.nytimes.com/2009/11/16/the-gender-pay-gap-persists-especially-for-the-
rich/
Rubineau, B., Y. Kang (forthcoming). Bias in White: A Longitudinal Audit Study of Changes in
Discrimination. Management Science.
Trower, C.A., R.P. Chait (2002). Faculty Diversity: Too Little for Too Long. Harvard Magazine,
March-April.
U.S. Department of Education, National Center for Education Statistics (2010). 2005, 2007, and 2009
Integrated Postsecondary Education Data System (IPEDS), Winter 2005-06, Winter 2007-08, and
Winter 2009-10. http://nces.ed.gov/programs/digest/d10/tables/dt10_260.asp Accessed 25 July
2011.
U.S. Department of Education, National Center for Education Statistics (2004). National Study of
Postsecondary Faculty: 2003-2004 Faculty Survey. http://nces.ed.gov/dasolv2/tables/ Accessed
Summer 2010.
Winship, C., L. Radbill (1994). Sampling Weights and Regression Analysis. Sociological Methods and
Research, 23(2), 230-57.
Word, D. L., R. C. Perkins Jr., (1996). Building a Spanish Surname List for the 1990s – A New
Approach to an Old Problem. Technical Working Paper No. 13. Population Division, U.S.
Bureau of the Census.
Yzerbyt, V.Y., S. Demoulin (2010). Intergroup Relations. In S. T. Fiske, D. T. Gilbert, G. Lindzey (Eds.),
The Handbook of Social Psychology (5th edition, Vol. 2, pp. 1024-1083): Wiley: Hoboken, NJ.