Embed Size (px)
Citation preview

Systems/Circuits
Heterogeneous Origins of Human Sleep Spindles in DifferentCortical Layers
Donald J. Hagler, Jr.,1 X István Ulbert,2,3 X Lucia Wittner,2 Loránd Eross,3,4 Joseph R. Madsen,5 X Orrin Devinsky,6
X Werner Doyle,6 X Dániel Fabó,7* Sydney S. Cash,8 and X Eric Halgren1,9*1Department of Radiology, University of California at San Diego, La Jolla, California 92093, 2Institute of Cognitive Neuroscience and Psychology, ResearchCenter for Natural Sciences, Hungarian Academy of Science, Budapest, Hungary 1117, 3Peter Pazmany Catholic University, Faculty of InformationTechnology and Bionics, Budapest, Hungary 1117, 4Department of Functional Neurosurgery, National Institute of Clinical Neurosciences, Budapest,Hungary 1145, 5Departments of Neurosurgery, Boston Children’s Hospital and Harvard Medical School, Boston, Massachusetts 02115, 6ComprehensiveEpilepsy Center, New York University School of Medicine, New York, New York 10016, 7Epilepsy Centrum, National Institute of Clinical Neurosciences,Budapest, Hungary 1145, 8Department of Neurology, Epilepsy Division, Massachusetts General Hospital, Harvard Medical School, Boston, Massachusetts02114, and 9Department of Neuroscience, University of California at San Diego, La Jolla, California 92093
Sleep spindles are a cardinal feature in human NREM sleep and may be important for memory consolidation. We studied the intracorticalorganization of spindles in men and women by recording spontaneous sleep spindles from different cortical layers using linear microelectrodearrays. Two patterns of spindle generation were identified using visual inspection, and confirmed with factor analysis. Spindles (10 –16 Hz) werelargest and most common in upper and middle channels, with limited involvement of deep channels. Many spindles were observed in only upperor only middle channels, but approximately half occurred in both. In spindles involving both middle and upper channels, the spindle envelopeonset in middle channels led upper by �25–50 ms on average. The phase relationship between spindle waves in upper and middle channelsvaried dynamically within spindle epochs, and across individuals. Current source density analysis demonstrated that upper and middle channelspindles were both generated by an excitatory supragranular current sink while an additional deep source was present for middle channelspindles only. Only middle channel spindles were accompanied by deep low (25–50 Hz) and high (70 –170 Hz) gamma activity. These resultssuggest that upper channel spindles are generated by supragranular pyramids, and middle channel by infragranular. Possibly, middle channelspindles are generated by core thalamocortical afferents, and upper channel by matrix. The concurrence of these patterns could reflect engage-ment of cortical circuits in the integration of more focal (core) and distributed (matrix) aspects of memory. These results demonstrate that atleast two distinct intracortical systems generate human sleep spindles.
Key words: cortex; human; layer; memory; spindle
IntroductionSpindle oscillations are a characteristic feature of non-rapid eyemovement (NREM) sleep that were first described 80 years ago
based on scalp EEG in humans (Loomis et al., 1935). They arebursts of �10 –16 Hz activity lasting �0.5–2 s that occur during
Received Aug. 7, 2017; revised Jan. 9, 2018; accepted Jan. 10, 2018.Author contributions: I.U. and E.H. designed research; I.U., L.W., L.E., J.R.M., O.D., W.D., D.F., S.S.C., and E.H.
performed research; D.J.H., L.W., and E.H. analyzed data; D.J.H. and E.H. wrote the paper.This work was supported by National Institutes of Health Grants R01-MH-099645 and R01-EB-009282, U.S. Office
of Naval Research Grant N00014-13-1-0672, MGH Executive Council on Research, Hungarian National Brain ResearchProgram Grant KTIA_13_NAP-A-IV/1-4,6, NAP 2017-1.2.1-NKP-2017-00002, and Hungarian Government Grants
KTIA-NAP 13-1-2013-0001, OTKA PD101754 and OTKA K119443. We thank Burke Rosen, ChunMao Wang, AdamNiese, Maxim Bazhenov, and Terrence Sejnowski for commentary, feedback, and technical support.
The authors declare no competing financial interests.*D.F. and E.H. contributed equally to this study as co-senior authors.Correspondence should be addressed to Dr. Eric Halgren, Department of Neuroscience, University of California at
San Diego, MC 0852, La Jolla, CA 92093. E-mail: [email protected]:10.1523/JNEUROSCI.2241-17.2018
Copyright © 2018 the authors 0270-6474/18/383013-13$15.00/0
Significance Statement
Bursts of �14 Hz oscillations, lasting �1 s, have been recognized for over 80 years as cardinal features of mammalian sleep. Recentfindings suggest that they play a key role in organizing cortical activity during memory consolidation. We used linear microelec-trode arrays to study their intracortical organization in humans. We found that spindles could be divided into two types. Onemainly engages upper layers of the cortex, which are considered to be specialized for associative activity. The other engages bothupper and middle layers, including those devoted to sensory input. The interaction of these two spindle types may help organizethe interaction of sensory and associative aspects of memory consolidation.
The Journal of Neuroscience, March 21, 2018 • 38(12):3013–3025 • 3013

normal NREM sleep (Luthi, 2014). Recent evidence supports arole for spindles in organizing replay of prior events as criticalstep in memory consolidation (Mednick et al., 2013; Rasch andBorn, 2013). The basic neurophysiological mechanism of spindlegeneration involves intrinsic T and H currents in thalamic neu-rons and reciprocal connections between inhibitory cells in thethalamic reticular nucleus and bursting thalamocortical neurons(McCormick and Bal, 1997; Luthi, 2014). The thalamocorticalcells project this rhythmic activity onto pyramidal cells, inducingcurrents that are then the proximal cause for spindles recorded incortical local field potentials (LFPs), EEG, and the MEG.
Spindles were originally considered to be global thalamocor-tical events. As measured with scalp EEG in humans (Dehghani etal., 2010, 2011a) or on the cortex of anesthetized cats (Contreraset al., 1996), spindles tend to be widespread and highly synchro-nous. Spindle synchronization is thought to arise from corticalfeedback to the thalamic rhythm generators, as decorticationleads to desynchronization of thalamic spindles (Contreras et al.,1996), and this mechanism is supported by computational mod-eling (Bonjean et al., 2012). Recent evidence, however, suggeststhat spindles are not homogeneous. Whereas scalp EEG spindlestend to be distributed and synchronous, simultaneous MEGmeasurements have found them to be asynchronous and focal(Dehghani et al., 2010, 2011a). This is consistent with intracranialrecordings, which find that most, but not all, sleep spindles occurlocally (Andrillon et al., 2011; Piantoni et al., 2017).
The thalamocortical projection is known to be organized intotwo systems: “core” focal projections and diffuse “matrix” pro-jections (Jones, 1998; Zikopoulos and Barbas, 2007), suggestingthat local and global spindles may be mediated by core and matrixsystems, respectively (Piantoni et al., 2016). Because core andmatrix systems project differentially to different cortical layers(Zikopoulos and Barbas, 2007), this implies that different spin-dles would evoke different intracortical laminar profiles of LFPs.Early work in cats suggested that the intracortical physiology ofspindles was similar to recruiting responses, diffuse long-latency,gradually increasing cortical potentials to stimulation of nonspe-cific thalamic nuclei at �10 Hz (Dempsey and Morison, 1941; Liet al., 1956). However, Spencer and Brookhart (1961) also foundpatterns resembling augmenting responses, focal short-latency,rapidly increasing cortical potentials to stimulation of specificthalamic nuclei at �10 Hz, and suggested that both specific andnonspecific systems are engaged in spindle generation, often dur-ing the same spindle discharge. They recorded relative to a distantreference, which renders laminar localization of transmembranecurrents problematic (Kajikawa and Schroeder, 2011). Kandeland Buzsaki (1997) reported that the main laminar pattern ofspindles in unanesthetized rats resembled augmenting responses,but mentioned that other patterns were also present. Thus, theseearlier studies, while suggestive, are limited in either their tech-nical implementation or focus and, in any case, were in differentspecies, which may have differently organized sleep spindles. Wereport here what appears to be the first description of laminarprofiles of spontaneous sleep spindles, recorded using linear mi-croelectrode arrays in epilepsy subjects, focusing on the questionof multiple spindle generators.
Materials and MethodsParticipants and data collection. Five subjects (15– 42 years old; 3 female;Fig. 1) with long-standing pharmaco-resistant complex partial seizuresparticipated after fully informed consent according to the Declaration ofHelsinki guidelines as monitored by the local Institutional ReviewBoards. Subdural grid and strip electrode arrays were placed to confirm
the hypothesized seizure focus, and locate epileptogenic tissue in relationto essential cortex, thus directing surgical treatment. The decision toimplant, the electrode targets, and the duration of implantation weremade entirely on clinical grounds without reference to this research.NREM sleep was detected by the prevalence of generalized slow rhythmsand spindles in cortical and scalp electrodes.
Electrodes and localization. A laminar microarray containing 2490%Pt/10%Ir contacts, each 40 �m in diameter, at 150 �m center-to-center spacing (Ulbert et al., 2001), was placed under the grid in cortexthat had been previously identified as probably epileptogenic, in thecenter of the likely surgical target in the frontal or temporal associationcortex (Fig. 1 A, B,D). Gyral localization was based on direct visualizationduring surgery in all subjects, supplemented with transmission x-ray(Subject 1), or structural MRI with electrodes in place (Subjects 2–5).
Localization with respect to cortical lamina was based on surgical pro-cedure and electrode design, confirmed by histology in 2 subjects (Fig.1C). The neurosurgeon placed the electrode under direct visualization,perpendicular to the cortical surface. The electrode is designed with athin Silastic flap, which adheres by surface tension to the pial surface, andthe electrode is kept in place because it is underneath the clinical grid anddura. The micro-contacts are positioned at fixed distances from the un-derside of the Silastic flap, constraining their distance from the pial sur-face. Specifically, the first contact was centered �150 �m below the pialsurface, and the 24th contact at �3600 �m below the pial surface. Al-though this does not allow absolute localization of the contacts withrespect to cortical lamina, it does permit their correspondence to beestimated from previous measurements of laminar width in human cor-tex (Hutsler et al., 2005).
In 2 of the 5 subjects, it was possible to remove en bloc the corteximmediately surrounding the microelectrode array at the therapeuticcortectomy. Histological analysis of the microelectrode tracks was per-formed as described previously (Csercsa et al., 2010). Briefly, tissueblocks were fixed with 4% PFA, 0.1% glutaraldehyde, and 0.2% picricacid in 0.1 M phosphate buffer (PB). Sixty-micron-thick sections were cutwith a Vibratome, thoroughly washed with PB, immersed in 30% sucrosefor 1–2 d, and then frozen three times over liquid nitrogen. Endogenousperoxidase was blocked by 1% H2O2 in PB for 10 min. Nonspecificimmunostaining was blocked by 5% milk powder and 2% BSA. Mousemonoclonal antibody against the neuronal marker NeuN (1:3000, Milli-pore Bioscience Research Reagents) was used for 2 d. For visualization ofimmunopositive elements, biotinylated anti-mouse IgG (1:300, VectorLaboratories) was applied, followed by avidin-biotinylated HRP com-plex (ABC; 1:300, Vector Laboratories). The immunoperoxidase reac-tion was developed by DAB (Sigma-Aldrich), as a chromogen. Sectionswere then osmicated (0.25% OsO4 in PB) dehydrated in ethanol, andmounted in Durcupan (ACM, Fluka).
Considering a larger sample of patients with laminar electrodes, his-tological localization of laminar electrode contacts was available in 9subjects, 2 of which (Subjects 4 and 5) are included in this paper. Surgicalconstraints did not allow en bloc resection of the implantation site in theother subjects. The 9 subjects with histology include one that was (inten-tionally) placed in a tuber, and 1 that was not perpendicular to the surface(Subject 5 of the current paper). Omitting these 2 subjects, the mean �SD of the center contact in each layer were as follows: layer 1, contact1.00 � 0.00; layer 2, contact 3.43 � 0.53; layer 3, contact 7.00 � 1.00;layer 4, contact 10.14 � 1.21; layer 5, contact 14.00 � 2.00; and layer 6,contact 19.14 � 3.39. The insertion point of the electrode in Subject 5 wasdisplaced from the crown of the gyrus and thus was at an angle to thecortical layers. Consequently, the central contacts of the layers in thissubject were as follows: layer 1, contact 2; layer 2, contact 5; layer 3,contact 10; layer 4, contact 14; layer 5, contact 21; and layer 6, not sam-pled. The electrode tracks in all of the other 8 subjects were perpendicularto the layers, and the surgeon in Subjects 1– 4 of the current paper at-tempted to place the electrodes in the gyral crown. Given the consistencyof the overall histological results, and the lack of individual histologicallocalization in three of the 5 subjects, we elected to analyze the data withrespect to contact, and to use the minimal labels of “upper,” “middle,”and “lower” rather than the 6 canonical layers. Channels 1– 4, labeled“upper” would include layer 1 and parts of layer 2; channels 10 –14,
3014 • J. Neurosci., March 21, 2018 • 38(12):3013–3025 Hagler et al. • Intracortical Laminar Spindle Patterns in Humans
labeled “middle” would include layer 4 and parts of surrounding layers;channels 20 –23, labeled “deep” would include layer 6 in most subjects.This conservative approach is based on the known contact-layer relation-ship imposed by the physical constraints of the implantation and elec-trode design, and confirmed by histological analysis when available. Dataare thus presented as averages by channel across subjects (see Figs. 3, 4, 7,8), as well as individual subject data to permit variability to be evaluated(see Figs. 5, 6, 8). This approach is further validated by the similarity ofthe laminar LFP gradient (LFPg) and current source density (CSD) pro-files across subjects (see Fig. 5).
Recordings and preprocessing. LFPg recordings were made from 23pairs of successive contacts. After wideband (DC 10,000 Hz) preamplifi-cation (gain 10�, CMRR 90db, input impedance 10 12 ohms), the signalwas split into LFPg (filtered at 0.2–500 Hz, gain 1000�, digitized at 2000Hz, 16 bit) and action potentials (filtered at 200 –5000 Hz, gain 1000�,digitized at 20,000 Hz, 12 bit), and stored continuously. Differentialrecording permitted adequate signal-to-noise ratio on active wards dueto high common mode rejection ratio of radiated noise common toadjacent leads (Ulbert et al., 2001). Furthermore, modeling studies dem-onstrate that the LFPg between contacts at 150 �m centers assures thatactivity is a reliable probe of locally generated activity, unlike referentialLFP (Kajikawa and Schroeder, 2011). CSD is also reliably local but is aderived measure with multiple assumptions (e.g., radial symmetry of thegenerator around the electrode track, and constant extracellular conduc-tivity) and more susceptible to noise, gain equalization, and other instru-mentation issues. Consequently, both LFPg and CSD data are displayed.Data were collected in an Epilepsy Monitoring Unit during naturallyoccurring nocturnal sleep. Epochs were chosen for analysis when thepatient was behaviorally asleep and widespread slow waves (� activity)were present in the electrocorticogram, identifying NREM sleep, includ-
ing both Stages N2 and N3 because both include sleep spindles (Andril-lon et al., 2011; Mak-McCully et al., 2017; Piantoni et al., 2017), and toincrease comparability to rodent studies where the N2/N3 distinction isnot clear. An average of 50 min sleep (SD � 21, range � 16 – 67) wasanalyzed per subject.
The recordings often exhibit various electrical artifacts, for example,caused by the participant changing head position. Being epilepsy sub-jects, abnormal spiking activity is also possible. Furthermore, defectiveelectrode contacts result in unusable recordings from two adjacent dif-ferential amplifier channels. To handle such artifacts, laminar electrodedata were preprocessed to filter line noise, exclude high-amplitudespikes, and replace “bad” channels through interpolation and slight spa-tial smoothing. To suppress line noise, a notch filter was applied (zerophase shift, frequency domain), with a stop frequency of 50 or 60 Hz(depending on acquisition site) and a transition band equal to 30% of thestop frequency. This means that, for a stop frequency of 50 Hz, oscilla-tions between 50 and 65 Hz were gradually attenuated, until being com-pletely passed �65 Hz. “Bad” channels, which typically exhibit frequent,high-amplitude artifacts, usually occurring with opposite polarity in twoadjacent channels, were identified visually for each laminar recording(i.e., the time series data collected with a laminar electrode array for asingle subject). There were between 2 and 10 of these bad channels ineach recording (mean � 5.4, SD � 3.0; S1: [17, 18]; S2: [13, 14, 22, 23];S3: [1, 3, 4, 12, 13, 15, 16, 19, 20, 23]; S4: [13, 14, 18, 19, 23]; S5: [7, 10, 16,17, 19, 20]). Time windows of high-amplitude fluctuations were ex-cluded using a manually determined masking threshold. For each lami-nar recording, time series data were visually reviewed (excluding “bad”channels) and a threshold value was chosen to be greater than the normalfluctuations from the mean but less than the sharp, high-amplitude de-viations from the mean. This threshold was applied to create a binary
S1 Rt Frontal 27yo F S2 Rt Temporal 42yo F
S3 Lt Frontal 26yo M S4 Rt Frontal 15yo M S5 Rt Frontal 34yo F
IIIIII
IV
V
VI
IIIIIIIVVVI
S4
S5
All subjectsA B Electrode C Histology
D Imaging
a
b
c
d 1mme
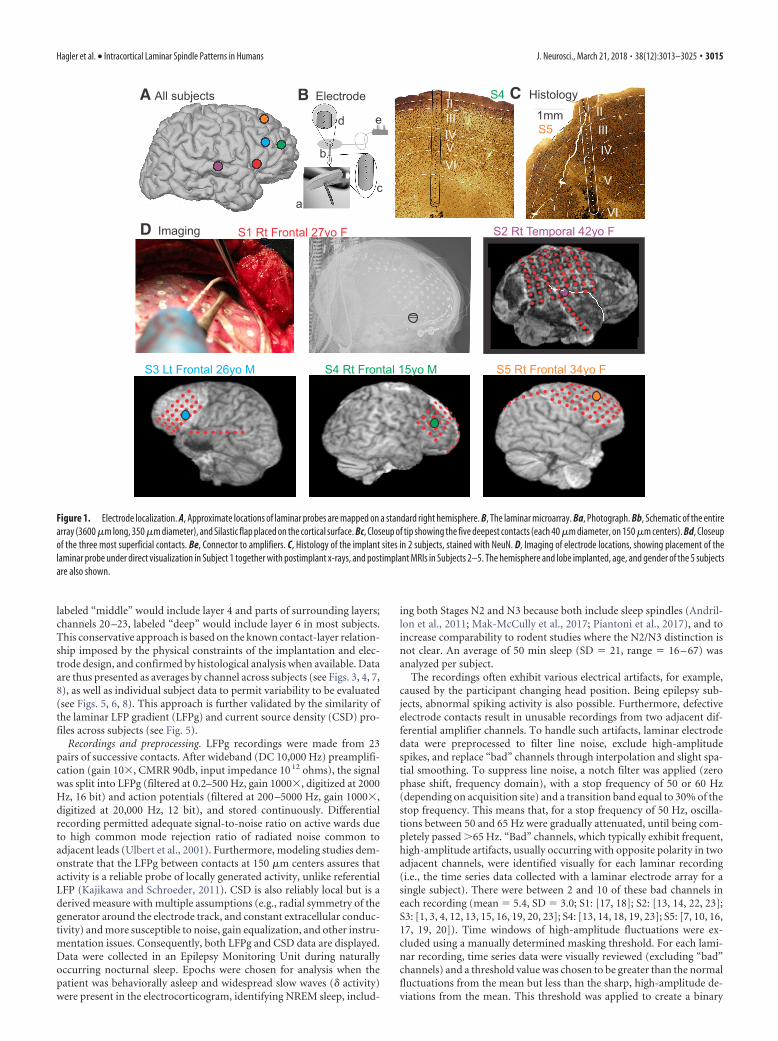
Figure 1. Electrode localization. A, Approximate locations of laminar probes are mapped on a standard right hemisphere. B, The laminar microarray. Ba, Photograph. Bb, Schematic of the entirearray (3600 �m long, 350 �m diameter), and Silastic flap placed on the cortical surface. Bc, Closeup of tip showing the five deepest contacts (each 40 �m diameter, on 150 �m centers). Bd, Closeupof the three most superficial contacts. Be, Connector to amplifiers. C, Histology of the implant sites in 2 subjects, stained with NeuN. D, Imaging of electrode locations, showing placement of thelaminar probe under direct visualization in Subject 1 together with postimplant x-rays, and postimplant MRIs in Subjects 2–5. The hemisphere and lobe implanted, age, and gender of the 5 subjectsare also shown.
Hagler et al. • Intracortical Laminar Spindle Patterns in Humans J. Neurosci., March 21, 2018 • 38(12):3013–3025 • 3015

(0 or 1) time series mask. Time points within2 s of threshold crossings were set to 0, as weretime windows �5 s in duration between poten-tial artifactual periods to eliminate periodswith repeated abnormal activity. Data for badchannels were replaced by the weighted aver-age of neighboring, good channels, withweights that decrease with increasing spacingbetween channels according to an exponentialdecay function (decay constant � 0.1 channelspaces). One-dimensional spatial smoothingwas then applied across channels (Gaussian� � 0.64 channel spaces, equivalent toFWHM � 1.5). This slight spatial smoothingwas applied to ensure gradual and continu-ous variation across channels, which is com-monly done to suppress false sources andsinks due to slight signal fluctuations. An av-erage of 7.5% of the analyzed sleep period(SD � 6.4%, range � 2.1%–16.4%) was re-jected per subject.
Spindle detection. Spindles were detected us-ing custom methods developed to accommo-date the observed characteristics of spindles inlaminar potential gradient recordings. Thespindle detection algorithm, described in detailbelow, was based on the standard criterion ofsustained power in the spindle band (Andrillonet al., 2011). Sensitivity was increased by relax-ing amplitude and duration criteria, whereasselectivity was maintained by adding rejectioncriteria from adjacent bands (Mak-McCully etal., 2017), and validating with visual inspection(Fig. 2). Time courses of spindle-band ampli-tude were calculated by applying to the mini-mally processed single-channel LFPg (Fig. 2B),a zero-phase shift, frequency domain, band-pass filter (10 –16 Hz; Fig. 2C), with transitionbands equal to 30% of the cutoff frequencies.These cutoff frequencies were chosen as a com-promise between the current clinical standardof 11–16 Hz (Silber et al., 2007), and previouspublications describing sleep spindles using9 –15 Hz (Andrillon et al., 2011; Piantoni et al.,2017) or 10 –16 Hz (Mak-McCully et al., 2017).Absolute values of the filtered data weresmoothed across time by convolving with a ta-pered cosine (Tukey) (Harris, 1978) window(width � 300 ms, ratio of cosine taper to con-stant region � 0.5; Fig. 2D). To account forbetween-channel differences in spindle-bandamplitude, channel-specific, median values ofspindle band amplitudes were subtractedfrom each channel. Offset spindle-band am-plitudes were then normalized by dividing bya robust estimator of the SD (rSD: the me-dian absolute deviation divided by 0.6745). To preserve relative dif-ferences in spindle amplitudes between channels, rSD values wereaveraged across channels and then applied as a uniform normaliza-tion factor.
Potential spindles were identified independently for each channel byfinding peaks in the normalized spindle-band envelope time courses withamplitudes �1. Spindle onset and offset were estimated by finding thenearest time points before and after the peak of the spindle-band enve-lope with amplitudes �1. Possible spindles were excluded if the esti-mated spindle durations were �200 ms. Epochs containing a possiblespindle in one or more channel were then identified, and the overallspindle epoch onset and offset were estimated as the earliest onset and thelatest offset across channels.
To avoid filtering artifacts, such as ringing, and to adequately accountfor the reported variation in spindle frequency, a relatively broad band-pass filter was used to identify spindle epochs. Consequently, this methodis sensitive to high-amplitude, transient increases in power at frequenciesthat are slightly lower or higher than the spindle range of 10 to 16 Hz. Forthis reason, we excluded events with relatively high amplitude in lowerand higher frequency bands. To exclude such epochs, low-band (4 – 8Hz) and high-band (18 –25 Hz) time courses were calculated as describedabove for the spindle-band, except with different bandpass filters (Fig.2D). Epochs were rejected if they contained low- or high-band ampli-tudes �5 (relative to the rSD of low- or high-band amplitude) betweenthe supposed spindle onset and offset in any of the channels containing asupposed spindle for that epoch. This strategy also rejected theta bursts,
-202468
A Laminar Local Field Potential gradient (LFPg)
B Minimally processed single-channel LFPg
C Spindle-band filtered LFPg (10-16 Hz)
D Band-pass filtered LFPg envelopes
norm
aliz
edam
plitu
de
upperlayers
deeplayers
spindle (10-16 Hz)high (18-25 Hz)
low (4-8 Hz)
1s
1mV
/mm
200µ
V/m
m
1mm
middlelayers
S1
-+
1 32 4
spin
dle
spin
dle
reje
cted
reje
cted
dow
nsta
te
dow
nsta
te
Figure 2. Spindle detection. A, Example of laminar recordings of two spindles (2, 4) following downstates. The first spindle isclear in both upper channels (blue traces) and middle channels (brown traces), whereas the second is only clear in middle channels.Data were minimally preprocessed: 60 Hz notch filter, interpolation to replace bad channels and slight spatial smoothing. B,Spindles detected in one middle channel are marked with green background. Potential spindle events were rejected for excessivelow-frequency (blue bar, event 1) or high-frequency (red bar, event 3) power. C, Bandpass filtered data in spindle band (10 –16 Hz)from middle layer channel. D, Normalized amplitude envelopes of low- (4 – 8 Hz), spindle-, and high-band (18 –25 Hz) oscillations.
3016 • J. Neurosci., March 21, 2018 • 38(12):3013–3025 Hagler et al. • Intracortical Laminar Spindle Patterns in Humans
which have a frequency profile that often extends into spindle range, andcan be seen to occur before downstates in Figure 2A, whereas spindlesoccur after downstates.
Spindle identification inevitably results in false-positives and false-negatives, especially near the detection threshold. False-negatives are aparticular concern in evaluating spindle spread between layers, wherethey could result in an underestimation of the degree of intracolumnarspread. To determine whether characteristics of spindles were robust tothe choice of detection threshold, we initially used a relatively low am-plitude threshold to detect spindles in as many channels as possible, andthen repeated our analyses including only spindles with overall ampli-tudes above the median. The overall amplitude of a given spindle epochwas defined in this context as the maximum across channels of the peakspindle-band amplitude. Spindle co-occurrence rates for both analysesare reported, but our primary analyses focused on the “strong” spindleswith amplitudes greater than or equal to the median amplitude. An av-erage density of 13.1 strong spindles per minute (SD � 2.0, range �10.5–15.8) were detected across subjects.
CSD. Population trans-synaptic current flows were estimated usingCSD analysis (Nicholson and Freeman, 1975). As preprocessing specificto CSD calculations, additional one-dimensional smoothing, was ap-plied across channels (� � 0.85, FWHM � 2). CSD time courses werethen calculated from the smoothed LFPg data by applying a regularizedinverse (signal-to-noise ratio � 20) matrix operator calculating the sec-ond spatial derivative (Pettersen et al., 2006). The equivalent currentdipole was calculated from the estimated CSD by essentially calculating adistance-from-center weighted average of the CSD, implemented usingtrapezoidal integration. One-dimensional CSD assumes that the extra-cellular tissue conductance does not change over the sampled trajectory,and that the transmembrane currents are symmetrical around thattrajectory.
Phase amplitude coupling. Spindle epochs were sorted into two groupsbased on detection in upper channels but not middle, or in middle chan-nels but not upper. For each channel group, a reference channel wasselected based on highest fraction of spindles detected for a given record-ing. We define the fraction of spindles detected as the number of spindlesdetected in a given channel relative to the total number of spindles de-tected in any channel. Centered on each spindle (with spindle epochcenter determined by the average of estimated epoch onset and offset),4000 ms epochs were filtered for three different frequency bands (spin-dle: 10 –16 Hz; low gamma: 25–50 Hz; high gamma: 70 –170 Hz) using azero-phase shift, frequency domain, bandpass filter, with transitionbands equal to 30% of the cutoff frequencies. Amplitude and phase wereobtained from the Hilbert transformation. To avoid edge artifacts, and tolimit analysis to the stronger part of the spindle, the epoch was thenreduced to �400 to 400 ms relative to the center of each spindle epoch.Spindle phase and gamma amplitudes were sampled from a single CSD-derived channel corresponding to the peak of the current sink. Spindlephases for each epoch were sorted into 32 bins (10 degrees) and low andhigh gamma amplitudes were averaged across time points within eachphase bin.
To visualize this phase amplitude relationship (see Fig. 4), spindle timecourses and low and high gamma amplitude were averaged across epochsfor each channel, time-locked to the largest spindle-band peak in thechannel with the highest fraction of spindles detected, for epochs thatwere either in upper channels only or middle channels only, and thenaveraged across subjects (n � 5). Gamma amplitudes were transformedinto z scores before averaging across subjects, using the average and SE ofgamma power across all epochs between �400 and 400 ms of spindlecenter.
Phase differences between channels. Spindle epochs were selected basedon detection in both upper channels and middle channels. One referencechannel was selected for each channel group, as described above for phaseamplitude coupling analysis. The average phase difference for each sub-ject was calculated for the selected upper channel relative to the middlechannel. Each spindle epoch was recentered in time to the highest am-plitude spindle peak in the selected middle channel for that epoch. In-stantaneous phase was derived from Hilbert transforms of bandpassfiltered (10 –16 Hz) waveforms. Phase differences were calculated at each
time point by subtracting the instantaneous phase value of the middlechannel from the instantaneous phase value of the upper channel. Phasedifferences between �200 ms and 200 ms were averaged using the circu-lar mean (circ_mean) function of the CircStat MATLAB Toolbox (Be-rens, 2009). These average phase differences were then averaged acrossepochs, again using a circular mean. Because the polarity of LFPg mea-surements in individual channels depend on that channel’s position rel-ative to sources and sinks, two channels with opposite polarity willexhibit a phase difference approaching half a cycle that has no signifi-cance for the evaluation of phase delays between layers. Consequently, weinterpreted phase differences approaching a half cycle as reflecting anuninformative polarity inversion, superimposed on the true phase lag inone channel relative to another. For this reason, for phase differences thatwere ��0.25 cycles or �0.25 cycles, an additional 0.5 cycles were addedor subtracted, respectively, from the calculated phase difference (for Sub-jects 2, 3, and 5).
Experimental design and statistical analysis. Epochs containing laminarrecordings of spontaneously occurring spindles were detected in slowwave sleep in 5 subjects. In addition to describing these unique record-ings, with standard descriptive statistics, we performed the followingstatistical analysis to determine whether gamma amplitude is modulatedby spindle phase. The Modulation Index (MI) was calculated as de-scribed by Tort et al., 2010, from the phase amplitude-coupling (gammaamplitude for each phase bin). Bootstrap resampling across epochs with2000 iterations was used to estimate 95% CIs for MI (Efron, 1981).Although these measures are ideally zero under the null hypothesis, spu-rious, non-zero, phase amplitude relationships can occur. To estimatethe rate at which this occurs, we generated a highly conservative, upper-bound null hypothesis value using the upper 95th percentile value of MIcalculated with phase information scrambled across epochs. On each of100 iterations, gamma amplitudes of each epoch were assigned to thespindle phases of a randomly chosen epoch, based on random permuta-tions of the epoch order. MI was calculated for each of these permuta-tions, forming a distribution to represent the null hypothesis. The 95thpercentile value of this distribution was estimated from the mean plustwice the SE. The bootstrap CIs were then compared with this upper-bound null value in the calculation of p values. Separate analyses wereperformed for spindles, which were limited to either upper or middlechannels.
When spindles occurred in both middle and upper channels, then aone-sample t test was performed with one value from each subject tocompare the latency of spindle onset (as described above). These laten-cies were determined in each co-occurring spindle individually, thesigned differences obtained, and averaged across all such spindles for thatsubject, and the resulting mean was used for the t test. The same proce-dure was used to compare the latency to peak in upper versus middlechannels. Paired t tests with two values from each subject were used tocompare the proportion of spindles detected in upper channels that alsooccurred in middle channels, to the proportion of spindles detected inmiddle channels that occurred in upper.
Principal component analysis (PCA) was performed on the data foreach subject using singular value decomposition (SVD), as implementedin the runpca function included in the EEGlab toolbox (Swartz Centerfor Computational Neuroscience, La Jolla, CA). Input data were spindle-band (10 –16 Hz) filtered laminar time series data, concatenated acrossspindle epochs, with time points before and after the estimated spindleonsets and offsets excluded. Spatiotemporal patterns of spindle compo-nents were visualized by calculating average spindle time courses for eachof the first two principal components. For these calculations, the Eigen-vectors and Eigenvalues returned by the PCA analysis for each of the twocomponents were individually applied to the spindle-band filtered datato obtain sensor-space time courses for each component. Spindles wereaveraged across epochs, time-locked to the largest spindle peak in eachepoch, and then averaged across subjects. The Eigenvector returned byPCA for a given component is a set of weights for each laminar channel.The sign of the Eigenvector being arbitrary and variable across subjects,we flipped the sign, if necessary, to make the mean of the channel weightsfor a given Eigenvector to be positive, allowing for a meaningful groupaverage.
Hagler et al. • Intracortical Laminar Spindle Patterns in Humans J. Neurosci., March 21, 2018 • 38(12):3013–3025 • 3017

Limitations. This study is limited by the relatively small sample size,due to stringent clinical and technical requirements. Also, because theserecordings are only performed in subjects with intractable epilepsy, closeto the seizure focus, the generalizability of these results is a concern.However, we eliminated from consideration recordings with abnormalbackground activity, as well as epochs with epileptiform transients, orsessions following electrographic seizures. Another limitation is un-avoidable ambiguities in spindle detection. We avoided false-positives byexcluding events that had relatively high amplitude in lower- or higher-frequency bands. Conversely, avoiding false-negatives is important toaccurately detect co-occurrence across channels. We used a relatively lowinitial threshold to detect spindles in as many channels as possible, butthen excluded the spindle epochs in which the maximum amplitude inany one channel was below the median. We found that the weaker “spin-dles” had very low co-occurrence across channels. Given the laminararrangement of channels, a true spindle occurring in one channel shouldalso very likely be observed in neighboring channels, indicating thatmany of those weaker spindles were likely chance occurrences in singlechannels.
ResultsLaminar electrode recordings collected from 5 human epilepsysubjects were included in the current study (see Data collection).Laminar recording sites were located in either frontal or temporallobes. Epochs containing a spindle in at least one of the 23 lami-nar channels were identified based on the amplitude envelope ofbandpass filtered activity between 10 and 16 Hz (see Spindle de-tection; Fig. 2). The maximum spindle amplitude across chan-nels was calculated for each putative spindle epoch wedetected. To reduce the possibility of including nonspindleevents in our analyses, epochs with maximum amplitudes less
than the median maximum amplitude were excluded from ourprimary analyses. Spindles were visible in the raw traces, oftenfollowing K-complexes (Cash et al., 2009) or downstates(Csercsa et al., 2010). Typically, distinct LFPg profiles werenoted for downstates versus spindles, but this was not quanti-tatively examined (Fig. 2A).
The laminar profile of spindle amplitudes varied considerablyacross spindle epochs. Some spindles were restricted to a fewadjacent channels in either the upper range (e.g., channels 1– 4)or the middle range (e.g., 10 –14), although many spindles weredetected simultaneously in both upper and middle channels (Fig.3A). Averaged across epochs, spindle amplitude was greatest inmiddle channels (average normalized spindle amplitude: 3.5 �0.2 SEM, n � 5), slightly weaker in upper channels (2.3 � 0.1SEM), and weaker still in deep channels (1.2 � 0.4 SEM) (Fig.3B). Laminar variation in the likelihood of detecting a spindlewas closely related to spindle amplitude, with most frequent de-tection in middle channels (average fraction of spindles detected:0.72 � 0.04 SEM), somewhat reduced frequency of detection inupper channels (0.52 � 0.03 SEM), and further reduced fractionof spindles detected in deep channels (0.25 � 0.10 SEM).
Most spindles were detected simultaneously in multiple chan-nels, often with substantial spatial separation between the chan-nels (Fig. 3C). For the higher amplitude, “strong” spindles,laminar recordings exhibited distinctive patterns of spindle co-occurrence (i.e., the rate at which a spindle was detected in a pairof channels in the same epoch). For epochs excluded based onlower than median amplitudes, co-occurrence was much lower,such that “weak” spindles were often detected in only one chan-
upper
middle
upper+middle
chan
nel
chan
nel
normalized amplitude
upper only middle only upper + middle
5
10
15
20
upper
middle
upper +middle
other
channel
chan
nel
5
20
chan
nel
weak (< median)
.8
.4
0
upper
middle
lower
0 1 2 3 4
100%50 50%0 0
A Example bandpassed spindles (10-16Hz; LFPg) B Spindle amplitude
D Relativeco-occurrence
E Proportion oftotal spindles
C Spindle co-occurrence1410
14
1 23
1
23
1
23
co-occurrencewith upperspindles
co-occurrencewith middlespindles
S1
S2
S3
S4
S5
1
23
uppe
rm
iddl
e
-200 0 200ms
chan
nel
-200 0 200 -200 0 200
strong (>median)
sink
source
Figure 3. Spindle amplitudes and occurrence across channels. A, Examples of spindle activity (bandpass filtered, 10 –16 Hz) detected in upper channels only, middle channels only, or both upperand middle channels. Each plot is normalized to its maximum absolute value. B, Group average (n � 5) of peak normalized spindle-band amplitude averaged across all epochs for each channel.Shaded region represents 95% CI (1.96 � SEM). C, Top, Spindle co-occurrence matrix for “strong” spindles, with maximum amplitude greater than the median. Bottom, Co-occurrence matrix for“weak” spindles. Displayed values represent the number of “strong” or “weak” spindles detected in a given channel or pair of channels divided by the total number of “strong” or “weak” spindlesdetected in any channel for a given subject. Thus, the diagonal indicates the proportion of total spindles that included that particular channel. The plot suggests that strong spindles usually involvedmultiple middle channels, whereas weak spindles tended to occur in a single channel. D, Relative co-occurrence rates for epochs containing a spindle in either upper or middle channels. E, Groupaverage of the fraction of spindles detected in upper channels only, middle channels only, upper and middle channels, or other channels.
3018 • J. Neurosci., March 21, 2018 • 38(12):3013–3025 Hagler et al. • Intracortical Laminar Spindle Patterns in Humans
nel at a time. For spindles detected in upper channels (selected foreach laminar recording based on highest fraction of spindles de-tected among channels 1– 4), spindles were found to co-occur inmiddle channels more than half the time (0.76 � 0.04 SEM; Fig.3D). For spindles detected in middle channels (channels 10 –14),spindles co-occurred in upper channels slightly less often (0.55 �0.03 SEM; difference from upper-detected channels p � 0.015,paired t test; Fig. 3D). Spindles occurred in both upper and mid-dle channels approximately half of the time but sometimes oc-curred in only upper or only middle channels, demonstrating adegree of independence of occurrence (Fig. 3E).
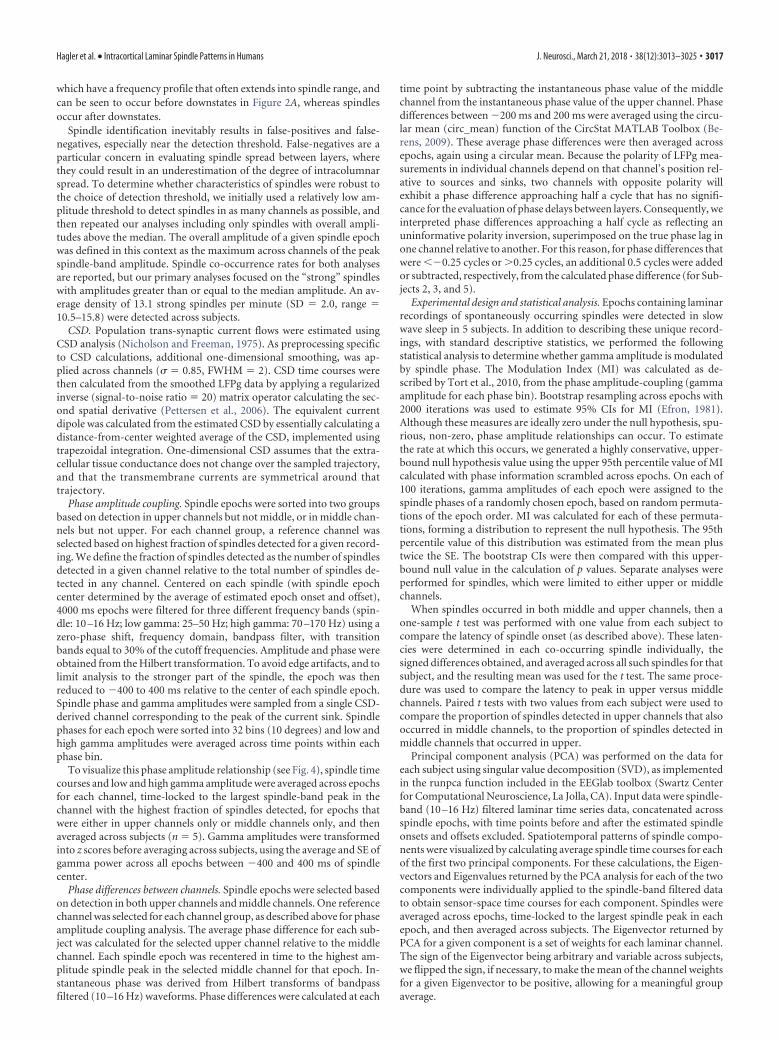
We characterized the current sources and sinks associatedwith spindles detected in either upper or middle channels. Thetransmembrane currents generating the spontaneous spindle os-cillations were estimated from the LFPg using CSD analysis (seeCSD). We used phase amplitude coupling between spindle oscil-lations and gamma band amplitude to identify the spindle phaserelated to active current sinks, reflecting the increase in firingrelated to excitatory synaptic input (see Phase amplitude cou-pling). The laminar distribution of sources and sinks associatedwith spindles detected in either upper or middle channels, aver-aged across subjects, is shown in Figure 4. To visualize phaseamplitude relationships, spindles were averaged across epochs,time-locked to the largest spindle peak in a reference channelchosen from the upper or middle channels based on having thehighest fraction of spindles detected in that range.
For spindles detected in upper channels only, a positive peakin the LFPg corresponded to a current sink (negative CSD) inupper layers (e.g., 1 or 2/3; Fig. 4A2). For spindles detected inmiddle channels only, a negative peak in the LFPg correspondedto a current sink in upper layers and a current source in deeplayers (Fig. 4B2). For each, around the time of those spindlepeaks, there was an increase in both high gamma power (70 –170Hz; Fig. 4A3,B3) and low gamma power (25–50 Hz; Fig. 4A4,B4).For the upper channel spindles, there is the suggestion of a de-crease in high gamma in lower channels at the time of the upper
channel increase (Fig. 4A3), as has been found in rat medial pre-frontal cortex (Peyrache et al., 2011). The coupling between spin-dle phase and high gamma amplitude, summarized by MI, wassignificantly different from the null (p � 0.05, bootstrap resam-pling) in 4 of the 5 subjects for upper channel spindles and for 3 of5 for middle channel spindles (Table 1). LFPg and CSD patternsfor upper and middle channel spindles varied across subjects butshowed overall consistency in the source/sink patterns (Fig. 5). For 2subjects, there was an additional current source in the uppermostchannels (Fig. 5A, S1 and S3), suggestive of a return current in layerI. Its apparent absence in the other 3 subjects may reflect variation inthe thickness of this layer. Overall, these results suggest that excit-atory input to upper layers can results in at least two different pat-terns of current sinks and sources, manifesting as positive LFPgpeaks in upper channels or negative LFPg peaks in middle channels.
We analyzed the relative timing and phase relationship be-tween upper and middle channels for spindles detected simulta-neously in both. One upper and one middle channel were selectedfor each subject based on maximum fraction of spindles detectedin each range of channels (i.e., 1– 4 and 10 –14). Latencies of the
Figure 4. Laminar sources of spindle oscillations. A1, Group average of waveforms that had been averaged across epochs and individual peaks (bandpass filtered, 10 –16 Hz), time-locked tospindle peaks in the upper channel (channels 1– 4) with the highest spindle rate for each subject. Only above-median upper channel spindle epochs were included. Waveforms are superimposed ona time-amplitude plot of LFPg in the same epochs. Time-amplitude plots from these epochs are also shown for the following: A2, CSD. A3, High gamma (70 –170 Hz) amplitude. A4, Low gamma(25–50 Hz) amplitude. B, The same plots are shown, except in this case averages were made for middle channel spindle epochs time-locked to the middle channel (channels 10 –14) with the highestspindle rate for each subject.
Table 1. Modulation of high gamma by spindle phase: statistical results ofcomparison with the null distribution using bootstrap resamplinga
Upper channel spindles Middle channel spindles
SubjectNo. ofepochs
Normalizedmodulationindex p value
No. ofepochs
Normalizedmodulationindex p value
1 81 2.03 0.0075 175 0.93 0.222 134 5.34 0.0005 93 3.26 0.0013 85 3.85 0.001 246 4.46 0.00054 19 0.37 0.78 80 1.94 0.0515 46 1.67 0.041 139 3.32 0.0015aThe normalized MI is a ratio that compares the calculated MI with the reference distribution calculated under thenull hypothesis of no phase relationship. p values were derived from bootstrap sampling of MI compared with thenull for each of five recordings obtained from 5 different patients. The number of epochs varied across recordings,limited by factors, such as the duration of good quality recording and the respective incidence of spindles in eitherthe upper or middle channels but not both.
Hagler et al. • Intracortical Laminar Spindle Patterns in Humans J. Neurosci., March 21, 2018 • 38(12):3013–3025 • 3019

onset of spindle epochs and peak of spindle-band activity wereestimated from the smoothed, spindle-band amplitude envelope(see Spindle detection). Between-channel onset and peak latencydifferences were averaged over epochs (mean: 243 epochs, SD:113, minimum: 69, maximum: 361). Because onset detectionbased on fixed thresholds could be biased by differences in theamplitudes of the signals, the threshold chosen for each channeland epoch was half of peak spindle amplitude. Based on the Hil-bert transform analytic amplitude (i.e., amplitude envelope),spindle onset and peak latency tended to be delayed in upperchannels (onset latency difference: 29.4 � 10.1 ms SEM, p �0.028, one sample t test; peak latency difference: 18.2 � 5.4 msSEM, p � 0.05, one sample t test) (Fig. 6A).
Phase differences of individual waves between upper and mid-dle channels were derived from Hillbert transforms of spindleband (10 –16 Hz) filtered epochs, averaged across time pointsbetween �200 and 200 ms relative to spindle peak, and averagedacross epochs (see Phase differences between channels). Thegroup average phase lag was not significantly different from zero(p � 0.05, one-sample test for the mean angle, using circ_mtestfrom CircStat Toolbox). The individual subject phase lags weresignificant for four of the 5 subjects (p � 0.05, one-sample test forthe mean angle, using circ_mtest from CircStat Toolbox) (Fig.6B). To examine this relationship, the average of upper layerspindles relative to middle layer (Fig. 6C), their cross-correlation(Fig. 6D), and the time course of their phase lag (Fig. 6E) andphase locking (Fig. 6F), were calculated and plotted for eachsubject across all spindles. Although the patterns varied for un-known reasons, in some subjects, a consistent delay is observedthat varies over the course of the spindle. Varying phase lagscould be indicative of differences in oscillation frequency. Tocorrect for apparent polarity inversion, we added or subtracted ahalf cycle of phase if the phase delay was more than one-fourth
cycle from zero in Figure 6B–E. However, due to intersubjectvariability, it is difficult to draw strong conclusions about thedirectionality of the phase difference between upper and middlechannels.
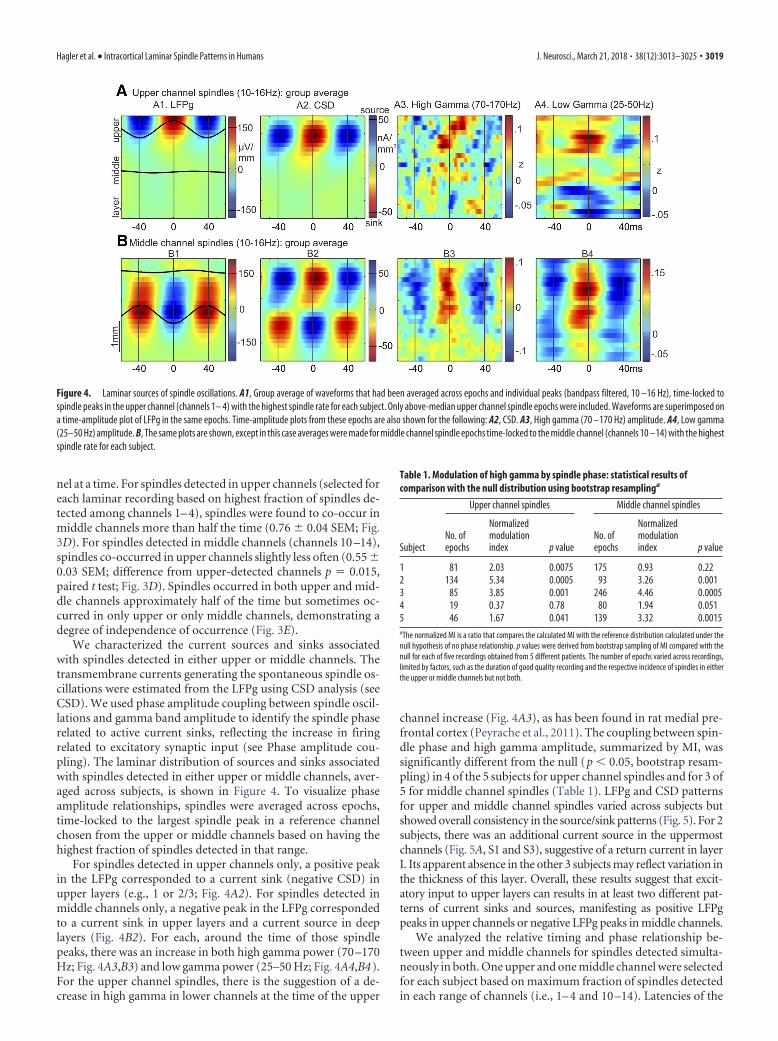
From the group average Fourier spectra, there appears to be aslight decrease in oscillation frequency for upper channel spin-dles (Fig. 7). However, differences between upper and middlechannels in the peak spindle frequency during upper only ormiddle only spindles, respectively, were not significant (uppermean: 13.9 Hz, SD: 1.0, middle mean: 13.0 Hz, SD: 1.5, p � 0.05,paired t test).
To analyze the spatiotemporal variation both across andwithin spindle epochs with a data-driven approach, we used PCAto transform spindle-band activity from the 23 laminar channelsinto temporally uncorrelated components (Fig. 8). Spindle-bandfiltered data from all spindle epochs (excluding “weak” spindles),delimited by estimated spindle onsets and offsets, were concate-nated into one large matrix of channels by time points. The shapeof the scree plot, showing the explained variance for each com-ponent, suggests that a two factor solution is appropriate (Bryantand Yarnold, 1995). The first two principal components (PCs)accounted for approximately half of the explained variance (Fig.8A). The patterns of LFPg and CSD for the first PC (Fig. 8B) wasvery similar to that of spindles time-locked to middle channels(Fig. 4B), and the second PC was very similar to the upper chan-nel spindles (Fig. 4A). These patterns are based on the componentloadings, which were strong and highly similar across subjects forprincipal components 1 and 2, but weak and variable for latercomponents (Fig. 8D). However, it is possible that, with a largerdataset, additional consistent patterns could be identified acrossmultiple subjects. The degree of involvement of the first two PCsvaried independently across epochs, and within epochs in whichboth PCs had strong involvement, the different PCs combined in
Figure 5. Laminar sources of spindle oscillations in individual subjects. A, Individual subject (arranged left to right) waveforms averaged across epochs and individual peaks (bandpass filtered,10 –16 Hz), time-locked to spindle peaks in the upper channel (channels 1– 4) with the highest spindle rate for each subject, with LFPg on top and CSD on bottom (both normalized to respectivemaximum values within each subject). B, Individual subject average waveforms time-locked to the middle channel (channels 10 –14) with the highest spindle rate for each subject.
3020 • J. Neurosci., March 21, 2018 • 38(12):3013–3025 Hagler et al. • Intracortical Laminar Spindle Patterns in Humans

various ways that accounted for the large variation in the dy-namic laminar distribution of individual spindle epochs.
DiscussionIntracortical laminar recordings during sleep allowed us to inves-tigate the distribution of spindle occurrence across cortical layers.We found that spindle amplitudes and the rate of occurrence wasgreatest in middle channels, slightly weaker in upper channels,and greatly reduced in deep channels. Individual laminar record-ings exhibited distinctive patterns of spindle co-occurrence, withspindles sometimes being detectable only in upper or only middlechannels, but often occurring in both, and with spindle onset andpeak latency delayed in upper channels by �20 –50 ms on aver-age. There were slight differences in peak spindle band frequencyfor upper and middle channel spindles, but each was associated
with strong low-frequency (�4 Hz) power in upper channels.Factor analysis (PCA) confirmed the impression of two mainconsistent patterns of CSD. In all subjects, the first and secondprincipal components corresponded to the middle and upperchannel spindles, respectively. These components accounted forapproximately half of the explained variance, with subsequentcomponents inconsistent and accounting for little variance.
These results establish the existence of two main spindle gen-erators. Because spindles are thought to be generated by therhythmic activation of thalamic synapses onto cortical neurons,this implies that two thalamocortical systems are engaged byspindles, with differing laminar distributions of thalamocorticalprojections. It has previously been proposed that spindles can begenerated by either or both of the two major thalamocortical
-200 0 200
-1
-0.5
0
0.5
1
-200 0 2000
0.2
0.4
0.6
0.8
1
-200 0 200 -200 0 200 -200 0 200
-200 0 200 -200 0 200 -200 0 200 -200 0 200ms
&ch
ave
rage
spi
ndle
mid
dle
uppe
r S1 S2 S3 S4 S5
pha
se la
g(m
iddl
eup
per)
pha
se lo
ckin
g(m
iddl
e-up
per)
-1
-0.5
0
0.5
1
-0.2
0.2
&m
iddl
e ch
aut
ocor
rela
tion
mid
dle-
uppe
r cro
ss-c
orre
latio
n
-100
-50
0
50
-0.2
-0.1
0
0.1
0.2
-100
-50
0
50
100
-0.2
-0.1
0
0.1
0.2
A Latency difference: upper channel relative to middle
onsetpeak
groupaverage S1 S3 S4 S5S2
B Phase lag:upper channel relative to middle
phas
e la
g (c
ycle
s)
phasegroup
average S1 S3 S4 S5S2late
ncy
diffe
renc
e (m
s)
cycl
es
C
D
E
F
Figure 6. Spindle timing differences between channels. A, Latency differences between upper and middle channels for spindle epoch onset and peak of spindle-band amplitude envelope,averaged across spindle epochs. Left, Group average. Right, Individual subjects. Error bars indicate 95% CI (1.96 � SEM). B, Phase lag of upper channels relative to middle channels (selected for eachsubject based on spindle rate). C, Normalized spindle waveforms averaged across epochs, time-locked to the middle channel (channels 10 –14) with the highest spindle rate for each subject(arranged left to right). Blue represents middle channel. Red represents upper channel. D, Cross-correlation of selected upper and middle channels for each subject, averaged across epochs. Bluerepresents autocorrelation for middle channel. Red represents cross-correlation between upper and middle channel. E, Phase lag averaged across epochs. F, Phase locking. B–E, The upper layerspindles in Subjects 2, 3, and 5 were inverted before plotting because their responses were �0.25 cycle displaced from the middle layer spindles, suggesting phase wrapping (see Materials andMethods).
Hagler et al. • Intracortical Laminar Spindle Patterns in Humans J. Neurosci., March 21, 2018 • 38(12):3013–3025 • 3021
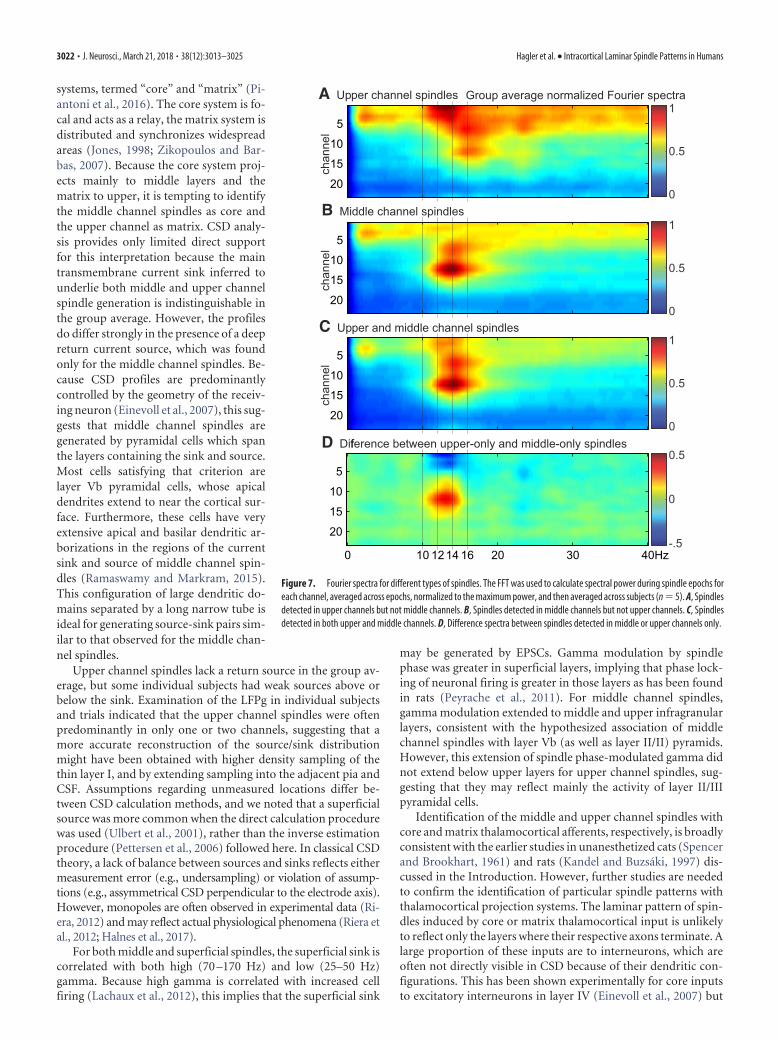
systems, termed “core” and “matrix” (Pi-antoni et al., 2016). The core system is fo-cal and acts as a relay, the matrix system isdistributed and synchronizes widespreadareas (Jones, 1998; Zikopoulos and Bar-bas, 2007). Because the core system proj-ects mainly to middle layers and thematrix to upper, it is tempting to identifythe middle channel spindles as core andthe upper channel as matrix. CSD analy-sis provides only limited direct supportfor this interpretation because the maintransmembrane current sink inferred tounderlie both middle and upper channelspindle generation is indistinguishable inthe group average. However, the profilesdo differ strongly in the presence of a deepreturn current source, which was foundonly for the middle channel spindles. Be-cause CSD profiles are predominantlycontrolled by the geometry of the receiv-ing neuron (Einevoll et al., 2007), this sug-gests that middle channel spindles aregenerated by pyramidal cells which spanthe layers containing the sink and source.Most cells satisfying that criterion arelayer Vb pyramidal cells, whose apicaldendrites extend to near the cortical sur-face. Furthermore, these cells have veryextensive apical and basilar dendritic ar-borizations in the regions of the currentsink and source of middle channel spin-dles (Ramaswamy and Markram, 2015).This configuration of large dendritic do-mains separated by a long narrow tube isideal for generating source-sink pairs sim-ilar to that observed for the middle chan-nel spindles.
Upper channel spindles lack a return source in the group av-erage, but some individual subjects had weak sources above orbelow the sink. Examination of the LFPg in individual subjectsand trials indicated that the upper channel spindles were oftenpredominantly in only one or two channels, suggesting that amore accurate reconstruction of the source/sink distributionmight have been obtained with higher density sampling of thethin layer I, and by extending sampling into the adjacent pia andCSF. Assumptions regarding unmeasured locations differ be-tween CSD calculation methods, and we noted that a superficialsource was more common when the direct calculation procedurewas used (Ulbert et al., 2001), rather than the inverse estimationprocedure (Pettersen et al., 2006) followed here. In classical CSDtheory, a lack of balance between sources and sinks reflects eithermeasurement error (e.g., undersampling) or violation of assump-tions (e.g., assymmetrical CSD perpendicular to the electrode axis).However, monopoles are often observed in experimental data (Ri-era, 2012) and may reflect actual physiological phenomena (Riera etal., 2012; Halnes et al., 2017).
For both middle and superficial spindles, the superficial sink iscorrelated with both high (70 –170 Hz) and low (25–50 Hz)gamma. Because high gamma is correlated with increased cellfiring (Lachaux et al., 2012), this implies that the superficial sink
may be generated by EPSCs. Gamma modulation by spindlephase was greater in superficial layers, implying that phase lock-ing of neuronal firing is greater in those layers as has been foundin rats (Peyrache et al., 2011). For middle channel spindles,gamma modulation extended to middle and upper infragranularlayers, consistent with the hypothesized association of middlechannel spindles with layer Vb (as well as layer II/II) pyramids.However, this extension of spindle phase-modulated gamma didnot extend below upper layers for upper channel spindles, sug-gesting that they may reflect mainly the activity of layer II/IIIpyramidal cells.
Identification of the middle and upper channel spindles withcore and matrix thalamocortical afferents, respectively, is broadlyconsistent with the earlier studies in unanesthetized cats (Spencerand Brookhart, 1961) and rats (Kandel and Buzsaki, 1997) dis-cussed in the Introduction. However, further studies are neededto confirm the identification of particular spindle patterns withthalamocortical projection systems. The laminar pattern of spin-dles induced by core or matrix thalamocortical input is unlikelyto reflect only the layers where their respective axons terminate. Alarge proportion of these inputs are to interneurons, which areoften not directly visible in CSD because of their dendritic con-figurations. This has been shown experimentally for core inputsto excitatory interneurons in layer IV (Einevoll et al., 2007) but
0 10 20 30 40
5
10
15
20
0 10 20 30 40
5
10
15
20
0 10 20 30 40Hz
5
10
15
20
0
0.5
0
0.5
0
0.5
A Upper channel spindles
chan
nel
chan
nel
B Middle channel spindles
C Upper and middle channel spindlesch
anne
l
Group average normalized Fourier spectra
1214 16
5
10
15
20
D Difference between upper-only and middle-only spindles
0
-.5
0.5
Figure 7. Fourier spectra for different types of spindles. The FFT was used to calculate spectral power during spindle epochs foreach channel, averaged across epochs, normalized to the maximum power, and then averaged across subjects (n � 5). A, Spindlesdetected in upper channels but not middle channels. B, Spindles detected in middle channels but not upper channels. C, Spindlesdetected in both upper and middle channels. D, Difference spectra between spindles detected in middle or upper channels only.
3022 • J. Neurosci., March 21, 2018 • 38(12):3013–3025 Hagler et al. • Intracortical Laminar Spindle Patterns in Humans

would apply equally to matrix inputs to inhibitory interneuronsin superficial layers, which include interneurons that stronglyinhibit other interneurons (Cruikshank et al., 2012; Lee et al.,2015). In addition, the same voltage-gated H and T currents thatunderlie spindle generation in the thalamus are present in highlevels in layer Vb and other cortical pyramidal cells (Ramaswamyand Markram, 2015). These and other currents result in intrinsicoscillations which can resonate with external inputs and localcircuits to produce spindle-range frequencies (Silva et al., 1991).Thus, pending further clarification from experimental and mod-eling studies, the identification of middle and upper channelspindles with core and matrix systems must remain tentative.
Spindles have also been dichotomized into to slow versus fast,in both humans and rodents. The dichotomy in rodents is clear,with slow spindles much lower frequency (centered at �8 vs �14Hz), higher amplitude, and often epileptiform in nature (Polackand Charpier, 2006; Johnson et al., 2010). The dichotomy inhumans may be less clear. Spindles are on average �1 Hz slowerover frontal cortex, in EEG, MEG (Dehghani et al., 2011b), andintracranial recordings (Andrillon et al., 2011; Piantoni et al.,2017). The individual waves in spindles also vary in frequency,with later waves also �1 Hz slower on average (Dehghani et al.,
2011b). However, using the usual 12 Hz boundary between fastand slow spindle waves, most cortical locations, and most spindlebursts, include both. The strongest dichotomy between slow andfast EEG spindles in humans is that slow spindles are reported toprecede downstates, whereas fast follow (Molle et al., 2011).However, this has not been confirmed in SEEG where both fastand slow spindles clearly follow downstates (Mak-McCully et al.,2017). In our laminar recordings, upper channel spindles wereslightly slower than middle, but their average frequency did notdiffer significantly, with both upper and middle spindles, includ-ing both slow and fast spindle waves, in a continuum rather thana dichotomy. It would appear that both correspond to fast spin-dles in rodents, which are those associated with memory replayand consolidation (Eschenko et al., 2006; Johnson et al., 2010).
In addition to their overlap in the frequency domain, middleand upper channel spindles were closely intertwined in both lo-cation and time. Individual spindles could be mostly middle ormostly upper, but half or more had at least some involvement ofboth. Although on average middle spindles slightly led upper, thisvaried greatly across spindle epochs. Relative phase between mid-dle and upper spindles was non-zero for most subjects but withthe direction varying across subjects. Assuming that the middle
5
10
15
20
5
10
15
20
sC
Pslennahc
PCs
B Group average LFPg and CSD
C Example spindles: LFPg and component scores
PC1
PC2
-40 0 40 -40 0 40ms
noitcarf ecnairav denialpxe
200ms
1
2
LFPg CSD
.4
.3
.2
.1
0 1 2 3 4 5
5101520
1
-1
slennahc
A Explained varianceby PCA components
All panels z-score
1 2 3 4 5PC component
S1
S2
S3
S4
S5
D Individual subjectcomponent loadings
lennahc
1
23
1
23
1
23
Figure 8. PCA. A, Fractional explained variance. Circles represent the group average. Error bars indicate 95% CI. Lines indicate the explained variance curves for each subject. B, Group average,normalized LFPg and CSD for first two principal components. Component time courses were multiplied by the channel weights and then averaged across spindle epochs and then across subjects. LFPgand CSD profiles of components 1 and 2 are similar to those found for middle and upper spindles, respectively (see Fig. 4). C, Example spindle waveforms (bandpass filtered, 10 –16 Hz) from onesubject (S3) with the corresponding time courses for PC1 and PC2 on bottom. Red represents sinks (CSD), surface positive (LFPg), or positive PC scores. D, Individual subject component loadings showvery similar channel profiles across subjects for components 1 and 2 but are weak and irregular for later components. Polarity (red or blue) is arbitrary, so component 2 in Subject 1 is actually similarto other subjects.
Hagler et al. • Intracortical Laminar Spindle Patterns in Humans J. Neurosci., March 21, 2018 • 38(12):3013–3025 • 3023

channel spindles are core and the upper channel spindles arematrix, then the strong, punctate connections of the core systemmay support the development of oscillations within a limitedthalamocortical domain, whereas the more diffuse matrix projec-tions may have a modulatory role, perhaps spreading and syn-chronizing these oscillations between domains. The contributionof both core and matrix afferents in the generation of spindleswould thus explain the mixture of focal and distributed spindlesobserved previously with intracranial recordings (Andrillon etal., 2011; Piantoni et al., 2017), and with MEG versus scalp EEG(Dehghani et al., 2010, 2011a).
In conclusion, there are at least two spindle generators withdiffering laminar profiles of LFPs and gamma activation. Onepattern activated mainly upper layers, the other both middle andupper layers, consistent with possible generation by the core andmatrix thalamocortical systems. Across individual spindles, thegenerator patterns could occur in isolation but commonly co-occurred in various patterns. Functionally, the loose coupling ofcortical spindle generators may provide a mechanism wherebyspindles can integrate replay of the more focal bottom-up anddistributed top-down aspects of memory (Eschenko et al., 2006;Johnson et al., 2010), leading to consolidation of coherent mem-ories (Larkum, 2013) and global cognitive integration (Manoachet al., 2016).
ReferencesAndrillon T, Nir Y, Staba RJ, Ferrarelli F, Cirelli C, Tononi G, Fried I (2011)
Sleep spindles in humans: insights from intracranial EEG and unit record-ings. J Neurosci 31:17821–17834. CrossRef Medline
Berens P (2009) CircStat: a MATLAB toolbox for circular statistics. J StatSoftw 31:1–21.
Bonjean M, Baker T, Bazhenov M, Cash S, Halgren E, Sejnowski T (2012)Interactions between core and matrix thalamocortical projections in hu-man sleep spindle synchronization. J Neurosci 32:5250 –5263. CrossRefMedline
Bryant FB, Yarnold PR (1995) Principal-components analysis and explor-atory and confirmatory factor analysis. In: Reading and understandingmultivariate statistics (Grimm LG, Yarnold PR, eds), pp 99 –136 Wash-ington, DC: American Psychological Association.
Cash SS, Halgren E, Dehghani N, Rossetti AO, Thesen T, Wang C, DevinskyO, Kuzniecky R, Doyle W, Madsen JR, Bromfield E, Eross L, Halasz P,Karmos G, Csercsa R, Wittner L, Ulbert I (2009) The human K-complexrepresents an isolated cortical down-state. Science 324:1084 –1087.CrossRef Medline
Contreras D, Destexhe A, Sejnowski TJ, Steriade M (1996) Control of spa-tiotemporal coherence of a thalamic oscillation by corticothalamic feed-back. Science 274:771–774. CrossRef Medline
Cruikshank SJ, Ahmed OJ, Stevens TR, Patrick SL, Gonzalez AN, Elmaleh M,Connors BW (2012) Thalamic control of layer 1 circuits in prefrontalcortex. J Neurosci 32:17813–17823. CrossRef Medline
Csercsa R, Dombovari B, Fabo D, Wittner L, Eross L, Entz L, Solyom A,Rasonyi G, Szucs A, Kelemen A, Jakus R, Juhos V, Grand L, Magony A,Halasz P, Freund TF, Magloczky Z, Cash SS, Papp L, Karmos G, et al.(2010) Laminar analysis of slow wave activity in humans. Brain 133:2814 –2829. CrossRef Medline
Dehghani N, Cash SS, Rossetti AO, Chen CC, Halgren E (2010) Magneto-encephalography demonstrates multiple asynchronous generators duringhuman sleep spindles. J Neurophysiol 104:179 –188. CrossRef Medline
Dehghani N, Cash SS, Halgren E (2011a) Emergence of synchronous EEGspindles from asynchronous MEG spindles. Hum Brain Mapp 32:2217–2227. CrossRef Medline
Dehghani N, Cash SS, Halgren E (2011b) Topographical frequency dynam-ics within EEG and MEG sleep spindles. Clin Neurophysiol 122:229 –235.CrossRef Medline
Dempsey EW, Morison RS (1941) The interaction of certain spontaneousand induced cortical potentials. American Journal of Physiology-LegacyContent 135: 301–308. CrossRef
Efron B (1981) Nonparametric estimates of standard error: the jackknife,the bootstrap and other methods. Biometrika 68:589 –599. CrossRef
Einevoll GT, Pettersen KH, Devor A, Ulbert I, Halgren E, Dale AM (2007)Laminar population analysis: estimating firing rates and evoked synapticactivity from multielectrode recordings in rat barrel cortex. J Neuro-physiol 97:2174 –2190. CrossRef Medline
Eschenko O, Molle M, Born J, Sara SJ (2006) Elevated sleep spindle densityafter learning or after retrieval in rats. J Neurosci 26:12914 –12920.CrossRef Medline
Halnes G, Maki-Marttunen T, Pettersen KH, Andreassen OA, Einevoll GT(2017) Ion diffusion may introduce spurious current sources in current-source density (CSD) analysis. J Neurophysiol 118:114 –120. CrossRefMedline
Harris FJ (1978) On the use of windows for harmonic analysis with thediscrete Fourier transform. Proc IEEE 66:51– 83. CrossRef
Hutsler JJ, Lee DG, Porter KK (2005) Comparative analysis of cortical lay-ering and supragranular layer enlargement in rodent carnivore and pri-mate species. Brain Res 1052:71– 81. CrossRef Medline
Johnson LA, Euston DR, Tatsuno M, McNaughton BL (2010) Stored-tracereactivation in rat prefrontal cortex is correlated with down-to-up statefluctuation density. J Neurosci 30:2650 –2661. CrossRef Medline
Jones EG (1998) Viewpoint: the core and matrix of thalamic organization.Neuroscience 85:331–345. CrossRef Medline
Kajikawa Y, Schroeder CE (2011) How local is the local field potential? Neu-ron 72:847– 858. CrossRef Medline
Kandel A, Buzsaki G (1997) Cellular-synaptic generation of sleep spindles,spike-and-wave discharges, and evoked thalamocortical responses in theneocortex of the rat. J Neurosci 17:6783– 6797. Medline
Lachaux JP, Axmacher N, Mormann F, Halgren E, Crone NE (2012) High-frequency neural activity and human cognition: past, present and possiblefuture of intracranial EEG research. Prog Neurobiol 98:279 –301.CrossRef Medline
Larkum M (2013) A cellular mechanism for cortical associations: an orga-nizing principle for the cerebral cortex. Trends Neurosci 36:141–151.CrossRef Medline
Lee AJ, Wang G, Jiang X, Johnson SM, Hoang ET, Lante F, Stornetta RL,Beenhakker MP, Shen Y, Julius Zhu JJ (2015) Canonical organization oflayer 1 neuron-led cortical inhibitory and disinhibitory interneuronalcircuits. Cereb Cortex 25:2114 –2126. CrossRef Medline
Li CL, Cullen C, Jasper HH (1956) Laminar microelectrode analysis of cor-tical unspecific recruiting responses and spontaneous rhythms. J Neuro-physiol 19:131–143. CrossRef Medline
Loomis AL, Harvey EN, Hobart G (1935) Potential rhythms of cerebral cor-tex during sleep. Science 81:597–598. CrossRef Medline
Luthi A (2014) Sleep spindles: where they come from, what they do. Neu-roscientist 20:243–256. CrossRef Medline
Mak-McCully RA, Rolland M, Sargsyan A, Gonzalez C, Magnin M, ChauvelP, Rey M, Bastuji H, Halgren E (2017) Coordination of cortical andthalamic activity during non-REM human sleep. Nat Commun 8:15499.CrossRef Medline
Manoach DS, Pan JQ, Purcell SM, Stickgold R (2016) Reduced sleep spin-dles in schizophrenia: a treatable endophenotype that links risk genes toimpaired cognition? Biol Psychiatry 80:599 – 608. CrossRef Medline
McCormick DA, Bal T (1997) Sleep and arousal: thalamocortical mecha-nisms. Annu Rev Neurosci 20:185–215. CrossRef Medline
Mednick SC, McDevitt EA, Walsh JK, Wamsley E, Paulus M, Kanady JC,Drummond SP (2013) The critical role of sleep spindles inhippocampal-dependent memory: a pharmacology study. J Neurosci 33:4494 – 4504. CrossRef Medline
Molle M, Bergmann TO, Marshall L, Born J (2011) Fast and slow spindlesduring the sleep slow oscillation: disparate coalescence and engagementin memory processing. Sleep 34:1411–1421. CrossRef Medline
Nicholson C, Freeman JA (1975) Theory of current source density analysisand determination of the conductivity tensor for anuran cerebellum.J Neurophysiol 38:356 –368. CrossRef Medline
Pettersen KH, Devor A, Ulbert I, Dale AM, Einevoll GT (2006) Current-source density estimation based on inversion of electrostatic forward so-lution: effects of finite extent of neuronal activity and conductivitydiscontinuities. J Neurosci Methods 154:116 –133. CrossRef Medline
Peyrache A, Battaglia FP, Destexhe A (2011) Inhibition recruitment in pre-frontal cortex during sleep spindles and gating of hippocampal inputs.Proc Natl Acad Sci U S A 108:17207–17212. CrossRef Medline
Piantoni G, Halgren E, Cash SS (2016) The contribution of thalamocortical
3024 • J. Neurosci., March 21, 2018 • 38(12):3013–3025 Hagler et al. • Intracortical Laminar Spindle Patterns in Humans

core and matrix pathways to sleep spindles. Neural Plast 2016:3024342.CrossRef Medline
Piantoni G, Halgren E, Cash SS (2017) Spatiotemporal characteristics ofsleep spindles depend on cortical location. Neuroimage 146:236 –245.CrossRef Medline
Polack PO, Charpier S (2006) Intracellular activity of cortical and thalamicneurones during high-voltage rhythmic spike discharge in Long–Evansrats in vivo. J Physiol 571:461– 476. CrossRef Medline
Ramaswamy S, Markram H (2015) Anatomy and physiology of the thick-tuftedlayer 5 pyramidal neuron. Front Cell Neurosci 9:233. CrossRef Medline
Rasch B, Born J (2013) About sleep’s role in memory. Physiol Rev 93:681–766. CrossRef Medline
Riera JJ, Ogawa T, Goto T, Sumiyoshi A, Nonaka H, Evans A, Miyakawa H,Kawashima R (2012) Pitfalls in the dipolar model for the neocorticalEEG sources. J Neurophysiol 108:956 –975. CrossRef Medline
Silber MH, Ancoli-Israel S, Bonnet MH, Chokroverty S, Grigg-DambergerMM, Hirshkowitz M, Kapen S, Keenan SA, Kryger MH, Penzel T, Press-man MR, Iber C (2007) The visual scoring of sleep in adults. J Clin SleepMed 3:121–131. Medline
Silva LR, Amitai Y, Connors BW (1991) Intrinsic oscillations of neocortexgenerated by layer 5 pyramidal neurons. Science 251:432– 435. CrossRefMedline
Spencer WA, Brookhart JM (1961) A study of spontaneous spindle waves insensorimotor cortex of cat. J Neurophysiol 24:50 – 65. CrossRef
Ulbert I, Halgren E, Heit G, Karmos G (2001) Multiple microelectrode:recording system for human intracortical applications. J Neurosci Meth-ods 106:69 –79. CrossRef Medline
Zikopoulos B, Barbas H (2007) Parallel driving and modulatory pathwayslink the prefrontal cortex and thalamus. PLoS One 2:e848. CrossRefMedline
Hagler et al. • Intracortical Laminar Spindle Patterns in Humans J. Neurosci., March 21, 2018 • 38(12):3013–3025 • 3025