Embed Size (px)
Citation preview

Hevylite: New strategies for Diagnosis, Monitoring and Prognosis of monoclonal gammopathies
AR Bradwell.
University of Birmingham and Binding Site Ltd

How good are tests for monoclonal monoclonal proteins? FLC Igs 1. Diagnosis – sensitive and specific + + 2. Monitoring – reproducible + +/- 3. Prognostic + -

Diagnosis

0.1
1
10
100
1000
10000
100000
0.1 1 10 100 1000 10000 100000
Seru
m L
ambd
a FL
C (m
g/L)
Serum Kappa FLC (mg/L)
Normals
Kappa Light Chain Myeloma
Lambda Light Chain Myeloma
Non Secretory Myeloma
Intact Immunoglobulin Myeloma
AL Amyloidosis
CKD1
CKD2
CKD3
CKD4
CKD5

Problems with IgG, IgA and IgM assays
1. There is no Igκ/Igλ ratio 2. Nephelometry measures the total
immunoglobulin but the patient is Ig’κ or Ig’λ

SPE Analysis of MRC MM VII Presentation Samples

Problems with IgG, IgA and IgM assays
1. There is no Igκ/Igλ ratio 2. Nephelometry measures the total
immunoglobulin but the patient is Ig’κ or Ig’λ 3. Scanning densitometry is not accurate 4. IgA bands may be hidden with transferrin
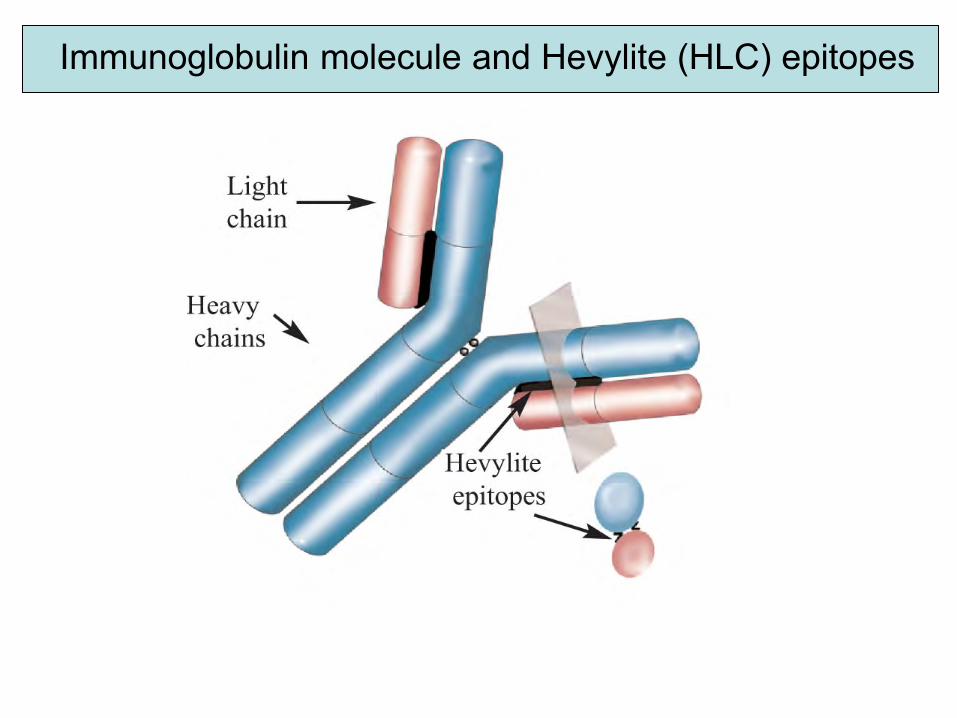
Immunoglobulin molecule and Hevylite (HLC) epitopes

Different heavy chain/light chain immunoglobulins
IgGκ IgGλ IgAκ IgAλ
IgMκ IgMλ

IgA Multiple Myeloma

Monitoring

Problems with IgG, IgA and IgM assays
1. There is no Igκ/Igλ ratio 2. Nephelometry measures the total
immunoglobulin but the patient is Ig’κ or Ig’λ 3. Scanning densitometry is not accurate 4. IgA bands may be hidden with transferrin 5. Haematocrit and plasma volume changes
affect immunoglobulin measurements

IgGκ - 50g/L
Ig’κ/Ig’λ
= 3/1
Ig’κ/Ig’λ = 3/1
Plus anaemia
IgGκ - 20g/L
Ig’κ/Ig’λ = 3/1
Plasma volume
IgGκ - 30g/L
Effect of volume changes on Ig’ measurements
Ig’κ/Ig’λ = 3/1
Ig’κ/Ig’λ = 3/1
Ig’κ/Ig’λ = 3/1
IgGκ- 50g/L
IgGκ- 30g/L
IgGκ- 20g/L

Alexanian. Blood 1977 49: 301-307
Relationship of monoclonal immunoglobulin changes to plasma volume and haematocrit
IgG
IgA
IgM

Problems with IgG, IgA and IgM assays
1. There is no Igκ/Igλ ratio 2. Nephelometry measures the total
immunoglobulin but the patient is Ig’κ or Ig’λ 3. Scanning densitometry is not accurate 4. IgA bands may be hidden with transferrin 5. Haematocrit and plasma volume changes
affect immunoglobulin measurements 6. IgG metabolism is variable

IgG metabolism is controlled by cellular recycling receptors


IgG FcRn receptors are saturated at normal IgG concentrations


Relationship between immunoglobulin concentrations and serum half-life

Hence, % changes in IgG measurements depend upon the initial concentrations For example:- A patient with 100g/L of IgG and 100% tumour kill by chemo- therapy has an 80% fall of IgG in 15 days (100 to 20g/L) A patient with 10g/L of IgG and 100% tumour kill by chemo-therapy has only a 20% fall of IgG in 15 days (10 to 8g/L) Thus, comparison of reductions in IgG concentrations in patients is not reliable What does a partial response really mean?

What does a partial response really mean?
IgG normal range
IgGλ / IgGκ normal range
Cyclophosphamide
IFE / SPE Negative
CVAMP
2nd Response
Monoclonal protein absent by densitometry
No change in HLC ratio indicating no selective tumour killing
Greater HLC ratio fall
Greater HLC ratio increase
remission
relapse
Bradwell et al. Clin Chem 2009
IgG
HLC
SPE
SPE

Prognosis

Problems with IgG, IgA and IgM assays
1. There is no Igκ/Igλ ratio 2. Nephelometry measures the total immunoglobulin but the patient is Ig’κ or Ig’λ 3. Scanning densitometry is not accurate 4. IgA bands may be hidden with transferrin 5. Haematocrit and plasma volume changes affect Immunoglobulin measurements 6. IgG metabolism is variable 7. Monoclonal IgG, IgA and IgM measurements have no prognostic value and are not in any guidelines

Monoclonal immunoglobulin concentrations
p=0.1
338 IFM patients
Hevylite ratios - 0.01>HLCr>200
338 IFM patients
p=0.0005
Un-involved immunoglobulins
338 IFM patients
p=0.002

Covariates Univariate Analysis
Multivariate Analysis (n=242)
Del_13 0.03* (n=283) 0.546 T4_14 0.05* (n=252) 0.515
Del_17p 0.08 (n=277) 0.457 β2M>5.5mg/L 0.51 (n=308) 0.407 β2M>3.5mg/L 0.001* (n=308) 0.045*
Albumin<35g/L 0.153 (n=302) 0.828 FLC Tertiles 0.589 (n=307) 0.689
Monoclonal Tertiles** 0.16 (n=300) 0.748 200<HLC<0.01 0.017* (n=308) 0.001*
* p<0.05 is considered significant **SPE densitometry measurement
Comparison of prognostic factors in MM

Conclusions for Hevylite 1. Diagnosis: More sensitive than SPE and IFE in patients at presentation and with residual disease 2. Monitoring: Provides more accurate quantitation than SPE and IFE, particularly at low concentrations 3. Prognosis: Better than current markers

Acknowledgements J Katzmann, RA Kyle, Mayo Clinic. Herve Avet-Loiseau , Ladan Mirbahai, Jean-Luc Harousseau, IFM, France C Hutchison, P Cockwell, Birmingham University, UK S Harding, H Carr-Smith, G Mead, P Showell, J Overton and others at The Binding Site


What makes a good cancer test? 1. Diagnosis – sensitive and specific 2. Monitoring – quantitative and reproducible 3. Prognostic

sFLCs at myeloma presentation are prognostic

ISS for progression in 338 IFM patients
p=0.023
0
1 2
p=0.000013
β2m+albumin
β2m+hevylite ratio