Embed Size (px)
DESCRIPTION
Human factors engineering
Citation preview

10/1/2013
1
Human Factors Engineering
Dr. Osama Al Meanazel
Lecture 4
(Deigning Visual Displays)
September 26, 2013
“The Efficacy of a Medical Virtual Reality Simulator for Training Phlebotomy” by Mark W. Scerbo, James P. Bliss, Elizabeth A. Schmidt, and Sommer N. Thompson
Objective: The present study compared the effectiveness of a virtual reality (VR) simulator for training phlebotomy with that of a more traditional approach using simulated limbs. Background: Phlebotomy, or drawing blood, is one of the most common medical procedures; yet, there are no universal standards for training and assessing performance. The absence of any standards can lead to injuries and inaccurate test results if the procedure is improperly performed. Method: Twenty 3rd-year medical students were trained under one of the two methods and had their performance assessed with a 28-item checklist. Results: The results showed that performance improvements were limited to those who trained with the simulated limbs, and a detailed comparison of the two systems revealed several functional and physical differences that may explain these findings. Conclusion: Participants trained with simulated limbs performed better than those trained with a VR simulator; however, the metrics recorded by the VR system may address some aspects of performance that could eventually prove beneficial. Application: The present study highlights the potential for medical simulators to improve patient safety by enabling trainees to practice procedures on devices instead of patients. Applications of this research include training, performance assessment, and design of simulator systems.

10/1/2013
2
“+3Gz Acceleration loss of consciousness: Tie course of performance deficits with repeated experience” by Lioyd D. Trip et al.
Objectives: We examine the time course of performance recovery from gravity induced loss of consciousness
(GLOC) and evaluate the utility of exposing participants to repeated bouts of GLOC in promoting recovery time.
Background: A substantial number of accidents among fighter pilots have resulted from episodes of GLOC. U.S. Air
Force doctrine holds that when pilots experience GLOC, impairment lasts for 24 s, in which there are 12 s of
complete unconsciousness and 12 s of confusion. However, there is reason to suspect that performance efficiency
associated with GLOC is degraded well before unconsciousness sets in and that more than 24 s are required for
performance efficiency to return to baseline levels. Additionally, there is a belief that repeated exposure to GLOC will
reduce recovery time. Method: Centrifuge simulators were used to induce GLOC in U.S. Air Force personnel with
math and tracking tasks employed to emulate flight performance. Participants were tested once per week for 4
consecutive weeks. Results: On average, performance deficits appeared 7.44 s prior to the onset of unconsciousness
and persisted for 55.6 s following the GLOC event. Repeated exposure failed to moderate these results. Conclusion:
The temporal course of performance deficits produced by GLOC far exceeds prior estimates. The problem is more
serious than previously envisioned and it is not alleviated by repeated exposure to GLOC. Application: U.S. Air
Force doctrine regarding the severity of GLOC and the utility of repeated exposure to this problem needs to be
revised and these data incorporated into future aircraft auto recovery systems.
Research Settings
(1) Whether it is a descriptive study, experimental research, or evaluation research?
(2) Whether it was conducted in a laboratory, field, or using simulation?
(3) Who the subjects were and how many were used?
(4) What the variables were?
(5) What type of criterion measures were used?
(6) What statistical analyses were conducted.

10/1/2013
3
Classifications of Visual Displays Information
Static visual displays information • Traffic signs, warning signs, direction signs … etc
Dynamic visual displays information • Speedometer, pressure gauges, thermometer … etc
They Eye
1. Cornea
2. Pupil
3. Lens
4. Retina

10/1/2013
4
How we see?
1. Light enter the eye
2. Reflected by the cornea and the lens
3. Focus on the retina (Contains two types of receptors rods and cones)
• Rods: Function at low levels of light and can distinguish only between shades of black and
white, not evenly distributed
• Cones: Function at high levels of light and can differentiate between colors, concentrated
at the center
4. Curvature of the lens increases by contraction of the muscles surrounding the
lens
Retina Adaptation
Adaptation is the change in sensitivity to light (Light Dark)
Sensitivity of the visual system increases in the dark (we can see dimmer and dimmer objects)
Two stages to dark adaptation: • Stage 1: Cones adaptation (takes 5 min)
• Stage 2: Rods adaptation (takes 30-35 min)
Dark to light adaptation takes place very fast within a matter of minutes.

10/1/2013
5
Color Discrimination and Reading
Color Discrimination • People with normal vision: trichromats
• People with complete lack of color vision: monochromats
Most people are color deficient due to red or green receptors.
Reading • Reading goes beyond acuity and letter recognition.
• It involves eye movements which consists of fast jerky movements (saccades) and stationary periods (fixations).
• Information is absorbed during fixations.
Visual Capabilities
Accommodation: the ability of the lens to focus the light rays on the retina. • Near point: closest point to which the eyes can focus
• Far point: farthest point beyond which the eyes can not focus (infinity)
Focal points and distances are expressed in diopters (D).
Near Sightedness (Myopia): People can not see distant objects, their far point is too close.
For sightedness (Hypermania): People can not see near objects, their near point is far away.

10/1/2013
6
Visual Acuity
Visual Acuity is the ability to discriminate fine detail and depends on the accommodation of eyes.
Most commonly used measure of visual acuity : minimum separable acuity • Refers to the smallest space between the parts of the target that the eye can detect.
Visual Angle and 20/20 Vision
Visual Angle (minutes) = 3438 * H / D
‘Normal’ acuity is usually taken as 1.0 (VA = 1 min)
A person with 20/20 vision (on Snellen acuity) is assumed to be of the ability to resolve a target of 1 min of arc at 20 ft

10/1/2013
7
Snellen Acuity
Photometry: Basic Concepts
Source
Reflective surface
Observer
Luminous flux
- lumens
Illuminance
- lux
- foot-candles
Luminance
- foot-lamberts
- milli-Lamberts

10/1/2013
8
Common Definition
Light intensity: the amount of light given off by a source. It is measured in candelas and lumens (4π lumens = 1 candela)
Illumination level: the amount of light falling on a surface area measured in foot-candles (fc) or lux (lumen/m2) • 1 lux = 10.76 fc
Luminance: measure of light reflecting from a surface. The units for luminance are foot-lamberts or candela/m2
Reflectance: the ratio of luminance to illumination. • Black surfaces has Zero reflectance • White surfaces has One reflectance
Factors affecting Visual Acuity
1. Luminance level: Visual acuity improves with increasing levels of light or background luminance and then levels off. At high levels of illumination “cones“ are activated
2. Contrast: Improved contrast increases discriminability. • Luminous Contrast = (Lmax - Lmin ) / Lmax • Contrast (or luminance) ratio = Lmax / Lmin
3. Target Motion: Movement of the target or the observer decreases visual acuity • Static acuity: When both target and observer are stationary • Dynamic acuity: When either one of them is moving
4. Age: Visual Acuity declines with age (after 40)
5. Training: Training does improve visual acuity

10/1/2013
9
Text: Hardcopy
Important things to be considered when Presenting Alphanumeric Text (Hardcopy)
• Visibility: Quality of characters / symbol that makes it visible from its
surroundings (detectability)
• Legibility: Attribute of alphanumeric characters that makes each one of them identifiable from others (discriminability)
• Readability: A quality that makes possible the recognition of the informational content when it is presented in groups
Typography and Stroke Width-Height
Typography: refers to the form / features of the characters Example: using the times roman font over script font is preferred during
• unfavorable viewing conditions
• critical information is to be displayed
• large viewing distance
• people have poor vision
Stroke Width – Height: refers to ratio of the thickness of the stroke to the height of the letter.

10/1/2013
10
Stroke Width
Black letter on white background – preferred
White letters on black background – irradiation (letters appear to speared)
Black on white letters should be thicker than white on black
Width-to-Height Ratio
Thickness (stroke width-Height Ratio) Black on White – 1:6 to 1:8 White on Black – 1:8 to 1:10 Luminous letters – 1:12 to 1:20
Width-to-Height Ration • The relationship between the width and the height of the alphanumeric character
is referred to as the width-height ration • Most commonly used ration is 3:5
Styles of Type • There are thousands of typefaces/fonts. The most commonly used font is the
Roman. Other types are Gothic, script and Block-Letter

10/1/2013
11
Stroke Width-to-Height Ratio
Size
Size of Alphanumeric Characters
The size of the letter is measured in points. • One point (pt) = 0.25 mm.
Most commonly used font size for close reading varies 9 pt - 12 pt
What would be the visual angle in minutes subtended by a letter of size 10 pt at the eye when viewing it from 50 cm? 10 pt = 10 * 0.25 = 2.5 mm H = 2.5 mm; D = 500 mm; VA = 3438 * H/D = 3438 * 2.5 / 500 = 17.19 minutes

10/1/2013
12
Distance Reading
In order that the legibility of characters is retained as we move away from it, it is necessary to increase the size of the characters so that they subtend the same visual angle
NBS formula for stroke width of letters WS= 1.45 * S * d * 10-5 HL = WS / R WS : Stroke Width S : Denominator of snellen acuity score (Snellen acuity = 20/20, S=20) D : Reading distance HL : Letter height R : stroke width-to-height ratio of the font expressed in decimal proportion (R= 0.20 for a ratio of 1:5)
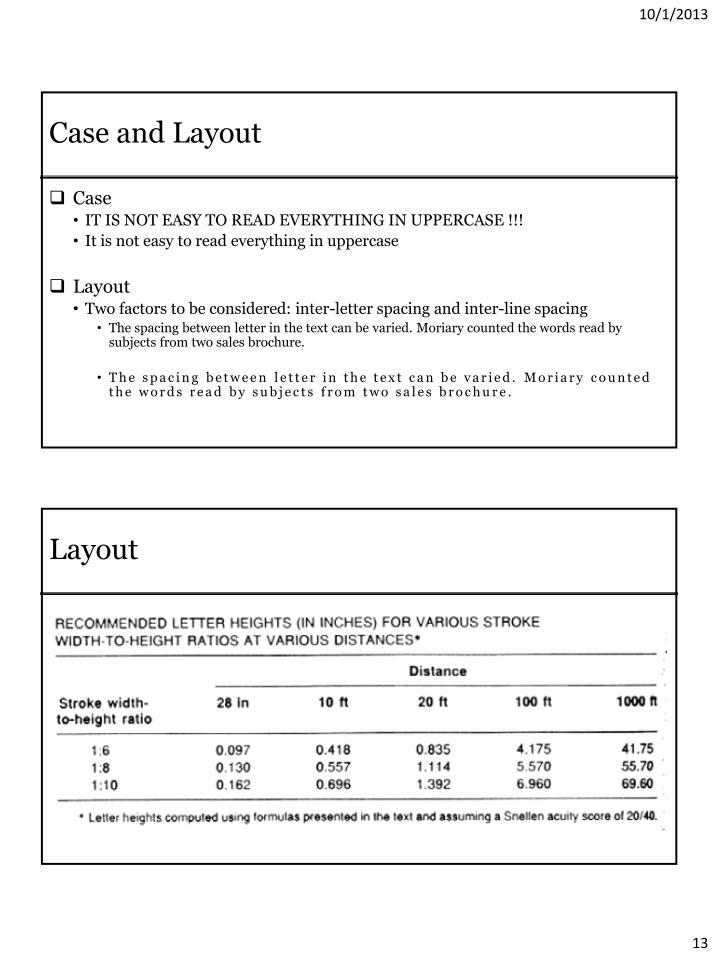
Recommended heights of alphanumeric characters for critical and non-critical use under low and high illumination are shown in the following table
Distance Reading
10/1/2013
13
Case and Layout
Case • IT IS NOT EASY TO READ EVERYTHING IN UPPERCASE !!!
• It is not easy to read everything in uppercase
Layout • Two factors to be considered: inter-letter spacing and inter-line spacing
• The spacing between letter in the text can be varied. Moriary counted the words read by subjects from two sales brochure.
• T h e s p a c i n g b e t w e e n l e t t e r i n t h e t e x t c a n b e v a r i e d . M o r i a r y c o u n t e d t h e w o r d s r e a d b y s u b j e c t s f r o m t w o s a l e s b r o c h u r e .
Layout

10/1/2013
14
Screen Design Issues for Computer Displays
Various guidelines have been developed: Smith and Mosier, Browns, etc.
• Density (local density) • Grouping (perceptual grouping) • Complexity (extent to which arrangement follows a predictable scheme) • Highlighting
Graphical Representation of Data • Symbols • Coding
Graphic Representation and Symbols
Graphic Representation • Graphic Representations of Text
• Graphic Representation of Data.
Symbols • Comparison of Symbolic and Verbal Signs.
• Objectives of Symbolic Coding Systems.
• Criteria for Selecting Coding Symbols.
• Recognition, Matching, Preference and Opinion.
• Perceptual Principles of Symbolic Design.
• Standardization of Symbolic Displays.
10/1/2013
15
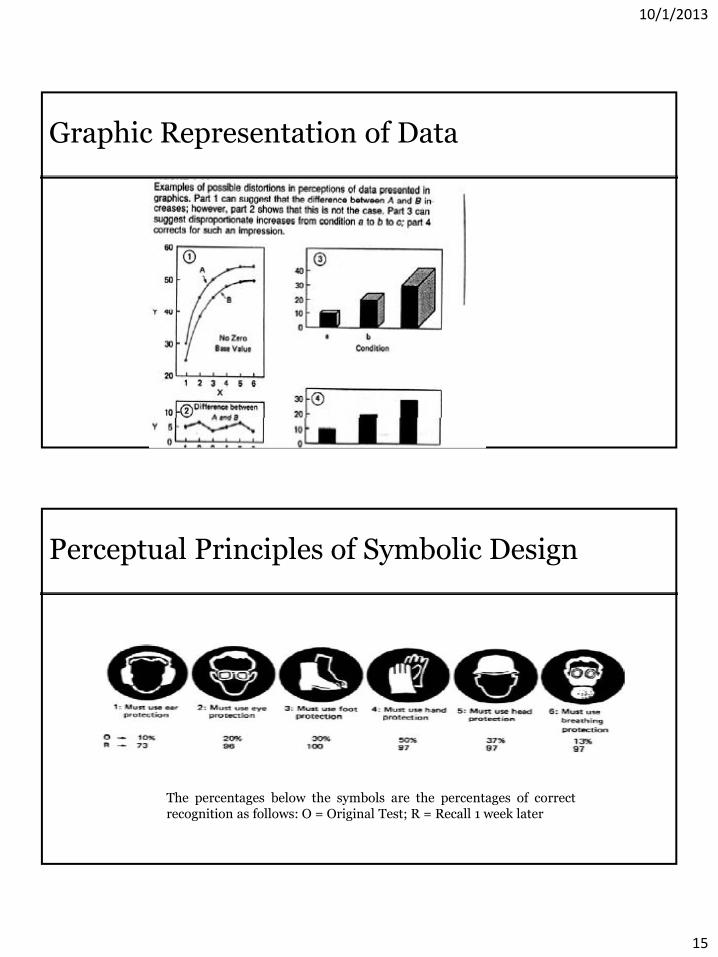
Graphic Representation of Data
Perceptual Principles of Symbolic Design
The percentages below the symbols are the percentages of correct recognition as follows: O = Original Test; R = Recall 1 week later

10/1/2013
16
In-Class Exercise
In-Class Exercise


![Index [prolift.ee]prolift.ee/wp-content/uploads/2015/09/20131015... · Index 1 Rev. 10.13 2 Quality System Certificate HF SERIES PINS TO EYE 4 HF Assembly 5 HF 129 series 6 HF 149](https://img.pdfslide.net/doc/110x75/5e79277b9a3bab345648e12d/index-index-1-rev-1013-2-quality-system-certificate-hf-series-pins-to-eye.jpg)