Embed Size (px)
Citation preview
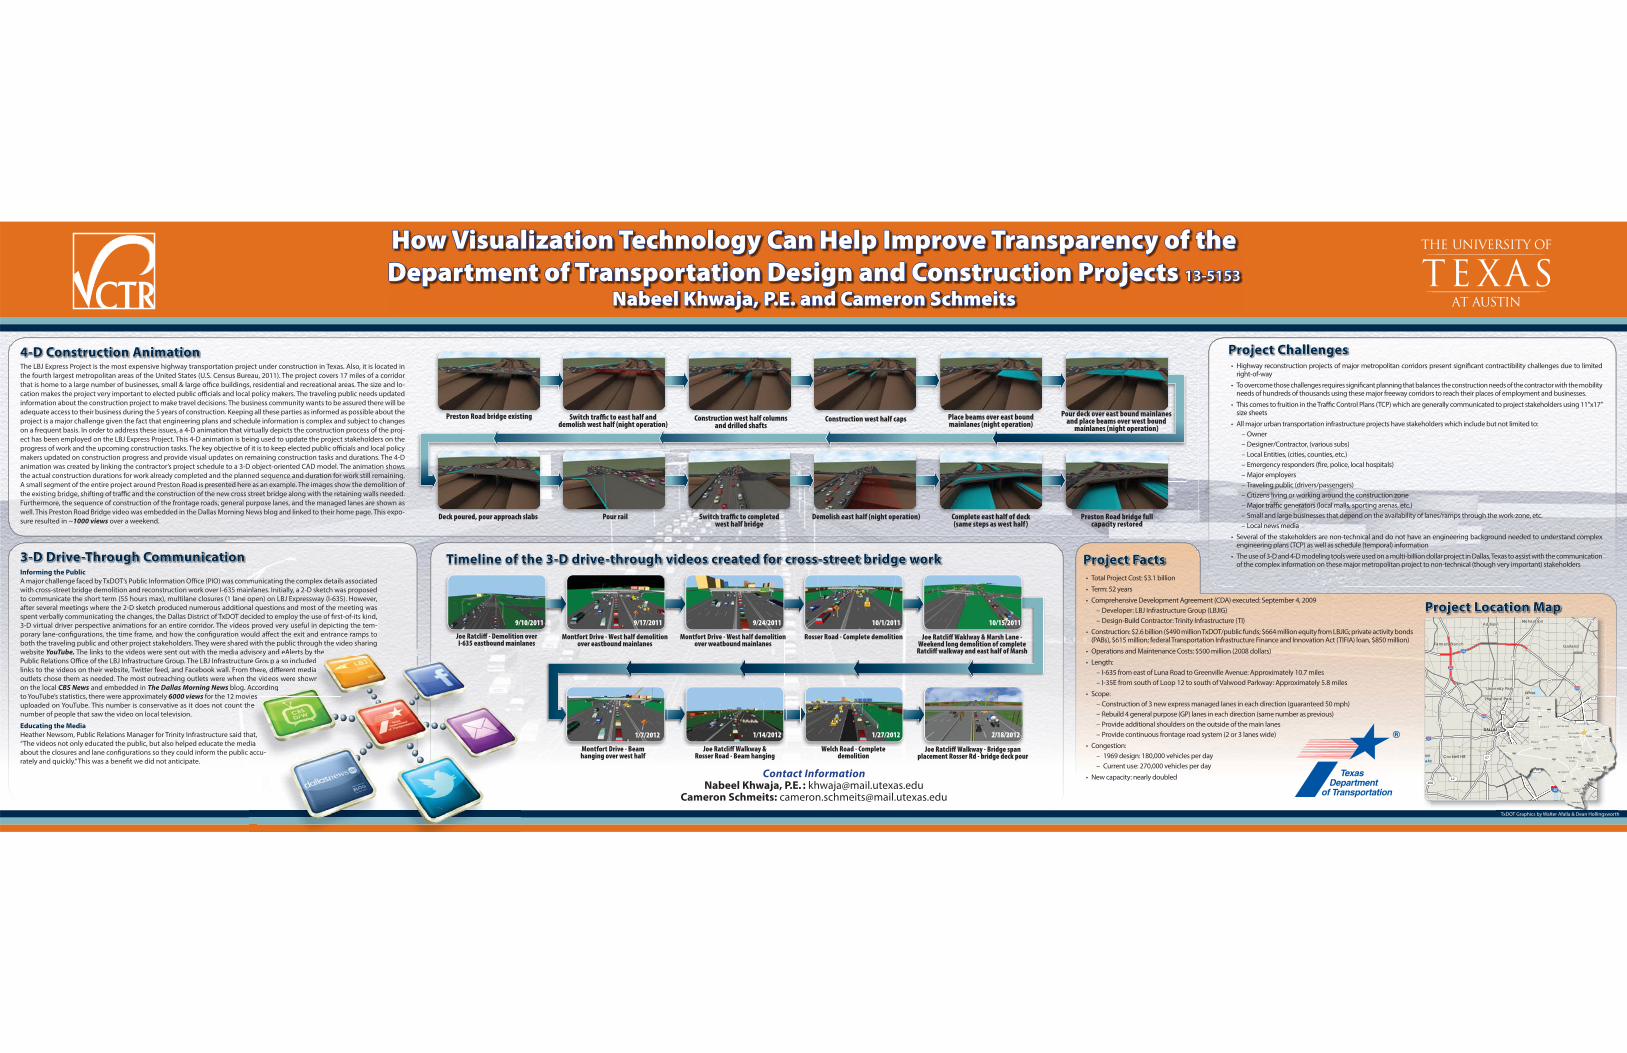
How Visualization Technology Can Help Improve Transparency of the How Visualization Technology Can Help Improve Transparency of the Department of Transportation Design and Construction Projects Department of Transportation Design and Construction Projects 13-515313-5153
Nabeel Khwaja, P.E. and Cameron SchmeitsNabeel Khwaja, P.E. and Cameron Schmeits
TxDOT Graphics by Walter Afalla & Dean Hollingsworth
The LBJ Express Project is the most expensive highway transportation project under construction in Texas. Also, it is located in the fourth largest metropolitan areas of the United States (U.S. Census Bureau, 2011). The project covers 17 miles of a corridor that is home to a large number of businesses, small & large offi ce buildings, residential and recreational areas. The size and lo-cation makes the project very important to elected public offi cials and local policy makers. The traveling public needs updated information about the construction project to make travel decisions. The business community wants to be assured there will be adequate access to their business during the 5 years of construction. Keeping all these parties as informed as possible about the project is a major challenge given the fact that engineering plans and schedule information is complex and subject to changes on a frequent basis. In order to address these issues, a 4-D animation that virtually depicts the construction process of the proj-ect has been employed on the LBJ Express Project. This 4-D animation is being used to update the project stakeholders on the progress of work and the upcoming construction tasks. The key objective of it is to keep elected public offi cials and local policy makers updated on construction progress and provide visual updates on remaining construction tasks and durations. The 4-D animation was created by linking the contractor’s project schedule to a 3-D object-oriented CAD model. The animation shows the actual construction durations for work already completed and the planned sequence and duration for work still remaining. A small segment of the entire project around Preston Road is presented here as an example. The images show the demolition of the existing bridge, shifting of traffi c and the construction of the new cross street bridge along with the retaining walls needed. Furthermore, the sequence of construction of the frontage roads, general purpose lanes, and the managed lanes are shown as well. This Preston Road Bridge video was embedded in the Dallas Morning News blog and linked to their home page. This expo-sure resulted in ~1000 views over a weekend.
4-D Construction Animation4-D Construction Animation
Preston Road bridge existing Switch traffi c to east half and demolish west half (night operation)
Construction west half columns and drilled shafts
Construction west half caps Place beams over east bound mainlanes (night operation)
Pour deck over east bound mainlanes and place beams over west bound
mainlanes (night operation)
Deck poured, pour approach slabs Pour rail Switch traffi c to completed west half bridge
Demolish east half (night operation) Complete east half of deck (same steps as west half)
Preston Road bridge full capacity restored
Project ChallengesProject Challenges• Highway reconstruction projects of major metropolitan corridors present signifi cant contractibility challenges due to limited
right-of-way
• To overcome those challenges requires signifi cant planning that balances the construction needs of the contractor with the mobility needs of hundreds of thousands using these major freeway corridors to reach their places of employment and businesses.
• This comes to fruition in the Traffi c Control Plans (TCP) which are generally communicated to project stakeholders using 11”x17” size sheets
• All major urban transportation infrastructure projects have stakeholders which include but not limited to: – Owner – Designer/Contractor, (various subs) – Local Entities, (cities, counties, etc.) – Emergency responders (fi re, police, local hospitals) – Major employers – Traveling public (drivers/passengers) – Citizens living or working around the construction zone – Major traffi c generators (local malls, sporting arenas, etc.) – Small and large businesses that depend on the availability of lanes/ramps through the work-zone, etc. – Local news media
• Several of the stakeholders are non-technical and do not have an engineering background needed to understand complex engineering plans (TCP) as well as schedule (temporal) information
• The use of 3-D and 4-D modeling tools were used on a multi-billion dollar project in Dallas, Texas to assist with the communication of the complex information on these major metropolitan project to non-technical (though very important) stakeholders
Joe Ratcliff - Demolition over I-635 eastbound mainlanes
Montfort Drive - West half demolition over eastbound mainlanes
Montfort Drive - West half demolition over weatbound mainlanes
Rosser Road - Complete demolition Joe Ratcliff Waklway & Marsh Lane - Weekend long demolition of complete
Ratcliff walkway and east half of Marsh
Montfort Drive - Beam hanging over west half
Joe Ratcliff Walkway & Rosser Road - Beam hanging
Welch Road - Complete demolition
Joe Ratcliff Walkway - Bridge span placement Rosser Rd - bridge deck pour
J R t liff W lk B id
9/10/2011 9/17/2011 9/24/2011 10/1/2011 10/15/2011
1/7/2012 1/14/2012 1/27/2012 2/18/2012
Timeline of the 3-D drive-through videos created for cross-street bridge workTimeline of the 3-D drive-through videos created for cross-street bridge work
Contact InformationNabeel Khwaja, P.E. : [email protected]
Cameron Schmeits: [email protected]
Informing the PublicA major challenge faced by TxDOT’s Public Information Offi ce (PIO) was communicating the complex details associated with cross-street bridge demolition and reconstruction work over I-635 mainlanes. Initially, a 2-D sketch was proposed to communicate the short term (55 hours max), multilane closures (1 lane open) on LBJ Expressway (I-635). However, after several meetings where the 2-D sketch produced numerous additional questions and most of the meeting was spent verbally communicating the changes, the Dallas District of TxDOT decided to employ the use of fi rst-of-its kind, 3-D virtual driver perspective animations for an entire corridor. The videos proved very useful in depicting the tem-porary lane-confi gurations, the time frame, and how the confi guration would aff ect the exit and entrance ramps to both the traveling public and other project stakeholders. They were shared with the public through the video sharing website YouTube. The links to the videos were sent out with the media advisory and eAlerts by the Public Relations Offi ce of the LBJ Infrastructure Group. The LBJ Infrastructure Group also included links to the videos on their website, Twitter feed, and Facebook wall. From there, diff erent media outlets chose them as needed. The most outreaching outlets were when the videos were shown on the local CBS News and embedded in The Dallas Morning News blog. According to YouTube’s statistics, there were approximately 6000 views for the 12 movies uploaded on YouTube. This number is conservative as it does not count the number of people that saw the video on local television.
Educating the MediaHeather Newsom, Public Relations Manager for Trinity Infrastructure said that, “The videos not only educated the public, but also helped educate the media about the closures and lane confi gurations so they could inform the public accu-rately and quickly.” This was a benefi t we did not anticipate.
rerere GGGthethethheheh
AcAccciviess
hhe
hat,dia
acc
ororory any any and eAd eAd eAlertlertlerts bys bys by thethethe GrouGrouGroup alp alp also iso iso incluncluncludeddeddederere, de, de, diff eiff eiff erentrentrent medmedmediaiaavidvidvideoseoss werewereere shoshoownwnw
cordcorddingingss
cu-
3-D Drive-Through Communication3-D Drive-Through Communication• Total Project Cost: $3.1 billion
• Term: 52 years
• Comprehensive Development Agreement (CDA) executed: September 4, 2009 – Developer: LBJ Infrastructure Group (LBJIG) – Design-Build Contractor: Trinity Infrastructure (TI)
• Construction: $2.6 billion ($490 million TxDOT/public funds; $664 million equity from LBJIG; private activity bonds (PABs), $615 million; federal Transportation Infrastructure Finance and Innovation Act (TIFIA) loan, $850 million)
• Operations and Maintenance Costs: $500 million (2008 dollars)
• Length: – I-635 from east of Luna Road to Greenville Avenue: Approximately 10.7 miles – I-35E from south of Loop 12 to south of Valwood Parkway: Approximately 5.8 miles
• Scope: – Construction of 3 new express managed lanes in each direction (guaranteed 50 mph) – Rebuild 4 general purpose (GP) lanes in each direction (same number as previous) – Provide additional shoulders on the outside of the main lanes – Provide continuous frontage road system (2 or 3 lanes wide)
• Congestion: – 1969 design: 180,000 vehicles per day – Current use: 270,000 vehicles per day
• New capacity: nearly doubled
Project FactsProject Facts
Project Location Map
White RockLake
ainake
Mesq
Cockrell Hill
g
s
Farmers Branch
AddisonRichardson
Garland
University Park
Highland Park
Balch Springs
DALLAS
635635
635635
635635
35E
35E
30
30
45
20
190
408
289
244
78
78
66
12
12
12
12
12
7775
75
80
67
67RockckckLakeeke
MesqsqM
and ParkPa ararand Park
Balch SpringsB sssp innBalch Springs
S
635
30
45
200
121212
12
75
808080
67
AustinRound Rock
Houston
Harlingen
CorpusChristi
Laredo
Galveston
Fort Worth
Farmers Branch
Wichita Falls
Amarillo
Lubbock
Midland
OdessaEl Paso
San Antonio
San Angelo
Dallas
Tyler
Waco
Abilene
30
40
27
10
20
20
10
10
3537
4535
College Station
Bryan