Embed Size (px)
Citation preview

Variations in Head-and-Face Shape of Chinese Civilian Workers
Yuewei Liu1,2, Pengcheng Xi3, Michael Joseph4, Ziqing Zhuang4, Chang Shu3, Luman Jiang1, Michael Bergman4, and Weihong Chen1,*
1Key Laboratory of Environment and Health, Ministry of Education & Ministry of Environmental Protection, and State Key Laboratory of Environmental Health (Incubating), Department of Occupational and Environmental Health, School of Public Health, Tongji Medical College, Huazhong University of Science and Technology, Wuhan, Hubei 430030, China
2Institute of Health Surveillance, Analysis and Protection, Hubei Center for Disease Control and Prevention, Wuhan, Hubei 430079, China
3National Research Council, Ottawa, Canada
4Technology Research Branch, National Personal Protective Technology Laboratory, National Institute for Occupational Safety and Health, Pittsburgh, PA 15236, USA
Abstract
This study aims to elucidate variations in head-and-face shape among the Chinese civilian
workers. Most respirator manufacturers are using outdated, Western anthropometric data to design
respirators for the Chinese workers. Therefore, newly acquired anthropometric data specific to the
Chinese population are needed to create more effective personal protective equipment. The three-
dimensional (3D) head scans of 350 participants, who were selected from the 3000 participants in
the 2006 Chinese Anthropometric Survey, were processed using geometric processing techniques.
Each scan was then linked with the others, making statistical shape analysis on a dense set of 3D
points possible. Furthermore, this provided for the reduction of scan noise as well as for the
patching of holes. Following general scan correspondence and fine tuning, principal component
analysis was used to analyze the variability in head-and-face shape of the 3D images. More than
90% of the variability among head-and-face shapes was accounted for with 26 principal
components. Future study is recommended so the overall usefulness of the point cloud-based
approach for the quantification of variations in facial morphology may be determined.
Keywords
head-and-face modeling; shape analysis; respirator design
*Author to whom correspondence should be addressed. Tel: +86-27-83691677; Fax: +86-27-8362333; [email protected].
DISCLAIMERThe findings and conclusions in this report are those of the authors and do not necessarily represent the views of the National Institute for Occupational Safety and Health. Mention of commercial product or trade name does not constitute endorsement by the National Institute for Occupational Safety and Health. The authors declare that they have no competing interests.
HHS Public AccessAuthor manuscriptAnn Occup Hyg. Author manuscript; available in PMC 2017 July 11.
Published in final edited form as:Ann Occup Hyg. 2015 August ; 59(7): 932–944. doi:10.1093/annhyg/mev026.
Author M
anuscriptA
uthor Manuscript
Author M
anuscriptA
uthor Manuscript

INTRODUCTION
Research efforts to better understand the correlation between anthropometric factors and
respirator fit are ongoing. Anthropometric data accumulated from US military personnel in
the 1960s no longer mirror the head-and-face anthropometric distribution of the current US
civilian workers (Zhuang and Bradtmiller, 2005). In China, head-and-face anthropometric
surveys were first conducted in 1958 and in the 1970s on 43 173 military personnel and
2458 civilians, respectively (She, 2002). Another anthropometric survey of 9392 Chinese
civilians was performed in 1980. The data were used to create the first national standard for
adult head-and-face dimensions which included 13 head sizes and based on 29 dimensions
in 1981 (China National Institute of Standardization, 1981). In 1998, 22 300 adult
participants were investigated to establish a database of Chinese human head-and-face
dimensions, which included seven dimensions: full-head length, sagittal arc, bitragion
coronal arc, head breadth, head length, head circumference, and face length(China National
Institute of Standardization, 1998). After that, a pilot study of 393 Chinese adults was
conducted to measure 41 dimensions, and create regression equations using above 7
dimensions to predict other 34 head-and-face dimension. Both the seven measured and 34
calculated facial dimensions were then applied to the Chinese national standard of head-and-
face dimensions for adults in 1998 (China National Institute of Standardization, 1998).
In China, the current respirator certification standard follows the European standards, which
requires total inward leakage tests on 10 participants (China National Institute of
Standardization, 2006). However, Chinese respirator manufacturers continue to design their
respirators in accordance with Los Alamos National Laboratory fit test panels, which are
based on the aforementioned data collected from the anthropometric survey of US Air Force
personnel in the 1960s (Yang et al., 2007). This data no longer accurately represents the
head-and-face anthropometric distribution of the current Chinese workers (Du et al., 2008;
Chen et al., 2009). The previous study also showed that Chinese civilian adults had a shorter
face length and nose protrusion as well as a larger face width and lip length compared with
that of US participants (Zhuang and Bradtmiller, 2005; Du et al., 2008). Furthermore, due to
the swift growth of China’s economy and changes in the patterns of food consumption over
the last 30 years, further changes in the physical characteristics of the population have
occurred (Yu et al., 2012). To address the need of up-to-data of facial dimensions, a more
recent survey of head-and-face anthropometric measurements was conducted in China in
2006 with the participation of 3000 civilian workers (Du et al., 2008; Chen et al., 2009). The
data from this survey were used to create two novel respirator fit test panels of 10 cells in
each (Du et al., 2008; Chen et al., 2009) by bivariate analysis and principal component
analysis (PCA).
During the 2006 Chinese Anthropometric Survey (Du et al., 2008; Chen et al., 2009), a
Cyberware Rapid three-dimensional (3D) digitizer was used to collect 3D head scans from
350 of the 3000 participants (Yu et al., 2012). These scans were then used to successfully
develop digital 3D headforms specific to the Chinese civilian workers (Yu et al., 2012). By
scanning the participants’ heads with the 3D scanner and using the same methodology
developed previously in the USA (Zhuang et al., 2010), it was possible for Yu et al. to
collect volumetric and contour data regarding head-and-face size and shape that are
Liu et al. Page 2
Ann Occup Hyg. Author manuscript; available in PMC 2017 July 11.
Author M
anuscriptA
uthor Manuscript
Author M
anuscriptA
uthor Manuscript

undefinable from landmark coordinates alone. Three-dimension point cloud analysis is
another method to characterize anthropometric datasets. Three-dimension point cloud shape
variation allows performance of statistical shape analysis on the dense set of 3D data points
generated by the scanner. However, due to the complexity of the 3D data it is not
immediately available for compiling shape information for a population. This complexity, in
conjunction with the limitations of the scanner’s optical sensors (e.g. occlusion) and the
ambient lighting conditions, causes the 3D data to be represented as surface meshes that are
at times incomplete and contain superfluous data points. Therefore, geometric processing is
necessary to clean up and prepare the scans for analysis. These techniques are widely
applied to computer graphics and pattern recognition software, but have not been used
previously for cleaning up anthropometric head scan data. In comparison, Luximon et al. (2012) recently demonstrated 3D head-and-face modeling by using their point-cloud data in
conjunction with Delaunay Triangulation.
The goal of this study is to investigate current differences in head-and-face shape among
Chinese civilian workers. This information will illuminate the need for new and better fitting
respirators for the Chinese civilian workers. Furthermore, the presentation of our new Shape
Analyzer software will reveal the ease with which one may now digitally manipulate the first
50 PCs (enough for any practical application) to create virtually any 3D face size and shape.
These digital headforms could eventually be used for the creation of physical headforms to
facilitate the testing of respirators without the cost and difficulties associated with human
subject testing.
METHODS
Participants
A total of 350 participants were included in this study. The participants were selected with
consideration of age, gender, and birthplaces from 3000 Chinese civilian workers that we
investigated in 2006. Their head-and-face anthropometric dimensions covered all 10 panels
in Chinese respirator fit test panels developed by bivariate approach or PCA. They were the
same participants that were included in previous analysis of digital 3D headforms
representative of Chinese workers (Yu et al., 2012). We analyzed the 3D point cloud data on
these 350 participants in this study.
Data analysis
Three-dimensional scanning—The 350 chosen participants were scanned using a
Cyberware rapid 3D digitizer (Monterey, CA, USA) along with its connected computer and
data processing software (Yu et al., 2012). The digitizer was used to collect 3D head-and-
face surface data for each participant. While sitting, looking straight ahead, and maintaining
slight occlusion of the jaw, the participants had the 26 pertinent landmark locations
delineated by circular stickers with a diameter of 6 mm. The Cyberware rapid 3D digitizer
projected a Class I laser beam in a 360° fashion for approximately 45 s onto each
participant’s head and facial regions as he/she maintained a stable posture (Yu et al., 2012).
To attempt to ensure the least amount of movement and appropriate positioning of each
Liu et al. Page 3
Ann Occup Hyg. Author manuscript; available in PMC 2017 July 11.
Author M
anuscriptA
uthor Manuscript
Author M
anuscriptA
uthor Manuscript

participant, a reference post was secured to the top of the head. Calibration of the scanner
itself occurred routinely to guarantee accurate data collection.
Data preprocessing—Polyworks version 10.1.6 (InnovMETRIC™, Quebec, QC,
Canada) was used to process the 3D data. This software allowed us to create various virtual
features. For example, virtual landmarks were placed on the 3D scans in the same locations
as the 6-mm stickers delineating the physical landmarks. To compare the traditional manual
anthropometric head-and-face measurements collected during the 2006 survey (Du et al., 2008), points were manually placed on each scan at the same location as the labeled
landmarks. Computer-based linear measurements were generated based on these points. All
of this new data, computed with the use of Polyworks, were given novel coordinate frames
dissimilar to that of the 3D head scans by the Cyberware 3D digitizer’s associated software.
Therefore, it was necessary to apply a scaling factor of 0.001 to transform the coordinate
frames of the new data from micrometers to millimeters, effectively providing the means to
align them with the 3D head scans themselves. These processes transferred the manually
placed landmark locations on the participants’ faces to their respective 3D head scans and
created working and accurate 3D models of each participant’s head and face.
Data parameterization—Each human face is unique. To compare individual 3D models,
it is necessary to establish a correspondence among them. Since 3D scans contain dense sets
of 3D points that represent the anthropometric measurements, and each scan can contain
anywhere from 100 000 to 300 000 points, the scans must be manipulated such that each
scan contains the same number of points. Also, those points representing the same
anatomical features must correspond with each other; otherwise, statistical analysis of the
scans would not be possible. Data parameterization is useful in this endeavor, which
eventually allows us to accurately compare variations of head-and-face shape among the
participant population. Once a parameterization is achieved, multivariate statistics become
applicable Bookstein, 1997; Dryden and Mardia, 1998).
Data parameterization is most easily achieved among the 3D models by fitting a generic
mesh model to each 3D scan (Allen et al., 2003). Kähler et al. (2002) successfully used this
method previously, and their technique afforded the additional benefit of filling holes in the
scanned surface with geometry from the template surface, thereby creating a more realistic
and complete 3D model (Allen et al., 2003). The fitting process involved deforming the
generic mesh model to match the shape of an individual scan, effectively rendering both
models geometrically equivalent. Since anthropometric landmarks were physically placed on
each participant prior to scanning, they could be used as guides for the distortion of the
generic model to the 3D scan. This provided correspondence between the key anatomical
features of each scan. The process was repeated for each subsequent 3D scan, using the
same generic mesh model each time. It was important that correspondence between the
original scan and the deformed generic mesh model is maintained; otherwise, the scans will
not be made geometrically equivalent. Therefore, the digitally placed landmarks on the 3D
head scans were used to delineate the previously placed physical landmarks on the deformed
generic mesh model, and preserve the integrity of each landmark’s original location on the
participants’ faces.
Liu et al. Page 4
Ann Occup Hyg. Author manuscript; available in PMC 2017 July 11.
Author M
anuscriptA
uthor Manuscript
Author M
anuscriptA
uthor Manuscript
During the deformation of the generic mesh model to the shape of a 3D scan, it is important
to maintain the smoothness of the surface. This can be accomplished by formulating a large-
scale nonlinear optimization equation. The variables of the equation that require solving are
the fundamental 3D anthropometric measurements of the generic mesh model, which are
presented as x, y, and z coordinates. The initial solution to the equation can be set as the
generic mesh model itself, thus making the initial solution of the optimization equation for
each individual 3D scan the same. Working from this given solution, the definition of the
cost function can be found by estimating the difference between the given solution and the
target data model (a participant’s 3D scan). This process brings to light three errors that
require rectifying: (i) the landmark error, which accounts for the sum of the distances
between the known corresponding landmarks; (ii) the smoothness error, which quantifies the
smoothness at the locality of every mesh point; and (iii) the data error, which measures the
sum of the distances between every pair of corresponding data points. Since a typical scan
can contain anywhere from 100 000 to 300 000 data points, our optimization problem
involves the solving of a very large number of variables. Stable solutions are difficult to
acquire, as the problem is nonlinear and the required algorithm tends to break down in the
local minima. Fortunately, Allen et al. (2003) attempted a multiresolution approach where
they implemented low-resolution meshes for deformation before using higher resolution
meshes. This method proved successful, as it improves the efficiency of the equation and
resolves some of the previously mentioned convergence problems. Xi et al. (2007) further
improved this method by first using radial basis function to approximate the data model by
slightly deforming the generic model, and subsequently aligning the models using the
nonlinear optimization method of Allen et al. (2003). This combined method simplifies the
process and increases the speed at which it may be completed by 50%. The overall process
of fitting the generic mesh model to an individual 3D scan is shown in Fig. 1, while resulting
fitting errors are illustrated via color-coded images in Fig. 2.
As shown in Fig. 2, the area of the scan that contains the most error after fitting the generic
mesh model to the original scan is the participant’s ear. This discrepancy is consistent with
the volumetric approach where as much as 50% of the scanned data could be lost in the area
of the ear. This naturally creates many errors in comparisons. However, it is important to
note that our updated method presented in this figure shows very little or no error in the area
of the participant’s face. The only noticeable error in these regions is immediately superior
to the eye, where a rather insignificant error of 0.1 mm can be seen. In the past, most
researchers avoided fitting a generic model to individual 3D scans, because there was no
information on its accuracy. But our results highlight the success in implementing the use of
a generic mesh model, which can be seen particularly through the comparisons’ yield of
minimal error.
Statistical analysis
All of the previous methods worked toward the primary necessity of prestatistical analysis of
the data: correspondence among all of the 3D models. This correspondence provided us with
a set of parameterized models, each containing the same number of data points and the same
mesh topology. We performed statistics on variables that are represented by the coordinates
of the vertices on the meshes. A shape vector was formed for each model, and the mean
Liu et al. Page 5
Ann Occup Hyg. Author manuscript; available in PMC 2017 July 11.
Author M
anuscriptA
uthor Manuscript
Author M
anuscriptA
uthor Manuscript

vector as well as the covariance matrix was calculated. A basis of the shape space was
formed by the eigenvectors of the covariance matrix. All of these steps embodied the
standard PCA method, which transformed the data into a new coordinate system in which
the modes of variations were ordered from large to small. Statistical analysis was performed
in three different ways: for all participants combined, and for males and females separately.
The analysis revealed that the overall space of the human head-and-face is spanned by only a
few basis vectors.
RESULTS
Shape variability
The spatial aspects of the human head shape can be accurately represented by a small
amount of PCs. This is due to the fact that the absolute values of the eigenvalues determine
the significance of the analogous variations (PCs), many of which are very close to zero. Fig.
3 plots the relationship between the percentages of variability that a given number of PCs
represent. As can be seen, more than 90% of the variation can be accounted for by the first
26 PCs.
Variability visualization
Statistical shape analysis has many advantages, including the ability to provide intuitive
visualization of shape variation. In our performance of PCA on the 3D scans, we employed
the use of a dense point set on the scan surfaces. This allowed visualization of each PC by
animation, produced by varying the coefficients of the components. Our newly implemented
Shape Analyzer software facilitated navigation of the shape space. The software permitted
the user to change the coefficients of the first 50 PCs, which was more than sufficient for
practical applications. As the coefficient to any PC was manipulated, the appropriate shape
changes were automatically revealed in the display area. These features allowed for the
generation and visualization of any practical head-and-face size and shape. It is important to
note that boundary shapes of a given population can also be generated. This is made possible
because PCA is a linear model; therefore, any shape along a PC axis is anticipated to form a
Gaussian distribution. Tests for the normality of each PC were also conducted.
The exportation of generated head-and-face shapes from the Shape Analyzer to 3D files
allowed for further manipulation of the images for the development of 3D digital headforms.
Since the Shape Analyzer facilitated quick and easy manipulation of the coefficients of the
PCs, the 3D digital headforms were efficiently maintained to reflect the most recent
population demographics. In turn, this could allow for the creation of up-to-date physical
headforms that can be used for personal protective equipment (PPE) development, including
the development of respirators.
We sampled the Gaussian space at (−3σi, −1.5σi, 0, 1.5σi, 3σi) (σi is the square root of
Eigen value for PC i) in order to present shape variations along each PC among a combined
set of males and females. Shape variations of the first five PCs are illustrated in Fig. 4, with
the row number representing the index of the PC. Variations in shape among males and
Liu et al. Page 6
Ann Occup Hyg. Author manuscript; available in PMC 2017 July 11.
Author M
anuscriptA
uthor Manuscript
Author M
anuscriptA
uthor Manuscript

females separately are illustrated in Figs 5 and 6, respectively. Finally, the averages of the
male and female combined head and separate male and female heads are shown in Fig. 7.
As stated previously, the first 26 PCs accounted for more than 90% of the variability among
head-and-face sizes and shapes. In the combined dataset of male and female heads, the first
five of these PCs accounted for 67% of the total variation. The specific variability among the
first five PCs were 30, 14, 11, 7 and 5%, respectively. The first PC was an important
component of facial variability as it represents the overall size of an individual face. More
specifically, it shows the shape variation between a small size female head and a large size
male head. The second PC accounted for a wide overall head with a flat back of head versus
a narrow overall head with a prominent back of head. The face of a person with a narrow
head had more cheek and chin protrusion than that of a person with a wide head. For the
third PC, the variation was between a male long/narrow face and a female short/wide face.
PC4 demonstrated shape variations between a head with a protruding lower face and another
with a protruding forehead. Finally, PC5 depicted a shape change regarding head-and-face
widths.
For the male dataset, the first five PCs accounted for 66% of the dataset variation. The
specific variability for the first five PCs were 26, 14, 12, 8, and 6%, respectively. Variations
on the first five PCs were similar to those observed from the combined dataset except there
are no gender variations.
For the female dataset, the first five PCs accounted for 63% of the dataset variation. The
specific variability for the first five PCs were 22, 19, 9, 7, and 5%, respectively. The first PC
represented variations between a wide head with flat back of head versus a narrow head with
prominent back of head. PC2 accounted for variations between a puffy face with a
prominent back of head and a lean face with a flat back of head. The variations on PC3,
PC4, and PC5 were similar as those on PC3, PC4, and PC5 in the combined dataset,
respectively, except there are no gender variations.
Shape variation by gender
When using PCA, a shape space was created by the computation of eigenvectors. This
process allowed for the mapping of the shape vectors consisting of the x, y, and z coordinates of each 3D head shape into the shape space. This was achieved by simply
calculating the inner product of the shape vectors and eigenvectors, which created a vastly
reduced representation with mapped weights for each head shape in the PCA shape space.
By using demographic information to plot participants (e.g. gender), it was possible to locate
the participants adjacent to the male and female averages, as well as those participants who
fall furthest away from the averages.
A plot onto the first several PCs shows differences between participants. Considering the
first 10 PCs, we found PC1, PC2, and PC3 are the best in distinguishing the participants, of
which the first two are plotted in Fig. 8. We then calculated the average of mapped weights.
Using the two averages as markers, we drew a straight line, mapped the rest of participants
onto the line, and found the two participants who fell nearest and the two who fell furthest
Liu et al. Page 7
Ann Occup Hyg. Author manuscript; available in PMC 2017 July 11.
Author M
anuscriptA
uthor Manuscript
Author M
anuscriptA
uthor Manuscript

from the averages. Of the 350 head scans, 245 were of male participants and 105 were of
female participants.
Fig. 8 shows the scatter plot of participants in different genders with a basis of PC1 and PC2.
It also shows four participants in shaded 3D models, where B denotes the neighbor to the
male average, C denotes the neighbor to the female average, and points A and D are the
furthest from the averages in males and females respectively. Fig. 8 also shows a decreasing
head-and-face size from males to females. Accordingly, the circumference of neck decreases
from A to D. On the face, the width of the nose, interpupillary distance and the width of chin
are smaller for females.
DISCUSSION
The necessity of our research in the analysis of head shape is illuminated by the benefits it
provides, particularly information for the manufacture of better fitting respirators and the
construction of headforms that take into account facial form. The fit of widely used N95
filtering facepiece respirators in China are poor because respirator manufacturers currently
design their respirators in accordance with Los Alamos Laboratory fit test panels (Yu et al., 2014). The need for representative head-and-face shapes in China is great. Newly developed
headforms designed specifically to reflect averages in Chinese workers’ head size-and-shape
could be used in further research regarding respirators and other forms of PPE worn on the
head and face. This information could then be used to facilitate the creation of better
certification standards and product designs, leading to safety devices that fit better and
provide more protection and comfort to their users.
The development of the two new respirator fit test panels for Chinese workers has proved
invaluable in the creation of five new digital 3D headforms, all of which are more
representative of the current Chinese civilian workforce (Chen et al., 2009; Yu et al., 2012).
These headforms were developed by computing the mean facial dimensions of each face size
category using the 2006 Chinese Anthropometric Survey data (Du et al., 2008; Chen et al., 2009). Hence, the headforms include facial features not previously used in the development
of Chinese standard headforms, as the most recent data is more comprehensive. The first
respirator fit test panel, the bivariate panel, incorporated the face length and face width of
each participant and weighted the participants to better match the age and race distribution
of the Chinese population at the time of the 2005 census (Chen et al., 2009; Yu et al., 2012).
The second panel, the PCA panel, incorporated the first two PCs calculated from a set of ten
facial dimensions (also age and race adjusted). This panel divides the user population into
five face size categories: small, medium, large, long/narrow, and short/wide. Comparisons
between the previous studies on the Chinese population (Chen et al., 2009; Yu et al., 2012)
and the current work were also conducted. It was concluded that the first PC captures the
variation on overall face width because most of the variables used for PCA computation are
face widths (Chen et al., 2009). This is consistent with our work in that face width variations
are part of the overall size change as observed on PC1. PC2 was described as capturing face
shape, primarily key features related to face length and nose depth. In this study, PC2 depicts
similar variations and those found in previous work (Chen et al., 2009). The most recent
Liu et al. Page 8
Ann Occup Hyg. Author manuscript; available in PMC 2017 July 11.
Author M
anuscriptA
uthor Manuscript
Author M
anuscriptA
uthor Manuscript

study (Yu et al., 2012) also made similar conclusions where PC1 determines face size and
PC2 depicts the overall length of the face and the shape of the nose.
The 3D head scan data can be processed by point-cloud analysis to reveal detailed head-and-
face shape variations among different populations. This data, in turn, can be very useful for
the design of better fitting and more comfortable respirators. Recently, Ball et al. (2010)
used PCA analysis on the dense parameterized models from a vast digital data set taken
from two contemporary 3D anthropometric surveys (SizeChina and CAESAR) to show that
there were significant statistical variations between the head-and-face shapes of Chinese and
Caucasian ethnic groups. The ultimate conclusion from these analyses was that head related
products designed following Western anthropological head-and-face shape confer
inappropriate fit on the Chinese head.
Another study by Luximon et al. (2012) also implemented data from the SizeChina survey.
Instead of employing the deformation of the generic mesh model to fit each 3D scan, they
used their point-cloud data in conjunction with Delaunay Triangulation. This method
ultimately served the same purpose as our own, and a vast number of anatomical landmarks
were manually located. Two major logistical differences between the two methods are in the
speed and effort with which both may be completed, as our method takes slightly shorter
time and is a bit easier to complete. Their findings were very close to ours, as the first four
PCs in each study accounted for 63.09 and 60% of the variation among Chinese male head
shapes (female: 57.79 versus 58%), respectively. The two methods, Delaunay Triangulation
and the deformation of a generic mesh model, are clearly comparable techniques, as both
resulted in extremely similar experimental results. Furthermore, after PCA, the authors
concluded that significant differences in face shape between male and female Chinese
civilians could render a unisex system for sizing masks as a possible cause for issues
regarding respirator fit.
This study found that the first five PCs account for 67% of the male and female combined
dataset variability, a fact that may be visualized in Fig. 4. Furthermore, the first 26 PCs
explain more than 90% of the total shape variability, which is enough for most practical
applications. Additionally, the newly implemented Shape Analyzer software is of crucial
importance because it facilitates the creation of 3D digital headforms of virtually any head-
and-face size and shape. Moreover, using the digital headforms, it is simple to utilize
computer aided design software to evaluate new product designs. The headforms are
significant because they can be newly and quickly constructed as the demographics of the
Chinese population, or even a specific sampling population, change. These new 3D digital
headforms can also be used to create physical headforms which could help manufacturers
develop and test new forms of PPE, specifically respirators. However, further study is
suggested to better determine the overall utility of the point cloud-based approach for the
quantification of variations in facial morphology and its ultimate connection with respirator
performance.
Liu et al. Page 9
Ann Occup Hyg. Author manuscript; available in PMC 2017 July 11.
Author M
anuscriptA
uthor Manuscript
Author M
anuscriptA
uthor Manuscript

CONCLUSIONS
The geometry processing techniques used to prepare the data so that all head-and-face scans
corresponded point wise facilitated the successful use of PCA on the registered dataset. In
this case, PCA accurately provides a compact description of human head-and-face shape
variability. The first 26 components explain more than 90% of the shape variability, and the
newly created Shape Analyzer software facilitates the accurate manipulation of these
components such that virtually any head-and-face shape can be quickly created digitally.
Therefore, the results and technology in this study could prove especially invaluable to the
field of respirator design such that safer, more comfortable, and more efficient product style
and sizing could be achieved—most importantly for a user population that is currently being
supplied with respirators designed to fit the faces of a more Western population.
Furthermore, the 3D digital headforms created with the Shape Analyzer software can help
facilitate the creation of physical headforms for PPE testing.
Acknowledgments
FUNDING
This work was supported by National Basic Research Program of China (2011CB503804).
The funding source has no role in study design, data collection and analysis, decision to publish, or preparation of the manuscript.
References
Allen B, Curless B, Popovic Z. The space of human body shapes: reconstruction and parameterization from range scans. ACM Trans Graph. 2003; 22:587–94.
Ball R, Shu C, Xi P, et al. A comparison between Chinese and Caucasian head shapes. Appl Ergon. 2010; 41:832–9. [PubMed: 20227060]
Bookstein FL. Landmark methods for forms without landmarks: morphometrics of group differences in outline shape. Med Image Anal. 1997; 1:225–43. [PubMed: 9873908]
Chen W, Zhuang Z, Benson S, et al. New respirator fit test panels representing the current Chinese civilian workers. Ann Occup Hyg. 2009; 53:297–305. [PubMed: 19174486]
China National Institute of Standardization. CNIS GB2428-81. Head styles of adults. Beijing, China: General Administration of Quality Supervision, Inspection and Quarantine of the People’s Republic of China; 1981.
China National Institute of Standardization. CNIS GB/T2428:1998. Head-face dimensions of adults. Beijing, China: General Administration of Quality Supervision, Inspection and Quarantine of the People’s Republic of China; 1998.
China National Institute of Standardization. CNIS GB2626-2006. Respiratory protective equipment-non-powered air-purifying particle respirator. Beijing, China: General Administration of Quality Supervision, Inspection and Quarantine of the People’s Republic of China; 2006.
Dryden, IL., Mardia, KV. Statistical shape analysis. Chichester, UK: John Wiley; 1998.
Du L, Zhuang Z, Guan H, et al. Head-and-face anthropometric survey of Chinese workers. Ann Occup Hyg. 2008; 52:773–82. [PubMed: 18765398]
Kähler, K.Haber, J.Yamauchi, H., et al., editors. Head shop: Generating animated head models with anatomical structure. ACM SIGGRAPH Symposium on Computer Animation; 2002. p. 55-64.
Luximon Y, Ball R, Justice L. The 3D Chinese head and face modeling. Computer-Aided Design. 2012; 44:40–7.
She, Q. Practice book of knowledge and standard of individual protect equipment. Wuhan, China: Hubei Press of Science and Technology; 2002. p. 14-6.
Liu et al. Page 10
Ann Occup Hyg. Author manuscript; available in PMC 2017 July 11.
Author M
anuscriptA
uthor Manuscript
Author M
anuscriptA
uthor Manuscript

Xi, P., Lee, W., Shu, C. Proceedings of graphics interface. Montréal, QC, Canada: 2007. Analysis of segmented human body scans.
Yang L, Shen H, Wu G. Racial differences in respirator fit testing: a pilot study of whether American fit panels are representative of Chinese faces. Ann Occup Hyg. 2007; 51:415–21. [PubMed: 17337461]
Yu Y, Benson S, Cheng W, et al. Digital 3-d headforms representative of chinese workers. Ann Occup Hyg. 2012; 56:113–22. [PubMed: 21917818]
Yu Y, Jiang L, Zhuang Z, et al. Fitting characteristics of N95 filtering-facepiece respirators used widely in China. PLoS One. 2014; 9:e85299. [PubMed: 24465528]
Zhuang Z, Benson S, Viscusi D. Digital 3-D headforms with facial features representative of the current US workforce. Ergonomics. 2010; 53:661–71. [PubMed: 20432086]
Zhuang Z, Bradtmiller B. Head-and-face anthropometric survey of U.S. respirator users. J Occup Environ Hyg. 2005; 2:567–76. [PubMed: 16223715]
Liu et al. Page 11
Ann Occup Hyg. Author manuscript; available in PMC 2017 July 11.
Author M
anuscriptA
uthor Manuscript
Author M
anuscriptA
uthor Manuscript

Figure 1. From left to right: the generic model (top) and the original scan (bottom), the deformed
shape of generic model using radial basis function, and the generic model after fine fitting.
Liu et al. Page 12
Ann Occup Hyg. Author manuscript; available in PMC 2017 July 11.
Author M
anuscriptA
uthor Manuscript
Author M
anuscriptA
uthor Manuscript

Figure 2. From left to right: the original scan, fine fitting result, and fine-fitted model textured with
color-coded errors. The values on the scale are in millimeters.
Liu et al. Page 13
Ann Occup Hyg. Author manuscript; available in PMC 2017 July 11.
Author M
anuscriptA
uthor Manuscript
Author M
anuscriptA
uthor Manuscript
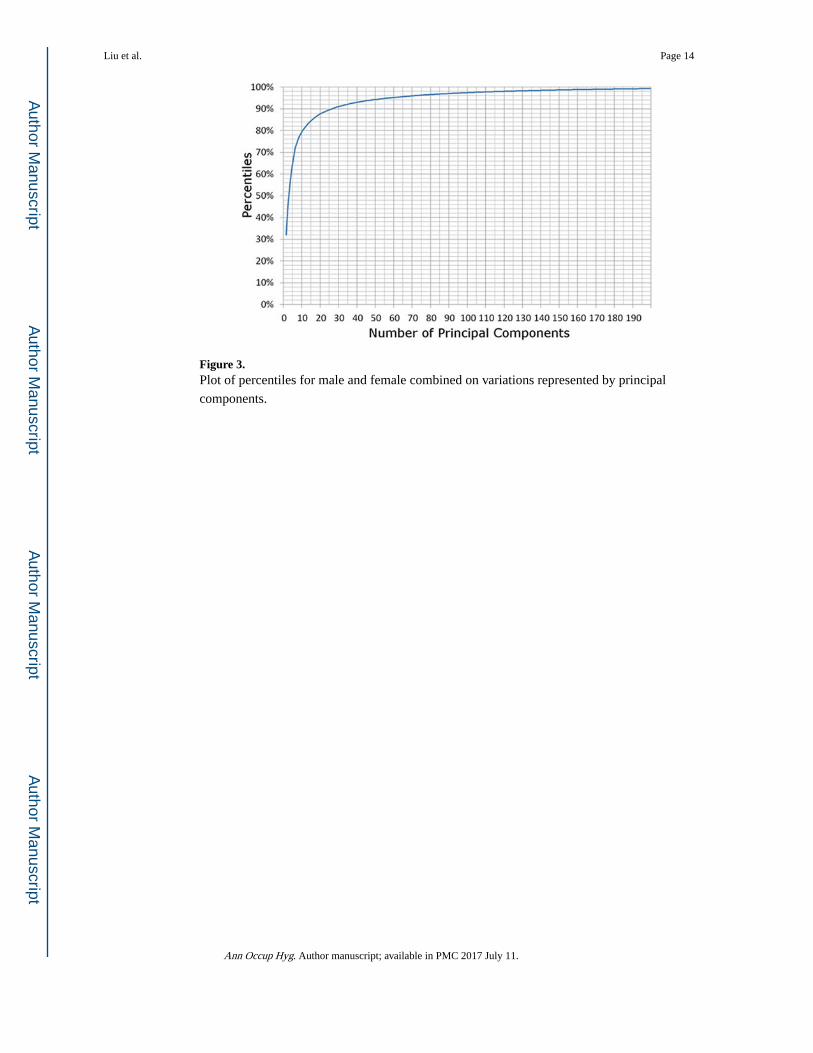
Figure 3. Plot of percentiles for male and female combined on variations represented by principal
components.
Liu et al. Page 14
Ann Occup Hyg. Author manuscript; available in PMC 2017 July 11.
Author M
anuscriptA
uthor Manuscript
Author M
anuscriptA
uthor Manuscript

Figure 4. Male and female combined shape variations along the first five principal components (from
left to right are reconstructed shapes at −3σi, −1.5σi, 0, 1.5σi, and 3σi, i = 1, …, 5).
Liu et al. Page 15
Ann Occup Hyg. Author manuscript; available in PMC 2017 July 11.
Author M
anuscriptA
uthor Manuscript
Author M
anuscriptA
uthor Manuscript

Figure 5. Male shape variations along the first five principal components (from left to right are
reconstructed shapes at −3σi, −1.5σi, 0, 1.5σi, and 3σi, i = 1, …, 5).
Liu et al. Page 16
Ann Occup Hyg. Author manuscript; available in PMC 2017 July 11.
Author M
anuscriptA
uthor Manuscript
Author M
anuscriptA
uthor Manuscript

Figure 6. Female shape variations along the first five principal components (from left to right are
reconstructed shapes at −3σi, −1.5σi, 0, 1.5σi, and 3σi, i = 1, …, 5).
Liu et al. Page 17
Ann Occup Hyg. Author manuscript; available in PMC 2017 July 11.
Author M
anuscriptA
uthor Manuscript
Author M
anuscriptA
uthor Manuscript

Figure 7. Front and side views of average head models. From left to right: average male and female
combined head, average male head, and average female head.
Liu et al. Page 18
Ann Occup Hyg. Author manuscript; available in PMC 2017 July 11.
Author M
anuscriptA
uthor Manuscript
Author M
anuscriptA
uthor Manuscript

Figure 8. Scatter plot of mapped weights on the first and second principal components by gender,
where B and C denote the nearest neighbors to the average male and female, A is the
furthest to B in males and D is the furthest to C in females.
Liu et al. Page 19
Ann Occup Hyg. Author manuscript; available in PMC 2017 July 11.
Author M
anuscriptA
uthor Manuscript
Author M
anuscriptA
uthor Manuscript