Embed Size (px)
Citation preview

HHSC - SFY 2021 Q2
Top 5 Complaints
Provider TreatmentInappropriate/Ineffective
Denial of Claim Balance Billing Quality of Care - Other Customer Service - Other
635
551
402
227213
Withdrawn and pending complaints are excluded from this report. CHIP complaints are excluded from this report.Eighty (80) % of total complaints reported were client complaints.Data Sources: MCCO Quarterly Complaints Report , HHS Office of the Ombudsman Quarterly Report , MCO Self-Reported Complaints fromTexConnect. Medicaid Enrollment information is from TMHP's Point in Time enrollment file and HHSC's Dental file.Count of Complaints by Source: Ombudsman - 832 Complaints, MCS - 391 Complaints, MCO Self-Reported - 3291 Complaints
Top 5 Complaints for Members
Top 5 Complaints for Providers
Total Resolved Complaints in SFY 2021 Q2: 4,514
Provider Treatment Inappropriate/Ineffective
Balance Billing
Quality of Care - Other
Access to In-Network Provider (non-PCP)
Customer Service - Other
635
398
226
201
198
Denial of Claim
Claims/Payment - Other
Authorization Issue
Payment Dispute
Claim Recoupment
536
60
59
50
16
1
1
1

HHSC Complaints – 2021 Q2
Top 5 Complaints
Complaint Category Number of Complaints
Provider Treatment Inappropriate/Ineffective 635
Denial of Claim 551
Balance Billing 402
Quality of Care - Other 227
Customer Service - Other 213
Top 5 Complaints for Members
Complaint Category Number of Complaints
Provider Treatment Inappropriate/Ineffective 635
Balance Billing 398
Quality of Care - Other 226
Access to In-Network Provider (non-PCP) 201
Customer Service - Other 198
Top 5 Complaints for Providers
Complaint Category Number of Complaints
Denial of Claim 536
Claims/Payment - Other 60
Authorization Issue 59
Payment Dispute 50
Claim Recoupment 16
2
2

HHSC - SFY 2021 Q2
Top 5 Complaints by Program per 10,000 Members
MMP Balance BillingMCO Customer Service/Staff BehaviorProvider Treatment Inappropriate/IneffectiveHome HealthValue-added Services Issues
STAR+PLUS Provider Treatment Inappropriate/IneffectiveDenial of ClaimQuality of Care - OtherBalance BillingCustomer Service - Other
STAR Kids Denial of ClaimBalance BillingAccess to DMEAuthorization IssueHome Health
STAR Health Denial of ClaimProvider Treatment Inappropriate/IneffectiveAuthorization IssueHome HealthCustomer Service - Other
STAR Denial of ClaimBalance BillingProvider Treatment Inappropriate/IneffectiveAccess to In-Network Provider (non-PCP)Quality of Care - Other
Dental Provider Treatment Inappropriate/IneffectiveCustomer Service - OtherDenial of ClaimBalance BillingDenial of Services
3.463.714.454.70
13.60
2.002.082.622.66
8.08
1.231.471.641.82
6.92
1.221.221.95
3.904.14
.20
.21.30.53.68
.02
.04
.04
.10
.13
Programs are sorted in descending order from highest rate of complaints to lowest. Ties are sorted in descending order alphabetically.
Average Monthly Medicaid Members by Program for 2021 Q2
MMP
STAR+PLUS
STAR Kids
STAR Health
STAR
Dental
3,608,188
3,424,633
534,502
170,479
40,432
41,036
Total Average Monthly Medicaid Members for 2021 Q2 (excluding Dental): 4,394,637Enrollment numbers do not equal a distinct count of members as members in Dental can also be enrolled in other programs.
Percentage of Complaints Substantiated - Ombudsman Data
Outcome MMP STAR+PLUS STAR Kids STAR Health STAR Dental
Substantiated
Unsubstantiated
Unable toSubstantiate
89%
7%
4%
81%
6%
13%
82%
18%
0%
71%
11%
18%
77%
10%
12%
85%
15%
0%
Substantiated – a complaint where research clearly indicates agency policy was violated or agency expectations were not met.Unsubstantiated – a complaint where research clearly indicates agency policy was not violated or agency expectations were met.Unable to Substantiate – a complaint where research does not clearly indicate if agency policy was violated or agency expectations were met.Percentages may not add up to 100% due to rounding. Complaint outcomes are discrete and do not overlap.
Percentage of Complaints Confirmed - MCS and MCO Self-Reported Data
Outcome MMP STAR+PLUS STAR Kids STAR Health STAR Dental
Confirmed
Not Confirmed
Unable to Determine 3%
58%
39%
5%
30%
65%
0%
32%
68%
1%
33%
67%
4%
36%
60%
1%
19%
80%
Confirmed – resolved or partially resolved in Complainant's favor.Not Confirmed – resolved or partially resolved in MCO’s favor.Unable to Determine – not able to confirm if a complaint is confirmed or not confirmed and complaints not related to MCO actions.Percentages may not add up to 100% due to rounding. Complaint outcomes are discrete and do not overlap.
Rate of complaints for every 10,000 enrolled members. (Complaint Volume / Total Medicaid Enrollment for SFY 21 Q2) * 10,000 = Complaints per 10,000.Count of Complaints by Source: Ombudsman - 832 Complaints, MCS - 391 Complaints, MCO Self-Reported - 3291 Complaints
3
3
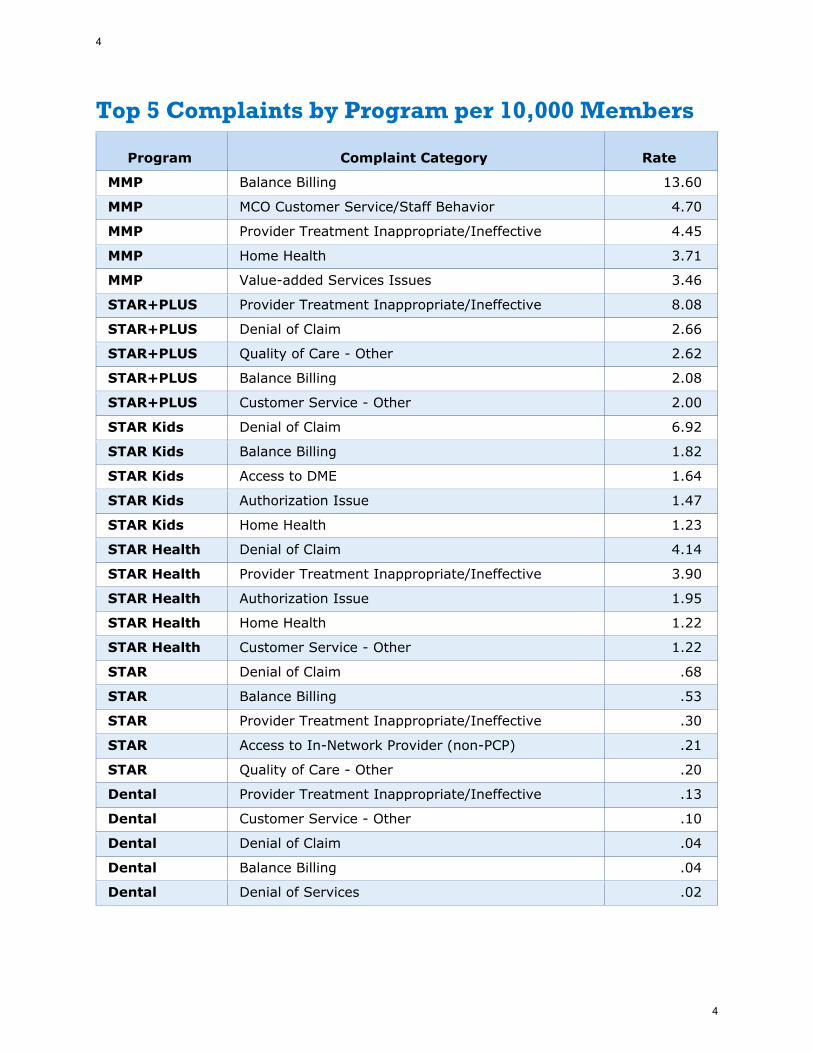
Top 5 Complaints by Program per 10,000 Members
Program Complaint Category Rate
MMP Balance Billing 13.60
MMP MCO Customer Service/Staff Behavior 4.70
MMP Provider Treatment Inappropriate/Ineffective 4.45
MMP Home Health 3.71
MMP Value-added Services Issues 3.46
STAR+PLUS Provider Treatment Inappropriate/Ineffective 8.08
STAR+PLUS Denial of Claim 2.66
STAR+PLUS Quality of Care - Other 2.62
STAR+PLUS Balance Billing 2.08
STAR+PLUS Customer Service - Other 2.00
STAR Kids Denial of Claim 6.92
STAR Kids Balance Billing 1.82
STAR Kids Access to DME 1.64
STAR Kids Authorization Issue 1.47
STAR Kids Home Health 1.23
STAR Health Denial of Claim 4.14
STAR Health Provider Treatment Inappropriate/Ineffective 3.90
STAR Health Authorization Issue 1.95
STAR Health Home Health 1.22
STAR Health Customer Service - Other 1.22
STAR Denial of Claim .68
STAR Balance Billing .53
STAR Provider Treatment Inappropriate/Ineffective .30
STAR Access to In-Network Provider (non-PCP) .21
STAR Quality of Care - Other .20
Dental Provider Treatment Inappropriate/Ineffective .13
Dental Customer Service - Other .10
Dental Denial of Claim .04
Dental Balance Billing .04
Dental Denial of Services .02
4
4

Enrollment by Program
Program Total Average Monthly Members for 2021 Q2
MMP 40,432
STAR+PLUS 534,502
STAR Kids 170,479
STAR Health 41,036
STAR 3,608,188
Dental 3,424,633
Percentage of Complaints Substantiated – Ombudsman Data
Program Substantiated Unsubstantiated Unable to
Substantiate
MMP 0% 15% 85%
STAR+PLUS 12% 10% 77%
STAR Kids 18% 11% 71%
STAR Health 0% 18% 82%
STAR 13% 6% 81%
Dental 4% 7% 89%
Percentage of Complaints Confirmed – MCS and MCO Self-Reported Data
Program
Confirmed
Not Confirmed Unable to Determine
MMP 80% 19% 1%
STAR+PLUS 60% 36% 4%
STAR Kids 67% 33% 1%
STAR Health 68% 32% 0%
STAR 65% 30% 5%
Dental 39% 58% 3%
5
5

HHSC - SFY 2021 Q2
DentaQuest
MCNA
United Dental 2 | 1.32%
35 | 23.18%
114 | 75.50% DentaQuest
MCNA
United Dental
56.70%
39.84%
3.46%
Total Enrollment by MCOComplaint Volume by MCO
Total Complaints / Pecent of Total Complaints
Superior
Amerigroup
Molina
United
Cigna-HealthSpring
Texas Children's
BCBS
Driscoll Children's
CHC
Aetna
Cook Children's
Parkland
FirstCare
Community First
El Paso First
Scott & White
Dell Children's 18 | .41%
25 | .57%
32 | .73%
43 | .99%
49 | 1.12%
60 | 1.38%
75 | 1.72%
93 | 2.13%
99 | 2.27%
149 | 3.42%
150 | 3.44%
205 | 4.70%
345 | 7.91%
421 | 9.65%
519 | 11.90%
781 | 17.90%
1,299 | 29.77%
% of Total Enrollment
Superior
Amerigroup
Molina
United
Cigna-HealthSpring
Texas Children's
BCBS
Driscoll Children's
CHC
Aetna
Cook Children's
Parkland
FirstCare
Community First
El Paso First
Scott & White
Dell Children's
24.97%
19.18%
10.50%
4.67%
7.95%
1.13%
1.18%
4.72%
7.06%
2.38%
3.17%
4.22%
2.01%
3.17%
1.77%
1.18%
.73%
Complaint Volume by DMO Total Enrollment by DMO
Percentages may not add up to 100% due to rounding.
Count of Complaints by Source: Ombudsman - 832 Complaints, MCS - 391 Complaints, MCO Self-Reported - 3291 Complaints
6
6
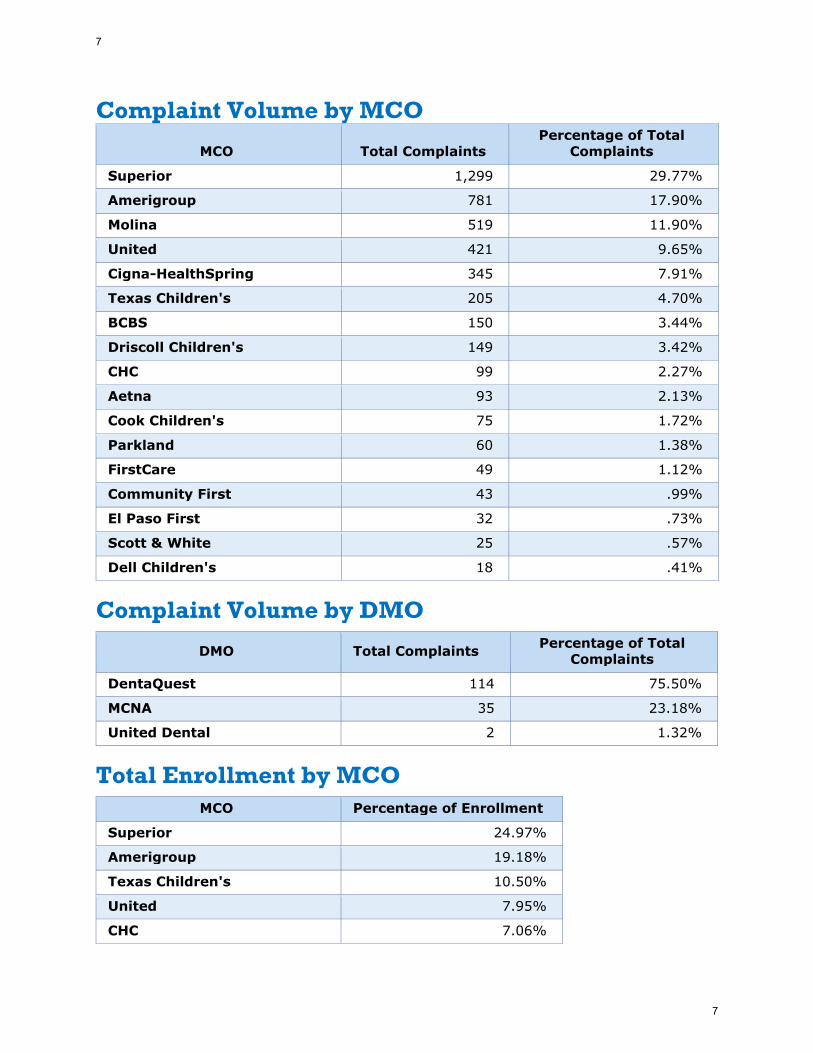
Complaint Volume by MCO
MCO Total Complaints
Percentage of Total
Complaints
Superior 1,299 29.77%
Amerigroup 781 17.90%
Molina 519 11.90%
United 421 9.65%
Cigna-HealthSpring 345 7.91%
Texas Children's 205 4.70%
BCBS 150 3.44%
Driscoll Children's 149 3.42%
CHC 99 2.27%
Aetna 93 2.13%
Cook Children's 75 1.72%
Parkland 60 1.38%
FirstCare 49 1.12%
Community First 43 .99%
El Paso First 32 .73%
Scott & White 25 .57%
Dell Children's 18 .41%
Complaint Volume by DMO
DMO Total Complaints Percentage of Total
Complaints
DentaQuest 114 75.50%
MCNA 35 23.18%
United Dental 2 1.32%
Total Enrollment by MCO
MCO Percentage of Enrollment
Superior 24.97%
Amerigroup 19.18%
Texas Children's 10.50%
United 7.95%
CHC 7.06%
7
7

MCO Percentage of Enrollment
Driscoll Children's 4.72%
Molina 4.67%
Parkland 4.22%
Cook Children's 3.17%
Community First 3.17%
Aetna 2.38%
FirstCare 2.01%
El Paso First 1.77%
BCBS 1.18%
Scott & White 1.18%
Cigna-HealthSpring 1.13%
Dell Children's .73%
Total Enrollment by DMO
DMO Percentage of Enrollment
DentaQuest 56.70%
MCNA 39.84%
United Dental 3.46%
8
8

HHSC - SFY 2021 Q2
Aetna Denial of ClaimBalance BillingPayment DisputeHome HealthAccess to Care - Other
Amerigroup Quality of Care - OtherAccess to Care - OtherBalance BillingAccess to In-Network Provider (non-PCP)Provider Treatment Inappropriate/Ineffective
BCBS Denial of ClaimBalance BillingProvider Treatment Inappropriate/IneffectiveAccess to PCPClaims/Payment - Other
CHC Denial of ClaimAuthorization IssueBalance BillingProvider Treatment Inappropriate/IneffectiveAccess to PCP
Cigna-HealthSpring Provider Treatment Inappropriate/IneffectiveValue-added Services IssuesAuthorization IssueService Coordination/Service ManagementDenial of Claim
Community First Denial of ClaimCustomer Service - OtherClaims/Payment - OtherAccess to PCPAccess to In-Network Provider (non-PCP)
Cook Children's Denial of ClaimCoordination of CareClaims/Payment - OtherAccess to In-Network Provider (non-PCP)Access to DME
Dell Children's Access to Out-of-Network ProviderPrescription Services - Other InsurancePrescription Services - OtherDenial of ClaimAccess to In-Network Provider (non-PCP)
DentaQuest Provider Treatment Inappropriate/IneffectiveCustomer Service - OtherDenial of ClaimBalance BillingMCO Customer Service/Staff Behavior
.29
.38
.381.822.30
.52.771.001.491.61
1.151.341.54
4.2210.95
.23
.26
.29
.39
.45
2.613.613.81
5.4223.68
.14
.22
.22
.291.36
.29.43.43.43.72
.62
.62
.62
.62.93
.02
.04
.06
.13
.21
Driscoll Children's Denial of ClaimProvider Treatment Inappropriate/IneffectiveCustomer Service - OtherBalance BillingAccess to DME
El Paso First Balance BillingDenial of ClaimProvider Treatment Inappropriate/IneffectiveOther InsuranceAccess to Out-of-Network Provider
FirstCare Denial of ClaimPrescription Services - Other InsuranceClaims/Payment - OtherAccess to Out-of-Network ProviderAccess to Care - Other
MCNA Customer Service - OtherBalance BillingDenial of ServicesProvider Treatment Inappropriate/IneffectiveCorrespondence/ID Card
Molina Provider Treatment Inappropriate/IneffectiveCustomer Service - OtherDenial of ClaimAccess to In-Network Provider (non-PCP)Prescription Services - PDL Prior Authorization
Parkland Balance BillingDenial of ClaimAccess to In-Network Provider (non-PCP)Access to PCPAccess to Out-of-Network Provider
Scott & White Denial of ClaimPrescription Services - Other InsurancePrescription Services - Clinical Prior AuthorizationAccess to Out-of-Network ProviderAccess to Care - Other
Superior Provider Treatment Inappropriate/IneffectiveDenial of ClaimAuthorization IssueQuality of Care - OtherAccess to DME
Texas Children's Denial of ClaimBalance BillingProvider Treatment Inappropriate/IneffectivePrescription Services - Other InsuranceMCO Customer Service/Staff Behavior
United Provider Treatment Inappropriate/IneffectiveBalance BillingDenial of ClaimAccess to In-Network Provider (non-PCP)Access to DME
United Dental Denial of ClaimBalance Billing
.29.631.011.011.16
.26
.26
.39.51
2.06
.34
.45
.57
.571.81
.02
.02
.04
.04
.06
1.751.902.052.103.31
.16
.16
.27
.321.19
.19.39.39.391.16
.62
.65.981.591.85
.26
.30.50.59.63
.43
.431.572.172.55
.08
.08
Top 5 Complaints by MCO/DMO per 10,000 Members
Rate of complaints for every 10,000 enrolled members. (Complaint Volume / Total Medicaid Enrollment for SFY 21 Q2) * 10,000 = Complaints per 10,000.Count of Complaints by Source: Ombudsman - 832 Complaints, MCS - 391 Complaints, MCO Self-Reported - 3291 ComplaintsMCOs/DMOs are sorted in alphabetical order. Ties are sorted in descending order alphabetically.
9
9
9

Top 5 Complaints by MCO/DMO per 10,000
Members
MCO/DMO Complaint Category Rate
Aetna Denial of Claim 2.30
Aetna Balance Billing 1.82
Aetna Payment Dispute .38
Aetna Home Health .38
Aetna Access to Care - Other .29
Amerigroup Quality of Care - Other 1.61
Amerigroup Access to Care - Other 1.49
Amerigroup Balance Billing 1.00
Amerigroup Access to In-Network Provider (non-PCP) .77
Amerigroup Provider Treatment Inappropriate/Ineffective .52
BCBS Denial of Claim 10.95
BCBS Balance Billing 4.22
BCBS Provider Treatment Inappropriate/Ineffective 1.54
BCBS Access to PCP 1.34
BCBS Claims/Payment - Other 1.15
CHC Denial of Claim .45
CHC Authorization Issue .39
CHC Balance Billing .29
CHC Provider Treatment Inappropriate/Ineffective .26
CHC Access to PCP .23
Cigna-HealthSpring Provider Treatment Inappropriate/Ineffective 23.68
Cigna-HealthSpring Value-added Services Issues 5.42
Cigna-HealthSpring Authorization Issue 3.81
10
10
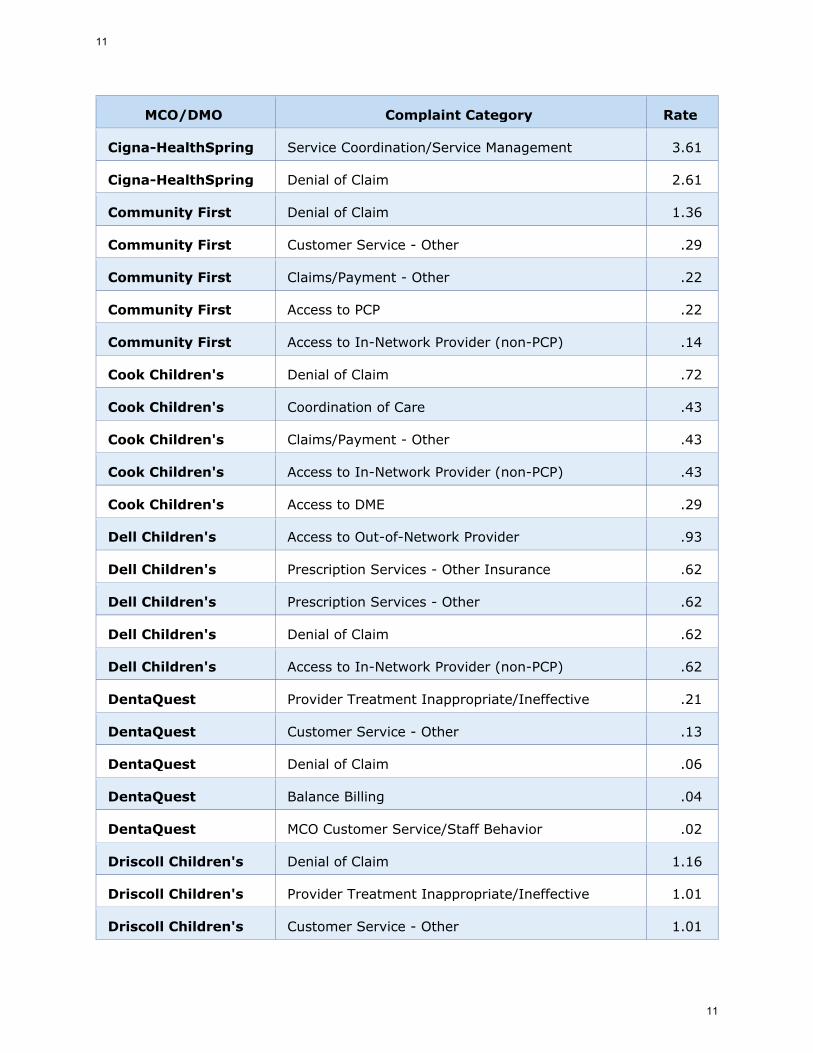
MCO/DMO Complaint Category Rate
Cigna-HealthSpring Service Coordination/Service Management 3.61
Cigna-HealthSpring Denial of Claim 2.61
Community First Denial of Claim 1.36
Community First Customer Service - Other .29
Community First Claims/Payment - Other .22
Community First Access to PCP .22
Community First Access to In-Network Provider (non-PCP) .14
Cook Children's Denial of Claim .72
Cook Children's Coordination of Care .43
Cook Children's Claims/Payment - Other .43
Cook Children's Access to In-Network Provider (non-PCP) .43
Cook Children's Access to DME .29
Dell Children's Access to Out-of-Network Provider .93
Dell Children's Prescription Services - Other Insurance .62
Dell Children's Prescription Services - Other .62
Dell Children's Denial of Claim .62
Dell Children's Access to In-Network Provider (non-PCP) .62
DentaQuest Provider Treatment Inappropriate/Ineffective .21
DentaQuest Customer Service - Other .13
DentaQuest Denial of Claim .06
DentaQuest Balance Billing .04
DentaQuest MCO Customer Service/Staff Behavior .02
Driscoll Children's Denial of Claim 1.16
Driscoll Children's Provider Treatment Inappropriate/Ineffective 1.01
Driscoll Children's Customer Service - Other 1.01
11
11
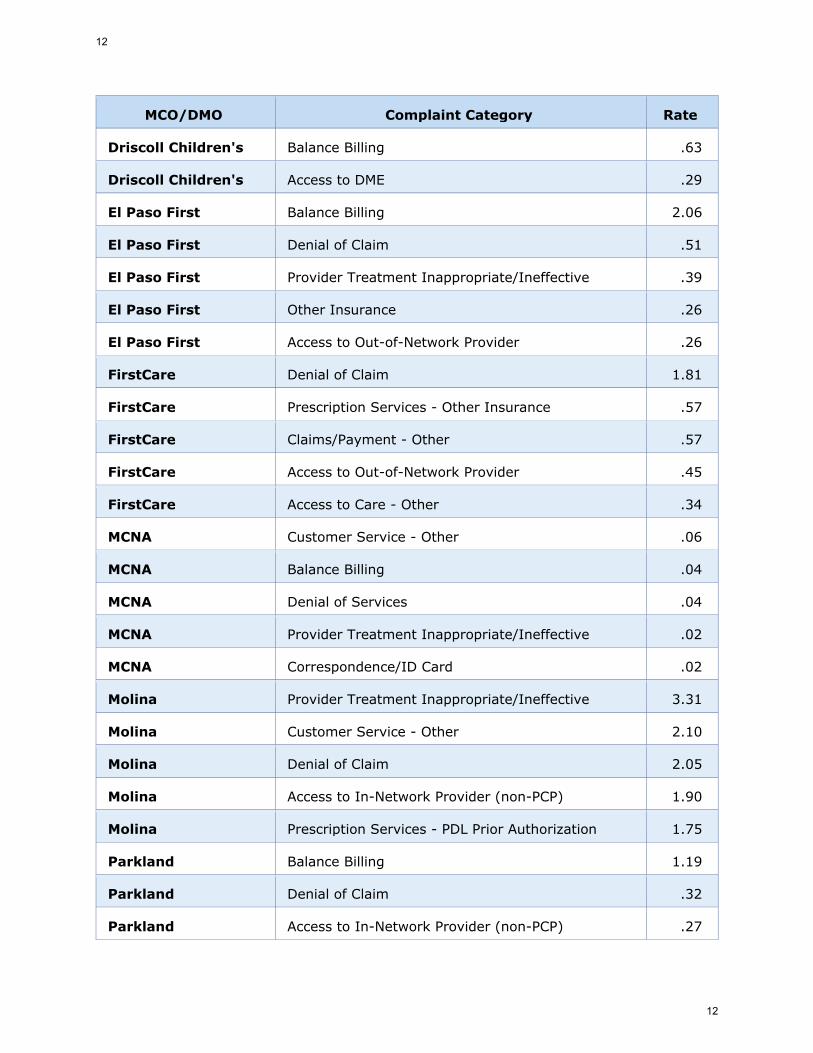
MCO/DMO Complaint Category Rate
Driscoll Children's Balance Billing .63
Driscoll Children's Access to DME .29
El Paso First Balance Billing 2.06
El Paso First Denial of Claim .51
El Paso First Provider Treatment Inappropriate/Ineffective .39
El Paso First Other Insurance .26
El Paso First Access to Out-of-Network Provider .26
FirstCare Denial of Claim 1.81
FirstCare Prescription Services - Other Insurance .57
FirstCare Claims/Payment - Other .57
FirstCare Access to Out-of-Network Provider .45
FirstCare Access to Care - Other .34
MCNA Customer Service - Other .06
MCNA Balance Billing .04
MCNA Denial of Services .04
MCNA Provider Treatment Inappropriate/Ineffective .02
MCNA Correspondence/ID Card .02
Molina Provider Treatment Inappropriate/Ineffective 3.31
Molina Customer Service - Other 2.10
Molina Denial of Claim 2.05
Molina Access to In-Network Provider (non-PCP) 1.90
Molina Prescription Services - PDL Prior Authorization 1.75
Parkland Balance Billing 1.19
Parkland Denial of Claim .32
Parkland Access to In-Network Provider (non-PCP) .27
12
12
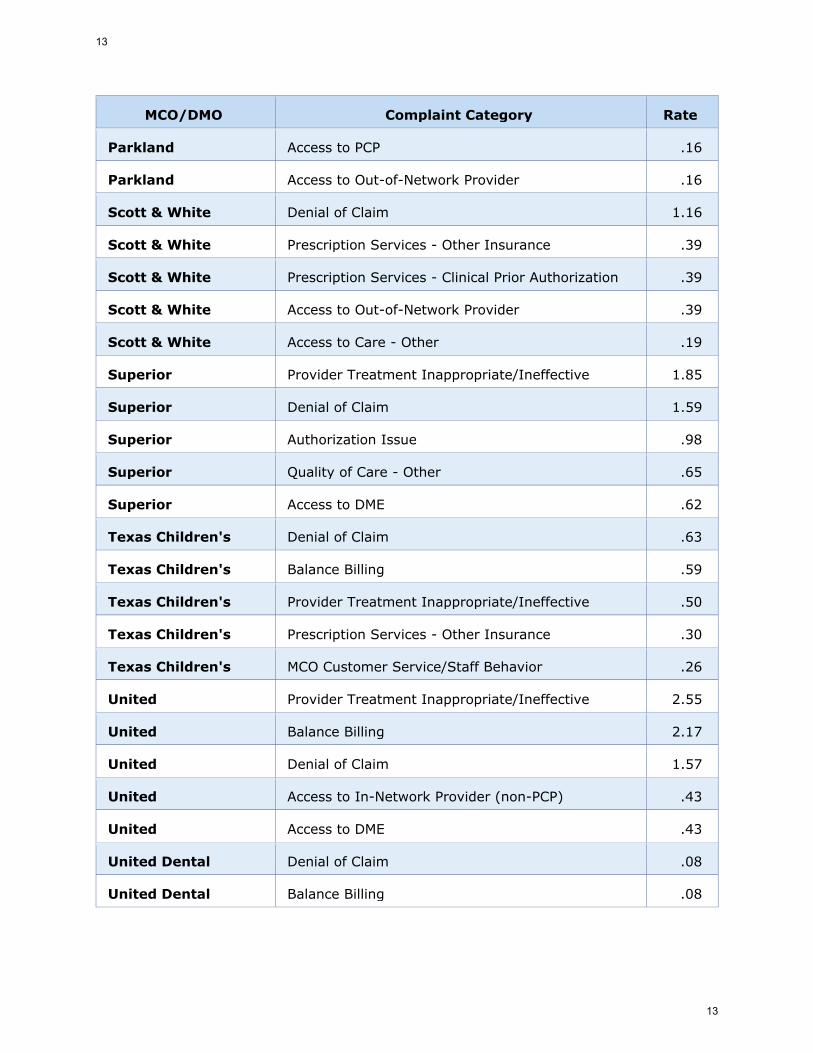
MCO/DMO Complaint Category Rate
Parkland Access to PCP .16
Parkland Access to Out-of-Network Provider .16
Scott & White Denial of Claim 1.16
Scott & White Prescription Services - Other Insurance .39
Scott & White Prescription Services - Clinical Prior Authorization .39
Scott & White Access to Out-of-Network Provider .39
Scott & White Access to Care - Other .19
Superior Provider Treatment Inappropriate/Ineffective 1.85
Superior Denial of Claim 1.59
Superior Authorization Issue .98
Superior Quality of Care - Other .65
Superior Access to DME .62
Texas Children's Denial of Claim .63
Texas Children's Balance Billing .59
Texas Children's Provider Treatment Inappropriate/Ineffective .50
Texas Children's Prescription Services - Other Insurance .30
Texas Children's MCO Customer Service/Staff Behavior .26
United Provider Treatment Inappropriate/Ineffective 2.55
United Balance Billing 2.17
United Denial of Claim 1.57
United Access to In-Network Provider (non-PCP) .43
United Access to DME .43
United Dental Denial of Claim .08
United Dental Balance Billing .08
13
13

HHSC - SFY 2021 Q2
Percentage of Complaints Substantiated - Ombudsman Data
Outcome Aetna Amerigroup BCBS CHCCigna-HealthSpring
CommunityFirst
CookChildren's
DellChildren's
DentaQuestDriscollChildren's
El Paso First FirstCare MCNA Molina ParklandScott &White
SuperiorTexas
Children'sUnited
UnitedDental
Substantiated
Unsubstantiated
Unable toSubstantiate
100%
0%
0%
82%
13%
5%
78%
6%
16%
79%
8%
13%
83%
17%
0%
90%
0%
10%
83%
6%
11%
100%
0%
0%
93%
0%
7%
75%
13%
13%
69%
15%
15%
77%
15%
8%
67%
11%
22%
69%
15%
15%
91%
0%
9%
68%
19%
13%
60%
12%
28%
76%
0%
24%
79%
10%
12%
72%
3%
25%
Substantiated – a complaint where research clearly indicates agency policy was violated or agency expectations were not met.Unsubstantiated – a complaint where research clearly indicates agency policy was not violated or agency expectations were met.Unable to Substantiate – a complaint where research does not clearly indicate if agency policy was violated or agency expectations were met.Percentages may not add up to 100% due to rounding. Complaint outcomes are discrete and do not overlap.
Percentage of Complaints Confirmed - MCS and MCO Self-Reported Data
Outcome Aetna Amerigroup BCBS CHCCigna-HealthSpring
CommunityFirst
CookChildren's
DellChildren's
DentaQuestDriscollChildren's
El Paso First FirstCare MCNA Molina ParklandScott &White
SuperiorTexas
Children'sUnited
UnitedDental
Confirmed
Not Confirmed
Unable toDetermine
0%
0%
100%
1%
38%
61%
0%
14%
86%
3%
25%
72%
32%
32%
37%
0%
20%
80%
0%
46%
54%
19%
24%
57%
11%
40%
49%
0%
21%
79%
14%
38%
48%
0%
65%
35%
0%
44%
56%
2%
27%
71%
0%
3%
97%
11%
53%
36%
14%
42%
45%
0%
47%
53%
3%
25%
71%
0%
28%
72%
Confirmed – resolved or partially resolved in Complainant's favor.Not Confirmed – resolved or partially resolved in MCO’s favor.Unable to Determine – not able to confirm if a complaint is confirmed or not confirmed and complaints not related to MCO actions.Percentages may not add up to 100% due to rounding. Complaint outcomes are discrete and do not overlap.
Count of Complaints by Source: Ombudsman - 832 Complaints, MCS - 391 Complaints, MCO Self-Reported - 3291 Complaints
14
14

Percentage of Complaints Substantiated by MCO/DMO – Ombudsman Data
MCO/DMO Substantiated Unsubstantiated Unable to
Substantiate
Aetna 25% 3% 72%
Amerigroup 12% 10% 79%
BCBS 24% 0% 76%
CHC 28% 12% 60%
Cigna-HealthSpring 13% 19% 68%
Community First 9% 0% 91%
Cook Children's 15% 15% 69%
Dell Children's 22% 11% 67%
DentaQuest 8% 15% 77%
Driscoll Children's 15% 15% 69%
El Paso First 13% 13% 75%
FirstCare 7% 0% 93%
MCNA 0% 0% 100%
Molina 11% 6% 83%
Parkland 10% 0% 90%
Scott & White 0% 17% 83%
Superior 13% 8% 79%
Texas Children's 16% 6% 78%
United 5% 13% 82%
United Dental 0% 0% 100%
Percentage of Complaints Confirmed by MCO/DMO – MCS and MCO Self-Reported Data
MCO/DMO Confirmed Not Confirmed Unable to Determine
Aetna 72% 28% 0%
Amerigroup 71% 25% 3%
BCBS 53% 47% 0%
CHC 45% 42% 14%
Cigna-HealthSpring 36% 53% 11%
Community First 97% 3% 0%
15
15

MCO/DMO Confirmed Not Confirmed Unable to Determine
Cook Children's 71% 27% 2%
Dell Children's 56% 44% 0%
DentaQuest 35% 65% 0%
Driscoll Children's 48% 38% 14%
El Paso First 79% 21% 0%
FirstCare 49% 40% 11%
MCNA 57% 24% 19%
Molina 54% 46% 0%
Parkland 80% 20% 0%
Scott & White 37% 32% 32%
Superior 72% 25% 3%
Texas Children's 86% 14% 0%
United 61% 38% 1%
United Dental 100% 0% 0%
16
16

Overall Rate of Complaints per 10,000 Members by MCO and Quarter
HHSC - SFY 2021 Q2
2021 Q1
Cigna-HealthSpring
BCBS
Molina
Driscoll Children's
United
Superior
Aetna
Amerigroup
Cook Children's
FirstCare
Texas Children's
Dell Children's
Scott & White
CHC
Community First
Parkland
El Paso First
Overall Rate
74.16
39.44
32.26
18.10
13.93
12.95
11.70
9.15
9.02
7.18
6.83
6.57
5.38
4.27
3.84
3.27
2.50
1.76
2021 Q2
Cigna-HealthSpring
BCBS
Molina
United
Superior
Amerigroup
Aetna
Driscoll Children's
Dell Children's
FirstCare
Cook Children's
Scott & White
Texas Children's
El Paso First
Parkland
CHC
Community First
Overall Rate
69.23
28.81
25.29
12.05
11.84
9.26
8.90
7.19
5.59
5.55
5.38
4.84
4.44
4.12
3.23
3.19
3.09
9.93
Rate of complaints for every 10,000 enrolled members. (Complaint Volume / Total Medicaid Enrollment for the Quarter) * 10,000 = Complaints per 10,000.Count of Complaints by Source: Ombudsman - 832 Complaints, MCS - 391 Complaints, MCO Self-Reported - 3291 Complaints
Overall Rate of Complaints per 10,000 Members by DMO and Quarter
DentaQuest
MCNA
United Dental
Overall Rate
.59
.26
.17
.44
DentaQuest
United Dental
MCNA
Overall Rate
.86
.50
.32
.63
17
17

Overall Rate of Complaints per 10,000 Members by
MCO and Quarter
MCO 2021 Q2 2021 Q1
Aetna 8.90 9.15
Amerigroup 9.26 9.02
BCBS 28.81 39.44
CHC 3.19 3.84
Cigna-HealthSpring 69.23 74.16
Community First 3.09 3.27
Cook Children's 5.38 7.18
Dell Children's 5.59 5.38
Driscoll Children's 7.19 18.10
El Paso First 4.12 1.76
FirstCare 5.55 6.83
Molina 25.29 32.26
Parkland 3.23 2.50
Scott & White 4.84 4.27
Superior 11.84 12.95
Texas Children's 4.44 6.57
United 12.05 13.93
Overall Rate 9.93 11.70
Overall Rate of Complaints per 10,000 Members by
DMO and Quarter
DMO 2021 Q2 2021 Q1
DentaQuest .59 .86
MCNA .26 .32
United Dental .17 .50
Overall Rate .44 .63
18
18

Complaint Categories
Category Subcategory
Access to Care – related
to any obstacles that
prevent a Member from
accessing care
Access to Dental Services (adult) – related to
accessing dental services
Access to Care Access to DME – related to accessing Durable Medical
Equipment
Access to Care Access to In-Network Provider (non-PCP) – related to
accessing a specialist within the MCO’s network
Access to Care Access to Out-of-Network Provider - related to
accessing a provider outside the MCO's network
Access to Care Access to PCP - related to accessing Primary Care
Provider
Access to Care
Appointment Availability - related to ability to access
an appointment in a timely manner within contractual
requirements for an in- network Provider
Access to Care Authorization Issue - related to the delay of services
due to concerns with authorization
Access to Care Continuity of Care - related to the disruption of
authorized services
Access to Care Discharge from Facility - related to the disagreement
with a Member's release from facility
Access to Care Home Health - related to home health services
Access to Care Home or Auto Modifications - related to issues with
the delay of installation of home or auto modifications
19
19

Category Subcategory
Access to Care Travel Time/Availability/Distance - related to the length of time and distance required to access
services
Access to Care Other - when the issue does not relate to any other
Access to Care subcategories
Claims/Payment – related
to claims payment issues
Balance Billing - related to a Member receiving a bill
for services rendered.
Claims/Payment Clean Claims Interest Unpaid - related to non-
payment of interest on untimely processed claims
Claims/Payment Denial of Claim - related to the denial of a claim
Claims/Payment Other - when the issue does not relate to any other
Claims/Payment subcategories
Customer Service –
related to the assistance
or advice provided to the
complainant
Correspondence (Incorrect, unclear, or not received) - related to written information provided to complainant
that is incorrect, unclear, or not received
Customer Service
MCO Customer Service / Staff Behavior - related to
how complainant was treated by MCO staff including
rude or inappropriate behavior
Customer Service
Incorrect Information or Guidance from MCO - related
to verbal information provided to complainant that is
incorrect
Customer Service MCO Staff Not Responding - related to MCO staff not
returning complainant's telephone call or email
Customer Service Other - when the issue does not relate to any other
Customer Service subcategories
Customer Service Provider Information Outdated/Directory - related to
issues with the MCO provider directory
20
20
Category Subcategory
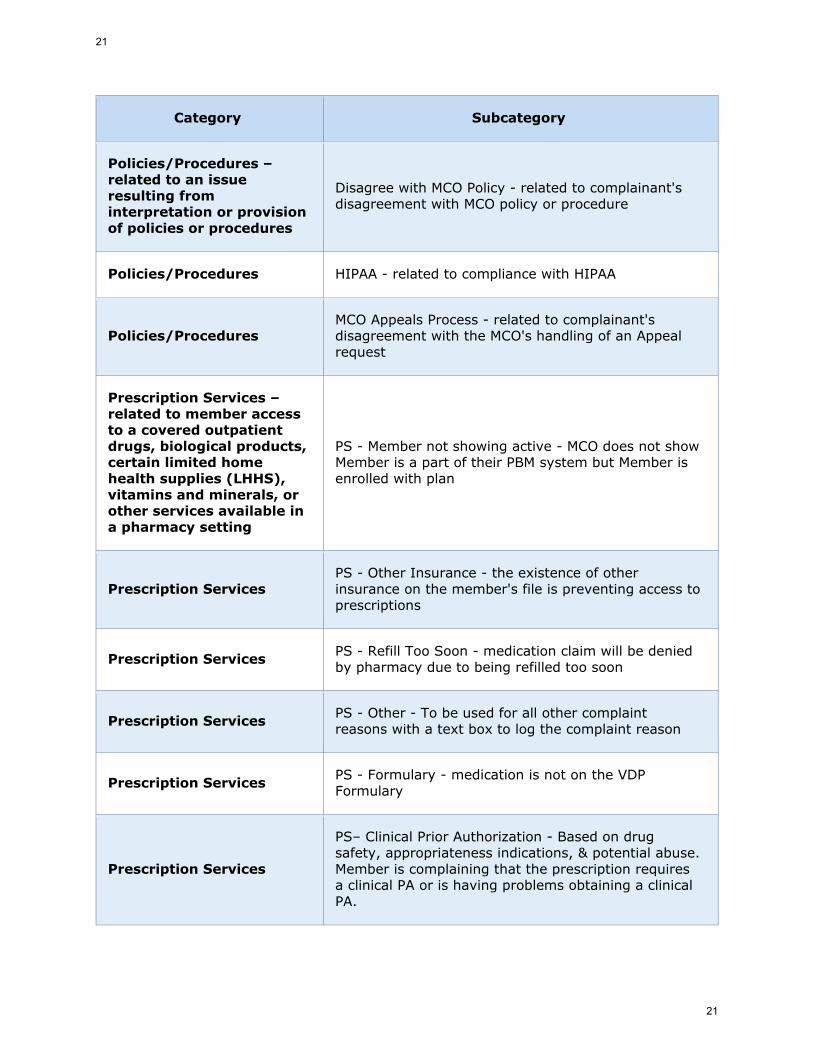
Policies/Procedures – related to an issue
resulting from interpretation or provision
of policies or procedures
Disagree with MCO Policy - related to complainant's
disagreement with MCO policy or procedure
Policies/Procedures HIPAA - related to compliance with HIPAA
Policies/Procedures MCO Appeals Process - related to complainant's disagreement with the MCO's handling of an Appeal
request
Prescription Services –
related to member access to a covered outpatient
drugs, biological products, certain limited home
health supplies (LHHS),
vitamins and minerals, or other services available in
a pharmacy setting
PS - Member not showing active - MCO does not show Member is a part of their PBM system but Member is
enrolled with plan
Prescription Services
PS - Other Insurance - the existence of other
insurance on the member's file is preventing access to
prescriptions
Prescription Services PS - Refill Too Soon - medication claim will be denied
by pharmacy due to being refilled too soon
Prescription Services PS - Other - To be used for all other complaint
reasons with a text box to log the complaint reason
Prescription Services PS - Formulary - medication is not on the VDP
Formulary
Prescription Services
PS– Clinical Prior Authorization - Based on drug
safety, appropriateness indications, & potential abuse.
Member is complaining that the prescription requires a clinical PA or is having problems obtaining a clinical
PA.
21
21
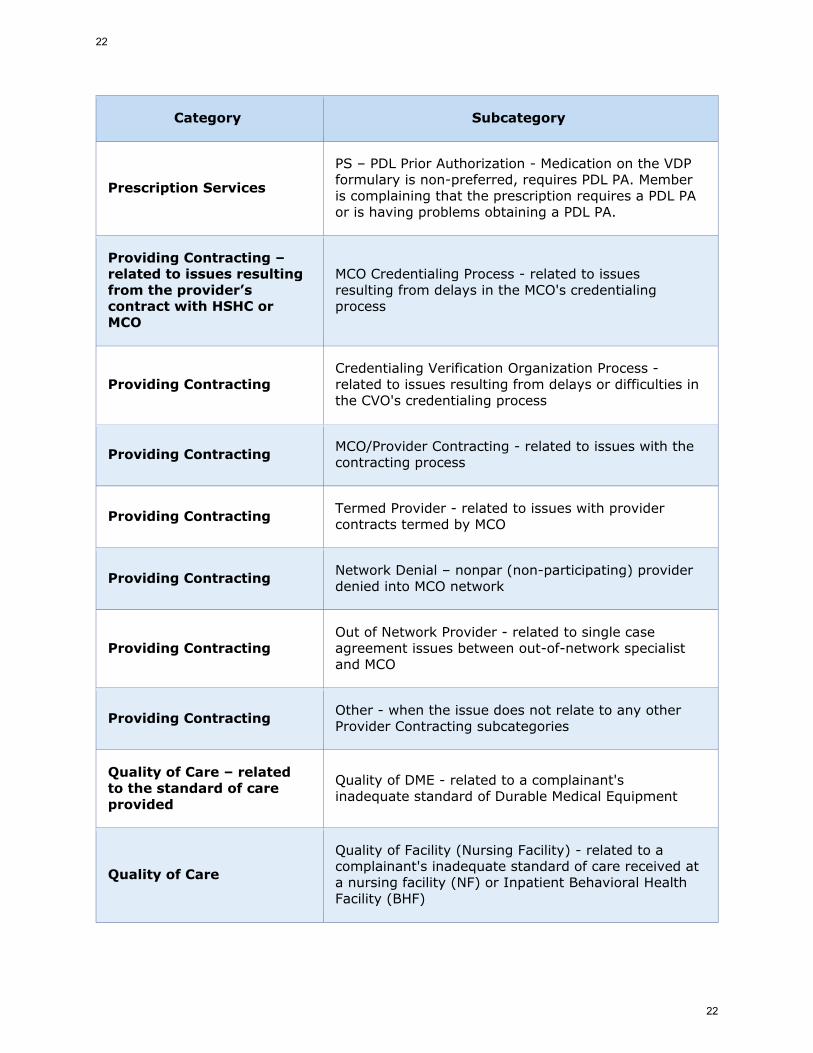
Category Subcategory
Prescription Services
PS – PDL Prior Authorization - Medication on the VDP formulary is non-preferred, requires PDL PA. Member
is complaining that the prescription requires a PDL PA
or is having problems obtaining a PDL PA.
Providing Contracting – related to issues resulting
from the provider’s contract with HSHC or
MCO
MCO Credentialing Process - related to issues
resulting from delays in the MCO's credentialing
process
Providing Contracting
Credentialing Verification Organization Process -
related to issues resulting from delays or difficulties in
the CVO's credentialing process
Providing Contracting MCO/Provider Contracting - related to issues with the
contracting process
Providing Contracting Termed Provider - related to issues with provider
contracts termed by MCO
Providing Contracting Network Denial – nonpar (non-participating) provider
denied into MCO network
Providing Contracting Out of Network Provider - related to single case agreement issues between out-of-network specialist
and MCO
Providing Contracting Other - when the issue does not relate to any other
Provider Contracting subcategories
Quality of Care – related
to the standard of care
provided
Quality of DME - related to a complainant's
inadequate standard of Durable Medical Equipment
Quality of Care
Quality of Facility (Nursing Facility) - related to a complainant's inadequate standard of care received at
a nursing facility (NF) or Inpatient Behavioral Health
Facility (BHF)
22
22
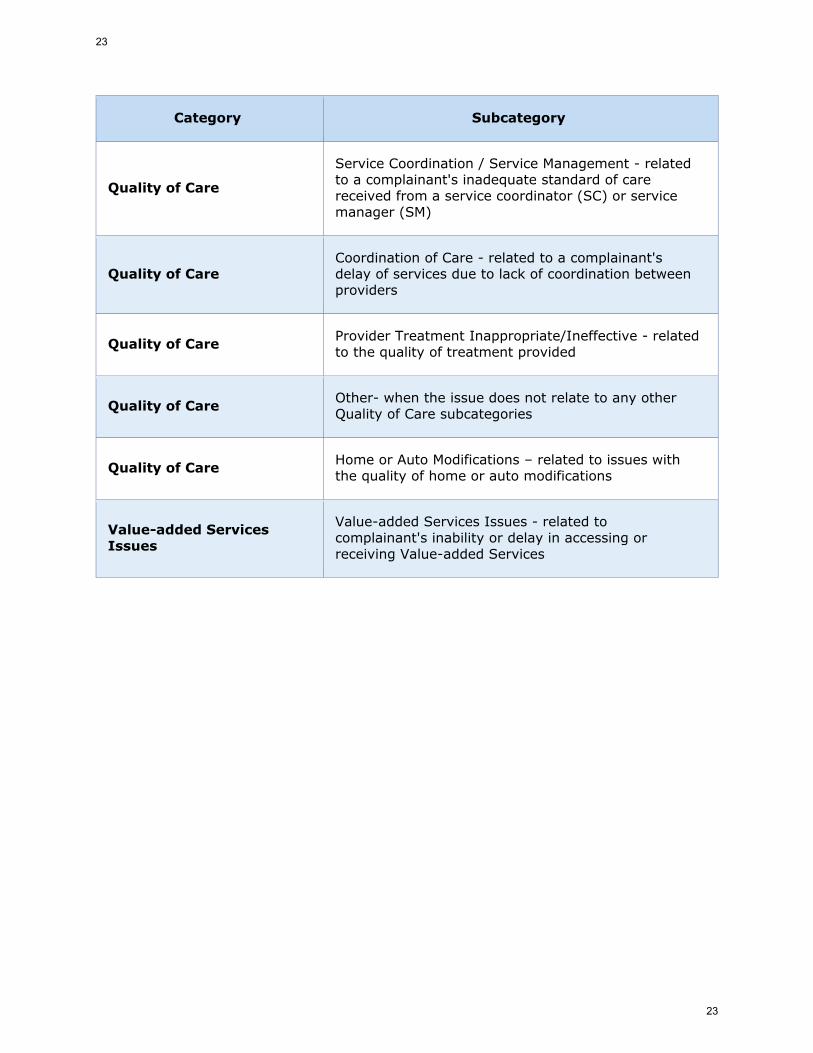
Category Subcategory
Quality of Care
Service Coordination / Service Management - related to a complainant's inadequate standard of care
received from a service coordinator (SC) or service
manager (SM)
Quality of Care Coordination of Care - related to a complainant's delay of services due to lack of coordination between
providers
Quality of Care Provider Treatment Inappropriate/Ineffective - related
to the quality of treatment provided
Quality of Care Other- when the issue does not relate to any other
Quality of Care subcategories
Quality of Care Home or Auto Modifications – related to issues with
the quality of home or auto modifications
Value-added Services
Issues
Value-added Services Issues - related to
complainant's inability or delay in accessing or
receiving Value-added Services
23
23