Embed Size (px)
Citation preview
Hidden Liquidity:
Some new light on dark trading
by
Robert Bloomfield, Maureen O’Hara, and Gideon Saar*
June 2012
*Robert Bloomfield ([email protected]), Maureen O’Hara ([email protected]), and Gideon Saar ([email protected]) are from the Johnson Graduate School of Management, Cornell University. We thank Alyssa Andersen for valuable research assistance. We would like to thank Michael Goldstein, Andrew Karolyi, Yelena Larkin, and seminar participants at Cornell University, FINRA, University of Notre Dame & NASDAQ OMX Conference on Current Topics in Financial Regulation, and the University of Illinois for helpful comments. We thank the Notre Dame finance faculty and NERA Economic Consulting for awarding us the Best Paper Prize at the Conference on Current Topics in Financial Regulations.

Abstract
We use a laboratory market to investigate how the ability to hide orders affects traders’ strategies and market outcomes. We examine three market structures: Visible markets in which all orders must be displayed, Iceberg markets in which a minimum size must be displayed, and Hidden markets in which orders can be displayed, partially displayed, or completely non-displayed. We find that although order strategies are greatly affected by allowing hidden liquidity, most market outcomes are not. Our results on the robustness of informational efficiency and liquidity to opacity regimes have important regulatory implications for debates surrounding dark trading. We also find that opacity appears to increase the profits of informed traders but only when their private information is very valuable.

3
Hidden Liquidity: Some new light on dark trading
1. Introduction
Hidden liquidity is now a standard feature of trading in equity markets. Virtually all
exchanges allow traders to “hide” all or a portion of their orders on the book, resulting in market
liquidity having both a displayed and a non-displayed component. Although non-displayed
orders generally lose priority to displayed orders at a given price, the invisibility of these orders
can be valuable for a variety of trading strategies. With orders hidden, however, market
participants have only incomplete knowledge as to the overall depth in the market. Moreover,
the ability to put hidden orders inside the displayed spread means that even the best prevailing
prices are not observable. This evolution to dark trading in exchange markets has gained
momentum in recent years, driven in part by the rise of crossing networks (which also allow
traders to hide their trading intentions) and by competitive pressures from new exchanges and
trading platforms. Despite the 1975 Congressional mandate that U.S. equity markets be
transparent, the reality is that markets are becoming increasingly opaque.
Regulators both here and abroad are questioning the role that hidden liquidity plays in
markets.1 Much of this regulatory scrutiny has focused on “dark pools” or crossing networks,
but the hidden liquidity in exchange settings is actually of comparable or greater importance,
with estimates of approximately 20% of marketable orders executing against non-displayed
depth in U.S. markets.2 Advocates argue that hidden orders enhance market performance by
helping traders shield their trading intentions from the predations of opportunistic traders.
Critics counter that these advantages to individual traders come at the expense of the market as
whole by degrading the liquidity and informational efficiency of the market. Virtually everyone
agrees, however, that the existence of hidden orders has increased uncertainty about the level of
liquidity in the market and led to a variety of complications such as pinging (i.e., placing and
1 The SEC and the Ontario Securities Commission (the main Canadian regulator) have introduced new rules for dark trading, while European regulators are debating transparency rules in a revised MiFid framework. 2 Hasbrouck and Saar (2009) find that approximately 15% of marketable orders execute against hidden depth in a sample of stocks traded on Inet in 2004. These numbers increase to 17.3% and 19.0% in 2007 and 2008, respectively, for a NASDAQ dataset investigated in Hasbrouck and Saar (2011). By comparison, Rosenblatt securities estimates that U.S. dark pool activity was 11.26% of U.S. volumes in August 2011, see “Dark Pools Lose out to Exchanges,” Financial Times, Sept. 27, 2011.
4
cancelling orders simply to ascertain the existence of hidden orders on the book) and increased
message traffic.3
Resolving debates over whether traders should be allowed to hide all, some, or none of
their orders is complicated by a variety of factors. One is simply that all markets now feature
hidden liquidity, making comparisons to the counterfactual difficult. Additionally, markets often
adopt new opacity regimes in response to competitive pressures, complicating before-and-after
analyses. Moreover, trader behavior should be affected by market design, suggesting that any
analysis should examine how hidden liquidity affects order strategies (which are typically
unobservable to both market participants and academic researchers). These difficulties have
limited the ability of even the most insightful empirical and theoretical analyses to draw
definitive conclusions as to the market consequences of different opacity regimes.
In this paper, we use an experimental methodology to investigate how non-displayed
liquidity affects the market environment. Our analysis features informed traders who receive
signals about the true value of securities and liquidity traders who must meet portfolio targets.
Markets operate continuously, allowing traders to implement a variety of trading strategies. Our
trading platform features an electronic limit order book in which traders can enter orders of
different sizes that can be cancelled at any time, choose to make liquidity (by placing limit orders
in the book) or take liquidity (by hitting existing limit orders), and choose (depending on the
rules of the market) to display or not display all or part of any order.4 Execution priority rules in
our trading platform resemble those in actual markets, where displayed orders have priority over
non-displayed orders. Overall, the functionality of our trading platform mimics that of current
electronic markets, and it allows us to investigate the effects of transparency on trader and
market behavior.
We investigate three market structures: Visible markets in which all orders must be
displayed, Iceberg (or reserve) markets that allow both displayed and partially displayed orders
3 Nonetheless, we note that the issue of non-displayed liquidity existed before the advent of fully electronic markets. Blume and Goldstein (1997), for example, discuss NYSE “not held” orders whereby clients instructed floor brokers to use their discretion in executing the orders. Floor brokers often chose not to display such orders in the book so that their existence is not revealed, but nonetheless participated in the trading process in a discretionary way. Non-displayed orders in electronic markets can be viewed as an attempt to replicate at least some of the services performed by floor brokers. 4 See Bloomfield, O’Hara, and Saar (2005) for analysis of the make-or-take decision in an electronic market.

5
(i.e., a minimum size must be displayed and the remainder can be non-displayed), and Hidden
markets in which orders can be displayed, partially displayed, or completely non-displayed.
Trading takes place in only one type of market at a time. We then compare equilibria across the
three market structures, having employed experimental controls for learning, cohort, and other
effects known to influence experimental studies. We test hypotheses suggested by the literature
on how opacity (or the ability to utilize non-displayed liquidity in the book) affects trader
behavior, with a particular focus on the disparate effects on informed and liquidity traders. We
also investigate how opacity affects the overall performance of the market as captured by various
liquidity and informational efficiency measures.
We seek to answer two basic questions. First, does the ability to hide liquidity affect
trader behavior (and if so how)? Second, is market performance degraded when liquidity can be
hidden? The short answer to the first question is yes, and by a lot, while the answer to the
second question appears to be no, at least not by much.
Specifically, we find that both informed and liquidity traders use non-displayed orders if
permitted, but informed traders strategies are more sensitive to changes in the opacity regime of
the market. We observe that informed and liquidity traders respond differently to the ability to
hide liquidity. For example, liquidity traders (who need to trade for reasons other than
information about fundamentals) trade more aggressively by taking liquidity when the market is
opaque. As transparency increases and liquidity traders are better able to assess depth in the
book, they become less aggressive and are willing to wait for the execution of their limit orders.
In contrast, informed traders trade less aggressively (i.e., utilize limit orders to execute more of
their trades) in an opaque environment that enables them to maintain their informational
advantage for a longer time.
Our results concerning market performance highlight the remarkable manner in which
trader strategies aggregate to create equilibrium outcomes. We find that giving traders the ability
to control the exposure of their orders increases limit order book depth. Still, other liquidity
measures such as “true” spreads (that reflect both displayed and non-displayed orders) or volume
are not different across the three opacity regimes. As for informational efficiency, markets where
all orders must be displayed exhibit more efficient prices at the open but this advantage fades

6
quickly as trading progresses. Throughout most of the trading period, whether or not traders can
hide liquidity in the book has no impact on the informational efficiency of prices.
Thus, we find that while order strategies are greatly affected by allowing hidden liquidity,
most market outcomes are not. Our results brings to mind Vickrey’s (1961) classic “irrelevance
result” that auction design does not matter because trader strategies adjust to the rules of the
auction so that revenue to the seller is unchanged.5 That market equilibrium features a similar
robustness to opacity regimes should be an important, and reassuring, finding to market
regulators. Still, it is important to recognize that the experience of market participants could
differ markedly when markets are opaque even if market outcomes are similar. We find that
displayed spreads are almost twice as large as true spreads in Hidden markets, and informed
traders’ profits are higher in these markets as well when their private information is very
valuable. Perhaps as a consequence, liquidity traders in our experiment prefer to trade in less
opaque markets and consider them to be fairer.
Our research complements the literature on pre-trade transparency in markets,
particularly studies of hidden liquidity in electronic limit order books. Madhavan, Porter, and
Weaver (1999), Baruch (2005), and Boulatov and George (2012) compare markets that mandate
the degree of pre-trade transparency (either transparent or opaque). Buti and Rindi (2008) and
Moinas (2010), which are the most related theoretical analyses to our paper, look at how traders’
choices on whether to display all or part of their orders affect their strategies and market
outcomes. These two papers provide interesting insights, but generally require a variety of
restrictive assumptions for tractability. For example, the Buti and Rindi (2008) model includes
only uninformed traders, while in Moinas (2010) informed traders can only supply liquidity (but
not demand it). Our experiment has a more general structure for the information sets and
strategies traders can adopt, allowing us to see if predictions from these models generalize to less
restrictive settings.
Empirical studies, drawing on data from a variety of markets, also attempt to characterize
the usage of non-displayed orders and investigate their information content (see Aitken,
5 Vickrey’s original result considered optimality in second-price auctions, but the revenue equivalence theorem was shown to hold more generally by Myerson (1981).

7
Berkman, and Mak (2001), Belter (2007a,b), Bessembinder, Panayides, and Venkataraman
(2009), De Winne and D’Hondt (2007), Frey and Sandas (2009); Harris (1996, 1997), and
Kumar, Thirumalai and Yadav (2010)). To a large extent, however, these papers are unable to
observe traders’ strategies or their information sets, and hence use indirect evidence (e.g., price
impact of orders, return forecasting ability) to infer whether hidden orders are more attractive to
informed or uninformed traders. In contrast, we directly observe in our experiments which
traders use non-displayed orders, and are therefore able to characterize their strategies in more
detail.6
We share with these papers the view that understanding non-displayed order flow is
important for making an inference about market quality. In particular, many empirical
investigations rely solely on displayed data. Applying such analyses to our Hidden regime
would lead to incorrect inferences, as displayed liquidity measures differ markedly from the
“true” levels of spreads and depths. The increase in opacity of markets worldwide will only
exacerbate this problem. Our work therefore relates to empirical work looking at the market
environment before and after changes to transparency rules (e.g., Anand and Weaver (2004),
Boehmer, Saar, and Yu (2005), and Madhavan, Porter and Weaver (2005)). Our analysis
provides insights into whether changes in market behavior observed in empirical studies truly
reflect changes in the transparency regime or arise for other reasons.7
The paper is organized as follows. The next section describes our experimental markets,
the treatments and controls that constitute our experimental design, and the statistical approach
we use to evaluate the data. Section 3 presents our results on order usage, informed and liquidity
trader strategies, liquidity provision, the informational efficiency of prices, trading profits, and
trader perception of the desirability of different opacity regimes. Section 4 is a conclusion.
6 There are, of course, issues we do not address in our experimental framework. For example, Bessembinder, Panayides, and Venkataraman (2009) examine whether traders can infer the presence and quantity of non-displayed shares in the book based on stock and market conditions. Our results are consistent with traders doing so, but we do not explicitly study this issue. 7 In particular, market structure changes are subject to the problem that if markets changed once they can change again. This can give traders an incentive to game market changes they do not like by acting in ways to sabotage new market designs. Experimental approaches, like ours, provide a way to observe the effects of structural changes without such gaming effects on traders’ behavior.

8
2. The Experiment
We now describe the experiment and the specific features of our markets. As in
Bloomfield, O’Hara, and Saar (2009), we use the following terms: A cohort is a group of traders
who always trade together. A security is a claim on a terminal dividend, and is identified by the
liquidating dividend, distribution of information, and liquidity targets (described below). A
trading period is an interval during which trading can occur for a specific security. Only one
security is traded in each trading period. Unless otherwise indicated, all prices, values, and
winnings are denominated in laboratory dollars ($), an artificial currency that is converted into
US currency at the end of the experiment.8
2.1. Experimental Design
We created markets in which informed traders and liquidity traders can buy and sell
securities. Each security pays a single liquidating dividend drawn from the bell-shaped
distribution shown in the Instructions for a Market Experiment (see Appendix A). Trading in
each security lasts 180 seconds.
Each market includes four informed traders. Two informed traders observe the sum of the
true liquidating dividend plus a predetermined random number (different for every security),
while the other two observe the sum of the true liquidating dividend minus the same
predetermined random number for that security. This structure guarantees that each informed
trader has imperfect information about security value, but that the informed traders in the
aggregate have perfect information. Imperfect information means that trading on private
information is still risky for the informed traders (before prices fully adjust), while aggregate
certainty simplifies the trading task (see Lundholm (1991)), and guarantees that the rational
expectations equilibrium price equals the true liquidating dividend.
Each market also includes four liquidity traders. Liquidity traders are assigned trading
targets (in terms of number of shares) they must achieve before the end of trading if they are to
avoid a penalty equal to $100 for each unfulfilled share.9 Two traders need to build up a position
8 Parts of the experimental design are drawn from Bloomfield, O’Hara, and Saar (2009), and for clarity of exposition we use the same wording (when possible) to describe features of the experiment. 9 The use of trading targets is standard in experimental work (see Lamoureux and Schnitzlein (1997), Bloomfield and O’Hara (1998, 2000), Cason (2000), and Bloomfield, O’Hara, and Saar (2005, 2009)), and it captures the notion

9
of 30 shares in one direction and the other two need to build up a position of 40 shares in the
other direction. Each participant in the experiment trades half of the securities in a session as an
informed trader and the other half as a liquidity trader, alternating between the two roles. We
designed the experiment in this manner to ensure that participants thought about the market
interaction from both perspectives, thereby helping them focus on strategies that are optimal
given the strategies of all other traders in the market.
Our primary experimental manipulation alters the rules governing the opacity of traders’
orders for each security traded (henceforth, the opacity regimes). In a Visible market, every
share of each order is displayed. In an Iceberg market, traders must display one or more shares of
each order (i.e. non-displayed shares are allowed, but one share in an order must be displayed at
all times). This implies that the best prices in the book are always displayed to all market
participants even if there is uncertainty about depth at these prices.10 In a Hidden market, traders
can display any number of shares in an order, including zero, so an entire order could be hidden
from view.
We also manipulate both the dispersion of information provided to informed traders and
the extremity of security value. The extremity and dispersion manipulations are meant to alter
the information asymmetry environment. Specifically, extremity signifies the value of the
informed traders’ private information; the farther away the security value is from its expected
value, the more informed traders can profit from their information. In the high-extremity setting,
the liquidating dividend of the security deviates by at least $17 from its unconditional expected
value of $50, while in the low-extremity setting it deviates by no more than $16. As for signal
dispersion, lower dispersion means that informed traders face less uncertainty about the true
value, and hence this manipulation affects both adverse selection and the perceived riskiness of
the asset. In the high-dispersion setting, informed traders know that the liquidating dividend is
that liquidity traders are transacting for exogenous reasons (e.g., risk sharing, consumption) that are unrelated to information. 10 Traders could submit orders of up to 99 shares, and had complete freedom to display all or only some of the shares as long as one share was displayed. We did not design the experiment to test the effects of varying the size of the mandatory displayed portion of an order (see Esser and Mönch (2007) for a theoretical model that focuses on this issue).

10
within $10 of their signal; in the low-dispersion setting, informed traders know that the
liquidating dividend is within $2 of their signal.11
Our experimental design consists of manipulating all three factors (opacity regime,
dispersion, and extremity) in a fully-factorial 3x2x2 within-subjects design, as shown in Panel A
of Table 1. Every cohort experiences all 12 possible combinations of settings. In addition to
increased power, the main advantage of the within-subjects design (where each trader
participates in all cells of the 3x2x2 design) is the reduction in error variance due to individual
differences. Although we randomly assign participants, two groups of traders could by chance
have attributes that differ in important ways and that could impact the dependent variable. Using
a within-subjects design neutralizes such differences because we effectively compare the trading
of the same traders across the cells of the experimental design. To ensure that our results are not
driven by the specific order in which the traders experience the three opacity regimes, we varied
across cohorts the order in which the opacity regimes were introduced as shown in Panel B of
Table 1. We also ensured that there was minimal correlation between the net target of the
liquidity traders and the value of the liquidating dividend or the value of the informed traders’
information overall and within each opacity regime.
Traders always know the regime they trade in and the dispersion of informed traders’
information. They do not know value extremity or the net target of the liquidity traders, though
they can draw reasonable inferences about the former if they are an informed trader, and about
the latter if they are a liquidity trader. Traders are never told the identities of other informed and
liquidity traders.
2.2. Trading
Traders start each trading period with zero endowments of cash and shares. Unlimited
negative cash and share balances are permitted, so traders can hold any inventory of shares they
desire, including short positions. The unlimited ability to short-sell balances the unlimited ability
to borrow, eliminating the risk of price bubbles driven by excess cash in the market (as observed
11 The extent of adverse selection in Moinas (2010), which is one of the two theoretical models on non-displayed orders in limit order books, is governed by the probability of arrival to the market of (or order submission by) the informed trader. In our experiment, the arrival of informed order flow is endogenous rather than exogenous (we are interested in investigating the determinants of informed traders’ arrival), and hence we manipulate other, more basic, features of the environment.

11
by Caginalp et al. (2001)). Traders are told that at the end of trading shares pay a liquidating
dividend equal to their true value. A trader’s net trading gain or loss for a security then equals
the value of their final share holdings plus or minus their ending cash balance. Any penalties
assessed to a liquidity trader for failing to hit a target are deducted from this trading gain or
added to the trading loss.
Our double auction market is organized like a typical electronic limit order book where
traders can enter buy or sell limit orders of up to 99 shares each. Limit orders to buy or sell a
security have integer prices between 0 and $100. All shares are publicly displayed on the order
book in the Visible market. In the other two opacity regimes, the trader chooses the number of
shares to be publicly displayed, ranging from the total number of shares down to one in the
Iceberg market and zero in the Hidden market. Once a trader enters an order containing
displayed shares, the book of publicly-displayed shares is updated on all traders’ computer
screens, indicating that an unidentified trader is willing to buy or sell the indicated number of
shares at the posted price. Traders can enter as many orders as they desire during the trading
period in each security. Traders can cancel or modify any of their unexecuted limit orders in the
book at any time during the trading period. All trades are reported immediately to all traders,
indicating the price and the trade direction. As can be seen in Figure 1, which provides a typical
screen shot from the experimental interface, traders continuously observe on the screen their
current position (in terms of shares and cash), the number of shares they bought or sold, and the
average price they paid for the shares they bought or sold.
Trades occur whenever a trader enters a limit order that crosses with an existing limit
order by stating a bid price equal to or greater than an existing ask, or entering an ask price equal
to or less than an existing bid. In the Hidden market, the best bid and ask prices need not have
been displayed in the book. Orders execute one share at a time, following strict
price/visibility/time priority rules. Specifically, a share at a better price (for example, a higher
price for a buy order) has priority over a share at a worse price. Within each price level,
displayed shares in limit orders execute first. Within each price/visibility level, older shares
execute first. In the Iceberg market, the execution of the last displayed share in an order results

12
in a non-displayed share in the order turning into a displayed share, thus guaranteeing that at
least one share in each order is always displayed.
2.3. Subjects, Training, and Incentives
The experiments were conducted in the Business Simulation Laboratory (BSL) at the
Johnson Graduate School of Management at Cornell University. Over 120 students attended a
75-minute training session that included a review of instructions and practice trading in all three
opacity regimes. Of those traders, 96 returned for a second 75-minute session during which data
was collected. Hence, the experiment was comprised of 12 cohorts of 8 students each. Those
students were split evenly by gender (53% male, 47% female), with a preponderance of
undergraduate students (59%) and the rest in various graduate programs.
Each participant was paid US$65 plus or minus US$5 for every 1000 laboratory dollars
gained or lost through trading and/or penalties, to a minimum of $10. This minimum was paid to
only a few of the 96 subjects, indicating that most traders likely did not engage in risk-seeking
behavior due to the truncation of downside risk. Participants were told the explicit formula used
to compute their winnings (see instructions in Appendix A), to ensure that they unambiguously
understood the incentives in the experiment.
2.4 Statistical Analysis
We use repeated-measures ANOVA, which is a conservative and robust procedure for
analyzing experimental data. A repeated-measures analysis effectively treats each cohort as
providing a single independent observation of the dependent variable. This design reduces the
problem, common in experimental economics, of overstating statistical significance by assuming
that repetitions of the same actions by the same group of subjects are independent events.
For analyses of individual-level variables (such as the submission rate of limit orders), we
compute the dependent variable within each cell (defined by the appropriate factors) for the
average trader of a certain type to get one number for each cohort that we can use in the
ANOVA. Our base statistical analysis for individual-level variables has a factorial structure of
2 (trader type: Informed and Liquidity) x 3 (market structure: Hidden, Iceberg, and Visible) x 2
(extremity of realized value: Low and High) x 2 (signal dispersion: Low and High), where the

13
last two factors are elements of the environment that have been linked in theoretical models to
the extent of information asymmetry.
Unlike Bloomfield, O’Hara, and Saar (2005), our focus is not on investigating how
information asymmetry affects trading per-se, but rather to see whether it affects the propensity
to hide shares in the book. In general, how information asymmetry impacts trading in our
experiment is similar to that documented in Bloomfield, O’Hara, and Saar (2005), and hence the
extremity and signal dispersion manipulations are discussed only if they interact with the opacity
regime to affect the strategies and profits of traders or the quality of markets.
Because non-displayed shares are only allowed in the Hidden and Iceberg markets, some
of the tests are done with only two levels for the market structure. For other purposes, whether
levels for Hidden and Iceberg are different from zero (which is by definition the level in the
Visible market) or different from each other matters, and so we report both the two-level and
the three-level tests for the market structure (identified in the text as “two-market p-value” and
“three-market p-value”).Our statistical analysis for market-level variables (e.g., book depth)
often looks not just at the differences across the three market structures (Hidden, Iceberg, and
Visible), but also how the market variables change over time. We therefore compute the
variables of interest separately in each of the six 30-second time intervals within the trading
period. For these variables we add another factor, Time, to the ANOVA.12
3. Results
3.1 Who Uses Non-Displayed Orders?
We begin with summary statistics to provide a sense of the interactions of traders in our
markets. Informed traders submit more orders than do liquidity traders: 7.6 orders per informed
trader per security compared with 5.8 orders per liquidity trader per security (p-value = 0.0006).
The average order size is also much larger for the informed traders: 60.48 shares versus 37.21
shares for the liquidity traders (p-value < 0.0001). The order size, however, does not seem to be
12 In the text of the paper, we provide the p-values for the ANOVA main effects in parentheses without specifically mentioning the factor (it can be understood from the context of the sentence), while interactions are specifically stated in parentheses next to the p-values. In a few of instances where the variables under investigation can be either positive or negative (e.g., trading profit), we also examine the hypothesis of zero value using a t-test.

14
sensitive to the market structure: the average order size of the informed traders is 61.7, 60.4, and
59.3 in the Hidden, Iceberg, and Visible markets, respectively, and these are not statistically
distinguishable from one another. Liquidity traders also do not show systematic variability across
markets: 39.3, 35.7, and 36.6 for the three markets, respectively. Hence, informed traders do not
offer more shares when they can hide their trading intentions, and liquidity traders do not use
larger orders when they can utilize non-displayed shares to potentially inhibit stepping ahead.
A key interest in this paper is how the ability to hide shares in the limit order book affects
traders’ strategies. Panel A of Figure 2 presents data on displayed limit orders (DLO) and non-
displayed limit orders (NDLO) submitted by the two trader types. Informed traders submit more
displayed and non-displayed (shares in) limit orders than do liquidity traders (p-value < 0.0001
for DLO; p-value = 0.0002 for NDLO). Both trader types decrease the submission of displayed
limit orders and increase the submission of non-displayed orders when they can hide shares in
the book. While the utilization of non-displayed shares increases with the opaqueness of the
market structure for both trader types (three-market p-value < 0.0001, two-market p-value =
0.0202), informed traders alter their strategies more than liquidity traders do. Specifically,
submission of displayed (non-displayed) limit orders by informed traders decreases (increases)
much more than submission of displayed (non-displayed) orders by the liquidity traders
(Market*Type p-value = 0.0008 for DLO; Market*Type two-market p-value = 0.0246 for
NDLO). These results demonstrate that informed traders are more sensitive to changes in the
opacity regime of the market. However, the difference we detect across markets is mainly a
substitution between displayed and non-displayed shares; the total number of limit orders
submitted does not vary significantly across markets.
Panel B of Figure 2 looks at displayed and non-displayed shares in marketable orders
(i.e., limit orders that are priced for immediate execution upon arrival to the market). Informed
traders submit more displayed (shares in) marketable orders than do liquidity traders (p-value =
0.0351), but this effect is not the same across the market structures (Market*Type p-value =
0.0298). In the Visible market, informed traders submit more than twice the number of displayed
marketable orders that liquidity traders submit, while in the Hidden market the two trader types
submit about the same number. As for non-displayed shares in marketable orders, they are used
15
much more by the informed traders than by the liquidity traders (p-value = 0.0065), and while all
traders exhibit greater use of the non-display capability in the Hidden market than in the Iceberg
market (two-market p-value=0.0120), the difference between informed and liquidity traders is
more pronounced in the Hidden market (two-market Market*Type p-value = 0.0106). Here as
well, when informed traders are given the ability to submit non-displayed shares to the market,
they do so more than the liquidity traders.
The empirical literature, to a large extent unable to observe whether traders possess
private information, attempts to answer the question of who (informed or uninformed traders)
uses non-displayed orders mainly by analyzing indirect evidence. For example, some authors
study the price impact of displayed and partially-displayed orders (Aitken, Berkman, and Mak
(2001)), others look at execution of orders that reveal the existence of non-displayed book depth
(Pardo and Pascual (2006) and Frey and Sandas (2009)), analyze execution costs (Bessembinder,
Panayides, and Venkataraman (2009)) or study the predictive power of displayed and non-
displayed depth for intra-day returns (Belter (2007a)). These empirical papers reach conflicting
conclusions as to whether informed or uninformed traders use non-displayed orders.
We designed the experiment to include both informed and liquidity traders, and the
summary statistics demonstrate that (i) both trader types submit non-displayed shares, and (ii) the
informed traders’ submission patterns are more sensitive to changes in the transparency of the
market.13 We now address how transparency affects the strategies informed and uninformed
traders pursue.
3.2 Who Supplies and Demands Liquidity?
Limit orders and marketable orders are alternative ways to trade, but they have very
different effects on the market. A limit order adds liquidity to the book and awaits an uncertain
execution, while a marketable order removes liquidity from the book with an immediate
execution. The submission rate of limit orders measures a trader’s propensity to provide
liquidity. We define the submission rate of limit orders (SR) to be the number of shares in limit
orders divided by the total number of shares submitted (in both limit and marketable orders).
13 The result that both liquidity traders and informed traders utilize non-displayed shares in an experimental setting is also documented in Gozluklu (2009).
16
Panel A of Table 2 shows that informed traders provide liquidity a bit more than liquidity traders
do (87.14% versus 80.76%, p-value = 0.0029). This behavior does not vary across market
structures: the submission rate of limit orders for either investor type is remarkably similar in the
Hidden, Iceberg, and Visible markets.
What does change across market structures is the degree to which the traders use
displayed versus non-displayed shares to provide liquidity. The displayed (non-displayed)
submission rate, DSR (NDSR), is defined as the number of displayed (non-displayed) shares in
limit orders divided by the total number of shares submitted in limit and marketable orders (i.e.,
DSR+NDSR=SR).14 The displayed submission rate of both trader types declines significantly
when traders can hide shares in the book (p-value < 0.0001), while the non-displayed submission
rate increases (three-market p-value < 0.0001, two-market p-value = 0.0205).The ability to avoid
displaying shares in the Hidden market is deemed so attractive by the informed traders that the
non-displayed submission rate is approximately half the overall submission rate (42.7% out of
88.2%).
That the informed traders’ submission rate of limit orders is larger than that of the
liquidity traders is primarily driven by the greater willingness of the informed traders to provide
liquidity with non-displayed shares, as their displayed submission rates are rather similar. In
particular, the non-displayed submission rate of informed traders in the Hidden market is 42.7%
vs. 31.9% for the liquidity traders, and similarly, 34.0% vs. 23.7% in the Iceberg market (two-
market p-value = 0.0059). Hence, hiding trading intentions when supplying liquidity appears to
be more attractive to the informed traders than it is to the liquidity traders. One interpretation of
this result is that informed traders in our experiment are worried about revealing their
14 We would like to point out a terminology convention that we use when discussing the results. To enable a breadth of strategies similar to that in actual markets, our traders can submit orders for multiple shares, each such order can be partially displayed and partially non-displayed, and each such order can in principle be partially marketable (executed upon arrival to the market) and partially a regular limit order (e.g., remaining in the book at the limit price after exhausting the depth up to that price). Hence, to define many of the measures of interest we cannot use these orders as our unit of measurement. Rather, we need to use the number of shares in the order that corresponds to a certain category (e.g., the number of displayed shares in an order that were executed upon arrival to the market). To simplify the exposition, we use the usual terminology, for example, referring to the “submission rate of non-displayed limit orders” when the exact definition is the number of non-displayed, non-marketable shares submitted to the book divided by the total number of shares in orders that were sent to the market.

17
information more than the liquidity traders are concerned with the ease at which they are being
picked off.
Because execution of limit orders is uncertain, the fill rate of these orders is of great
interest to traders. In fact, Security and Exchange Commission Rule 605 (formerly 11Ac1-5)
requires all market centers in the U.S. to report publicly the fill rate of limit orders. We define
the fill rate as the number of executed shares in limit orders divided by the total number of shares
submitted in limit orders. We separate the fill rate into a displayed component (executed
displayed shares in limit orders divided by total number of shares submitted in limit orders,
DFR) and a non-displayed component (executed non-displayed shares in limit orders divided by
the total, NDFR). Panel B of Table 2 shows that the fill rate of the liquidity traders is higher than
that of the informed traders (p-value = 0.0097). This result is intuitive because the liquidity
traders’ limit orders are more likely to be picked off by the informed traders.
The interesting insight comes when we observe that the fill rate of non-displayed limit
orders of the informed traders is quite similar to that of the liquidity traders: 7.9% vs. 7.4% in the
Hidden market and 4.2% vs. 4.8% in the Iceberg market. Hence, the difference in the overall fill
rate between the two trader types is driven by the fill rate of displayed limit orders, which is
larger for liquidity traders than it is for informed traders (p-value = 0.0019). This is consistent
with the higher overall fill rate of the liquidity traders being driven by the “pick-off” risk: It is
presumably easier to pick off something you see (displayed shares) than something you do not
see (non-displayed shares). This suggests that opacity as a market design feature could be
important to liquidity traders who desire to manage the risk of trading against better informed
traders.15
The tradeoff between aggressively pursuing a trade by opting for an immediate execution
at a worse price or waiting for the execution of a limit order at a better price is fundamental to all
markets organized as limit order books. We use the Taking Rate, defined as the number of shares
15 Panel B of Table 2 also shows that the non-displayed fill rate is lower than the displayed fill rate, and this is especially true in the Iceberg market (two-market p-value = 0.0010, Market*Display two-market p-value = 0.0132). This result is consistent with Belter (2007b), who documents a lower fill rate for orders that contain non-displayed shares on the Copenhagen Stock Exchange (which has a structure similar to our Iceberg market). Similarly, Bessembinder, Panayides, and Venkataraman (2009) find that the probability of execution of non-marketable limit orders that contain a non-displayed portion is lower than that of displayed limit orders on Euronext-Paris (which also has a structure equivalent to our Iceberg market).

18
a trader executes using marketable orders divided by the total number of shares he or she trades,
to study how opacity affects this tradeoff.16 Panel C of Table 1 shows that informed traders are
taking much less liquidity than liquidity traders (i.e., are less aggressive) in Hidden markets
(43.4% versus 57.1%). Hence, when their informational advantage is maintained for a longer
period of time because other traders cannot directly observe the placement of their non-displayed
shares, informed traders optimally choose to be less aggressive and execute more trades using
limit orders (which are more profitable). The more transparent the market, the more the informed
traders compete amongst themselves and hence they become more aggressive (with a taking rate
of 49.6% in the Visible market).
Liquidity traders, on the other hand, need to trade for reasons other than information
about the fundamental value of the security (e.g., for risk sharing, consumption).When the
market is more opaque and depth is not completely observable, traders with liquidity needs
become more aggressive, and hence their taking rate is higher (57.1%). As transparency
increases, these liquidity traders get more confident in their ability to “read” the market and they
become less aggressive (their taking rate in the Visible market decreases to 50.5%). Therefore,
the difference in aggressiveness between the informed and liquidity traders decreases with
transparency (Market*Type p-value = 0.0410), and it disappears completely in the Visible
market where both trader types execute about half of their trading needs using marketable orders.
3.3 Market Quality: Liquidity
The previous results highlight how traders adapt their behavior to the market structure.
The interaction of these strategies gives rise to equilibrium market attributes such as liquidity and
informational efficiency. In this section, we examine various facets of liquidity. It is particularly
important to distinguish between what is actually in the book as opposed to what traders observe
when watching their screens. We begin by looking at the evolution of depth in the limit order
book. To measure book depth, we use all orders up to 20 price levels from the current best bid
and ask prices.17 We compute the time-weighted average depth in each of the six 30-second
16 Note that the Taking Rate examines only executed orders while the Submission Rate looks at all orders (many of which would not eventually execute). 17 For example, if the best bid and ask prices are 55 and 57 (experimental dollars), we measure depth by aggregating all shares at prices from 35 to 77. Considering only depth that is closer to current market prices is standard in empirical analyses of limit order books and is meant to reduce noise that stems either from traders leaving stale limit

19
intervals that comprise a trading period. Panel A of Figure 3 shows the evolution of Depth over
these intervals. While all markets start alike, over time the amount of total depth in the book
diverges: total depth is higher in markets that allow non-displayed orders (Market*Time p-value
= 0.0462). Thus, giving traders the ability to control the exposure of their orders enhances
liquidity, at least with respect to the depth dimension.
Panels B and C of Figure 3 decompose total depth into depth from displayed shares
(DispDepth) and depth from non-displayed shares (NDispDepth). Not surprisingly, markets that
restrict usage of non-displayed shares end up displaying many more shares, which is most
notable in the Visible market (Market*Time p-value < 0.0001). Nonetheless, the number of non-
displayed shares submitted to the book (in particular in the Hidden market) is more than enough
to offset this effect (Market*Time p-value < 0.0001), so total depth is greater in markets that
allow non-displayed shares. In fact, the supply of non-displayed shares is so important to the
Hidden market that approximately half of the shares in the book are non-displayed by the end of
trading.18
These results are consistent with an implication of the theoretical model in Moinas
(2010). In her model, total depth is greater in the market that allows non-displayed orders, while
displayed depth is greater in the market that permits only displayed orders. Empirically, Anand
and Weaver (2004) report that total depth at the best quotes increased when the Toronto Stock
Exchange gave traders the option to hide shares in 2002, which is also consistent with our
findings.
Another measure of market liquidity is the bid-ask spread. We find that the “true” time-
weighted spread, the one that includes both displayed and non-displayed shares, is remarkably
similar across the three market structures (3.7, 3.6, and 3.5, for the Hidden, Iceberg, and Visible
orders in the book or from submission of limit orders in an attempt to game market participants to believe that the true value resides elsewhere. 18 When we look at depth at the best bid or offer (BBO), rather than total depth, we observe similar patterns: displayed BBO depth decreases in the opacity of the market (Market*Time p-value = 0.0073) while non-displayed BBO depth increases in the opacity of the market (Market*Time p-value < 0.0001). However, the provision of non-displayed BBO depth in the Iceberg market is modest, and for most of the trading period total depth at the BBO is similar in the Visible and Iceberg markets. Comparing the two extremes in terms of opacity we observe a clearer picture: total BBO depth in the Hidden market is larger than that in the Visible market all through the trading period (Time*Market p-value = ).

20
markets, respectively). Buti and Rindi (2008) provide a theoretical model (with only uninformed
traders) that compares market structures roughly analogous to the Visible and Iceberg markets in
our experiment. When their large traders are able to use hidden orders to lower the pick-off risk
(from faster traders), depth increases while the spread does not change much. The picture we
observe in our markets is consistent with their prediction: depth is greater in the Iceberg market
but spreads are comparable.
Our experiment, however, also features the Hidden market structure that has become the
predominant market structure in the U.S., and where the displayed spread could in principle be
larger than the “true” spread. Our experiment demonstrates that the option to “hide” shares in
between the best displayed bid and ask prices is extensively used by traders. As a result, the
displayed time-weighted spread is almost twice the true spread in the Hidden market (6.3 vs.
3.7), and it differs markedly across the three market structures (p-value < 0.0001). This result
appears to be driven by the order submission strategies of the informed traders.19 In contrast, no
such difference exists in the informed traders’ strategies when trading in the Iceberg market. This
suggests that informed traders take advantage of the unique feature of the Hidden market to
completely hide orders in between the best displayed prices in the book. Liquidity traders use
non-displayed shares approximately the same in aggressive and less aggressive orders, and their
behavior is not sensitive to the market structure.
Despite the greater depth in markets that allow non-displayed shares, the cost of trading
when demanding liquidity is similar across the market structures. The total price impact of
marketable orders (the difference between the transaction price and the prevailing midquote), for
example, is not significantly different across the opacity regimes for both the informed and the
liquidity traders. It is therefore not surprising that the quantity of trading (i.e., volume) is also not
statistically different across the three market structures.20 These results on spreads and volume
are consistent with the findings of Anand and Weaver (2004) who look at iceberg orders on the
19 Specifically, the ratio of non-displayed shares to all shares is 52% in the informed traders’ aggressive orders (best prices or better) compared with 42% in less-aggressive orders. 20 Gozluklu (2009) finds that, in markets with a monopolist insider, volume is lower when non-displayed shares are allowed (in a setting resembling the Iceberg market in our experiment). Our conflicting results could be driven by differences in design of the two studies: while his study focuses on the impact of an information monopolist on the market, we model an environment with competing strategic informed traders. There are certain frictions in his markets (e.g., prohibition on short selling) that could also give rise to these differences.

21
Toronto Stock Exchange (TSE). Our results, showing lack of differences across the three most
common market structures today with respect to some (though not all) dimensions of liquidity,
suggest that Anand and Weaver’s findings on Iceberg orders are more general than the
experience of the Toronto Stock Exchange. Furthermore, our analysis suggests that this result is
driven by the manner in which traders adapt their strategies, and especially the substitution of
non-displayed shares for displayed ones.21
3.4 Market Quality: Informational Efficiency
A second important dimension of market quality is the informational efficiency of prices.
In general, informational efficiency is the outcome of many actions by traders whose strategies
drive prices toward the true value. As in Bloomfield, O’Hara, and Saar (2009), we compute a
measure of the contribution of each trader type to value discovery, InfEffA. To compute the
measure, we assign +1 or –1 to each executed order in the following manner. If the true value is
higher than the price, we assign +1 to a buy order of a trader that resulted in a trade and 1 to a
sell order that resulted in a trade. If the true value is lower than the price, we assign +1 (1) to a
sell (buy) order of a trader that resulted in a trade. The measure is then aggregated for all market
and executed limit orders of a trader and divided by the number of his trades (the measure is
therefore always in the range [1, +1]). The more positive (negative) InfEffA of a trader, the
more his trades contribute to (interfere with) value discovery. InfEffB is computed in the same
manner as InfEffA but excludes the cases where the true value is inside the spread (between the
best bid and ask prices, whether or not they are visible).
Table 3 shows the two value discovery measures for each trader type. As expected,
informed traders help value discovery (i.e., have positive measures) while liquidity traders
interfere with value discovery, i.e., introduces noise (p-value < 0.0001 for both measures). Such
behavior is consisted with the canonical information asymmetry models in market microstructure
(e.g., Glosten and Milgrom (1985), Kyle (1985), and Easley and O’Hara (1987)). More unique to
21 Aitken, Berkman, and Mak (2001) look at the impact of regulatory events in 1994 and 1996 that reduced the use of non-displayed orders on the Australian Stock Exchange and find no significant change in spreads but a decline in volume. It is somewhat difficult to compare their results with ours, however, because the rules governing non-displayed orders on the Australian Stock Exchange are different from the rules of the Hidden and Iceberg markets (which we modeled after the majority of U.S. and European markets). In particular, market observers on the Australian Stock Exchange during that sample period knew which order contained a non-displayed component (due to a special flag) and the non-displayed portion of an order did not have lower execution priority.
22
our experiment, we observe that the value discovery process in the Hidden market differs from
that in the Iceberg and Visible markets. In the Hidden market, liquidity (informed) traders
interfere with (contribute to) value discovery more than they do in the Iceberg or Visible markets
(Market*Type p-value = 0.0103 for InfEffA, Market*Type p-value = 0.0250 for InfEffB). In
other words, it is easier for informed traders to hide in the Hidden market, but then they trade
more aggressively on their information and push prices towards the true value more than they do
in the Iceberg and Visible markets. Such a strategic response is consistent with Kyle (1985),
where an increase in noise trading causes the informed traders to trade more aggressively on
their information and hence the amount of information revealed through prices remains
unchanged. This suggests that overall informational efficiency of the market does not differ
much across the three market structures.
To examine this conjecture, we use the absolute value of the difference between the true
value (i.e., the liquidating dividend) and the quote midpoint each time a trade occurs as a
measure of the overall informational efficiency of the market. The ability to submit orders
without any displayed shares in the Hidden market means that there are two variants of this
measure that could be of interest. The first, Dev, is the average over deviations of the true value
from the “true” quote midpoint. The second, DispDev, is the average over deviations of the true
value from the midpoint of the displayed bid and ask prices. While Dev and DispDev are by
definition identical in the Visible and Iceberg markets, they could differ in the Hidden market.
Figure 4 shows an interesting pattern in how informational efficiency evolves over time
(Market*Time p-value = 0.0320 for Dev, Market*Time p-value = 0.0329 for DispDev). In the
first interval, both deviation measures are lower in the Visible market compared to markets that
allow non-displayed shares (e.g., Dev is 3.4 in the Visible market, while 5.4 and 4.8 in the
Iceberg and Hidden markets, respectively). However, the deviations in all three market structures
converge very quickly, and they become very close to one another already in the second interval.
Hence, while the most transparent market has better informational efficiency at the beginning of
trading, this advantage fades very quickly as traders submit more orders and trading progresses.
Throughout most of the trading period and certainly at the end of trading, the informational

23
efficiency of the three market structures is similar, and does not vary much with the opacity
regime.
3.5 Trading Profits and Trader Perception
The previous two sections reveal a market environment that is surprisingly robust to the
opacity regime. As such, one could ask whether market participants are indifferent between the
three market structures. In this section, we look at two dimensions of trader welfare: their trading
profits and their perceptions of the fairness and preferability of the different opacity regimes. As
is typical in market microstructure models with asymmetric information, trading in our markets
is a zero-sum game in which informed traders profit at the expense of the liquidity traders.
Figure 5 shows the trading profits of the informed traders in the three market structures by
extremity level, where high extremity is when the informed traders’ information is most valuable
and low extremity is when it is the least valuable. Liquidity traders’ losses are identical in
magnitude to informed traders’ gains and hence are omitted from the figure.
When the informed traders’ advantage is small, market structure has no impact on their
profits (or on the losses incurred by the liquidity traders). Hence, being able to hide in the book
does not increase the profits of the informed traders significantly when the value of their
information is low. When the value of information is high, on the other hand, informed-trader
profits decline monotonically with the transparency of the market structure: 160.9 in the Hidden
market, 131.1 in the Iceberg market, and 78.4 in the Visible market. When we run a three-market
ANOVA analysis, the Market*Extremity interaction is not statistically different from zero for the
informed traders. However, when we analyze each pair of markets separately, the two
extremes—Visible and Hidden—do show a significant interaction (Market*Extremity p-value =
0.0334). In other words, the 160.9 is in fact different from 78.4 and the ability to completely hide
in the book affords informed traders greater profitability compared with the case where all shares
need to be displayed (though we cannot conclude that profits are different in the Visible vs.
Iceberg or Iceberg vs. Hidden markets). Our analysis suggests that opaque market structures
could be more advantageous to informed traders (and, conversely, more harmful to liquidity
traders) when the extent of adverse selection in the market is high.
24
We used a post-trading questionnaire to assess traders’ perceptions of fairness, and their
preferences with respect to market structure. Their responses indicate that traders perceive
Visible markets to be fairer than Hidden markets. Specifically, we asked participants to answer,
on a scale of 1 to 10, “How fair was the Visible Market?”, “How fair was the Iceberg market?”
and “How fair was the Hidden Market?” Responses averaged 6.30, 4.92 and 3.54, respectively.
The difference between the Visible and Hidden market is highly significant (p-value < 0.0001).
Because the experimental design enabled each participant to trade as an informed trader in some
securities and a liquidity trader in others, we also asked “Which market settings did you prefer as
an informed trader?” and “Which market setting did you prefer as a liquidity trader?” As
informed traders, 41.7% preferred the Hidden market, 16.7% preferred the Iceberg market, and
27% preferred the visible market, with 14.6% stating no preference. As liquidity traders, 77.1%
preferred the Visible market, with only 4.2% preferring the Hidden market, 3.1% preferring the
Iceberg market, and 15.6% stating no preference. A Chi-squared test of the 2x3 contingency
table (excluding subjects who stated no preference) shows that the difference in preference is
statistically significant (2 = 61.3, p-value < 0.0001).
Our results on actual profit and perceived fairness and preferability contrast with the
theoretical prediction in Moinas (2010) that the expected utility of the uninformed traders in the
opaque market (which is similar to the Iceberg market in our experiment) is greater than their
utility in the market that forces the display of all shares. Moinas’ model restricts the strategies
that both informed and uninformed traders can pursue. For example, informed traders in her
model are not allowed to trade using marketable orders. We find that marketable orders and
executed limit orders contribute almost equally to the trading of the informed traders (69.7 shares
in marketable orders vs. 74.9 shares in executed limit orders). Uninformed traders in her model
are not strategic, and in particular do not optimize on whether to supply or demand liquidity. Our
more general setting results in optimal strategies that are not allowed in her model, which could
be the reason we find the opposite result.22
22 Boulatov and George (2012) present a model in which informed traders can choose between demanding and supplying liquidity. Opacity of the market setting in their model implies that informed liquidity demanders cannot observe the limit order book before submitting orders. The model shows how opacity of the market draws more informed traders to supply liquidity (which we observe in the experiment as well), and decreases the losses of the non-strategic uninformed liquidity demanders compared with the transparent market setting. As we note in our

25
4. Conclusions
Hidden liquidity in the guise of non-displayed orders is an important feature of equity
markets. Our analysis shows that traders value the ability to hide orders, and that their trading
behavior differs across opacity regimes. We observe a substitution between displayed and non-
displayed orders as well as shifts in the trading aggressiveness of both the informed and liquidity
traders across the opacity regimes. What our results also show, however, is that the market
equilibrium is to a large extent robust to various opacity regimes, with most market quality
measures not significantly different across the Visible, Iceberg, and Hidden market structures.
This equilibrium robustness arises because traders optimize their strategies to the market
structure they face. In our competitive markets, this results in market outcomes (with the
exception of depth) that are essentially unchanged across opacity regimes. Still, the results on
profits, perceived fairness, and market preference demonstrate that while market outcomes are
largely similar, the path to equilibrium in more opaque markets increases the actual and
perceived value of private information at the expense of the liquidity traders.
We believe that our work has important implications for researchers and regulators alike.
For researchers, our work sheds new light on how informed and uninformed traders behave in
“lit” and “dark” markets. Furthermore, the manner in which liquidity and price discovery evolve
in different market structures is a topic of great importance, and our results should be helpful in
designing further empirical and theoretical investigations. For regulators, market evolution has
moved increasingly towards “dark” trading, naturally directing interest to the question of how
this affects market quality. Our results provide some important guidance on this issue by
showing that one market structure need not be “superior” to another; trader strategies change
with the market structure so that outcomes are not uniquely determined by market rules.
As with any research, our analysis has limitations. First, the similarity of market
outcomes across our treatments may simply reflect a lack of power in our design, rather than
proof that traders respond in a way that makes market outcomes invariant to the opacity regime.
discussion of Moinas (2010), the reason we find the opposite result in the experiment with respect to the losses of the liquidity traders could be due to the non-strategic nature of the uninformed traders, who are not afforded the choice between supplying and demanding liquidity, in the Boulatov and George model.

26
Future experiments could focus more pointedly at settings with high information asymmetry, in
which we find the strongest evidence that hidden liquidity can increase the trading losses of
liquidity traders. Second, we have focused on the behavior of particular market structures in
isolation, allowing us to compare outcomes in markets that differ only in the opacity regime.
Actual markets, however, often include a multiplicity of market structures competing
simultaneously. In future work, we plan to investigate how traders select across competing
opacity regimes, and what this implies for market equilibrium. We believe this study will shed
light on whether some opacity regimes undermine other regimes, an issue that speaks to whether
competitive equilibria can emerge in complex markets.
Another issue we have not addressed is the interaction of transparency and uncertainty.
Dark markets engender uncertainty regarding the level and location of liquidity. As noted in the
Introduction, markets now feature practices such as pinging as well as greatly increased message
traffic arising from complex order strategies implemented across a variety of lit and dark trading
venues. There is growing research interest in the effects of uncertainty (or ambiguity) on market
behavior (e.g., Easley and O’Hara (2010) and Easley at al. (2011)), an issue we think may have
particular relevance for debates on transparency. We believe experimental markets are
particularly well-suited for examining such uncertainty issues, and we look forward to
investigating this in future research.

27
References
Aitken, Michael J., Berkman, Henk, and Derek Mak, 2001, “The use of undisclosed limit orders
on the Australian stock exchange”, Journal of Banking and Finance 25, 1589-1603.
Anand, Amber, and Daniel G. Weaver, 2004, “Can order exposure be mandated?”, Journal of
Financial Markets 7, 405-426.
Baruch, Shmuel, 2005, “Who benefits from an open limit-order book?” Journal of Business 78,
1267-1306.
Belter, Klaus, 2007a, “Supply and information content of order book depth: the case of displayed
and hidden depth”, Working Paper.
Belter, Klaus, 2007b, “Partial vs. full display limit orders”, Working Paper.
Bessembinder, Hendrik, Panayides, Marios, and Kumar Venkataraman, 2009, “In search of
liquidity: an analysis of order submission strategies in automated markets”, Journal of
Financial Economics 94, 361-383.
Bloomfield, Robert, and Maureen O’Hara, 1998, “Does order preferencing matter?” Journal of
Financial Economics 50, 3-37.
Bloomfield, Robert, and Maureen O’Hara, 2000, “Can transparent markets survive?” Journal of
Financial Economics 55, 425-459.
Bloomfield, Robert, O’Hara, Maureen, and Gideon Saar, 2005, “The make-or-take decision in an
electronic market: Evidence on the evolution of liquidity,” Journal of Financial
Economics 75, 165-199.
Bloomfield, Robert, O’Hara, Maureen, and Gideon Saar, 2009, “How noise trading affects
markets: An experimental analysis,” Review of Financial Studies 22(6), 2275-2302.
Blume, Marshall E., and Michael A. Goldstein, 1997, “Quotes, order flow, and price discovery,”
Journal of Finance 52, 221-244.
Boehmer, Ekkehart, Saar, Gideon and Lei Yu, 2005, “Lifting the veil: an analysis of pre-trade
transparency at the NYSE”, The Journal of Finance 60, 783-815.
Boulatov, Alex, and Thomas J. George, 2012, “Hidden and displayed liquidity in securities
markets with informed liquidity providers,” Working paper.

28
Buti, Sabrina, and Barbara Rindi, 2008, “Hidden orders and optimal submission strategies in a
dynamic limit order market,” Working paper, University of Toronto.
Cason, Timothy N., 2000, “The opportunity for conspiracy in asset markets organized with
dealer intermediaries,” Review of Financial Studies 13, 385-416.
Caginalp, Gunduz, Porter, David, and Vernon Smith, 2001, “Financial bubbles: Excess cash,
momentum, and incomplete information,” Journal of Psychology and Financial Markets
2(2), 80-99.
De Winne, Rudy., and Catherine D’Hondt, 2007, “Hide-and-seek in the market: placing and
detecting hidden orders”, Review of Finance 11, 663-692.
Easley, David, and Maureen O'Hara, 1987, “Price, Trade Size, and Information in Securities
Markets,” Journal of Financial Economics 19, 193-212.
Easley, David, and Maureen O’Hara, 2010, “Microstructure and ambiguity”, Journal of Finance
65, 1817-1846.
Easley, David, Maureen O’Hara, and Liyan Yang, 2011, “Opaque trading, disclosure, and asset
prices,” Working paper, Cornell University.
Esser, Angelika, and Burkart Mönch, 2007, “The navigation of an iceberg: The optimal use of
hidden orders,” Finance Research Letters 4, 68-81.
Frey, Stefan, and Patrik Sandas, “The impact of Iceberg Orders in Limit Order Books,” Working
paper.
Glosten, Lawrence R., and Paul Milgrom, 1985, “Bid, Ask and Transaction Prices in a Specialist
Market with Heterogeneously Informed Traders,” Journal of Financial Economics 14,
71-100.
Gozluklu, Arie E., 2009, “Pre-trade transparency and informed trading: An experimental
approach to hidden liquidity,” Working paper, Bocconi University.
Harris, Lawrence, 1996, “Does a large minimum price variation encourage order exposure?”,
Working Paper.
Harris, Lawrence, 1997, “Order exposure and parasitic traders”, Working Paper.
Hasbrouck, Joel, and Gideon Saar, 2009, “Technology and liquidity provision: the blurring of
traditional definitions”, Journal of Financial Markets 12, 143-172.

29
Hasbrouck, Joel, and Gideon Saar, 2011, “Low-latency trading,” Working paper.
Kumar, K. Kiran, Thirumalai, Ramabhadran S., and Pradeep K. Yadav, 2010, “Hiding behind the
veil: Informed traders and pre-trade transparency,” Working paper.
Kyle, Albert S., 1985, “Continuous auctions and insider trading,” Econometrica 53(6), 1315-
1335.
Lamoureux, Christopher G., and Charles R. Schnitzlein, 1997, “When it’s not the only game in
town: The effect of bilateral search on the quality of a dealer market,” Journal of
Finance, 52, 683-712.
Lundholm, Russell J., 1991, “What Affects the Efficiency of a Market? Some Answers form the
Laboratory,” The Accounting Review, 66(3), 486-515.
Madhavan, Ananth, Porter, David, and Daniel Weaver, 1999, “Should securities markets be
transparent?” Working paper.
Madhavan, Ananth, Porter, David, and Daniel Weaver, 2005, “Should securities markets be
transparent?” Journal of Financial Markets 8, 266-288.
Moinas, Sophie, 2010, “Hidden limit orders and liquidity in limit orders market”, Working
Paper.
Myerson, R., 1981, Optimal auction design, Mathematics of Operations Research 6(1), 58-73.
Pardo, Angel, and Roberto Pascual, 2006, “On the hidden side of liquidity”, forthcoming in the
European Journal of Finance.
Tuttle, Laura, 2006, “Hidden orders, trading costs and information”, Working Paper.
Vickrey, W., 1961, Counterspeculation, auctions and competitive sealed tenders, Journal of
Finance 16(1), 8-37.

30
Appendix A: Instructions for a Market Experiment Welcome! During this research study on financial markets, you will trade a number of securities that each pays a single liquidating dividend denominated in “laboratory dollars.” We will convert your gains or losses into U.S. dollars to determine your payment. At the end of trading, we will also ask you a series of questions about your experience. Please do not talk with other subjects, look at others’ computer screens, or leave the room without explicit permission from the experiment administrator. Liquidating Dividends
The liquidating dividend of each security is distributed over the interval [0,100] according to the bell-shaped distribution in the figure below. Note that extreme dividends are less likely than dividends close to 50.
Types of Traders The market in which you will be trading includes four informed traders and four liquidity traders. For some securities you will be an informed trader; for other securities you will be a liquidity trader. Your trading screen will tell you what type of trader you are for that security.
Informed Traders know that the liquidating dividend is inside a certain range of numbers. Say the range is [-10, +10]. We draw a random number “x” that is distributed on the integers between -10 and +10 such that each integer is equally likely. One informed trader learns the dividend value plus x and the other informed trader learns the dividend value minus x.
Liquidating Dividend
0 20 40 60 80 100
Value of Dividend
31
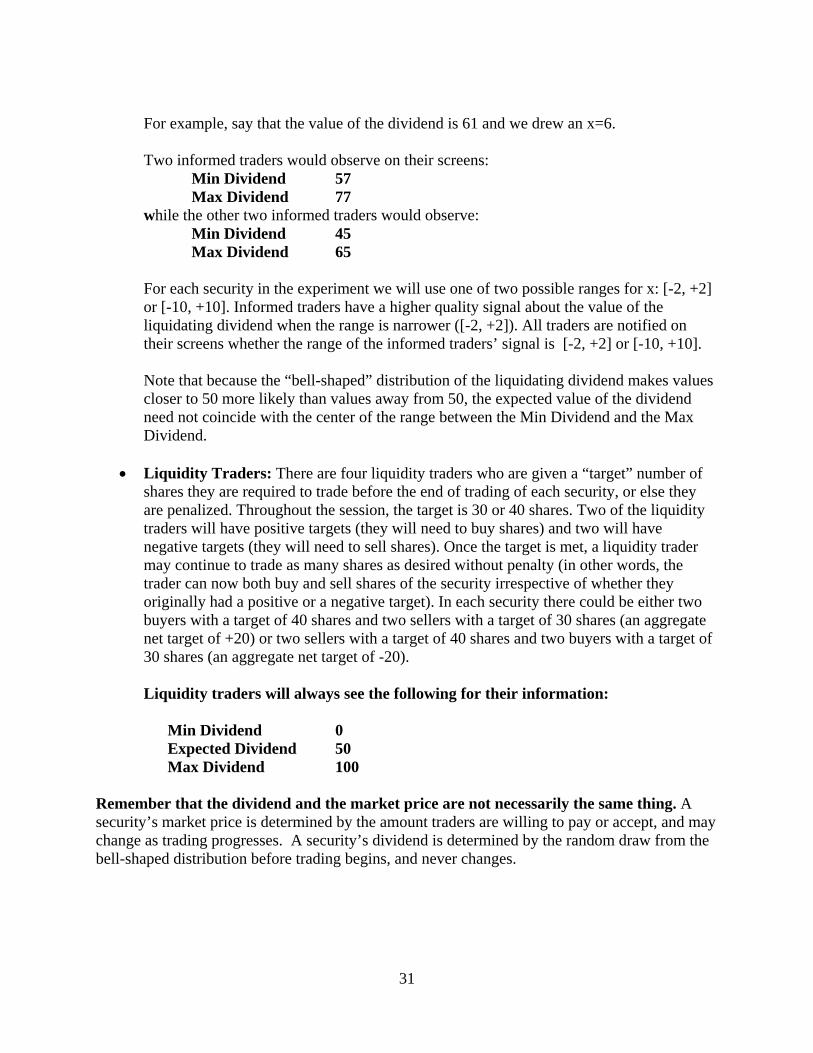
For example, say that the value of the dividend is 61 and we drew an x=6. Two informed traders would observe on their screens:
Min Dividend 57 Max Dividend 77
while the other two informed traders would observe: Min Dividend 45 Max Dividend 65
For each security in the experiment we will use one of two possible ranges for x: [-2, +2] or [-10, +10]. Informed traders have a higher quality signal about the value of the liquidating dividend when the range is narrower ([-2, +2]). All traders are notified on their screens whether the range of the informed traders’ signal is [-2, +2] or [-10, +10]. Note that because the “bell-shaped” distribution of the liquidating dividend makes values closer to 50 more likely than values away from 50, the expected value of the dividend need not coincide with the center of the range between the Min Dividend and the Max Dividend.
Liquidity Traders: There are four liquidity traders who are given a “target” number of
shares they are required to trade before the end of trading of each security, or else they are penalized. Throughout the session, the target is 30 or 40 shares. Two of the liquidity traders will have positive targets (they will need to buy shares) and two will have negative targets (they will need to sell shares). Once the target is met, a liquidity trader may continue to trade as many shares as desired without penalty (in other words, the trader can now both buy and sell shares of the security irrespective of whether they originally had a positive or a negative target). In each security there could be either two buyers with a target of 40 shares and two sellers with a target of 30 shares (an aggregate net target of +20) or two sellers with a target of 40 shares and two buyers with a target of 30 shares (an aggregate net target of -20).
Liquidity traders will always see the following for their information:
Min Dividend 0 Expected Dividend 50 Max Dividend 100
Remember that the dividend and the market price are not necessarily the same thing. A security’s market price is determined by the amount traders are willing to pay or accept, and may change as trading progresses. A security’s dividend is determined by the random draw from the bell-shaped distribution before trading begins, and never changes.

32
Types of Markets You will trade in three different types of markets that differ depending upon their display rules for orders.
Visible Markets: In these markets, all orders are displayed to all market participants.
Iceberg Markets: In these markets, you have the option to have part of your order not displayed to other traders. Every order you enter must include at least one displayed share. As trading occurs, if the last displayed share in the order is executed, the next share will automatically be converted from nondisplayed to displayed.
Hidden markets: In these markets, you can choose to have all, part, or none of your order displayed.
Sequence of Events For each security, you will follow the same sequence of steps: (1) Learn information about the value of the security (if informed trader) or target (if liquidity
trader) (2) Estimate security dividend (3) Trade for a 180-second period (4) Estimate security dividend (5) Learn true dividend of security The overall experiment will last approximately 90 minutes. How Trade Occurs All traders trade shares by entering orders to buy and sell shares. Orders to buy are collected in a “bid book” and orders to sell are collected in an “ask book.”
Entering a Bid: A bid is an order to buy shares at a stated price. You will buy shares at that price if someone else chooses to take your bid and sells a share to you at the price you indicated. To submit a bid, click on the “BUY” button in the upper left part of the screen. After choosing a price and a number of both displayed and nondisplayed shares, submit the order. The displayed shares show up in everyone’s BIDS order book, which is ranked from highest price to lowest. You will see your own nondisplayed shares, but no one else will.
Entering an Ask: An ask is an order to sell shares at a stated price. You will sell at that
price if someone else chooses to take your ask and buys a share from you at the price you indicated. To submit an ask, click on the “SELL” button in the upper left part of the screen. After choosing a price and a number of both displayed and nondisplayed shares, submit the order. The displayed shares show up in everyone’s ASKS order book, which is ranked from lowest price to highest. You will see your own nondisplayed shares, but no one else will.

33
Trade occurs when a new bid comes in at a price higher than or equal to the lowest price in the ask book, or when a new ask comes in at a price lower than or equal to the highest price in the bid book.
o When a new order comes in, if it is able to cross with shares on the book, then the shares it trades with are determined as follows: Better prices before worse prices (highest bids first, lowest asks first) In each price level, displayed shares are executed before nondisplayed
shares In each price level, older displayed shares are executed before newer
displayed shares, and older nondisplayed shares are executed before newer nondisplayed shares.
o For example, assume the bid book already includes 3 shares to buy at a price of 35, 2 shares to buy at a price of 34, 3 shares to buy at a price of 32, and 4 shares to buy at a price of 31. If a trader enters a sell order for 10 shares at a price of 32, that trader will sell 3 shares at 35 to the buyers who entered bids of 35, 2 shares at 34 to the traders who entered bids of 34, and 3 shares at 32 to the traders who entered bids of 32. At that point, the highest bid in the order book is 31, so the seller’s last 2 shares are placed in the ask book at the price of 32 (which becomes the lowest ask price in the market).
Even though traders cannot see others’ nondisplayed orders, those orders can still execute. In Hidden markets, where an order can be completely nondisplayed, this means that there may be orders to buy or sell in between the current best bid and ask prices.
Removing or Modifying a Bid or Ask: You can remove (cancel) or modify a bid or ask
that you entered by double-clicking on it in your list of outstanding orders. Enter the new number of shares you want this order to be for (this value must be less than the number of shares in the original order) and click “Reduce”, or simply click “Delete All Shares” if you want to remove the order completely.
Some Trading Rules to Consider The following rules should be kept in mind when entering or taking orders.
You can only trade if someone takes the other side of your order.
o If you want the best chance of trading immediately, you can enter orders to buy at 100 or sell at 1. Note that you will pay much less than 100 in most cases, because the price is determined by the lowest ask in the market. Similarly, you will sell for more than 1 because the price is determined by the highest bid.
You can’t trade with yourself. Requests to take your own order will be rejected.

34
You can never enter a bid at a price greater than your own ask, or an ask at a price less than your own bid. Doing so would be like trying to trade with yourself.
You can submit a maximum of 99 shares in each order.
o For example, you cannot enter an order that has 50 displayed shares and 52 nondisplayed shares.
You may enter multiple orders in the same security.
Trading Gains and Losses You start trading each security with no cash and no shares. However, negative cash and share balances are permitted. Thus, you can buy shares even if you don’t have money to pay for them, and you can sell shares you don’t own (“short selling”). After trading a security, the shares you own pay the liquidating dividend. If you have a positive balance of shares, the dividend is added to your cash balance for each share you own. If you have a negative balance of shares, the dividend is subtracted from your cash balance for each share you own. The resulting number is your trading gain (if positive) or trading loss (if negative). You make money every time you buy a share for less than true dividend or sell a share for more than true dividend. For example, buying a share worth $30 at a price of $23 creates a gain of $7. Selling that share at that price creates a loss of $7. Penalties for Liquidity Traders Liquidity traders incur penalties for failing to achieve their targets. The penalty is $100 laboratory dollars for each share you fall short of your target. This penalty is large enough that liquidity traders are always better off trading enough to hit their target, even if they must buy at very high prices or sell at very low prices to do so. Converting Laboratory Dollars into US Dollars Your payment for the study will depend on your performance in this session. Specifically, we calculate winnings as follows: US$ Payment = (Net Gain/Loss in Laboratory Dollars) x 0.005 + 65 You are guaranteed a minimum payment of US$10.

35
Reading the Information on Your Screen
Left Side of the Screen:
On the upper left part of the screen the limit order book is displayed. This shows everyone’s displayed orders as well as your own displayed and nondisplayed orders. The left-hand columns display all outstanding bids and the right-hand columns display all outstanding asks. The top row represents the current best bid (on the left) and current best ask (on the right).
Below the limit order book on the left side of the screen is a list of all your own outstanding orders, the price, the number of displayed shares, and the number of nondisplayed shares. Double-clicking on one of these rows will allow you to modify or cancel the order you have clicked on.
Below the list of your outstanding orders is one line of information about the market as a whole that is updated in real time. This line includes the price at which the most recent trade was executed, the total number of shares that have been executed in the market, and the current best bid and ask prices.
Right Side of the Screen:
On the right side of the screen you will find information about your role in trading and the type of market structure. You will be told (i) whether you are an informed trader or a liquidity trader, (ii) what is the range for the signals of the informed traders (from -2 to +2 or from -10 to +10), (iii) information about the dividend (if you are an informed trader) or your target information (if you are a liquidity trader), and (iv) what is the type of market (Visible, Iceberg, or Hidden).
Also on the right side of the screen you can find information in real time about the trades you have executed and your shares/cash position. You can observe the number of shares you have bought (and their average execution price) and the number of shares you have sold (and their average execution price). Information about your cash and share holdings enables you to track how your inventory of shares and cash balance change as a result of your trading.
Trouble-shooting – Here are some possible solutions to common trading problems:
Why aren’t I executing any trades? o You have to submit orders to trade – check to make sure your orders show up in your
orders log (see below). o Your orders may be too far away from the market. As trading progresses, prices
move so you may need to cancel and submit new orders.
Why didn’t my order show up in the orders log? o Remember that orders will be rejected if they are for more than 99 shares or if it
would result in trading with yourself. An order will also be rejected if you submit a buy order at a price higher than you have submitted a sell order.

36
Why can’t I submit a nondisplayed order? o Remember to check the market type. Some markets permit only displayed orders,
others may require at least one share to be displayed.
Why did another order execute when I had submitted an order at the best bid or ask? o Orders execute according to priority rules. At a given price, displayed orders execute
before nondisplayed orders, and orders placed first execute before orders placed later. Your order may have been placed after an existing order.
o In Hidden markets, nondisplayed orders will execute first if they are at better prices than displayed orders. Thus, for example, a nondisplayed sell order between the best bid and ask prices will execute before a sell order at the best ask price.

37
Table 1 Experimental Design
This table presents our experimental design. Data are drawn from twelve cohorts of eight traders each. As Panel A shows, each cohort participates in all twelve settings created by a fully-factorial manipulation of the opacity regime (Visible, Iceberg, Hidden), extremity (high, low) and dispersion (high, low). A security was defined as high (low) extremity if the absolute deviation of value from the prior expected value of $50 was greater than or equal to (less then) $17. A security was defined as high (low) dispersion if each informed trader’s signal was within $10 ($2) of the true value. As Panel B shows, we balanced the design by creating three blocks of eight securities each. Each block included sub-blocks of four high-extremity securities and four low-extremity securities. Within each sub-block, two securities were assigned to the high-dispersion treatment and two were assigned to the low-dispersion treatment. To account for any possible order effects in opacity regimes, two cohorts experienced each of the six possible orderings of regime. Net demand was chosen to have minimal correlations with the liquidating dividend or the value of the informed traders’ information overall and within each opacity regime. Panel A: Within-Subject Experimental Design Low Extremity High Extremity
Visible Market Low Dispersion Visible, Low Ext, Low Dsp Visible, High Ext, Low Dsp High Dispersion Visible, Low Ext, High Dsp Visible, High Ext, Low Dsp
Iceberg Market Low Dispersion Iceberg, Low Ext, Low Dsp Iceberg, High Ext, Low Dsp High Dispersion Iceberg, Low Ext, High Dsp Iceberg, High Ext, Low Dsp
Hidden Market Low Dispersion Hidden, Low Ext, Low Dsp Hidden, High Ext, Low Dsp High Dispersion Hidden, Low Ext, High Dsp Hidden, High Ext, Low Dsp
Panel B: Securities and Treatments
Block Extremity Dispersion Net Demand True Value 1 Low Low -20 36 1 Low Low 20 54 1 Low High -20 58 1 Low High 20 43 1 High Low -20 82 1 High Low 20 23 1 High High -20 21 1 High High 20 74 2 Low Low -20 47 2 Low Low 20 38 2 Low High -20 36 2 Low High 20 58 2 High Low -20 86 2 High Low 20 73 2 High High -20 32 2 High High 20 20 3 Low Low -20 51 3 Low Low 20 55 3 Low High -20 62 3 Low High 20 50 3 High Low -20 18 3 High Low 20 78 3 High High -20 68 3 High High 20 26

38
Table 2 The “Make-or-Take” Decision
This table presents measures of trading strategies that speak to the “make-or-take” choices of traders: the propensity to provide liquidity versus to consume liquidity. We present the results separately for the informed and liquidity traders (INF and LIQ, respectively) and for each of three market structures: the Hidden, Iceberg, and Visible markets. In Panel A, we look at the Submission Rate of limit orders (SR) and its displayed and non-displayed components. The Submission Rate is the number of shares in limit orders divided by the total number of shares the traders submit in both limit and marketable orders. The displayed (non-displayed) submission rate, DSR (NDSR), is the number of displayed (non-displayed) shares in limit orders divided by the total number of shares submitted in limit and marketable orders (i.e., DSR+NDSR=SR). In Panel B we look at the Fill Rate of limit orders (FR) and its displayed and non-displayed components. The Fill Rate is the number of executed shares in limit orders divided by the total number of shares submitted in limit orders. We decompose the fill rate into a displayed component (executed displayed shares in limit orders divided by total number of shares submitted in limit orders, DFR) and a non-displayed component (executed non-displayed shares in limit orders divided by the total, NDFR), such that DFR+NDFR=FR. In Panel C we look at the Taking Rate, defined as the number of shares a trader executes using marketable orders divided by the total number of shares he or she trades. The Taking Rate can also be decomposed into a displayed (non-displayed) component by separating the numerator into displayed shares executed in marketable orders (non-displayed shares executed in marketable orders), such that DTR+NDTR=TR. Our statistical analysis relies on repeated-measures ANOVA, which effectively treats each cohort as providing a single independent observation of the dependent variable. The numbers in the table represent the averages across the cohorts. The statistical significance of the relevant ANOVA main effects and interactions is discussed in the text of the paper. Panel A: Submission Rates of Limit Orders
Type Market DSR NDSR SR
INF Hidden 0.455 0.427 0.882
INF Iceberg 0.544 0.340 0.884
INF Visible 0.848 0.000 0.848
LIQ Hidden 0.480 0.319 0.799
LIQ Iceberg 0.577 0.237 0.814
LIQ Visible 0.810 0.000 0.810
Panel B: Fill Rates of Limit Orders
Type Market DFR NDFR FR
INF Hidden 0.092 0.079 0.171
INF Iceberg 0.100 0.042 0.142
INF Visible 0.197 0.000 0.197
LIQ Hidden 0.117 0.074 0.191
LIQ Iceberg 0.164 0.048 0.212
LIQ Visible 0.234 0.000 0.234

39
Panel C: Taking Rates
Type Market DTR NDTR TR
INF Hidden 0.252 0.182 0.434
INF Iceberg 0.337 0.141 0.478
INF Visible 0.496 0.000 0.496
LIQ Hidden 0.364 0.208 0.571
LIQ Iceberg 0.371 0.146 0.518
LIQ Visible 0.505 0.000 0.505
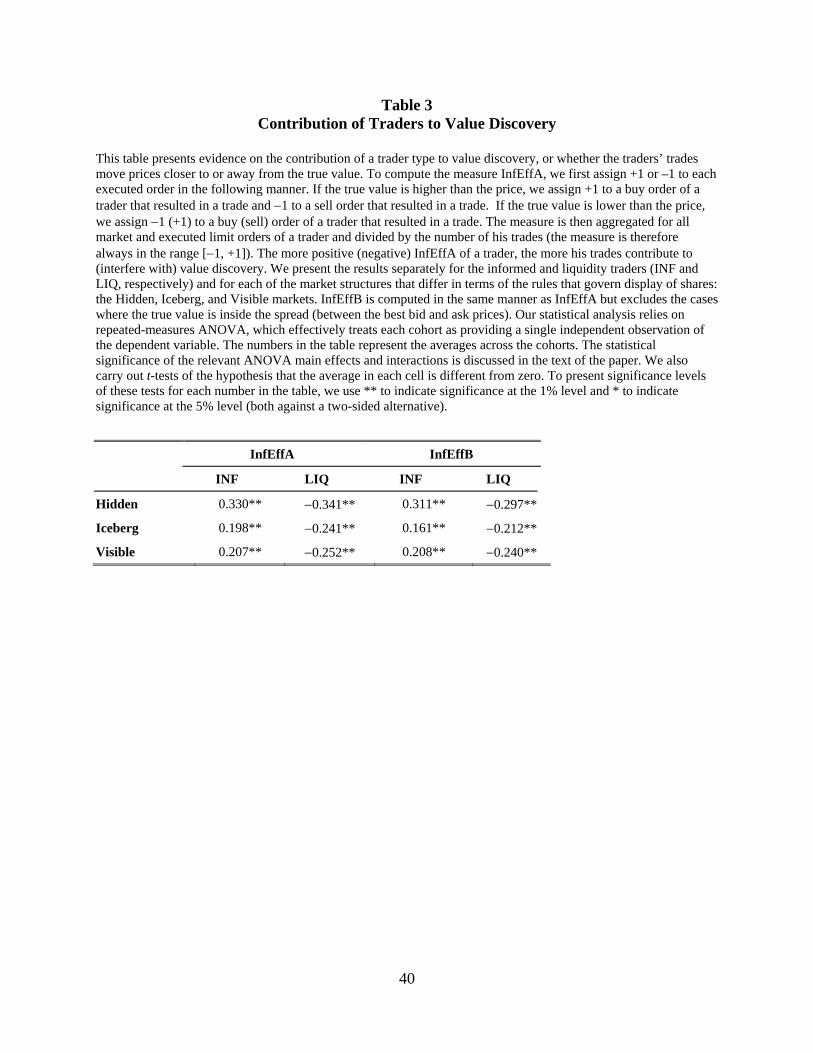
40
Table 3 Contribution of Traders to Value Discovery
This table presents evidence on the contribution of a trader type to value discovery, or whether the traders’ trades move prices closer to or away from the true value. To compute the measure InfEffA, we first assign +1 or –1 to each executed order in the following manner. If the true value is higher than the price, we assign +1 to a buy order of a trader that resulted in a trade and 1 to a sell order that resulted in a trade. If the true value is lower than the price, we assign 1 (+1) to a buy (sell) order of a trader that resulted in a trade. The measure is then aggregated for all market and executed limit orders of a trader and divided by the number of his trades (the measure is therefore always in the range [1, +1]). The more positive (negative) InfEffA of a trader, the more his trades contribute to (interfere with) value discovery. We present the results separately for the informed and liquidity traders (INF and LIQ, respectively) and for each of the market structures that differ in terms of the rules that govern display of shares: the Hidden, Iceberg, and Visible markets. InfEffB is computed in the same manner as InfEffA but excludes the cases where the true value is inside the spread (between the best bid and ask prices). Our statistical analysis relies on repeated-measures ANOVA, which effectively treats each cohort as providing a single independent observation of the dependent variable. The numbers in the table represent the averages across the cohorts. The statistical significance of the relevant ANOVA main effects and interactions is discussed in the text of the paper. We also carry out t-tests of the hypothesis that the average in each cell is different from zero. To present significance levels of these tests for each number in the table, we use ** to indicate significance at the 1% level and * to indicate significance at the 5% level (both against a two-sided alternative).
InfEffA InfEffB
INF LIQ INF LIQ
Hidden 0.330** 0.341** 0.311** 0.297**
Iceberg 0.198** 0.241** 0.161** 0.212**
Visible 0.207** 0.252** 0.208** 0.240**

41
Figure 1 Example of a Trading Screen
This figure presents a screen snapshot for a practice security. The limit order book is shown on the left side of the screen. Traders can observe all displayed shares that were submitted by other trades as well as their own displayed and non-displayed shares. The list of open orders submitted by the trader is shown below the limit order book. On the right side of the screen a trader can view the current market structure (Visible, Iceberg, or Hidden) as well as a clock that shows how much time remains to trade in each trading period. In the middle of the screen traders can view their role (informed trader or liquidity trader), information about the distribution of the dividend of the security, and their cash and share balances.

42
Figure 2 Traders’ Order Usage
This figure presents summary statistics on the submission of orders, both displayed and non-displayed. We present the summary statistics separately for the informed and liquidity traders (INF and LIQ, respectively) and for each of the market structures that differ in terms of the rules that govern display of shares: the Hidden, Iceberg, and Visible markets. To resemble actual markets, traders can submit orders for multiple shares, each such order can be partially displayed and partially non-displayed, and each such order can be partially marketable (i.e., executed upon arriving at the book) and partially a regular limit order (i.e., non-marketable). Hence, to define many of the measures of interest we cannot use these orders as our unit of measurement, but rather we use the number of shares in the order that correspond to a certain categorization (e.g., the number of displayed shares in limit orders). Panel A plots the average number of displayed shares in limit orders (DLO) and the average number of non-displayed shares in limit orders (NDLO) submitted by a trader who belong to one of the two types. Panel B plots the average number of displayed shares in marketable orders (DMO) and the average number of non-displayed shares in marketable orders (NDMO) submitted by a trader who belong to one of the two types. Marketable orders are limit orders that are priced for immediate execution upon arrival to the market. Our statistical analysis relies on repeated-measures ANOVA, which effectively treats each cohort as providing a single independent observation of the dependent variable. The numbers that are plotted in this figure represent the averages across the cohorts. The statistical significance of the relevant ANOVA main effects and interactions is discussed in the text of the paper. Panel A: Displayed (DLO) and Non-Displayed (NDLO) Shares in Limit Orders
0
50
100
150
200
250
300
350
400
450
Hidden Iceberg Visible
DLO
INF
LIQ
0
50
100
150
200
250
Hidden Iceberg Visible
NDLO
INF
LIQ

43
Panel B: Displayed (DMO) and Non-Displayed (NDMO) Shares in Marketable Orders
0
10
20
30
40
50
60
70
80
90
Hidden Iceberg Visible
DMO
INF
LIQ
0
5
10
15
20
25
30
35
40
45
Hidden Iceberg Visible
NDMO
INF
LIQ

44
Figure 3 Evolution of Book Depth
This figure looks at how book depth evolves over time. To measure book depth we use all orders up to 20 price level from the current best bid and ask prices. For example, if the best bid and ask prices are 55 and 57, we measure depth by aggregating all shares at prices from 35 to 77. We divide the trading period into six 30-second intervals, and for each interval we compute the time-weighted average depth. In Panel A we plot total depth, while in Panels B and C we plot the two components of total depth: displayed depth (DispDepth) and non-displayed depth (NDispDepth). We show the evolution of depth separately for each of the market structures (Hidden, Iceberg, and Visible). Our statistical analysis relies on repeated-measures ANOVA, which effectively treats each cohort as providing a single independent observation of the dependent variable. Time is represented by a factor with six values (for intervals 1 through 6 during the trading period). The numbers that are plotted in this figure represent the averages across the cohorts. The statistical significance of the relevant ANOVA main effects and interactions is discussed in the text of the paper. Panel A: Book Depth over Time
0
200
400
600
800
1000
1200
1400
1600
1800
1 2 3 4 5 6
Axis Title
TotalDepth
Hidden
Iceberg
Visible

45
Panel B: Displayed Book Depth over Time
Panel C: Non-Displayed Book Depth over Time
0
200
400
600
800
1000
1200
1400
1600
1 2 3 4 5 6
Axis Title
DispDepth
Hidden
Iceberg
Visible
0
100
200
300
400
500
600
700
800
900
1 2 3 4 5 6
Axis Title
NDispDepth
Hidden
Iceberg
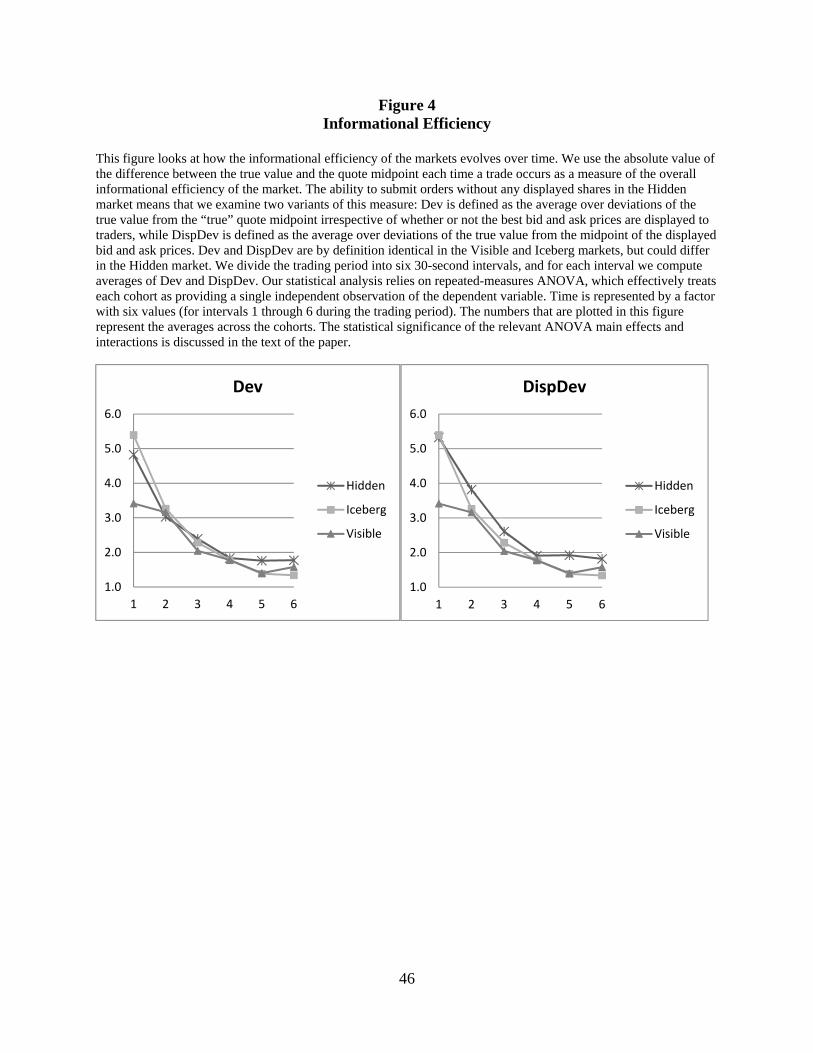
46
Figure 4 Informational Efficiency
This figure looks at how the informational efficiency of the markets evolves over time. We use the absolute value of the difference between the true value and the quote midpoint each time a trade occurs as a measure of the overall informational efficiency of the market. The ability to submit orders without any displayed shares in the Hidden market means that we examine two variants of this measure: Dev is defined as the average over deviations of the true value from the “true” quote midpoint irrespective of whether or not the best bid and ask prices are displayed to traders, while DispDev is defined as the average over deviations of the true value from the midpoint of the displayed bid and ask prices. Dev and DispDev are by definition identical in the Visible and Iceberg markets, but could differ in the Hidden market. We divide the trading period into six 30-second intervals, and for each interval we compute averages of Dev and DispDev. Our statistical analysis relies on repeated-measures ANOVA, which effectively treats each cohort as providing a single independent observation of the dependent variable. Time is represented by a factor with six values (for intervals 1 through 6 during the trading period). The numbers that are plotted in this figure represent the averages across the cohorts. The statistical significance of the relevant ANOVA main effects and interactions is discussed in the text of the paper.
1.0
2.0
3.0
4.0
5.0
6.0
1 2 3 4 5 6
Dev
Hidden
Iceberg
Visible
1.0
2.0
3.0
4.0
5.0
6.0
1 2 3 4 5 6
DispDev
Hidden
Iceberg
Visible
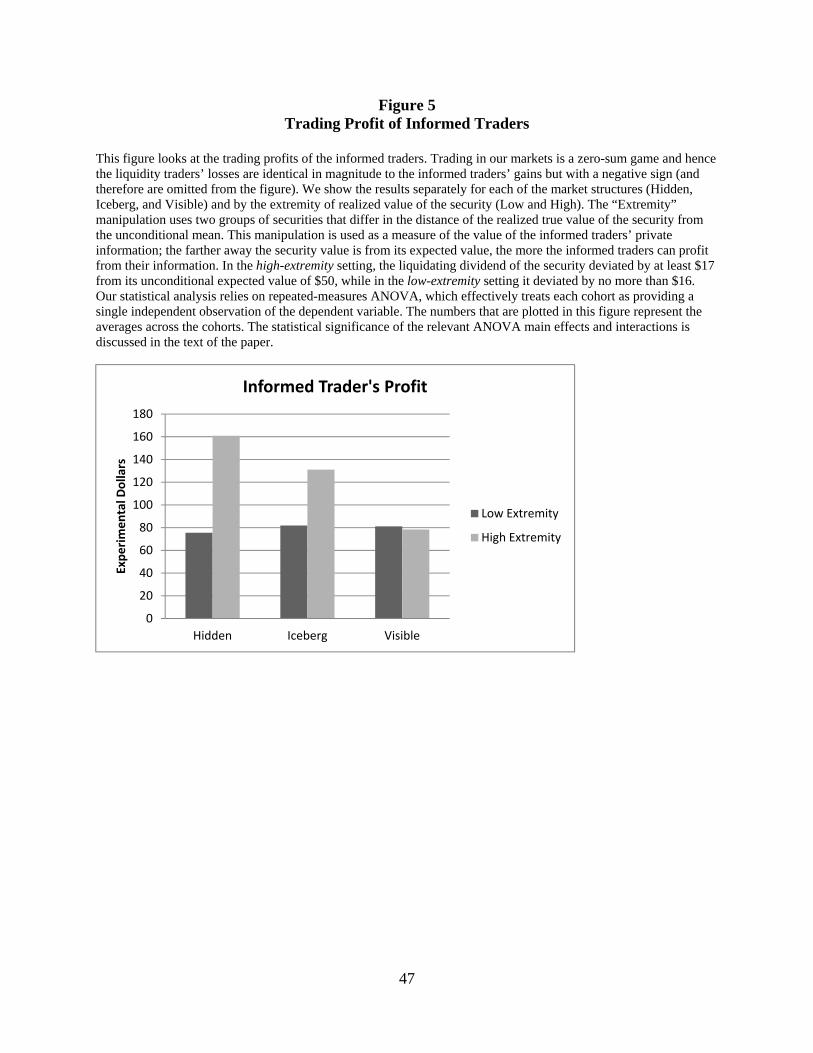
47
Figure 5 Trading Profit of Informed Traders
This figure looks at the trading profits of the informed traders. Trading in our markets is a zero-sum game and hence the liquidity traders’ losses are identical in magnitude to the informed traders’ gains but with a negative sign (and therefore are omitted from the figure). We show the results separately for each of the market structures (Hidden, Iceberg, and Visible) and by the extremity of realized value of the security (Low and High). The “Extremity” manipulation uses two groups of securities that differ in the distance of the realized true value of the security from the unconditional mean. This manipulation is used as a measure of the value of the informed traders’ private information; the farther away the security value is from its expected value, the more the informed traders can profit from their information. In the high-extremity setting, the liquidating dividend of the security deviated by at least $17 from its unconditional expected value of $50, while in the low-extremity setting it deviated by no more than $16. Our statistical analysis relies on repeated-measures ANOVA, which effectively treats each cohort as providing a single independent observation of the dependent variable. The numbers that are plotted in this figure represent the averages across the cohorts. The statistical significance of the relevant ANOVA main effects and interactions is discussed in the text of the paper.
0
20
40
60
80
100
120
140
160
180
Hidden Iceberg Visible
Experimental D
ollars
Informed Trader's Profit
Low Extremity
High Extremity