Embed Size (px)
Citation preview
Hierarchical Linear Modeling for Detecting
Cheating and AberranceStatistical Detection of Potential Test Fraud
May, 2012 Lawrence, KS
William SkorupskiUniversity of Kansas
Karla EganCTB/McGraw-Hill

Purpose of the Study “Cheating” as a paradigm for
psychometric research has focused on individuals.
Our purpose is to identify groups of cheaters, based on the premise that teachers and administrators may be motivated to inappropriately influence students’ scores.

Background Importance of cheating detection Cheating as classroom-, school-, or even
district-wide phenomenon Results of many large-scale educational
assessments are tied to incentives, e.g., merit-based pay, accountability, AYP targets from NCLB
Teachers may be tempted to “teach to the test,” provide inappropriate materials, alter students’ answer sheets
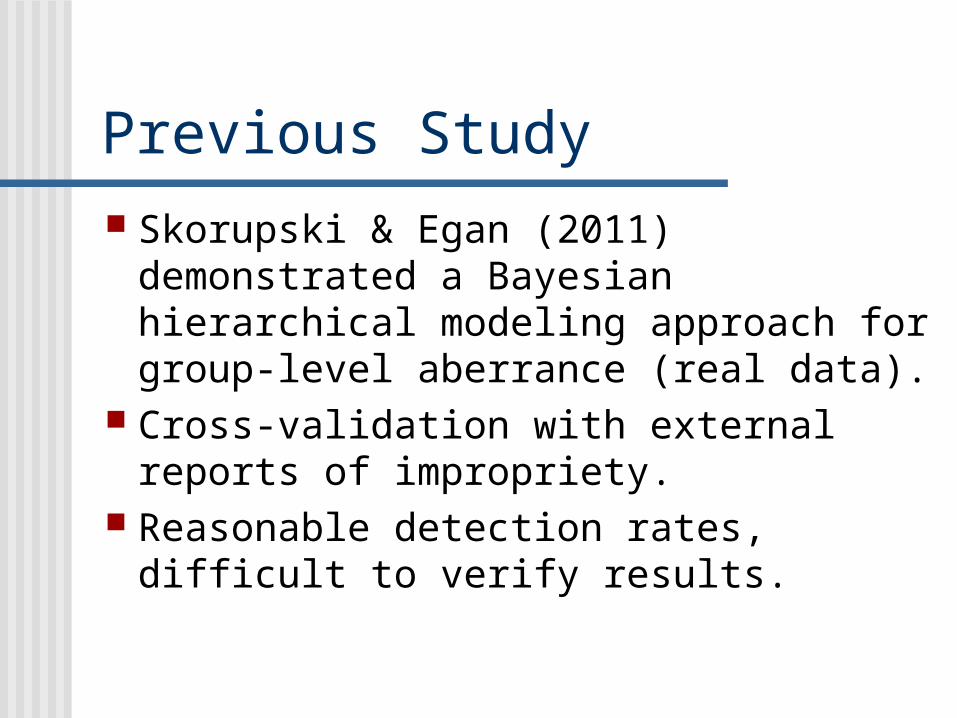
Previous Study Skorupski & Egan (2011)
demonstrated a Bayesian hierarchical modeling approach for group-level aberrance (real data).
Cross-validation with external reports of impropriety.
Reasonable detection rates, difficult to verify results.
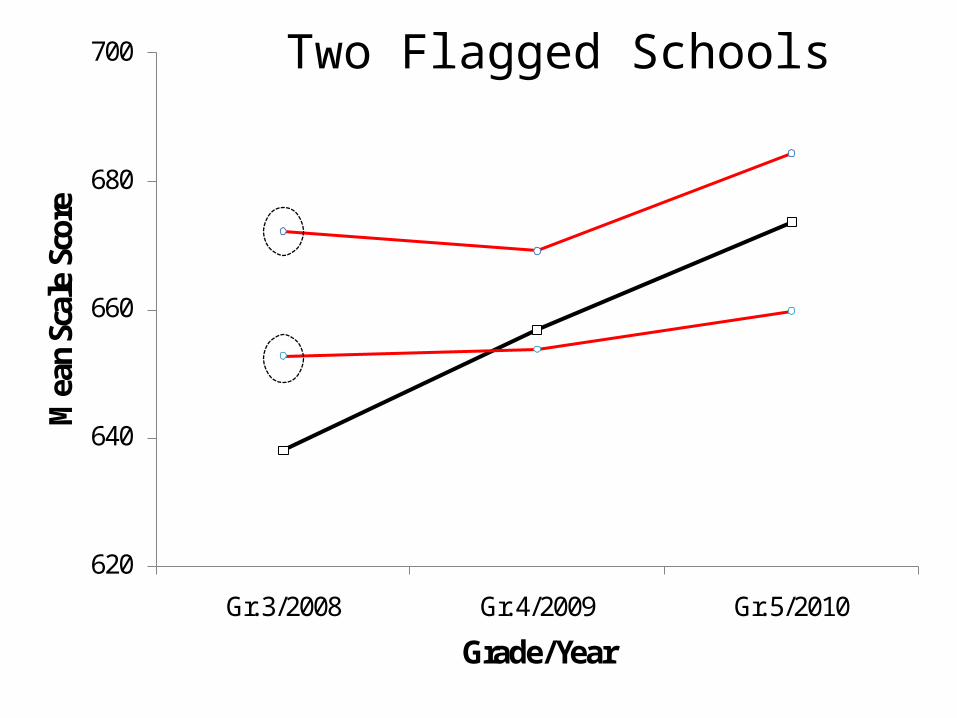
Findings Relatively large aberrance for a
few schools at certain Time points suggested that this approach may be useful for flagging potentially cheating schools.
The present simulation study was planned to evaluate detection power.

620
640
660
680
700
Gr. 3/2008 Gr. 4/2009 Gr. 5/2010
Mea
n Sc
ale
Scor
e
Grade/Year
Two “Non-Aberrant” Schools
620
640
660
680
700
Gr. 3/2008 Gr. 4/2009 Gr. 5/2010
Mea
n Sc
ale
Scor
e
Grade/Year
Two Flagged Schools

Goals of the study
Evaluate the robustness of the Bayesian HLM approach for detecting group-level cheating through Monte Carlo simulation.
Develop heuristics for flagging known “cheaters” from the analysis
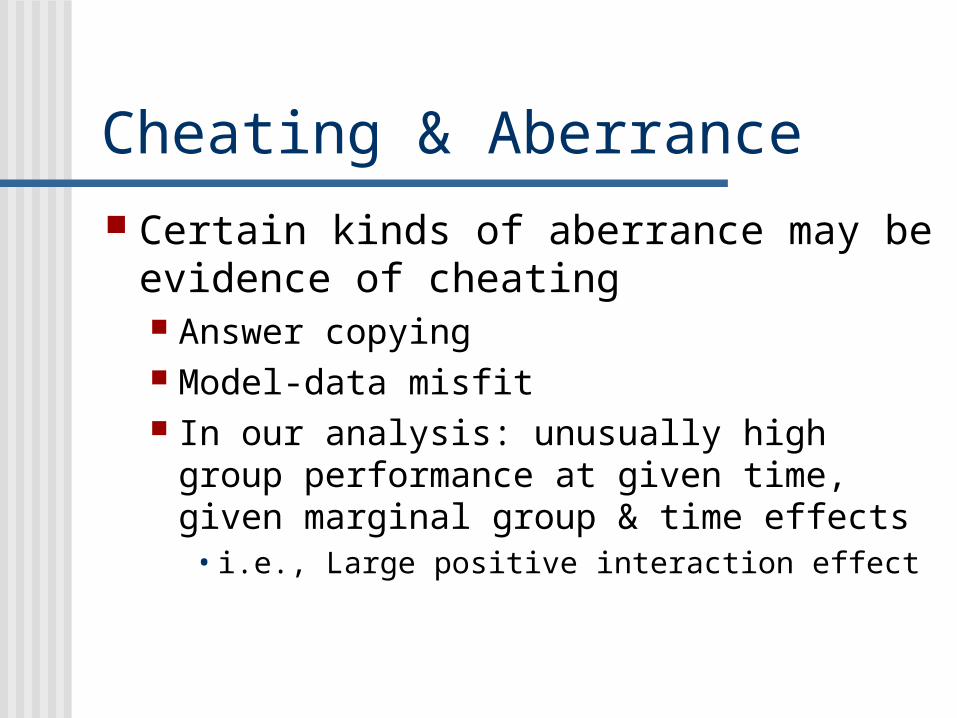
Cheating & Aberrance Certain kinds of aberrance may be
evidence of cheating Answer copying Model-data misfit In our analysis: unusually high group
performance at given time, given marginal group & time effects• i.e., Large positive interaction effect

Important Note No cheating/aberrance detection
method can “prove” cheating, but merely flag unusual individuals or groups for further review.
Our goal is to demonstrate detection of known group-level cheating with adequate power while maintaining an acceptable Type I error rate.

Methods – Data Simulation Data created to emulate a
vertically scaled SWA 3 linked administrations,
means increasing 0.5 between each Time t = 0, 0.5, 1
60 Groups, N(g) within ranging from 10 to 260 (Total N = 4,650)
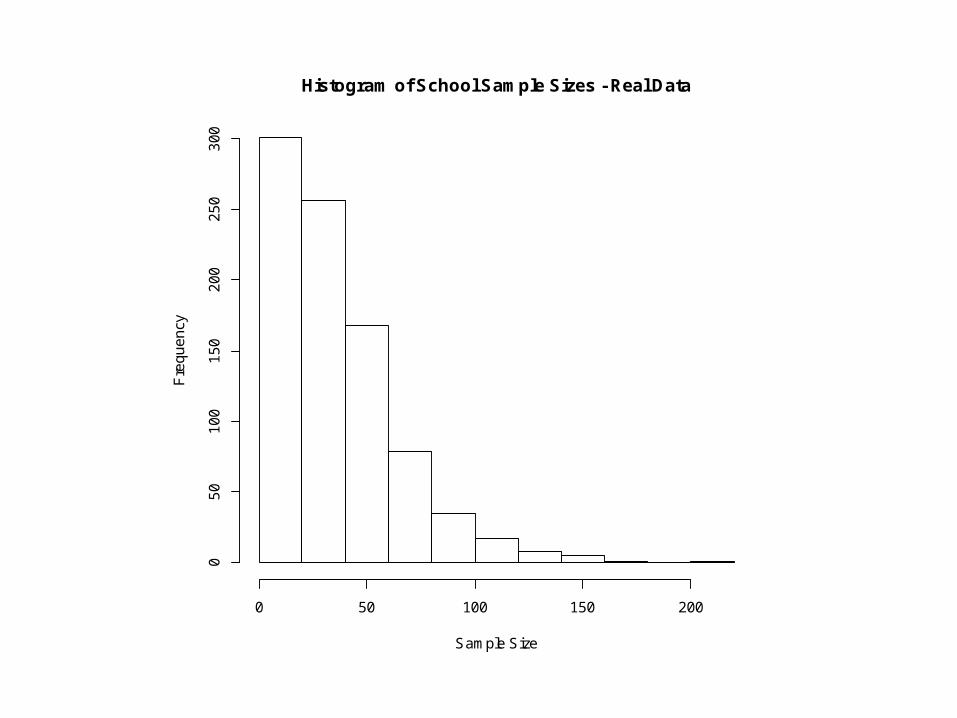
Histogram of School Sample Sizes - Real Data
Sample Size
Fre
qu
en
cy
0 50 100 150 200
05
01
00
15
02
00
25
03
00
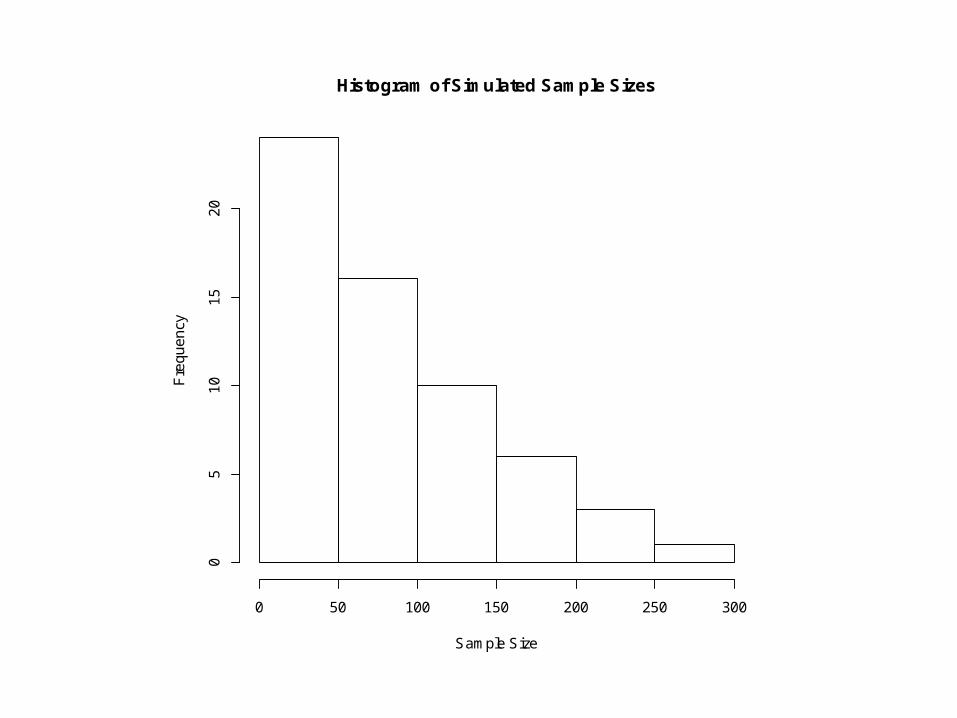
Histogram of Simulated Sample Sizes
Sample Size
Fre
qu
en
cy
0 50 100 150 200 250 300
05
10
15
20
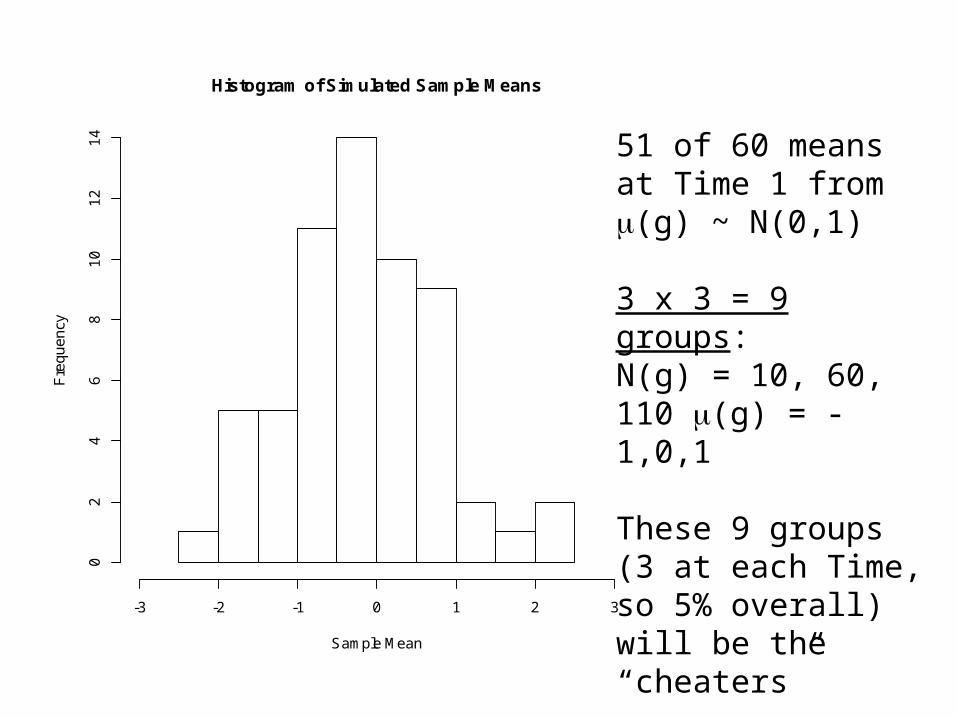
Histogram of Simulated Sample Means
Sample Mean
Fre
qu
en
cy
-3 -2 -1 0 1 2 3
02
46
81
01
21
4 51 of 60 means at Time 1 from (g) ~ N(0,1)
3 x 3 = 9 groups: N(g) = 10, 60, 110 (g) = -1,0,1
These 9 groups (3 at each Time, so 5% overall) will be the “cheaters”
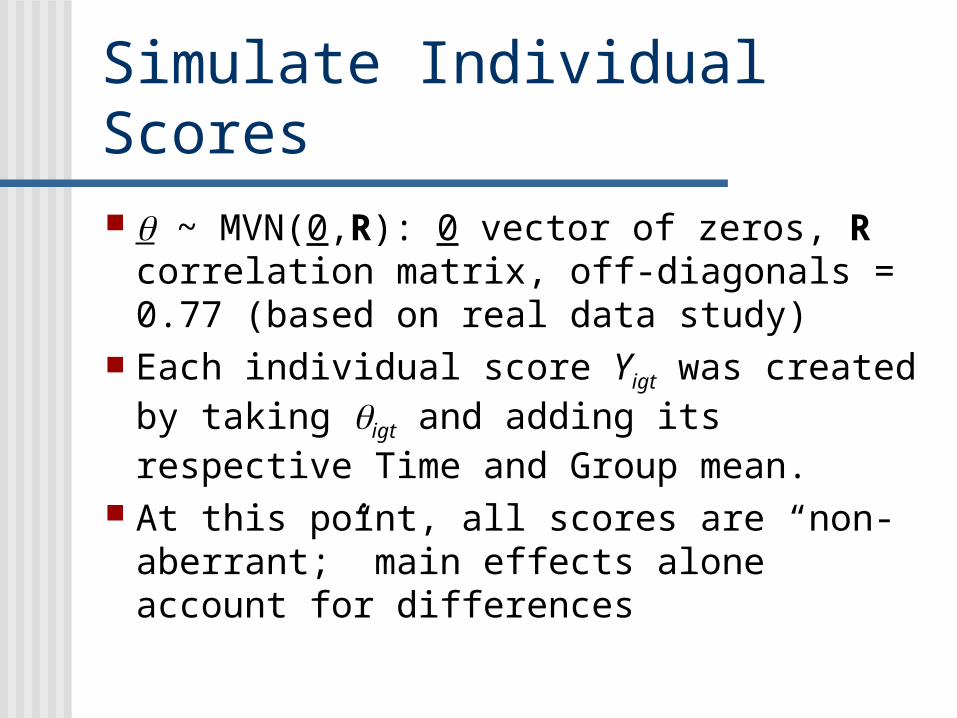
Simulate Individual Scores ~ MVN(0,R): 0 vector of zeros, R
correlation matrix, off-diagonals = 0.77 (based on real data study)
Each individual score Yigt was created by taking igt and adding its respective Time and Group mean.
At this point, all scores are “non-aberrant;” main effects alone account for differences
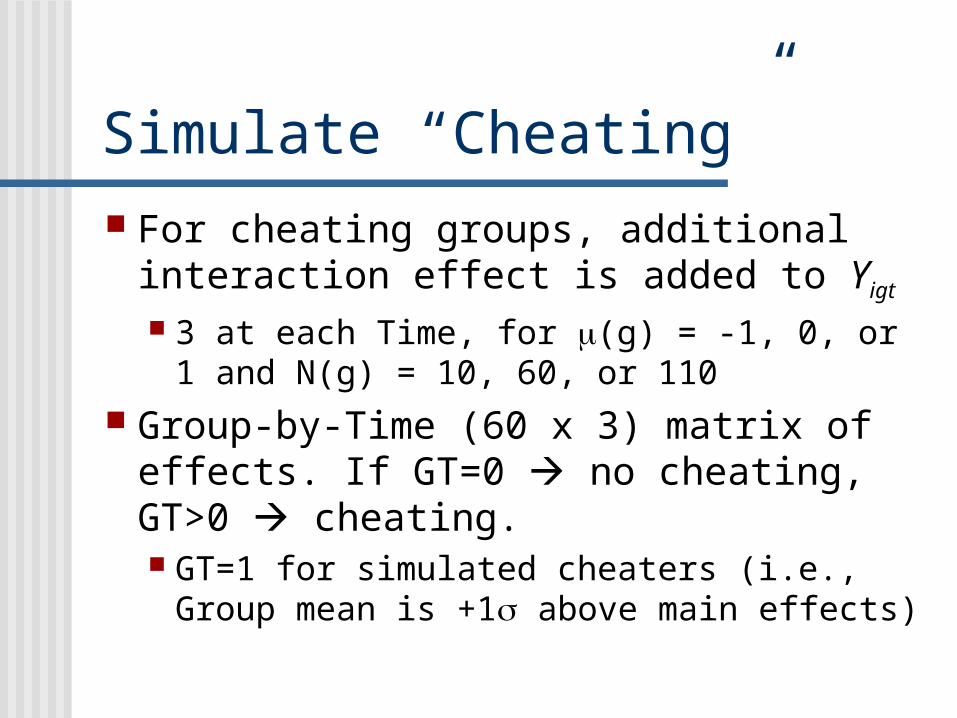
Simulate “Cheating” For cheating groups, additional
interaction effect is added to Yigt
3 at each Time, for (g) = -1, 0, or 1 and N(g) = 10, 60, or 110
Group-by-Time (60 x 3) matrix of effects. If GT=0 no cheating, GT>0 cheating. GT=1 for simulated cheaters (i.e., Group
mean is +1 above main effects)
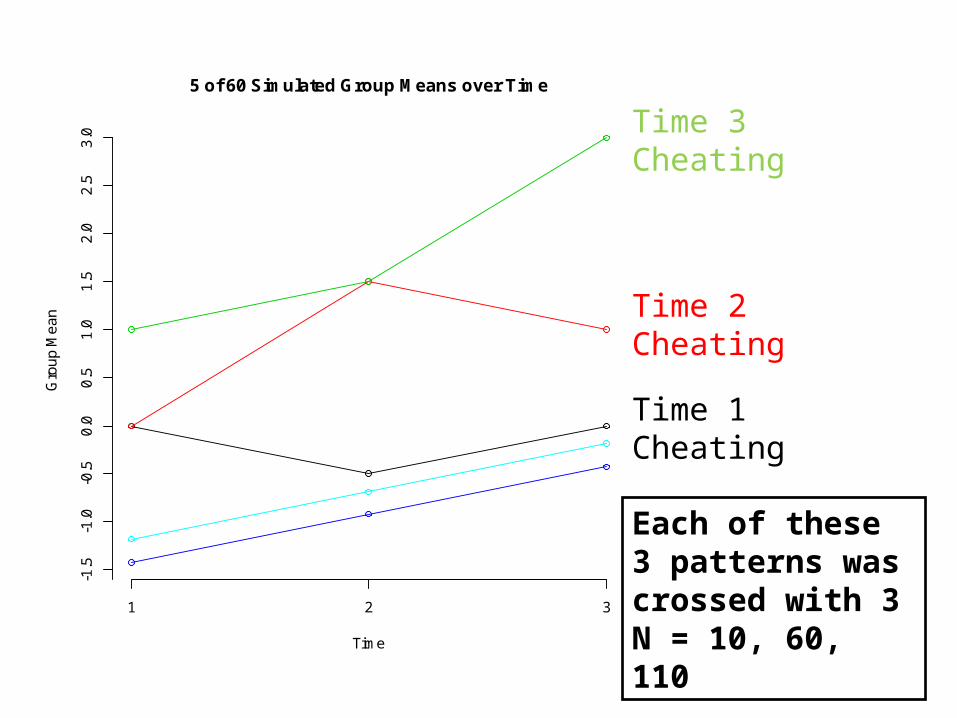
5 of 60 Simulated Group Means over Time
Time
Gro
up
Me
an
1 2 3
-1.5
-1.0
-0.5
0.0
0.5
1.0
1.5
2.0
2.5
3.0 Time 3
Cheating
Time 2 Cheating
Time 1 Cheating
Each of these 3 patterns was crossed with 3 N = 10, 60, 110
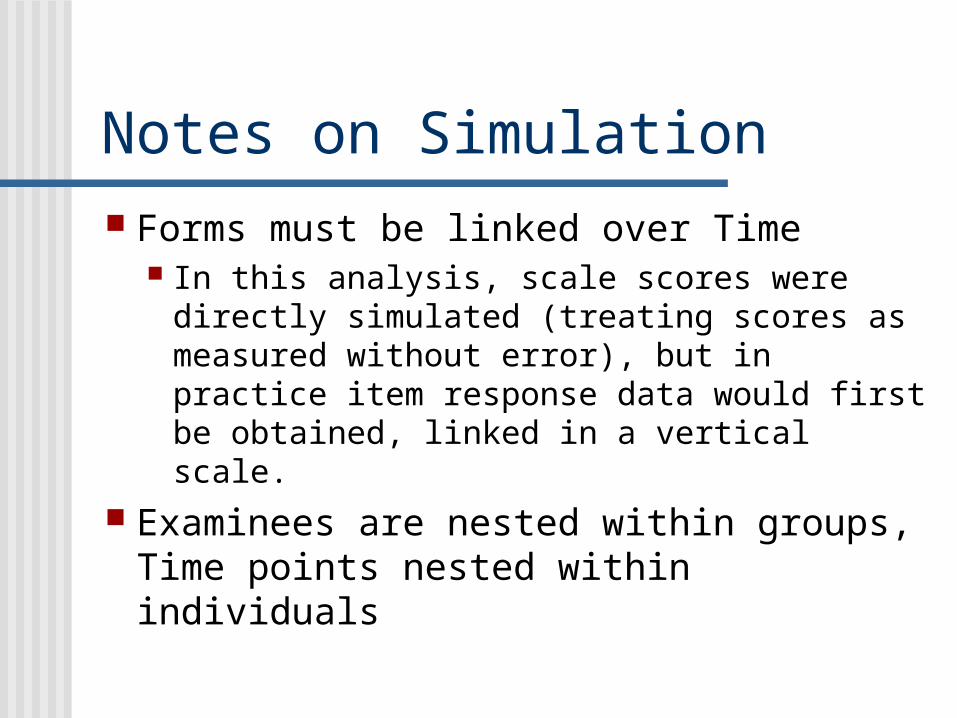
Notes on Simulation Forms must be linked over Time
In this analysis, scale scores were directly simulated (treating scores as measured without error), but in practice item response data would first be obtained, linked in a vertical scale.
Examinees are nested within groups, Time points nested within individuals

Schoolsj = 1,...,J
Individualsi = 1,...,n(j)
Person1j
Schoolj
... ...
Each ij(from separate
calibrations)linked to
vertical scale
Grades3 - 5
Y3ij Y4ij Y5ij
Personij Personn(j)j
Yig1 Yig2 Yig3
Individuals(1,…,N(g)) PersonN(g)gPersonigPerson1g
Time(linked)(1,2,3)
Groups(1,…,G) Groupg

Methods – Analysis Hierarchical Growth Model Model: Scale scores for individuals (i)
within groups (g) over time (t):
Yigt = 0 + 1g + 2t + 3gt + igt
igt ~ N (0, 2) Fully Bayesian estimation (MCMC) using
WinBUGS (Lunn et al, 2000) 50 replications

Baseline Model Only Time- and Group-level effects
are estimated as differences in intercepts (plus interaction term)
With real data, other models could also incorporate covariates (SES, etc.) at any level of the model
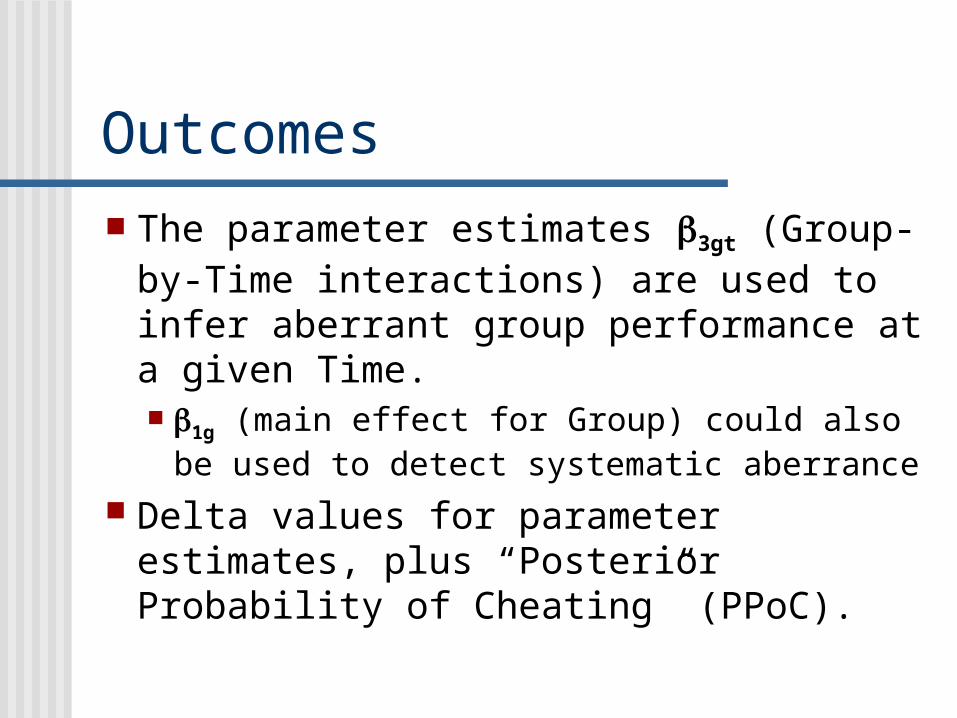
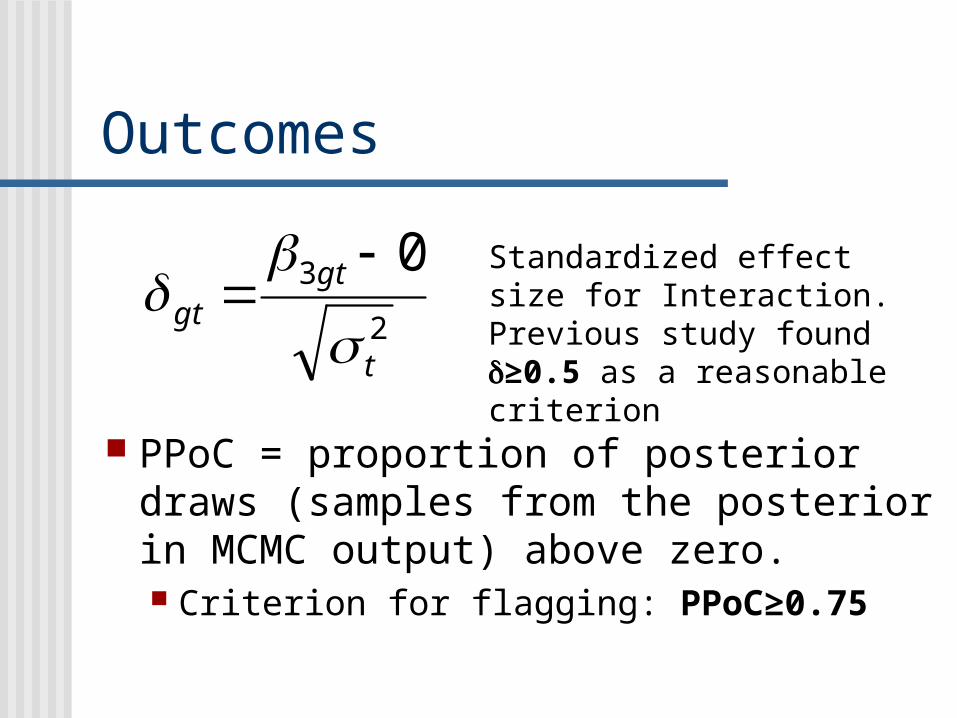
Outcomes The parameter estimates 3gt (Group-
by-Time interactions) are used to infer aberrant group performance at a given Time. 1g (main effect for Group) could also be
used to detect systematic aberrance Delta values for parameter estimates,
plus “Posterior Probability of Cheating” (PPoC).
Outcomes
2
3 0
t
gtgt
PPoC = proportion of posterior draws (samples from the posterior in MCMC output) above zero. Criterion for flagging: PPoC≥0.75
Standardized effect size for Interaction. Previous study found ≥0.5 as a reasonable criterion

Cross-validation Any Group/Time interaction effect
with ≥0.5 and PPoC≥0.75 was considered flagged as aberrant (i.e., potentially cheating).
Over replications, correctly identified groups were part of the Power calculation, false positive flags were part of the Type I error rate.

Results MCMC: 2 chains, 30,000 iterations
each, burn-in=25,000 Very good convergence of solutions
Main effects for Time and Group were well recovered.
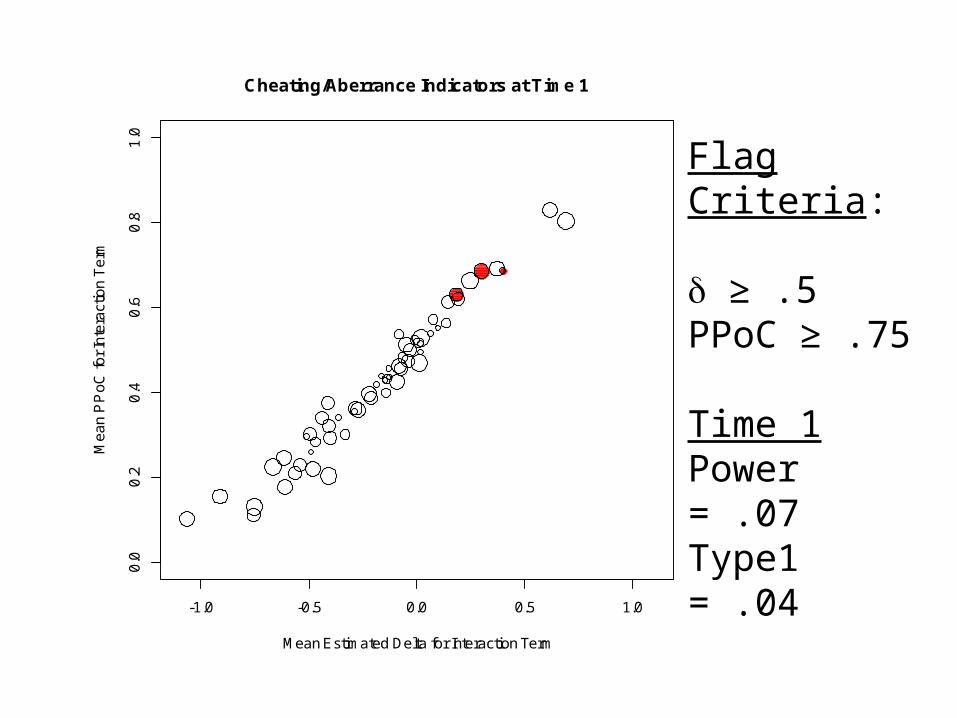
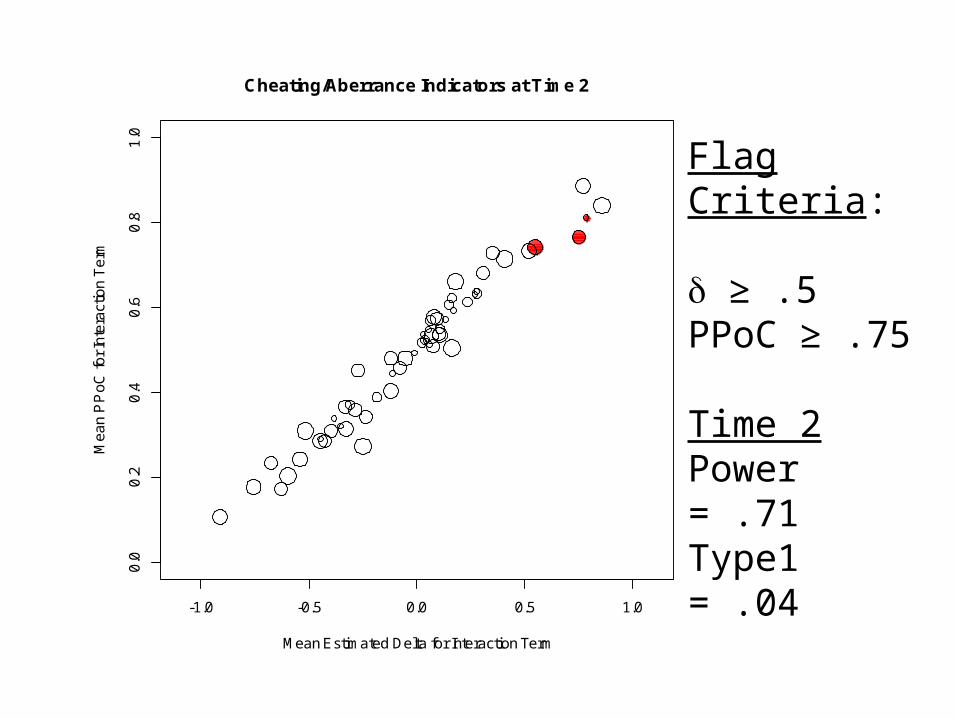
Detection power was very good at Times 2 & 3, quite low for Time 1
Acceptable Type I error rate

0.0 0.2 0.4 0.6 0.8 1.0
-0.6
-0.4
-0.2
0.0
0.2
0.4
0.6
r = 0.995
True Time Mean
Ave
rag
e E
stim
ate
d T
ime
Me
an

-2 -1 0 1 2
-2-1
01
2
r = 0.95, N(groups) = 60
True Group Mean
Me
an
Est
ima
ted
De
lta

-1.0 -0.5 0.0 0.5 1.0
0.0
0.2
0.4
0.6
0.8
1.0
Cheating/Aberrance Indicators
Mean Estimated Delta for Interaction Terms
Me
an
PP
oC
for
Inte
ract
ion
Te
rms
Flag Criteria:
≥ .5PPoC ≥ .75
MarginalPower = .59Type1 = .04

-1.0 -0.5 0.0 0.5 1.0
0.0
0.2
0.4
0.6
0.8
1.0
Cheating/Aberrance Indicators
Mean Estimated Delta for Interaction Terms
Me
an
PP
oC
for
Inte
ract
ion
Te
rms
Flag Criteria:
≥ .5PPoC ≥ .75
MarginalPower = .59Type1 = .04
-1.0 -0.5 0.0 0.5 1.0
0.0
0.2
0.4
0.6
0.8
1.0
Cheating/Aberrance Indicators at Time 1
Mean Estimated Delta for Interaction Term
Me
an
PP
oC
for
Inte
ract
ion
Te
rm
Flag Criteria:
≥ .5PPoC ≥ .75
Time 1Power = .07Type1 = .04
-1.0 -0.5 0.0 0.5 1.0
0.0
0.2
0.4
0.6
0.8
1.0
Cheating/Aberrance Indicators at Time 2
Mean Estimated Delta for Interaction Term
Me
an
PP
oC
for
Inte
ract
ion
Te
rm
Flag Criteria:
≥ .5PPoC ≥ .75
Time 2Power = .71Type1 = .04

-1.0 -0.5 0.0 0.5 1.0
0.0
0.2
0.4
0.6
0.8
1.0
Cheating/Aberrance Indicators at Time 3
Mean Estimated Delta for Interaction Term
Me
an
PP
oC
for
Inte
ract
ion
Te
rm
Flag Criteria:
≥ .5PPoC ≥ .75
Time 3Power = 1Type1 = .05

Discussion Overall power is quite good, very
poor at Time 1 Type I error rate acceptable Pretty encouraging results; more
simulations, replications planned More conditions with various
effect sizes, sample sizes, non-linear trends, etc.

How might this method be used in practice? Flagged groups may be compared to
the Overall growth trajectory to infer aberrance of performance.
Groups flagged must then be investigated further. Unusual performance could be caused by
cheating, or it could indicate something exemplary!
Commend or Condemn?