Embed Size (px)
Citation preview

High Resolution QTL Maps Of 31 Traits in g Q pContemporary U.S. Holstein Cows
J.B. Cole1, G.R. Wiggans1, L. Ma2, T.S. Sonstegard3, B.A. Crooker2, C.P. Van Tassell1, 3, J. Yang, L.K. Matukumalli and Y. Da2
11Animal Improvement Programs Laboratory, 10300 Baltimore Avenue, Beltsville, MD 20705-2350, USA2Department of Animal Science, University of Minnesota, Saint Paul, MN 55108, USA
3Bovine Functional Genomics Laboratory, 10300 Baltimore Avenue, Beltsville, MD 20705-1350, USA
August 2010

Objectivesj• Identify SNP effects and gene regions associated with
31 dairy traits in contemporary U.S. Holstein cows31 dairy traits in contemporary U.S. Holstein cows• 9 net merit traits:
MY, FY, PY, FPC, PPC, SCS, DPR, PL, NM, , , , , , , ,
• 4 calving traits: SCE, DCE, SSB, DSB• 18 body conformation traits18 body conformation traits
– Body size: STA, STR, BD, RW (4)– Body shape: DF, RA (2)– Udder and teats: FUA, RUH, UD, UC, FTP, RTP, TL (7)– Feet-legs: FA, RLS, RLR, FL (4)– Final score: FS (1)
2

Material and methods• 1654 Contemporary Holstein cows• 45,878 SNPs from Illumina Bovine SNP50TM chipp• SNP locations by UMD 3.1• Gene locations by UMD 3.1 and BTAU 4.0 y _• PTA values as phenotypic values• Statistical tests by EPISNPmpi programStatistical tests by EPISNPmpi program
– Testing 3 effects per SNP: genotypic, additive and dominance effects
– Results were partially checked by PLINK– (All reported effects were additive effects)
3
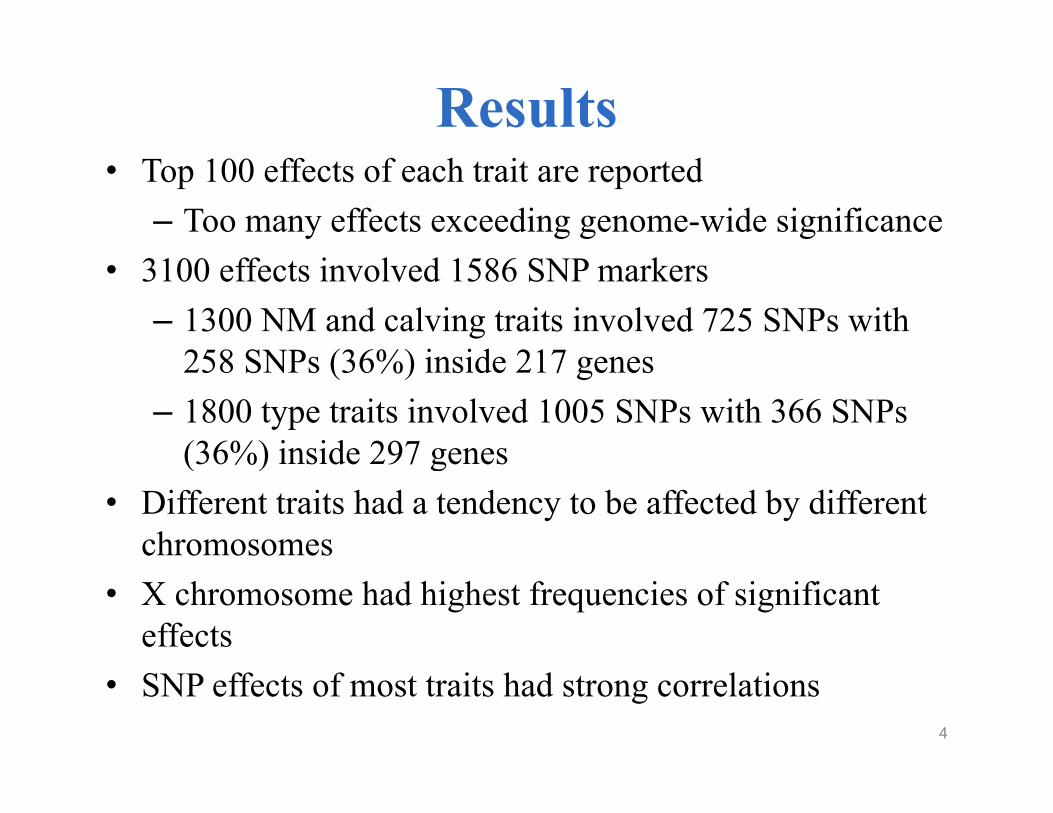
Results• Top 100 effects of each trait are reported
– Too many effects exceeding genome-wide significance• 3100 effects involved 1586 SNP markers
– 1300 NM and calving traits involved 725 SNPs with 258 SNP (36%) i id 217258 SNPs (36%) inside 217 genes
– 1800 type traits involved 1005 SNPs with 366 SNPs (36%) inside 297 genes(36%) inside 297 genes
• Different traits had a tendency to be affected by different chromosomes
• X chromosome had highest frequencies of significant effects
• SNP effects of most traits had strong correlations 4

Distribution of top 100 most significant results for each of the 13 net merit and calving traits by chromosome (10 or more effects are in bold face).
Chr MY FY PY FPC PPC SCS DPR PL NM SCE DCE SSB DSB SUM
1 2 4 4 4 5 4 17 15 15 7 6 7 3 932 3 0 0 0 1 11 2 1 0 0 0 0 2 203 10 4 1 4 1 7 17 9 1 4 0 4 6 684 3 2 2 0 0 0 0 4 0 2 0 3 0 165 2 2 2 7 13 4 0 0 2 7 3 10 0 526 2 2 5 1 6 9 0 2 5 0 6 0 1 397 0 6 1 1 2 13 15 11 4 4 11 0 6 748 2 1 0 0 0 1 3 4 1 0 0 0 3 159 7 6 1 1 2 0 0 0 4 4 3 1 6 35
10 5 0 0 0 3 2 6 0 0 1 0 4 0 2111 3 3 3 1 3 1 0 0 0 1 0 0 5 2012 2 1 1 2 3 6 0 0 1 8 2 6 1 3313 13 12 8 4 1 1 2 0 4 1 0 0 7 5313 13 12 8 4 1 1 2 0 4 1 0 0 7 5314 2 1 1 24 2 0 2 0 0 0 0 6 4 4215 1 2 1 2 0 0 0 1 1 1 1 4 5 1916 1 0 0 0 0 11 1 2 0 0 0 3 3 2117 4 7 6 11 14 1 5 9 14 20 21 7 2 12118 8 4 6 5 4 2 5 8 10 9 12 6 4 8319 2 3 2 0 0 0 0 0 0 0 0 0 3 1020 0 2 11 0 2 2 0 0 0 1 1 1 5 2521 4 1 5 0 5 0 0 0 1 2 1 6 5 3022 1 0 0 0 0 2 3 3 1 0 1 0 2 1323 5 5 9 2 3 1 0 0 3 2 1 1 16 4824 2 1 2 2 2 1 0 1 2 1 1 3 0 1825 0 2 0 3 0 5 1 0 0 0 0 1 0 12
0 6 6 10 3 4 9 11 6 10 9 1 8226 0 7 6 6 10 3 4 9 11 6 10 9 1 8227 5 6 7 0 1 1 0 1 3 3 1 0 1 2928 0 0 5 0 1 0 3 2 3 3 1 1 1 2029 0 0 0 0 0 2 1 1 1 0 2 1 3 11X 11 16 11 19 16 9 12 15 12 12 16 15 3 167U 0 0 0 1 0 1 1 2 1 1 0 1 2 10
12 24 22 17 23 29 34 25 23 38 23 24 21
5a This is the rounded cut-off p-value for the top 100 most significant SNPs of this trait.
Pa 10-12 10-24 10-22 10-17 10-23 10-29 10-34 10-25 10-23 10-38 10-23 10-24 10-21
R2 0.42 0.43 0.42 0.45 0.40 0.54 0.53 0.54 0.49 0.52 0.42 0.56 0.55

QTL Maps of 4 Chromosomes for Net Merit and Calving Traits
6

100
MilkFatProteinFat PercentPro Percent
A: Significant SNP effects from data analysis
4060
80
-log1
0(P
val
ue)
Net MeritProd LifeSCSDPRSire Calv EaseDtr Calv EaseSire Still BirthDtr Still Birth
0 10 20 30 40 50 60 70 80 90 100 110 120
020
Chromosome 7
B: Bioinformatics analysis revealed a large gene cluster underneath the SNP effects
6080
100
0(P
val
ue)
MilkFatProteinFat PercentPro PercentNet MeritProd LifeSCSDPRSire Calv EaseDtr Calv EaseSire Still BirthDtr Still Birth
This 15.4Mb region approximately had 1166 genes (not counting pseudo and RNA genes). C: The large gene cluster
of 1166 genes underneath the SNP ff t
0 10 20 30 40 50 60 70 80 90 100 110 120
020
40-log1
0
LSM7‐SPPL2B‐OAZ1
INSR SLC6A7
LSM4‐JUND
effects
7
0 10 20 30 40 50 60 70 80 90 100 110 120
Chromosome 7

DGAT1-NIBP regions associated with fat percent (FPC)
DGAT1DGAT1VPS28CYHR1
NIBP
446847816752782.8Mb ▼▼
134887801463676 11.5Mb▼ ▼
10
8
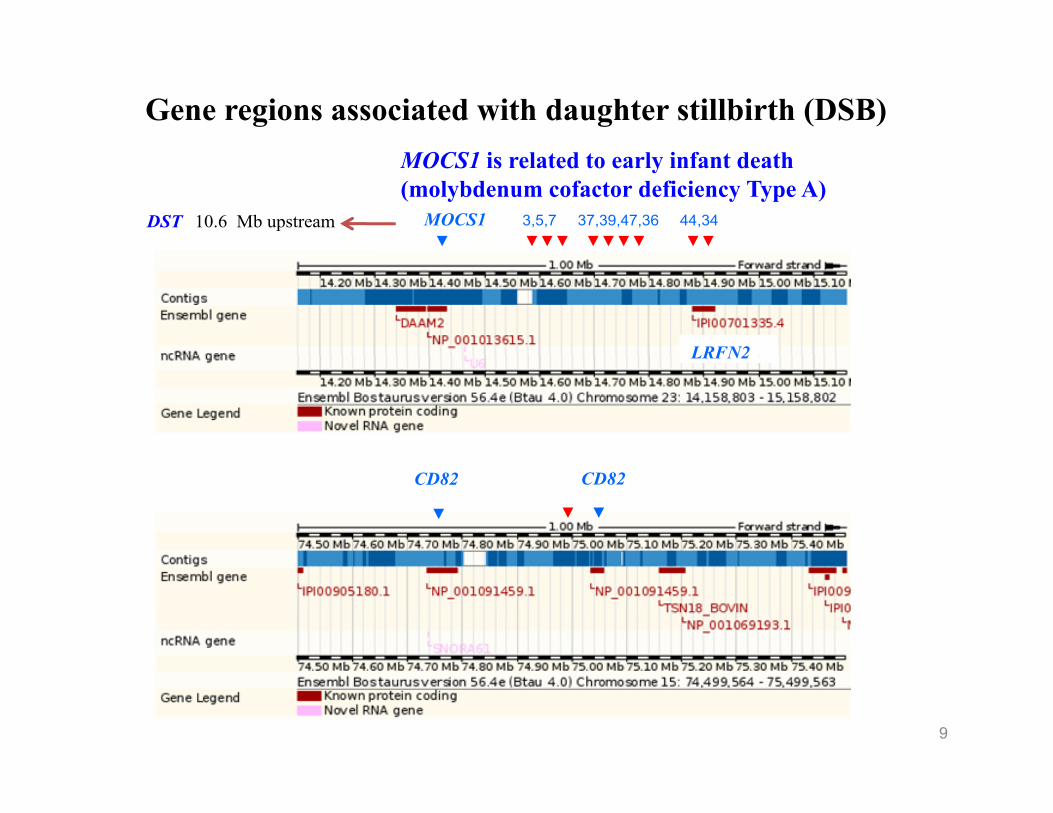
Gene regions associated with daughter stillbirth (DSB)
DST 10.6 Mb upstream MOCS1 3,5,7 37,39,47,36 44,34▼ ▼▼▼ ▼▼▼▼ ▼▼
MOCS1 is related to early infant death(molybdenum cofactor deficiency Type A)
LRFN2LRFN2
CD82
▼
CD82
▼ ▼
9

UMD
Gene regions of top two effects of net merit and calving traits
Trait ChrUMDposition
A FA FAF Gene Region
MY 13 58070117 AG G 0.291 19.7Kb D GNASMY 3 47165828 AG G 0.362 114Kb U LOC781902
AG G b GFY, PY, PL, NM,SCE, DCE
18 53948569 AG G 0.091 409 bases D PGLYRP1,16Kb D IGFL1
FY X 146244046 AG A 0.096 113.2Kb D LOC616260PY, NM, SCE 1 28362687 AG G 0.067 220.9Kb U LOC521010FPC 14 1801116 AG G 0.183 DGAT1FPC 14 4336714 AG G 0.322 NIBPPPC X 12604306 AG A 0.074 1 Mb BlankPPC 26 49137602 AG G 0.089 29.9Kb U MGMTPPC 26 49137602 AG G 0.089 29.9Kb U MGMTSCS, DPR 7 17403976 AC A 0.323 1.5Kb D INSRSCS 2 27814925 AG A 0.253 LASS6-STK39DPR X 3167117 AG A 0.245 80Kb U ATP1B4PL X 106241123 CG C 0 131 30 1Kb U LOC520057PL X 106241123 CG C 0.131 30.1Kb U LOC520057
SSB, DCE 18 58696066 AG A 0.114LOC787057zinc finger protein 415-like (NCBI)
DSB 15 75749702 AG G 0.848 23.9Kb U 2nd CD82
10
DSB 23 3320932 AG A 0.476 DST
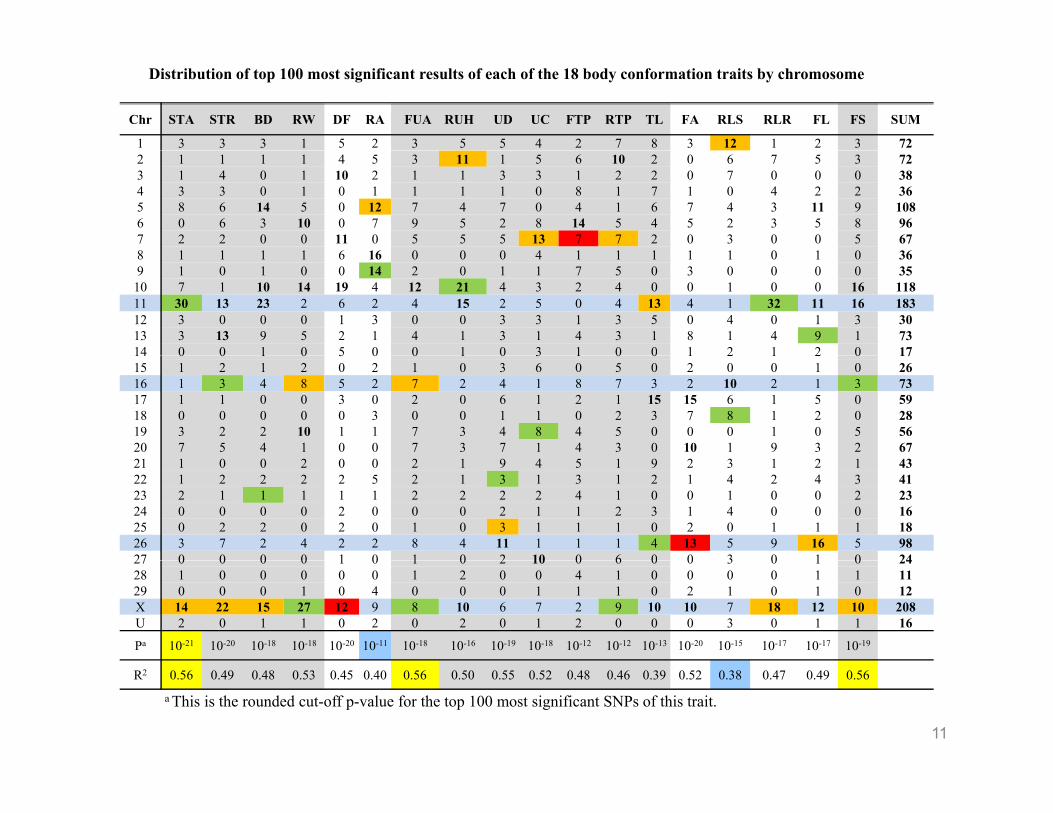
Chr STA STR BD RW DF RA FUA RUH UD UC FTP RTP TL FA RLS RLR FL FS SUM
1 3 3 3 1 5 2 3 5 5 4 2 7 8 3 12 1 2 3 72
Distribution of top 100 most significant results of each of the 18 body conformation traits by chromosome
2 1 1 1 1 4 5 3 11 1 5 6 10 2 0 6 7 5 3 723 1 4 0 1 10 2 1 1 3 3 1 2 2 0 7 0 0 0 384 3 3 0 1 0 1 1 1 1 0 8 1 7 1 0 4 2 2 365 8 6 14 5 0 12 7 4 7 0 4 1 6 7 4 3 11 9 1086 0 6 3 10 0 7 9 5 2 8 14 5 4 5 2 3 5 8 967 2 2 0 0 11 0 5 5 5 13 7 7 2 0 3 0 0 5 678 1 1 1 1 6 16 0 0 0 4 1 1 1 1 1 0 1 0 368 1 1 1 1 6 16 0 0 0 4 1 1 1 1 1 0 1 0 369 1 0 1 0 0 14 2 0 1 1 7 5 0 3 0 0 0 0 35
10 7 1 10 14 19 4 12 21 4 3 2 4 0 0 1 0 0 16 11811 30 13 23 2 6 2 4 15 2 5 0 4 13 4 1 32 11 16 18312 3 0 0 0 1 3 0 0 3 3 1 3 5 0 4 0 1 3 3013 3 13 9 5 2 1 4 1 3 1 4 3 1 8 1 4 9 1 7314 0 0 1 0 5 0 0 1 0 3 1 0 0 1 2 1 2 0 1714 0 0 1 0 5 0 0 1 0 3 1 0 0 1 2 1 2 0 1715 1 2 1 2 0 2 1 0 3 6 0 5 0 2 0 0 1 0 2616 1 3 4 8 5 2 7 2 4 1 8 7 3 2 10 2 1 3 7317 1 1 0 0 3 0 2 0 6 1 2 1 15 15 6 1 5 0 5918 0 0 0 0 0 3 0 0 1 1 0 2 3 7 8 1 2 0 2819 3 2 2 10 1 1 7 3 4 8 4 5 0 0 0 1 0 5 5620 7 5 4 1 0 0 7 3 7 1 4 3 0 10 1 9 3 2 6721 1 0 0 2 0 0 2 1 9 4 5 1 9 2 3 1 2 1 4322 1 2 2 2 2 5 2 1 3 1 3 1 2 1 4 2 4 3 4123 2 1 1 1 1 1 2 2 2 2 4 1 0 0 1 0 0 2 2324 0 0 0 0 2 0 0 0 2 1 1 2 3 1 4 0 0 0 1625 0 2 2 0 2 0 1 0 3 1 1 1 0 2 0 1 1 1 1826 3 7 2 4 2 2 8 4 11 1 1 1 4 13 5 9 16 5 9827 0 0 0 0 1 0 1 0 2 10 0 6 0 0 3 0 1 0 2427 0 0 0 0 1 0 1 0 2 10 0 6 0 0 3 0 1 0 2428 1 0 0 0 0 0 1 2 0 0 4 1 0 0 0 0 1 1 1129 0 0 0 1 0 4 0 0 0 1 1 1 0 2 1 0 1 0 12X 14 22 15 27 12 9 8 10 6 7 2 9 10 10 7 18 12 10 208U 2 0 1 1 0 2 0 2 0 1 2 0 0 0 3 0 1 1 16
Pa 10-21 10-20 10-18 10-18 10-20 10-11 10-18 10-16 10-19 10-18 10-12 10-12 10-13 10-20 10-15 10-17 10-17 10-19
11
R2 0.56 0.49 0.48 0.53 0.45 0.40 0.56 0.50 0.55 0.52 0.48 0.46 0.39 0.52 0.38 0.47 0.49 0.56
a This is the rounded cut-off p-value for the top 100 most significant SNPs of this trait.

QTL Maps of 4 Chromosomes for Type Traits
12
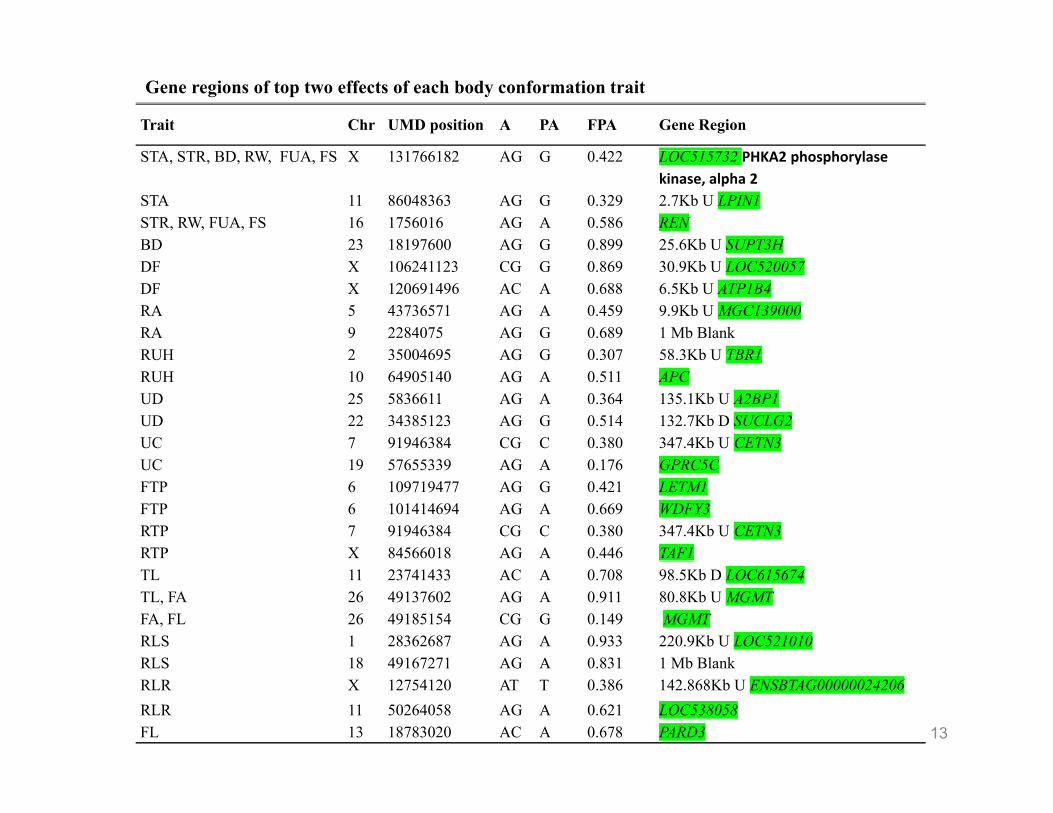
Trait Chr UMD position A PA FPA Gene Region
Gene regions of top two effects of each body conformation trait
STA, STR, BD, RW, FUA, FS X 131766182 AG G 0.422 LOC515732 PHKA2 phosphorylasekinase, alpha 2
STA 11 86048363 AG G 0.329 2.7Kb U LPIN1STR, RW, FUA, FS 16 1756016 AG A 0.586 RENBD 23 18197600 AG G 0.899 25.6Kb U SUPT3HDF X 106241123 CG G 0.869 30.9Kb U LOC520057DF X 120691496 AC A 0.688 6.5Kb U ATP1B4RA 5 43736571 AG A 0.459 9.9Kb U MGC139000RA 9 2284075 AG G 0.689 1 Mb BlankRUH 2 35004695 AG G 0 307 58 3Kb U TBR1RUH 2 35004695 AG G 0.307 58.3Kb U TBR1RUH 10 64905140 AG A 0.511 APCUD 25 5836611 AG A 0.364 135.1Kb U A2BP1UD 22 34385123 AG G 0.514 132.7Kb D SUCLG2UC 7 91946384 CG C 0.380 347.4Kb U CETN3UC 19 57655339 AG A 0.176 GPRC5CFTP 6 109719477 AG G 0.421 LETM1FTP 6 101414694 AG A 0.669 WDFY3RTP 7 91946384 CG C 0.380 347.4Kb U CETN3RTP X 84566018 AG A 0.446 TAF1TL 11 23741433 AC A 0.708 98.5Kb D LOC615674TL, FA 26 49137602 AG A 0.911 80.8Kb U MGMTFA, FL 26 49185154 CG G 0.149 MGMTRLS 1 28362687 AG A 0.933 220.9Kb U LOC521010RLS 18 49167271 AG A 0 831 1 Mb Blank
13
RLS 18 49167271 AG A 0.831 1 Mb BlankRLR X 12754120 AT T 0.386 142.868Kb U ENSBTAG00000024206RLR 11 50264058 AG A 0.621 LOC538058FL 13 18783020 AC A 0.678 PARD3

Correlations between SNP effects (upper triangle) of the 725 SNPs and between PTA values (lower triangle) of net merit and calving traits.
MY FY PY FPC PPC DPR PL NM$ SCS SCE DCE SSB DSB
MY 0.87 0.92 0.56 0.58 0.24 0.42 0.69-0.24 -0.66 -0.62 -0.51 0.11
FY 0.69 0.97 0.89 0.87 0.47 0.65 0.87-0.45 -0.87 -0.81 -0.75 -0.03
0 42 0 86 0 79 0 73 0 01PY 0.87 0.82 0.81 0.86 0.46 0.63 0.86
-0.42 -0.86 -0.79 -0.73 0.01
FPC -0.22 0.56 0.10 0.93 0.59 0.72 0.85-0.53 -0.86 -0.80 -0.80 -0.15
PPC -0.17 0.32 0.33 0.62 0.63 0.74 0.87-0.55 -0.90 -0.82 -0.83 -0.13
DPR -0.29 -0.17 -0.19 0.10 0.17 0.96 0.83-0.60 -0.78 -0.83 -0.82 -0.71
PL 0.05 0.20 0.15 0.22 0.20 0.75 0.93-0.66 -0.87 -0.92 -0.88 -0.66
NM$ 0 54 0 73 0 70 0 36 0 36 0 40 0 76-0.52 -0.96 -0.97 -0.91 -0.44
NM$ 0.54 0.73 0.70 0.36 0.36 0.40 0.76
SCS 0.08 -0.04 0.02 -0.15 -0.12 -0.94 -0.91 -0.800.73 0.80 0.78 0.70
SCE -0.20 -0.35 -0.34 -0.23 -0.30 -0.40 -0.48 -0.570.30 0.95 0.96 0.30
DCE -0.27 -0.35 -0.35 -0.17 -0.19 -0.33 -0.47 -0.600.27 0.68 0.91 0.51
SSB -0.02 -0.16 -0.14 -0.19 -0.23 -0.34 -0.40 -0.390.27 0.70 0.41 0.39
DSB -0.05 -0.08 -0.06 -0.05 -0.03 -0.41 -0.46 -0.420.29 0.24 0.62 0.24
14
DSB 0.05 0.08 0.06 0.05 0.03 0.41 0.46 0.42

Correlation between SNP effects of type traits and net-merit-calving traits.
MY FY PY FPC PPC SCS DPR PL NM SCE DCE SSB DSB
STA 0.55 0.60 0.53 0.51 0.36 -0.44 0.13 0.37 0.56 -0.41 -0.62 -0.39 -0.23
STR 0.63 0.77 0.71 0.73 0.62 -0.59 0.39 0.60 0.77 -0.65 -0.78 -0.60 -0.33
BD 0.55 0.59 0.52 0.50 0.33 -0.33 0.03 0.28 0.49 -0.34 -0.54 -0.30 -0.15
RW 0.40 0.42 0.36 0.35 0.21 -0.38 0.06 0.28 0.43 -0.24 -0.52 -0.21 -0.34
DF 0.03 -0.21 -0.24 -0.37 -0.52 0.45 -0.76 -0.61 -0.44 0.56 0.34 0.56 0.29
RA 0.58 0.64 0.63 0.55 0.52 -0.45 0.46 0.57 0.65 -0.64 -0.66 -0.53 -0.21
FUA 0.45 0.55 0.50 0.51 0.42 -0.65 0.38 0.59 0.68 -0.50 -0.74 -0.51 -0.55
RUH 0 45 0 43 0 38 0 32 0 17 0 40 0 08 0 32 0 46 0 25 0 52 0 25 0 40RUH 0.45 0.43 0.38 0.32 0.17 -0.40 0.08 0.32 0.46 -0.25 -0.52 -0.25 -0.40
UD 0.38 0.51 0.47 0.52 0.46 -0.76 0.53 0.70 0.73 -0.55 -0.78 -0.59 -0.65
UC 0.02 -0.10 -0.14 -0.18 -0.30 -0.07 -0.31 -0.14 -0.07 0.26 -0.06 0.21 -0.23
FTP 0.38 0.45 0.43 0.40 0.38 -0.55 0.28 0.48 0.57 -0.39 -0.65 -0.39 -0.51
RTP 0.06 -0.02 -0.04 -0.09 -0.16 -0.12 -0.22 -0.05 0.03 0.16 -0.15 0.12 -0.31
TL -0.22 -0.51 -0.52 -0.65 -0.76 0.67 -0.75 -0.75 -0.72 0.76 0.74 0.72 0.46
FA 0.67 0.83 0.80 0.79 0.75 -0.66 0.50 0.72 0.87 -0.76 -0.85 -0.72 -0.36
RLS -0.55 -0.75 -0.76 -0.77 -0.82 0.63 -0.71 -0.80 -0.86 0.83 0.76 0.77 0.37RLS 0.55 0.75 0.76 0.77 0.82 0.63 0.71 0.80 0.86 0.83 0.76 0.77 0.37
RLR 0.66 0.74 0.70 0.65 0.56 -0.34 0.12 0.39 0.63 -0.51 -0.65 -0.46 -0.12
FL 0.61 0.72 0.67 0.66 0.57 -0.58 0.34 0.60 0.75 -0.60 -0.77 -0.58 -0.39
FS 0.50 0.53 0.47 0.44 0.30 -0.48 0.16 0.40 0.55 -0.36 -0.62 -0.36 -0.39
15

ConclusionsConclusions• 1586 SNP markers were identified to have top-100
effects for 31 dairy traits in U S Holstein cowseffects for 31 dairy traits in U.S. Holstein cows
A l b f d i i t d• A large number of genes and gene regions associated with the 1586 SNP markers were identified
• Improving many dairy traits in desirable directions using SNP markers is possibleusing SNP markers is possible
AcknowledgementsFunding
USDA/NRI Grant no. 2008-35205-18846 Holstein Association USA Minnesota Supercomputer Institute, University of Minnesotap p , y Agricultural Experiment Station, University of Minnesota
DNA samples Holstein Association USA Genetic Visions Genetic Visions Genex Cooperative Inc. Iowa State University Pennsylvania State University Virginia Polytechnic Institute and State University Virginia Polytechnic Institute and State University University of Florida University of Minnesota National Center for Genetic Resources Preservation, USDA/ARS The Cooperative Dairy DNA Repository (CDDR), USDA/ARS The Cooperative Dairy DNA Repository (CDDR), USDA/ARS
Body conformation dataT. Lawlor, Holstein Association USA