Embed Size (px)
Citation preview
www.advenergymat.de
1902881 (1 of 9) © 2019 The Authors. Published by WILEY-VCH Verlag GmbH & Co. KGaA, Weinheim
Full PaPer
High Active Material Loading in All-Solid-State Battery Electrode via Particle Size Optimization
Tan Shi, Qingsong Tu, Yaosen Tian, Yihan Xiao, Lincoln J. Miara, Olga Kononova, and Gerbrand Ceder*
DOI: 10.1002/aenm.201902881
been shown, multiple hurdles still have to be overcome before they can truly compete with today’s commercialized Li-ion cells in terms of energy density.[4] In this paper, we focus on active material loading in the cathode as one of these challenges. Com-posite cathodes for SSBs are typically made up of the cathode active material (CAM), a solid electrolyte (SE), and carbon, and can be fabricated in multiple ways, the sim-plest one of them consisting of mixing the three components and then pressing or sintering them together with the bulk SE/separator layer.[5–8] However, because of the large solid-electrolyte fraction (30–50 wt%) typically required in cathode compos-ites to provide sufficient ionic diffu-sion,[5,6,9,10] the volume fraction of cathode (cathode loading) of current SSBs is low, resulting in low energy density. Consid-ering that the cathode loading of liquid cells is typically greater than 90 wt%
(or 50 vol%),[11,12] achieving full capacity in an energy-dense electrode (with >50 vol% cathode loading) is vital for SSBs to be competitive with conventional lithium-ion batteries. An optimal composite cathode morphology should have minimal void space and good cathode/SE contact, and include the minimum amount of SE needed to ensure sufficient Li diffusion between the CAM and bulk electrolyte. Several studies have separately demonstrated that the CAM and SE particle sizes affect the mor-phology of a cold-pressed cathode composite as well as the full-cell performance.[7,13–16]
Using experiments and modeling, we demonstrate in this work that, somewhat surprisingly, very high volume fractions of the cathode can be fully utilized in a composite cathode as long as the ratio of the SE to cathode particle size is controlled. We find that the most critical factor in obtaining high energy density is to keep the SE particle size smaller than that of the active cathode material. By reducing the conductor particle size by a factor 2–3 the cathode, utilization can improve from 20% to 100% even at high total cathode loading. The higher the volume loading of the cathode, the smaller the ratio of SE to cathode size needs to be.
Our modeling results are verified using Li2O–ZrO2 (LZO)-coated LiNi0.5Mn0.3Co0.2O2 (NMC) as the CAM and amorphous 75Li2S–25P2S5 (LPS) as the SE. Using small-particle-size LPS (DSE ≈ 1.5 µm) and large-particle-size NMC (DCAM ≈ 12 µm), we are able to dramatically increase cathode loading towards a commercially viable level without sacrificing specific capacity.
Low active material loading in the composite electrode of all-solid-state bat-teries (SSBs) is one of the main reasons for the low energy density in current SSBs. In this work, it is demonstrated with both modeling and experiments that in the regime of high cathode loading, the utilization of cathode material in the solid-state composite is highly dependent on the particle size ratio of the cathode to the solid-state conductor. The modeling, confirmed by experimental data, shows that higher cathode loading and therefore an increased energy den-sity can be achieved by increasing the ratio of the cathode to conductor particle size. These results are consistent with ionic percolation being the limiting factor in cold-pressed solid-state cathode materials and provide specific guidelines on how to improve the energy density of composite cathodes for solid-state batteries. By reducing solid electrolyte particle size and increasing the cathode active material particle size, over 50 vol% cathode active material loading with high cathode utilization is able to be experimentally achieved, demonstrating that a commercially-relevant, energy-dense cathode composite is achievable through simple mixing and pressing method.
T. Shi, Dr. Q. Tu, Y. Tian, Y. Xiao, Dr. O. Kononova, Prof. G. CederDepartment of Materials Science and EngineeringUniversity of CaliforniaBerkeley, CA 94720, USAE-mail: [email protected]. Xiao, Prof. G. CederMaterials Sciences DivisionLawrence Berkeley National LaboratoryBerkeley, CA 94720, USADr. L. J. MiaraAdvanced Materials LabSamsung Research America3 Van de Graaff Drive, Burlington, MA 01803, USA
The ORCID identification number(s) for the author(s) of this article can be found under https://doi.org/10.1002/aenm.201902881.
1. Introduction
All-solid-state batteries (SSBs) have become an exciting energy storage technology to replace conventional lithium-ion batteries.[1,2] They improve safety by removing organic carbonate-based liquid electrolytes and can potentially increase energy density by utilizing a Li-metal anode.[3] However, while proof of concept of SSBs has
© 2019 The Authors. Published by WILEY-VCH Verlag GmbH & Co. KGaA, Weinheim. This is an open access article under the terms of the Creative Commons Attribution License, which permits use, distribution and repro-duction in any medium, provided the original work is properly cited.
Adv. Energy Mater. 2019, 1902881
www.advenergymat.dewww.advancedsciencenews.com
1902881 (2 of 9) © 2019 The Authors. Published by WILEY-VCH Verlag GmbH & Co. KGaA, Weinheim
Our results provide simple design guidelines to improve the energy density of solid-state batteries by achieving high CAM loading in the composite cathode.
2. Computational and Experimental Methods
2.1. Microstructural Modeling
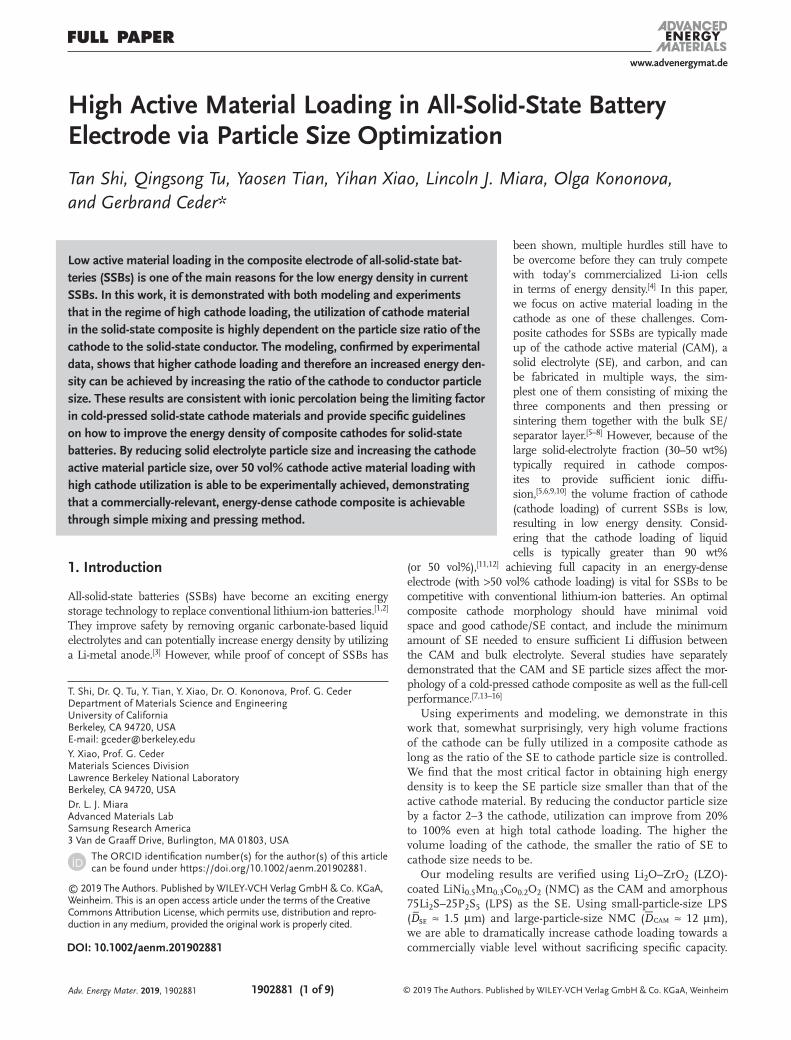
We systematically studied the relation between cathode loading (fCAM), cathode utilization (θCAM), and the particle size of the CAM and the SE through a basic model for the composite cathode. Numerical representations of 3D electrode microstructures are generated by randomly inserting spherical CAM and SE particles into a cubic simulation domain (VBox), as shown in Figure 1a. Electronic conductive agents such as carbon nanofibers (CNFs) are not included in the model as the current study focuses on ionic percolation in the cathode composite. The weight fractions of CAM and SE are defined
as fM
M M=
+0.95
CAMCAM
CAM SE and f
M
M M=
+0.95
SESE
CAM SE, where MCAM and MSE
are the weights of the CAM and SE, respectively. The pref-actor (0.95) is used to account for the 5 wt% CNF used in our experimental cells, but not explicitly included in our model. The standard log-normal particle size distributions used in the simulation have average particle diameter Dc and standard deviation σc (c is either the CAM or the SE), and are shown in Figure 1b. They match the scanning electron microscopy (SEM) measurements of our experimental material as close as
possible and are of similar form to what have been used in other studies.[7,17]
A discrete element method (DEM) implemented in the open-source package LIGGGHTS was used to simulate the pressing process in the experiment.[18–20] Granular contact walls were placed at the bottom and all four vertical boundaries of the box. A flat surface was applied at the top of the simulation box and moved downward at a prescribed velocity until the system reaches a specified pressure of 200 MPa. Pressure was then held constant until the system reaches static equilibrium (i.e., the kinetic energy of the system decayed to zero).[21] The Hert-zian granular contact potential was used to describe the normal and tangential interactions and damping forces[22] as well as the frictional yield (further details are provided in Section S1 in the Supporting Information).[23]
Because Li-ion diffusion is much faster in the SE than in the CAM,[24] we only consider Li-ion percolation pathways through SE particles.[25] A CAM particle is considered to be “active” if at least one Li percolation pathway connects it to the bulk SE layer (as shown in Figure 1c). To analyze whether a CAM par-ticle is active or inactive, we first built networks of CAM par-ticles by connecting each node (CAM or SE particles) with its neighbors and then defined CAM particles as source nodes and SE particles located at the bottom boundary as target nodes.[26] From the network, we extracted the shortest percolating pathway of each active CAM particle to a SE target particle. The cathode utilization (θCAM) in a cathode composite is the ratio of the volume of the active CAM particles to the total CAM volume
Adv. Energy Mater. 2019, 1902881
Figure 1. a) Example microstructures showing the composite cathode from its initial cubic shape (top-left, with box size Lbox) to its final compact shape (bottom-left, with height L) under a pressing pressure of 200 MPa. The model was built using the following parameters: fCAM = 80 wt%, = µ5 mSED ,
= µ5 mCAMD . b) Particle size distributions used in the simulation. The average particle diameters and standard deviations measured from the SEM images were used as inputs in the log-normal distributions. c) Ionic percolating paths for two typical CAM particles (black dash lines). The paths con-nect CAM particles to the composite cathode/bulk SE interface (bottom of the simulation box).

www.advenergymat.dewww.advancedsciencenews.com
1902881 (3 of 9) © 2019 The Authors. Published by WILEY-VCH Verlag GmbH & Co. KGaA, Weinheim
( V Vθ = /CAM CAMactive
CAM). The result for each condition was averaged using at least three different random initial configurations.
The convergence of the percolation results with the simula-tion box size is discussed in Section S2 in the Supporting Infor-mation. We observed an empirical relation between the min-imal initial box size for convergence and the maximal particle size in the model: L D≈ 10min max. Therefore, the box sizes of all the models used in the current study were set to be 1.5-times larger than the critical minimal box size: L L D= ≈1.5 15box min max.
2.2. Experimental Details
2.2.1. Materials Synthesis and Characterization
In our experiments, NMC and LPS were used as the cathode (CAM) and SE materials, respectively. Small-sized NMC powder (DCAM ≈ 5 µm) was provided by Samsung Research Japan, and large-sized NMC powder (DCAM = ≈12 µm) was purchased from MSE Supplies LLC. The 6–8 nm LZO coating was applied to both NMC powders by Samsung Research Japan using the procedure described by Ito et al.[6] The LZO-coated NMC has been shown to minimize the interfacial reaction between NMC and LPS, allowing the current study to mainly focus on the particle size effect. The bulk LPS SE used as the sepa-rator was synthesized by ball milling stoichiometric amounts of Li2S (99.98% Sigma-Aldrich) and P2S5 (99% Sigma-Aldrich) in a 50-mL ZrO2 jar for 200 min using a SPEX 8000M mixer mill. The resulting LPS SE shows an ionic conductivity of 0.39 mS cm−1, consistent with previous reports.[27] The small-particle-size LPS used in the cathode composite was prepared by wet ball milling the LPS SE with heptane and dibutyl ether using a Retsch PM200 ball mill.[7] LPS particles with different average diameters were prepared using ZrO2 balls ranging in size from 1 to 10 mm under different ball-milling condi-tions. The detailed preparation conditions and the ionic conductivities of the small particle LPS are provided in Table S3 in the Supporting Information. We note that the ionic conduc-tivities of the LPS decrease with smaller particle sizes. This
is likely because of the increased grain boundary (or particle boundary) resistance, which can be worsened by any residual solvent from the wet ball milling process. LPS with four dif-ferent average particle sizes (8, 5, 3, and 1.5 µm) was tested with LZO-coated NMC particles with average particle sizes of 5 and 12 µm. Representative SEM images of all the particles are presented in Figure 2.
The SEM images were obtained using a Zeiss Gemini Ultra-55 analytical field-emission scanning electron micro-scope, and were used to estimate the particle sizes. For each sample, the diameters of ≈200 random particles were meas-ured, and the average value was recorded.
2.2.2. Cell Fabrication and Testing
Solid-state cells were fabricated in an Ar-filled glovebox (H2O < 0.1 ppm and O2 < 0.1 ppm). The composite cathode was fabricated by first hand-mixing the LZO-coated NMC par-ticles and LPS for ≈10 min and then mixing them for another ≈10 min after adding 5 wt% CNFs (from Samsung Research Japan). The cell was assembled using a custom-made pres-sure cell consisting of a polyether ether ketone (PEEK) cyl-inder with an inner diameter of 8 mm and two 8-mm-diameter stainless-steel rods as current collectors. The cell was made by closing one end of the cylinder with a current collector. Bulk LPS electrolyte (35 mg) was added and compressed under ≈100-MPa pressure. The cathode composite (≈5 mg) was then spread evenly on top and compacted under ≈200-MPa pressure. Finally, an 8-mm-diameter piece of In metal was attached as the anode, and ≈200-MPa pressure was again applied. The cell was sealed in an Ar-filled airtight jar and cycled under ≈5-MPa pres-sure provided by a spring.
Cell cycling was performed using a Bio-Logic VMP300 system. For all the cells, the cycling voltage window and current density were set to 2–3.7 V versus In metal and 0.05 mA cm−2, respectively. Constant current constant voltage (CCCV) charging was used, where the cell was held for 5 h at the top-of-charge state.
Adv. Energy Mater. 2019, 1902881
Figure 2. a–d) SEM images of LPS with average particle diameters of a) 8, b) 5, c) 3, and d) 1.5 µm prepared using different wet-ball-milling conditions. e,f) SEM images of LZO-coated NMC cathode particles with average diameters of e) 5 and f) 12 µm.
www.advenergymat.dewww.advancedsciencenews.com
1902881 (4 of 9) © 2019 The Authors. Published by WILEY-VCH Verlag GmbH & Co. KGaA, Weinheim
3. Results
3.1. Influence of Particle Size Ratio and Cathode Loading on Cathode Utilization
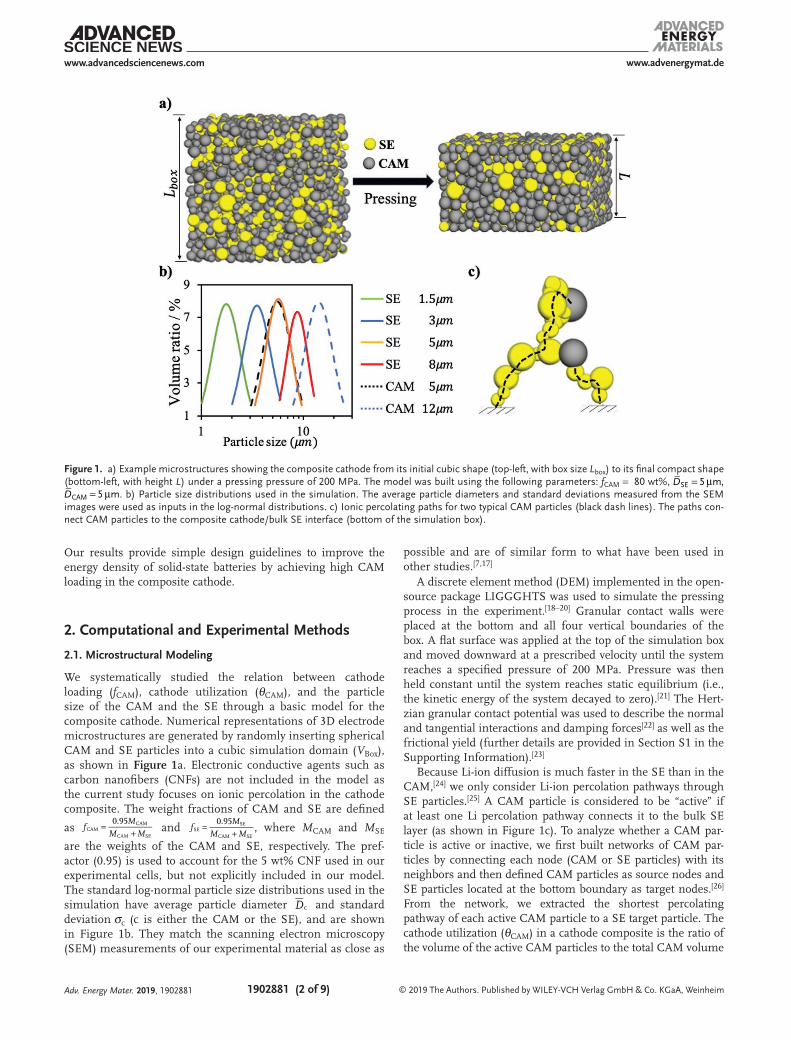
The model results for the effect of cathode loading on the cathode utilization (θCAM) at fixed relative particle size (λ = 1.67) are shown in Figure 3a. For low fCAM (<70 wt%), the CAM particles are fully utilized (θCAM = 1). However, upon increasing the cathode loading above 75 wt%, the cathode utilization decreases drastically. This result is consistent with the idea that Li percolation will weaken as the amount of SE in the composite is reduced. However, for a given λ, there is a corresponding maximum fCAM that still ena-bles full cathode utilization (fCAM ≈70 wt% in this case). We show below that the critical cathode loading at which percolation starts to disappear depends strongly on the SE particle size.
The effect of λ on cathode utilization at fixed fCAM (70 wt%) is shown in Figure 3b. Specifically, we fixed the CAM particle size to 5 µm and determined θCAM for a series of SE particle sizes (1.5, 3, 5, 8, 12, and 15 µm). Somewhat surprisingly, the cathode utilization can vary between 20% and 100% at fixed cathode loading, by merely changing the SE particle size. Percolation clearly decreases when λ < 1. An important observation
from Figure 3b is that a minimum value of λ is required to achieve full cathode utilization at a given cathode loading (λ = 1.67 in this case). To confirm that this effect is indeed caused by the change in λ rather than the SE particle size alone, we also calculated similar data using 12 µm CAM particles and obtained the same results (Figure S2, Supporting Information).
Figure 3a,b clearly shows that cathode utilization is affected by both particle size ratio and cathode loading. To quantita-tively understand this effect, we varied both λ and fCAM and determined the corresponding value of θCAM. Our findings are summarized in Figure 3c and indicate that percolation in the cathode composite consistently improves as fCAM decreases (or as the SE weight fraction increases, moving from top to bottom) and as λ increases (moving from left to right). There-fore, to achieve high capacity in an SSB with high cathode loading a large value of λ should be used. In addition, inde-pendent of fCAM , percolation always significantly worsens for λ < 1, stressing that under all circumstances the SE particle size should be kept smaller than the cathode particle size, which is in direct contrast to the desire for high particle size SE in the separator. Additionally, Figure 3c shows that the benefits of λ reduction are very dependent on the cathode loading for which one is trying to optimize: for fCAM = 80 wt%, increasing
Adv. Energy Mater. 2019, 1902881
Figure 3. Modeling results showing the effect of a) fCAM and b) λ on θCAM. c) θCAM as a function of both λ and fCAM. d) Critical λ needed to achieve θCAM = 80%, 90%, and 98% as a function of fCAM.
www.advenergymat.dewww.advancedsciencenews.com
1902881 (5 of 9) © 2019 The Authors. Published by WILEY-VCH Verlag GmbH & Co. KGaA, Weinheim
λ from 1 to 3 doubles θCAM from ≈30% to ≈60%, but at fCAM = 85 wt% increasing λ from 1 to 8 only slightly increases θCAM from ≈16% to ≈20%.
These simulation results can be summarized in a set of prac-tical design criteria to create high energy density solid-state bat-teries as shown in Figure 3d. For each desired cathode loading and utilization there is a minimum cathode to SE particle size that needs to be used to create the composite. For example, to achieve 98% cathode utilization with 75wt% loading λmin = 2.1. For typical NMC cathode sizes of 5 or 20 µm, this corresponds to a SE particle size of 2.4 and 9.5 µm respectively.
3.2. Visualization of Ionic Percolating Networks
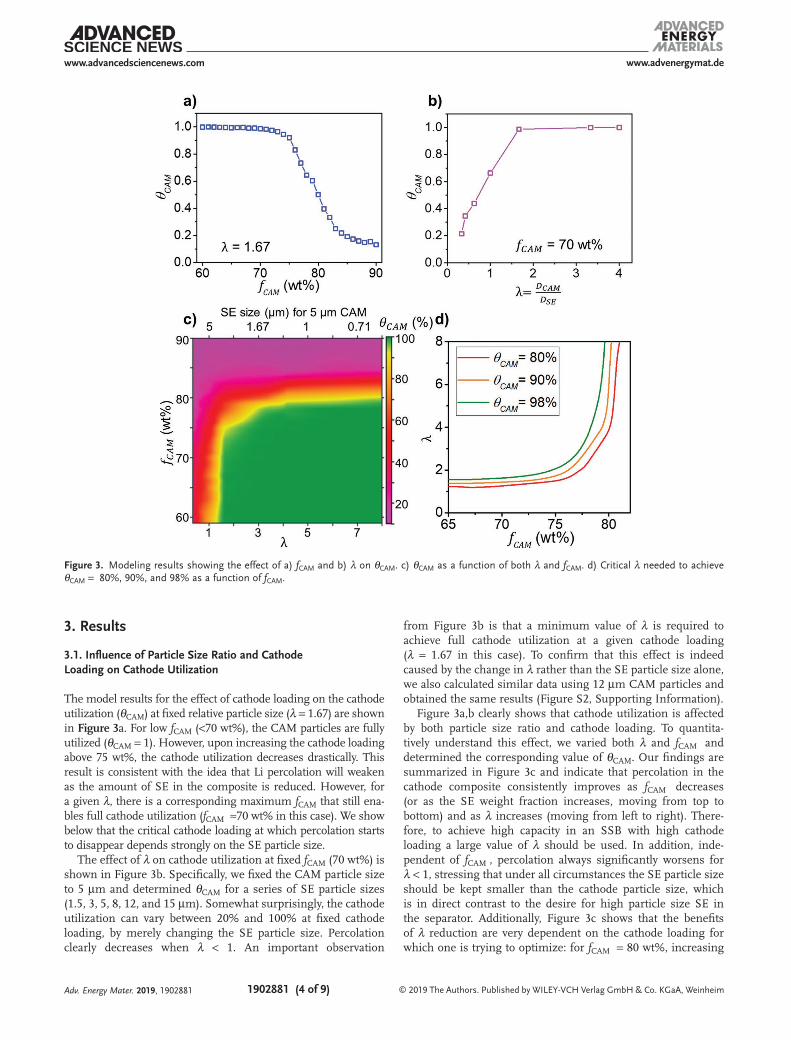
Figure 4 presents visualizations of the composite cathodes and their percolating networks for various cathode loadings and LPS particle sizes, all with D µ= 5 mCAM .
To demonstrate the SE particle size and cathode loading effect, we isolated the SE percolating network (middle panel) and highlighted the active/inactive CAM particles (right panel). Upon increasing fCAM from 70 wt% (Figure 4a) to 80 wt% (Figure 4b) under constant λ (λ = 1.67), the SE volume decreases. Consequently, the SE percolating network becomes smaller and less spatially uniform, resulting in a decrease in θCAM from 98% to 52%.
Comparing Figure 4b,c, where fCAM was fixed at 80 wt% while increasing the SE particle size (λ = 1.67 and 1 for model b and c, respectively), it is apparent that the SE percolating net-work becomes smaller upon increasing the SE particle size.
Therefore, most of the active CAM in model c is limited to the volume near the separator, leading to a low θCAM (θCAM = 52% and 25% for model b and c, respectively).
3.3. Experimental Validation of the Effect of Particle Size Ratio and Cathode Loading on Cathode Utilization
We performed a set of systematic experiments to test the dependence of the cathode utilization on particle size ratio and cathode loading as predicted by the model. Figure 5a presents the results for four cells using LPS of different sizes in the cathode composite. The cathode particle size and fCAM were fixed at 5 µm and 60 wt%, respectively. The cells with 8- and 5-µm LPS particles delivered reduced discharge capacities (≈75 and 125 mAh g−1, respectively) compared with those for the 3- and 1.5-µm LPS particles (>150 mAh g−1) (Figure 5a), proving that the use of smaller SE particles (larger λ) indeed improves θCAM. The good agreement between the experimental and model-predicted specific capacities is shown in Figure 5b. The model-predicted specific capacities were calculated by multiplying the full capacity (largest experimental specific capacity observed, 155 mAh g−1) by the predicted θCAM (shown in Figure 3c).
We also investigated the change in discharge capacity when λ was modified by only changing the CAM particle size, rather than the SE particle size as above. Figure 5c,d presents the variation in discharge capacity when the NMC particle size is increased from 5 to 12 µm while fixing the LPS particle size at either 3 or 1.5 µm (fCAM was fixed at 80 wt%). For both LPS sizes, the cells with 12-µm CAM particles (black curves)
Adv. Energy Mater. 2019, 1902881
Figure 4. Visualization of models for a) fCAM = 70 wt%, = µ3 mSED , b) fCAM = 80 wt%, = µ3 mSED , and c) fCAM = 80 wt%, = µ5 mSED , with CAM shown in gray and SE showed in yellow ( = µ5 mCAMD for all three models). The composite microstructures, isolated SE percolating networks, and isolated CAM particles are shown in the left-hand, middle, and right-hand columns, respectively. The yellow surfaces in the middle column were generated using the QuickSurf method by Gaussian interpolating the SE positions weighted by their diameters.[28] The solid-gray and transparent-gray colors in the right-hand column represent the active and inactive CAM, respectively.

www.advenergymat.dewww.advancedsciencenews.com
1902881 (6 of 9) © 2019 The Authors. Published by WILEY-VCH Verlag GmbH & Co. KGaA, Weinheim
delivered larger discharge capacities than those with 5-µm CAM particles (red curves), further demonstrating that a larger λ benefits θCAM. The initial discharge capacities of the four cells are compared with the model-predicted specific capacities in Figure 5e and show good agreement.
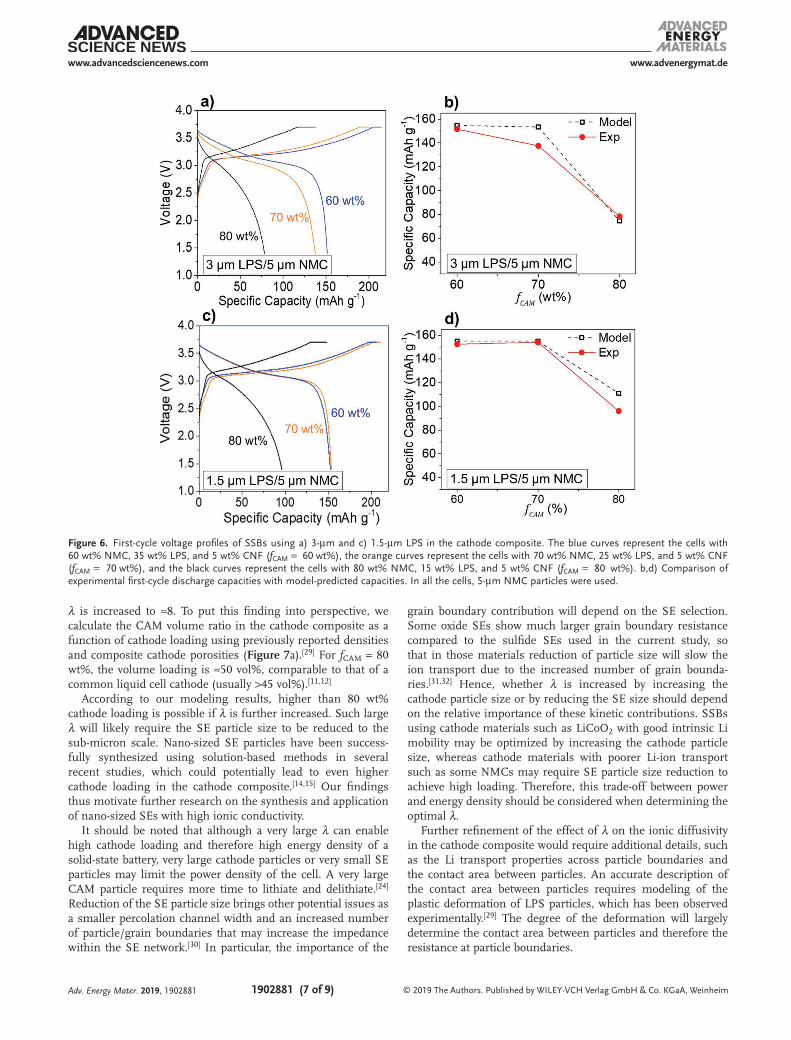
Finally, the effect of fCAM was validated experimentally by varying fCAM while fixing the LPS and NMC particle sizes. Cells with fCAM = 60, 70, and 80 wt% were tested using 5-µm NMC and 3-µm LPS (λ = 1.67, Figure 6a) or 1.5-µm LPS (λ = 3.33, Figure 6c) particles. For fCAM = 60 wt% (blue curves in Figure 6a,c), both LPS sizes fall in the high cathode utiliza-tion area (the green region in Figure 3c). Consistent with this prediction, the experimental voltage curves for both cells are almost identical, with both specific discharge capacities greater than 150 mAh g−1. In contrast, for fCAM = 80 wt% (black curves in Figure 6a,c), both LPS sizes fall into the low-θCAM regions (purple and red regions in Figure 3c), consistent with the dra-matically decreased initial discharge capacity. In addition, a com-parison of the discharge capacities for fCAM = 70 wt% (orange curves in Figure 6a,c) confirms that increasing λ ensures higher θCAM. Because λ is larger for the cells with 1.5-µm LPS, fCAM can be increased from 60 wt% to 70 wt% without any capacity decrease. The experimental data show good agreement with the model-predicted specific capacities (Figure 6b,d).
4. Discussion
Solid-state batteries are an important future energy storage technology that may surpass current Li-ion batteries in both
energy density and safety. However, high energy density can only be achieved if cathode composites can be made with cathode volume fractions close to those in liquid Li ion cells. Our results show that degradation of capacity at high cathode loading is a percolation problem with only the volume of cathode near the separator being activated when the loading is too high. Somewhat surprisingly, both our modeling and exper-imental results indicate that percolation depends as much on the cathode volume fraction as on the ratio of the cathode to SE particle size (λ), and that even at high loading the cathode utilization can be dramatically improved by tuning this ratio. Our findings indicate that a larger λ is beneficial for improving cathode utilization and enables higher cathode loading. More specifically, at the fixed cathode and SE volume, the battery capacity can be significantly improved when using SE and CAM particles so that dSE < dCAM/λ is satisfied. The higher the weight fraction of cathode, the larger the value of λ is.
Experimentally, we demonstrated that both increasing the CAM particle size and reducing the SE particle size are effec-tive ways to achieve a larger λ and therefore higher fCAM. It may seem counterintuitive that a larger cathode particle size actually improves performance as larger particle sizes are associated with longer diffusion paths. But our result is consistent with Li-percolation to the CAM particles being the limiting factor. Larger cathode particles have a higher surface area and there-fore a higher probability of contacting a percolating SE net-work. This finding shows that experience from liquid Li-ion cells cannot always be translated directly to solid-state batteries.
As shown in Figure 5d, fCAM = 80 wt% can be achieved in the cathode composite with near full CAM utilization when
Adv. Energy Mater. 2019, 1902881
Figure 5. a) First-cycle voltage curves of SSBs using different-sized LPS particles in the cathode composite with fixed NMC size (5 µm) and fCAM (60 wt%). b) Comparison of experimental capacities in with model-predicted capacities. c,d) First-cycle voltage curves of SSBs using different-sized NMC particles (5 and 12 µm) in the cathode composite with fixed LPS size (3 µm for (c) and 1.5 µm for (d)) and fCAM (80 wt%). e) Comparison of experimental capacities in (c) and (d) with model-predicted capacities.
www.advenergymat.dewww.advancedsciencenews.com
1902881 (7 of 9) © 2019 The Authors. Published by WILEY-VCH Verlag GmbH & Co. KGaA, WeinheimAdv. Energy Mater. 2019, 1902881
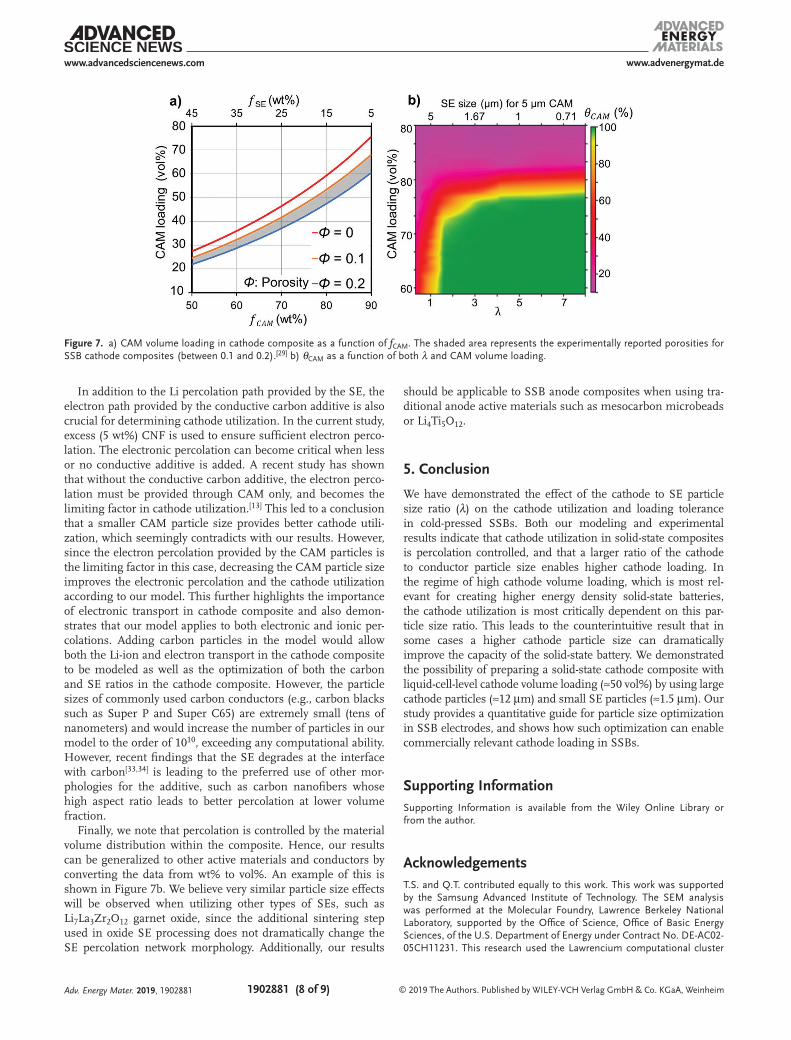
λ is increased to ≈8. To put this finding into perspective, we calculate the CAM volume ratio in the cathode composite as a function of cathode loading using previously reported densities and composite cathode porosities (Figure 7a).[29] For fCAM = 80 wt%, the volume loading is ≈50 vol%, comparable to that of a common liquid cell cathode (usually >45 vol%).[11,12]
According to our modeling results, higher than 80 wt% cathode loading is possible if λ is further increased. Such large λ will likely require the SE particle size to be reduced to the sub-micron scale. Nano-sized SE particles have been success-fully synthesized using solution-based methods in several recent studies, which could potentially lead to even higher cathode loading in the cathode composite.[14,15] Our findings thus motivate further research on the synthesis and application of nano-sized SEs with high ionic conductivity.
It should be noted that although a very large λ can enable high cathode loading and therefore high energy density of a solid-state battery, very large cathode particles or very small SE particles may limit the power density of the cell. A very large CAM particle requires more time to lithiate and delithiate.[24] Reduction of the SE particle size brings other potential issues as a smaller percolation channel width and an increased number of particle/grain boundaries that may increase the impedance within the SE network.[30] In particular, the importance of the
grain boundary contribution will depend on the SE selection. Some oxide SEs show much larger grain boundary resistance compared to the sulfide SEs used in the current study, so that in those materials reduction of particle size will slow the ion transport due to the increased number of grain bounda-ries.[31,32] Hence, whether λ is increased by increasing the cathode particle size or by reducing the SE size should depend on the relative importance of these kinetic contributions. SSBs using cathode materials such as LiCoO2 with good intrinsic Li mobility may be optimized by increasing the cathode particle size, whereas cathode materials with poorer Li-ion transport such as some NMCs may require SE particle size reduction to achieve high loading. Therefore, this trade-off between power and energy density should be considered when determining the optimal λ.
Further refinement of the effect of λ on the ionic diffusivity in the cathode composite would require additional details, such as the Li transport properties across particle boundaries and the contact area between particles. An accurate description of the contact area between particles requires modeling of the plastic deformation of LPS particles, which has been observed experimentally.[29] The degree of the deformation will largely determine the contact area between particles and therefore the resistance at particle boundaries.
Figure 6. First-cycle voltage profiles of SSBs using a) 3-µm and c) 1.5-µm LPS in the cathode composite. The blue curves represent the cells with 60 wt% NMC, 35 wt% LPS, and 5 wt% CNF (fCAM = 60 wt%), the orange curves represent the cells with 70 wt% NMC, 25 wt% LPS, and 5 wt% CNF (fCAM = 70 wt%), and the black curves represent the cells with 80 wt% NMC, 15 wt% LPS, and 5 wt% CNF (fCAM = 80 wt%). b,d) Comparison of experimental first-cycle discharge capacities with model-predicted capacities. In all the cells, 5-µm NMC particles were used.
www.advenergymat.dewww.advancedsciencenews.com
1902881 (8 of 9) © 2019 The Authors. Published by WILEY-VCH Verlag GmbH & Co. KGaA, WeinheimAdv. Energy Mater. 2019, 1902881
In addition to the Li percolation path provided by the SE, the electron path provided by the conductive carbon additive is also crucial for determining cathode utilization. In the current study, excess (5 wt%) CNF is used to ensure sufficient electron perco-lation. The electronic percolation can become critical when less or no conductive additive is added. A recent study has shown that without the conductive carbon additive, the electron perco-lation must be provided through CAM only, and becomes the limiting factor in cathode utilization.[13] This led to a conclusion that a smaller CAM particle size provides better cathode utili-zation, which seemingly contradicts with our results. However, since the electron percolation provided by the CAM particles is the limiting factor in this case, decreasing the CAM particle size improves the electronic percolation and the cathode utilization according to our model. This further highlights the importance of electronic transport in cathode composite and also demon-strates that our model applies to both electronic and ionic per-colations. Adding carbon particles in the model would allow both the Li-ion and electron transport in the cathode composite to be modeled as well as the optimization of both the carbon and SE ratios in the cathode composite. However, the particle sizes of commonly used carbon conductors (e.g., carbon blacks such as Super P and Super C65) are extremely small (tens of nanometers) and would increase the number of particles in our model to the order of 1010, exceeding any computational ability. However, recent findings that the SE degrades at the interface with carbon[33,34] is leading to the preferred use of other mor-phologies for the additive, such as carbon nanofibers whose high aspect ratio leads to better percolation at lower volume fraction.
Finally, we note that percolation is controlled by the material volume distribution within the composite. Hence, our results can be generalized to other active materials and conductors by converting the data from wt% to vol%. An example of this is shown in Figure 7b. We believe very similar particle size effects will be observed when utilizing other types of SEs, such as Li7La3Zr2O12 garnet oxide, since the additional sintering step used in oxide SE processing does not dramatically change the SE percolation network morphology. Additionally, our results
should be applicable to SSB anode composites when using tra-ditional anode active materials such as mesocarbon microbeads or Li4Ti5O12.
5. Conclusion
We have demonstrated the effect of the cathode to SE particle size ratio (λ) on the cathode utilization and loading tolerance in cold-pressed SSBs. Both our modeling and experimental results indicate that cathode utilization in solid-state composites is percolation controlled, and that a larger ratio of the cathode to conductor particle size enables higher cathode loading. In the regime of high cathode volume loading, which is most rel-evant for creating higher energy density solid-state batteries, the cathode utilization is most critically dependent on this par-ticle size ratio. This leads to the counterintuitive result that in some cases a higher cathode particle size can dramatically improve the capacity of the solid-state battery. We demonstrated the possibility of preparing a solid-state cathode composite with liquid-cell-level cathode volume loading (≈50 vol%) by using large cathode particles (≈12 µm) and small SE particles (≈1.5 µm). Our study provides a quantitative guide for particle size optimization in SSB electrodes, and shows how such optimization can enable commercially relevant cathode loading in SSBs.
Supporting InformationSupporting Information is available from the Wiley Online Library or from the author.
AcknowledgementsT.S. and Q.T. contributed equally to this work. This work was supported by the Samsung Advanced Institute of Technology. The SEM analysis was performed at the Molecular Foundry, Lawrence Berkeley National Laboratory, supported by the Office of Science, Office of Basic Energy Sciences, of the U.S. Department of Energy under Contract No. DE-AC02-05CH11231. This research used the Lawrencium computational cluster
Figure 7. a) CAM volume loading in cathode composite as a function of fCAM. The shaded area represents the experimentally reported porosities for SSB cathode composites (between 0.1 and 0.2).[29] b) θCAM as a function of both λ and CAM volume loading.
www.advenergymat.dewww.advancedsciencenews.com
1902881 (9 of 9) © 2019 The Authors. Published by WILEY-VCH Verlag GmbH & Co. KGaA, WeinheimAdv. Energy Mater. 2019, 1902881
resource provided by the IT Division at Lawrence Berkeley National Laboratory (supported by the Director, Office of Science, Office of Basic Energy Sciences, of the U.S. Department of Energy under Contract No. DE-AC02-05CH11231) and the Savio computational cluster resource provided by the Berkeley Research Computing program at the University of California, Berkeley (supported by the UC Berkeley Chancellor, Vice Chancellor for Research, and Chief Information Officer). The authors also gratefully acknowledge Dr. Taku Watanabe, Dr. Yuichi Aihara, Dr. Tomoyuki Tsujimura, and the Samsung R&D Institute of Japan for providing the LZO-coated cathode materials.
Conflict of InterestThe authors declare no conflict of interest.
Keywordsall-solid-state batteries, cathode loading, cathode utilization, ionic percolation
Received: September 3, 2019Revised: November 1, 2019
Published online:
[1] A. Manthiram, X. Yu, S. Wang, Nat. Rev. Mater. 2017, 2, 16103.[2] J. Li, C. Ma, M. Chi, C. Liang, N. J. Dudney, Adv. Energy Mater. 2015,
5, 1401408.[3] J. Liu, Z. Bao, Y. Cui, E. J. Dufek, J. B. Goodenough, P. Khalifah,
Q. Li, B. Y. Liaw, P. Liu, A. Manthiram, Nat. Energy 2019, 4, 180.[4] J. Janek, W. G. Zeier, Nat. Energy 2016, 1, 16141.[5] Y. Kato, S. Hori, T. Saito, K. Suzuki, M. Hirayama, A. Mitsui,
M. Yonemura, H. Iba, R. Kanno, Nat. Energy 2016, 1, 16030.[6] S. Ito, S. Fujiki, T. Yamada, Y. Aihara, Y. Park, T. Y. Kim, S. Baek,
J. Lee, S. Doo, N. Machida, J. Power Sources 2014, 248, 943.[7] A. Sakuda, T. Takeuchi, H. Kobayashi, Solid State Ionics 2016, 285, 112.[8] Y. J. Nam, D. Y. Oh, S. H. Jung, Y. S. Jung, J. Power Sources 2018,
375, 93.[9] Y. Kato, S. Shiotani, K. Morita, K. Suzuki, M. Hirayama, R. Kanno,
J. Phys. Chem. Lett. 2018, 9, 607.[10] A. Sakuda, K. Kuratani, M. Yamamoto, M. Takahashi, T. Takeuchi,
H. Kobayashi, J. Electrochem. Soc. 2017, 164, A2474.[11] P. R. Shearing, N. Brandon, J. Gelb, R. Bradley, P. Withers,
A. Marquis, S. Cooper, S. Harris, J. Electrochem. Soc. 2012, 159, A1023.
[12] M. Ebner, F. Geldmacher, F. Marone, M. Stampanoni, V. Wood, Adv. Energy Mater. 2013, 3, 845.
[13] F. Strauss, T. Bartsch, L. de Biasi, A. Kim, J. Janek, P. Hartmann, T. Brezesinski, ACS Energy Lett. 2018, 3, 992.
[14] M. Calpa, N. C. Rosero-Navarro, A. Miura, K. Tadanaga, Electro-chim. Acta 2019, 296, 473.
[15] H. Wan, J. P. Mwizerwa, X. Qi, X. Xu, H. Li, Q. Zhang, L. Cai, Y. Hu, X. Yao, ACS Appl. Mater. Interfaces 2018, 10, 12300.
[16] A. Bielefeld, D. A. Weber, J. Janek, J. Phys. Chem. C 2019, 123, 1626.
[17] D. Chung, P. R. Shearing, N. P. Brandon, S. J. Harris, R. E. García, J. Electrochem. Soc. 2014, 161, A422.
[18] C. Kloss, C. Goniva, A. Hager, S. Amberger, S. Pirker, Prog. Comput. Fluid Dyn. Int. J. 2012, 12, 140.
[19] A. Di Renzo, F. P. Di Maio, Chem. Eng. Sci. 2005, 60, 1303.[20] M. P. Schöpfer, S. Abe, C. Childs, J. J. Walsh, Int. J. Rock Mech. Min.
Sci. 2009, 46, 250.[21] S. A. Roberts, V. E. Brunini, K. N. Long, A. M. Grillet, J. Electrochem.
Soc. 2014, 161, F3052.[22] L. E. Silbert, D. Ertas, G. S. Grest, T. C. Halsey, D. Levine,
S. J. Plimpton, Phys. Rev. E 2001, 64, 051302.[23] H. Zhang, H. Makse, Phys. Rev. E 2005, 72, 011301.[24] M. Park, X. Zhang, M. Chung, G. B. Less, A. M. Sastry, J. Power
Sources 2010, 195, 7904.[25] M. F. Lagadec, R. Zahn, S. Müller, V. Wood, Energy Environ. Sci.
2018, 11, 3194.[26] W. Zeng, R. L. Church, Int. J. Geogr. Inf. Sci. 2009, 23, 531.[27] A. Hayashi, S. Hama, H. Morimoto, M. Tatsumisago, T. Minami,
J. Am. Ceram. Soc. 2001, 84, 477.[28] M. Krone, J. E. Stone, T. Ertl, K. Schulten, EuroVis—Short Papers
2012, 2012, 67.[29] S. Choi, M. Jeon, J. Ahn, W. D. Jung, S. M. Choi, J. Kim, J. Lim,
Y. Jang, H. Jung, J. Lee, ACS Appl. Mater. Interfaces 2018, 10, 23740.
[30] I. Chu, H. Nguyen, S. Hy, Y. Lin, Z. Wang, Z. Xu, Z. Deng, Y. S. Meng, S. P. Ong, ACS Appl. Mater. Interfaces 2016, 8, 7843.
[31] J. A. Dawson, P. Canepa, M. J. Clarke, T. Famprikis, D. Ghosh, M. S. Islam, Chem. Mater. 2019, 31, 5296.
[32] J. Wu, X. Guo, Phys. Chem. Chem. Phys. 2017, 19, 5880.[33] T. Hakari, M. Deguchi, K. Mitsuhara, T. Ohta, K. Saito, Y. Orikasa,
Y. Uchimoto, Y. Kowada, A. Hayashi, M. Tatsumisago, Chem. Mater. 2017, 29, 4768.
[34] W. Zhang, T. Leichtweiß, S. P. Culver, R. Koerver, D. Das, D. A. Weber, W. G. Zeier, J. Janek, ACS Appl. Mater. Interfaces 2017, 9, 35888.