Embed Size (px)
Citation preview
C A R B O N 6 6 ( 2 0 1 4 ) 5 6 7 – 5 7 5
.sc ienced i rec t .com
Avai lab le a t wwwScienceDirect
journal homepage: www.elsevier .com/ locate /carbon
High and anisotropic thermal conductivity ofbody-centered tetragonal C4 calculated usingmolecular dynamics
0008-6223/$ - see front matter � 2013 Elsevier Ltd. All rights reserved.http://dx.doi.org/10.1016/j.carbon.2013.09.039
* Corresponding author: Fax: +86 10 6279 4531.E-mail address: [email protected] (B. Cao).
Zhenqiang Ye, Bingyang Cao *, Zengyuan Guo
Key Laboratory for Thermal Science and Power Engineering of Ministry of Education, Department of Engineering Mechanics, Tsinghua
University, Beijing 100084, PR China
A R T I C L E I N F O
Article history:
Received 12 March 2013
Accepted 14 September 2013
Available online 20 September 2013
A B S T R A C T
The thermal properties of body-centered tetragonal C4 (bct-C4), a new allotrope of carbon,
were investigated using molecular dynamics (MD) simulations. The calculations gave a
high and anisotropic thermal conductivity that is the first of its kind. The cross-plane ther-
mal conductivity is 1209 W/(m K) at room temperature, which is even higher than that of
diamond. The thermal conductivity decreases as the temperature increases from 80 to
400 K. The density of states of bct-C4 was analyzed, which has a prominent peak at
36 THz. The relaxation times were calculated by fitting a heat flux autocorrelation function.
The results showed that the acoustic phonons play the dominant role in the heat conduc-
tion, with a contribution of more than 99%. The relaxation times decrease with increasing
temperature, as does the contribution of the acoustic phonons. Finally, the thermal con-
ductivity based on lattice dynamics agreed well with that from the MD method, with which
the group velocity and mean free path were deduced. This outstanding thermal property
makes bct-C4 a promising substitute for diamond, especially as thermal interface materials
in microelectronic packaging.
� 2013 Elsevier Ltd. All rights reserved.
1. Introduction
Carbon is one of the most important and fundamental ele-
ments on earth. Owing to the flexibility of the bond hybridiza-
tions, carbon can form various allotropes, such as diamond,
graphite, and amorphous carbon [1]. The physical properties
of these allotropes vary widely. For instance, diamond is the
hardest substance in nature, but graphite is one of the softest
[2]. Researchers are seeking to synthesize new carbon allo-
tropes both theoretically and experimentally to find new
materials with good electronic, magnetic, mechanical and
thermal properties. Thus far, remarkable success has been
achieved in developing carbon nanotubes (CNTs) [3] and
graphene [4,5].
A recent study conducted by Omata et al. [6] discovered a
new allotrope of carbon, body-centered tetragonal C4 (bct-
C4), whose atomic structure consists of only C4 square rings.
They compressed various solid CNTs to different conditions
using tight-binding molecular dynamics (MD) to obtain this
peculiar bct-C4 phase, when they compressed (10, 10) CNT lat-
tices to 20 GPa.
Fig. 1 shows the crystal structure of bct-C4 (Fig. 1a) com-
pared to those of diamond (Fig. 1b) and graphite (Fig. 1c).
The bct-C4 structure consists entirely of sp3-hybridized car-
bon atoms, which is between the layered structure of graphite
and the tetrahedral structure of diamond. The static struc-
tural parameters of bct-C4 at 0 GPa are a = 4.329 A,
c = 2.483 A, and two bond lengths, d1 and d2, of 1.562 and
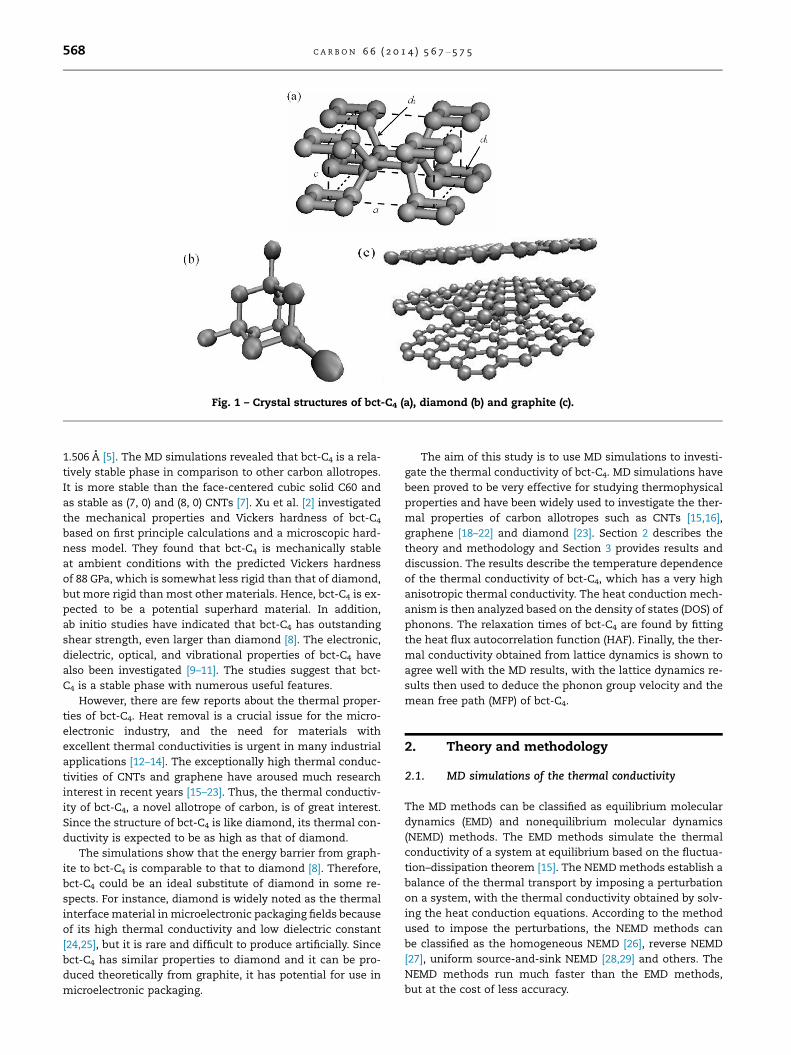
Fig. 1 – Crystal structures of bct-C4 (a), diamond (b) and graphite (c).
568 C A R B O N 6 6 ( 2 0 1 4 ) 5 6 7 – 5 7 5
1.506 A [5]. The MD simulations revealed that bct-C4 is a rela-
tively stable phase in comparison to other carbon allotropes.
It is more stable than the face-centered cubic solid C60 and
as stable as (7, 0) and (8, 0) CNTs [7]. Xu et al. [2] investigated
the mechanical properties and Vickers hardness of bct-C4
based on first principle calculations and a microscopic hard-
ness model. They found that bct-C4 is mechanically stable
at ambient conditions with the predicted Vickers hardness
of 88 GPa, which is somewhat less rigid than that of diamond,
but more rigid than most other materials. Hence, bct-C4 is ex-
pected to be a potential superhard material. In addition,
ab initio studies have indicated that bct-C4 has outstanding
shear strength, even larger than diamond [8]. The electronic,
dielectric, optical, and vibrational properties of bct-C4 have
also been investigated [9–11]. The studies suggest that bct-
C4 is a stable phase with numerous useful features.
However, there are few reports about the thermal proper-
ties of bct-C4. Heat removal is a crucial issue for the micro-
electronic industry, and the need for materials with
excellent thermal conductivities is urgent in many industrial
applications [12–14]. The exceptionally high thermal conduc-
tivities of CNTs and graphene have aroused much research
interest in recent years [15–23]. Thus, the thermal conductiv-
ity of bct-C4, a novel allotrope of carbon, is of great interest.
Since the structure of bct-C4 is like diamond, its thermal con-
ductivity is expected to be as high as that of diamond.
The simulations show that the energy barrier from graph-
ite to bct-C4 is comparable to that to diamond [8]. Therefore,
bct-C4 could be an ideal substitute of diamond in some re-
spects. For instance, diamond is widely noted as the thermal
interface material in microelectronic packaging fields because
of its high thermal conductivity and low dielectric constant
[24,25], but it is rare and difficult to produce artificially. Since
bct-C4 has similar properties to diamond and it can be pro-
duced theoretically from graphite, it has potential for use in
microelectronic packaging.
The aim of this study is to use MD simulations to investi-
gate the thermal conductivity of bct-C4. MD simulations have
been proved to be very effective for studying thermophysical
properties and have been widely used to investigate the ther-
mal properties of carbon allotropes such as CNTs [15,16],
graphene [18–22] and diamond [23]. Section 2 describes the
theory and methodology and Section 3 provides results and
discussion. The results describe the temperature dependence
of the thermal conductivity of bct-C4, which has a very high
anisotropic thermal conductivity. The heat conduction mech-
anism is then analyzed based on the density of states (DOS) of
phonons. The relaxation times of bct-C4 are found by fitting
the heat flux autocorrelation function (HAF). Finally, the ther-
mal conductivity obtained from lattice dynamics is shown to
agree well with the MD results, with the lattice dynamics re-
sults then used to deduce the phonon group velocity and the
mean free path (MFP) of bct-C4.
2. Theory and methodology
2.1. MD simulations of the thermal conductivity
The MD methods can be classified as equilibrium molecular
dynamics (EMD) and nonequilibrium molecular dynamics
(NEMD) methods. The EMD methods simulate the thermal
conductivity of a system at equilibrium based on the fluctua-
tion–dissipation theorem [15]. The NEMD methods establish a
balance of the thermal transport by imposing a perturbation
on a system, with the thermal conductivity obtained by solv-
ing the heat conduction equations. According to the method
used to impose the perturbations, the NEMD methods can
be classified as the homogeneous NEMD [26], reverse NEMD
[27], uniform source-and-sink NEMD [28,29] and others. The
NEMD methods run much faster than the EMD methods,
but at the cost of less accuracy.
C A R B O N 6 6 ( 2 0 1 4 ) 5 6 7 – 5 7 5 569
Since the EMD method is more precise, EMD simulations
are used here to calculate the thermal conductivity of bct-C4
based on the Green–Kubo formula [30]:
k ¼ 1
3VT2kB
Z 1
0
JðtÞ � Jð0Þh i dt; ð1Þ
in which k is the thermal conductivity, V is the system vol-
ume, T is the system temperature, kB is Boltzmann’s constant,
t is the time, and h� � �i denotes the ensemble average. J(t) is the
heat flux in the system at t moment and is defined as:
JðtÞ ¼X
i
viEi þX
i
ridEi
dt; ð2Þ
where ri, vi and Ei are the coordinate, velocity and total energy
of atom i. The Brenner potential [31] has been widely used due
to its superior performance in predicting the mechanical,
chemical and thermal properties of hydrocarbon materials.
Hence, the Brenner potential is used here to describe the
interactions among the carbon atoms in bct-C4. The Brenner
potential can be written as:
U ¼X
i
Xj>i
fðrijÞ VRðrijÞ � bijVAðrijÞh i
; ð3Þ
where U is the total potential entotal potential energy and VR
and VA are the repulsive and attractive parts of the pairwise
binding potential. VR and VA can be given by:
VRðrijÞ ¼D
S� 1exp �b
ffiffiffiffiffiffi2Spðrij � ReÞ
h i; ð4Þ
VAðrijÞ ¼DS
S� 1exp �b
ffiffiffiffiffiffiffiffi2=S
pðrij � ReÞ
h i; ð5Þ
where D, S and b are interaction parameters, Re is the atomic
distance at zero potential, and f(rij) is the truncation function
that explicitly restricts the interaction within the nearest
neighbors. f(rij) is written as:
fðrijÞ ¼
1; rij < Rð2Þ
12 1þ cos
pðrij�Rð1ÞÞRð2Þ�Rð1Þ
� �h i; Rð1Þ < rij < Rð2Þ;
0; rij > Rð2Þ
8>>><>>>:
ð6Þ
in which R(1) and R(2) are the critical values for chemical bond
restructuring and breaking. The bond order parameter �bij
implicitly contains many-body information and is expressed by:
�bij ¼12ðbij þ bjiÞ; ð7Þ
bij ¼ 1þX
kð–i;jÞGðhijkÞfðrikÞ
0@
1A�dc
; ð8Þ
GcðhijkÞ ¼ a0 1þ c20
d20
� c20
d20 þ ð1þ cos hijkÞ
" #: ð9Þ
hjik stands for the included angle between carbon–carbon
bonds, and dc, a0, c0, and d0 are fitting parameters. Detailed
parameters are provided in [31].
2.2. Thermal conductivity based on lattice dynamics
Phonons are quantized lattice vibrations which play a major
role in heat conduction in semiconductors as well as dielec-
trics [32]. The Boltzmann transport equation (BTE) describes
phonon transport in a succinct form. With the linear relaxa-
tion approximation [33], the BTE can be written as:
f � f0
s¼ �vgrT
@f@T
; ð10Þ
where f is the phonon distribution function, f0 is the equilib-
rium distribution, vg is the phonon group velocity, and s is the
relaxation time. Using the distribution function f, the net en-
ergy flux carried by the phonons can be described as:
Q ¼ 1V
Xp
Xk
hmf � vgðp; kÞ; ð11Þ
in which Q denotes the net energy flux, mg is the phonon fre-
quency, h is Planck constant, k is the wave vector, p is the
polarization, and V is the system volume. Combining Eqs.
(10) and (11) gives:
Q ¼ �X
p
Xk
Cðp; kÞv2gðp; kÞsðp; kÞ � rT; ð12Þ
where C(p, k) represents the heat capacity per unit volume.
Comparing Eq. (12) with Fourier’s heat conduction law,
Q = �k$T, gives the following expression for the thermal
conductivity:
k ¼X
p
Xk
Cðp; kÞv2gðp; kÞsðp; kÞ; ð13Þ
For convenience, each part can be replaced by an average va-
lue as:
k ¼ 1
3Cv2
gs ¼1
3Cvgl; ð14Þ
in which l denotes the MFP.
2.3. Simulation details
The simulation region is a three-dimensional box with peri-
odic boundary conditions. For each simulation, the system
was initially brought to equilibrium using the NVT ensemble
(constant number of atoms, N; constant volume, V; and con-
stant temperature, T) for 200,000 steps to the designated tem-
perature, with a time step of 0.5 fs. To study the size effect,
the number of atoms was increased from 2000 to 16,000,
and the system size increased from 5 · 5 · 10 to
10 · 10 · 20 unit cells (UCs). The system temperature was con-
trolled by the Nose–Hoover thermostat [34]. Then, the system
was allowed to evolve with the NVE ensemble (constant num-
ber of atoms, N; constant volume, V; and constant energy, E).
The first 200,000 steps were used to relax the system, with the
next 10,000,000 steps, i.e. tsum = 5000 ps, used for recording
the heat flux. The HAF was calculated based on the
10,000,000 sets of data. The Verlet algorithm [35] was used
to numerically integrate the motion equations.
The ensemble average for the HAF was calculated using
different initial times with an interval of tshift = 0.1 ps and a
sampling duration for the heat flux of tsample = 1200 ps. Hence,
the total number of samples is (tsum � tsample)/tshift + 1 =
38,001. The phonon DOS was computed by taking the Fourier
transform of the velocity autocorrelation function (VAF) [36].
The VAF is written as:
VAFðtÞ ¼ vð0Þ � vðtÞh i ¼ 1N
Xi¼1
við0Þ � viðtÞ* +
; ð15Þ
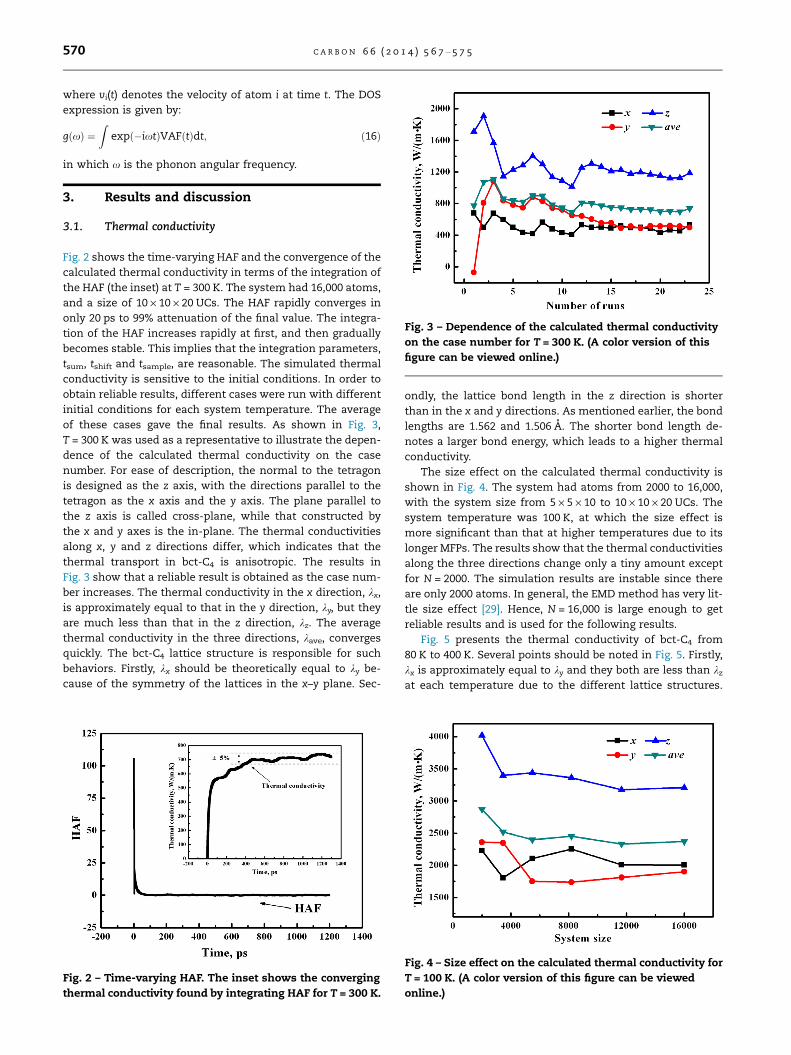
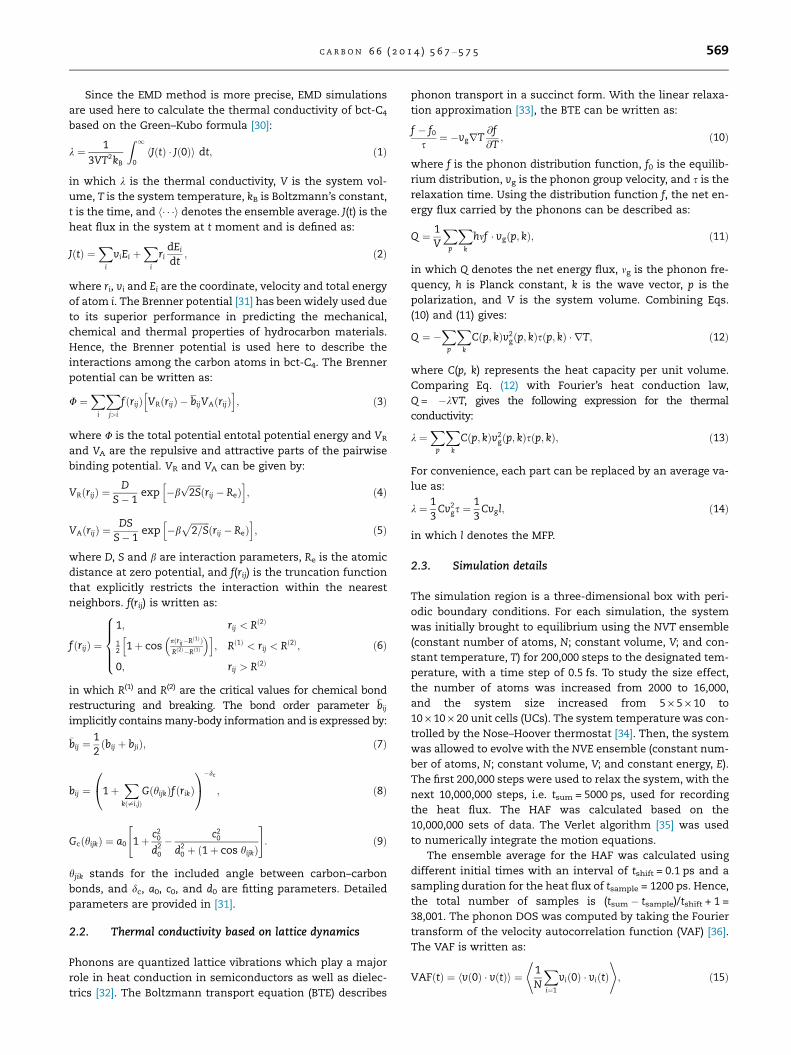
Fig. 3 – Dependence of the calculated thermal conductivity
on the case number for T = 300 K. (A color version of this
figure can be viewed online.)
570 C A R B O N 6 6 ( 2 0 1 4 ) 5 6 7 – 5 7 5
where vi(t) denotes the velocity of atom i at time t. The DOS
expression is given by:
gðxÞ ¼Z
expð�ixtÞVAFðtÞdt; ð16Þ
in which x is the phonon angular frequency.
3. Results and discussion
3.1. Thermal conductivity
Fig. 2 shows the time-varying HAF and the convergence of the
calculated thermal conductivity in terms of the integration of
the HAF (the inset) at T = 300 K. The system had 16,000 atoms,
and a size of 10 · 10 · 20 UCs. The HAF rapidly converges in
only 20 ps to 99% attenuation of the final value. The integra-
tion of the HAF increases rapidly at first, and then gradually
becomes stable. This implies that the integration parameters,
tsum, tshift and tsample, are reasonable. The simulated thermal
conductivity is sensitive to the initial conditions. In order to
obtain reliable results, different cases were run with different
initial conditions for each system temperature. The average
of these cases gave the final results. As shown in Fig. 3,
T = 300 K was used as a representative to illustrate the depen-
dence of the calculated thermal conductivity on the case
number. For ease of description, the normal to the tetragon
is designed as the z axis, with the directions parallel to the
tetragon as the x axis and the y axis. The plane parallel to
the z axis is called cross-plane, while that constructed by
the x and y axes is the in-plane. The thermal conductivities
along x, y and z directions differ, which indicates that the
thermal transport in bct-C4 is anisotropic. The results in
Fig. 3 show that a reliable result is obtained as the case num-
ber increases. The thermal conductivity in the x direction, kx,
is approximately equal to that in the y direction, ky, but they
are much less than that in the z direction, kz. The average
thermal conductivity in the three directions, kave, converges
quickly. The bct-C4 lattice structure is responsible for such
behaviors. Firstly, kx should be theoretically equal to ky be-
cause of the symmetry of the lattices in the x–y plane. Sec-
Fig. 2 – Time-varying HAF. The inset shows the converging
thermal conductivity found by integrating HAF for T = 300 K.
ondly, the lattice bond length in the z direction is shorter
than in the x and y directions. As mentioned earlier, the bond
lengths are 1.562 and 1.506 A. The shorter bond length de-
notes a larger bond energy, which leads to a higher thermal
conductivity.
The size effect on the calculated thermal conductivity is
shown in Fig. 4. The system had atoms from 2000 to 16,000,
with the system size from 5 · 5 · 10 to 10 · 10 · 20 UCs. The
system temperature was 100 K, at which the size effect is
more significant than that at higher temperatures due to its
longer MFPs. The results show that the thermal conductivities
along the three directions change only a tiny amount except
for N = 2000. The simulation results are instable since there
are only 2000 atoms. In general, the EMD method has very lit-
tle size effect [29]. Hence, N = 16,000 is large enough to get
reliable results and is used for the following results.
Fig. 5 presents the thermal conductivity of bct-C4 from
80 K to 400 K. Several points should be noted in Fig. 5. Firstly,
kx is approximately equal to ky and they both are less than kz
at each temperature due to the different lattice structures.
Fig. 4 – Size effect on the calculated thermal conductivity for
T = 100 K. (A color version of this figure can be viewed
online.)
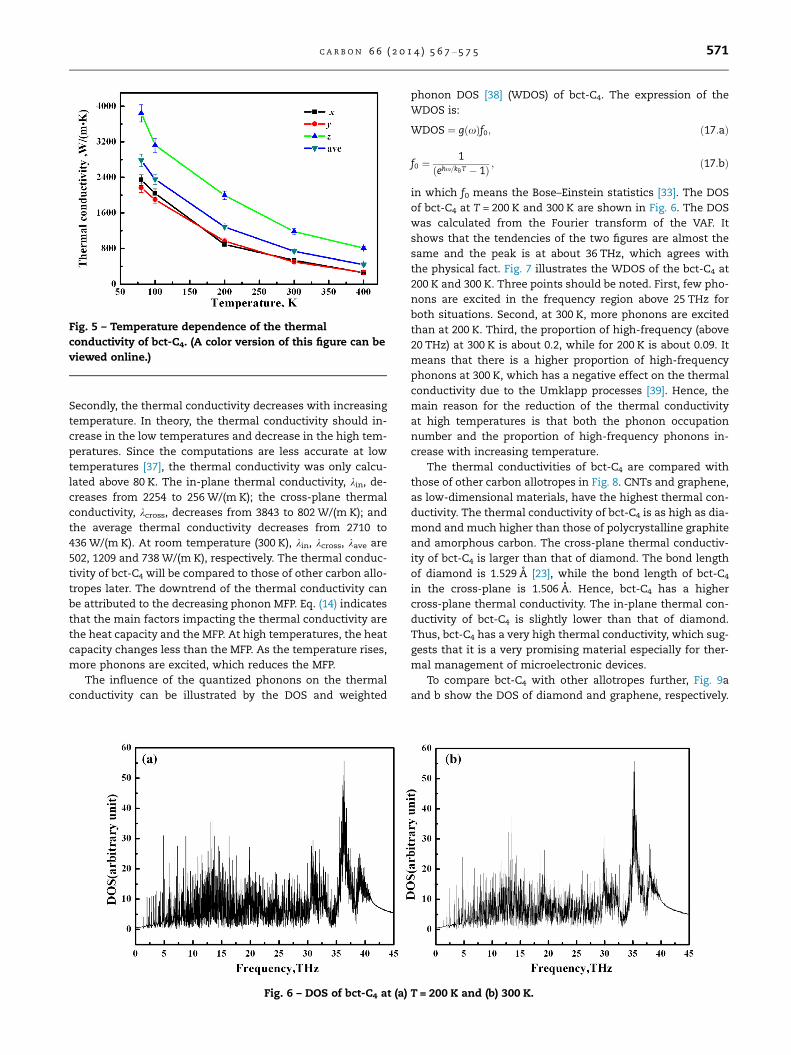
Fig. 5 – Temperature dependence of the thermal
conductivity of bct-C4. (A color version of this figure can be
viewed online.)
C A R B O N 6 6 ( 2 0 1 4 ) 5 6 7 – 5 7 5 571
Secondly, the thermal conductivity decreases with increasing
temperature. In theory, the thermal conductivity should in-
crease in the low temperatures and decrease in the high tem-
peratures. Since the computations are less accurate at low
temperatures [37], the thermal conductivity was only calcu-
lated above 80 K. The in-plane thermal conductivity, kin, de-
creases from 2254 to 256 W/(m K); the cross-plane thermal
conductivity, kcross, decreases from 3843 to 802 W/(m K); and
the average thermal conductivity decreases from 2710 to
436 W/(m K). At room temperature (300 K), kin, kcross, kave are
502, 1209 and 738 W/(m K), respectively. The thermal conduc-
tivity of bct-C4 will be compared to those of other carbon allo-
tropes later. The downtrend of the thermal conductivity can
be attributed to the decreasing phonon MFP. Eq. (14) indicates
that the main factors impacting the thermal conductivity are
the heat capacity and the MFP. At high temperatures, the heat
capacity changes less than the MFP. As the temperature rises,
more phonons are excited, which reduces the MFP.
The influence of the quantized phonons on the thermal
conductivity can be illustrated by the DOS and weighted
Fig. 6 – DOS of bct-C4 at (a)
phonon DOS [38] (WDOS) of bct-C4. The expression of the
WDOS is:
WDOS ¼ gðxÞf0; ð17:aÞ
f0 ¼1
ðe�hx=kBT � 1Þ ; ð17:bÞ
in which f0 means the Bose–Einstein statistics [33]. The DOS
of bct-C4 at T = 200 K and 300 K are shown in Fig. 6. The DOS
was calculated from the Fourier transform of the VAF. It
shows that the tendencies of the two figures are almost the
same and the peak is at about 36 THz, which agrees with
the physical fact. Fig. 7 illustrates the WDOS of the bct-C4 at
200 K and 300 K. Three points should be noted. First, few pho-
nons are excited in the frequency region above 25 THz for
both situations. Second, at 300 K, more phonons are excited
than at 200 K. Third, the proportion of high-frequency (above
20 THz) at 300 K is about 0.2, while for 200 K is about 0.09. It
means that there is a higher proportion of high-frequency
phonons at 300 K, which has a negative effect on the thermal
conductivity due to the Umklapp processes [39]. Hence, the
main reason for the reduction of the thermal conductivity
at high temperatures is that both the phonon occupation
number and the proportion of high-frequency phonons in-
crease with increasing temperature.
The thermal conductivities of bct-C4 are compared with
those of other carbon allotropes in Fig. 8. CNTs and graphene,
as low-dimensional materials, have the highest thermal con-
ductivity. The thermal conductivity of bct-C4 is as high as dia-
mond and much higher than those of polycrystalline graphite
and amorphous carbon. The cross-plane thermal conductiv-
ity of bct-C4 is larger than that of diamond. The bond length
of diamond is 1.529 A [23], while the bond length of bct-C4
in the cross-plane is 1.506 A. Hence, bct-C4 has a higher
cross-plane thermal conductivity. The in-plane thermal con-
ductivity of bct-C4 is slightly lower than that of diamond.
Thus, bct-C4 has a very high thermal conductivity, which sug-
gests that it is a very promising material especially for ther-
mal management of microelectronic devices.
To compare bct-C4 with other allotropes further, Fig. 9a
and b show the DOS of diamond and graphene, respectively.
T = 200 K and (b) 300 K.
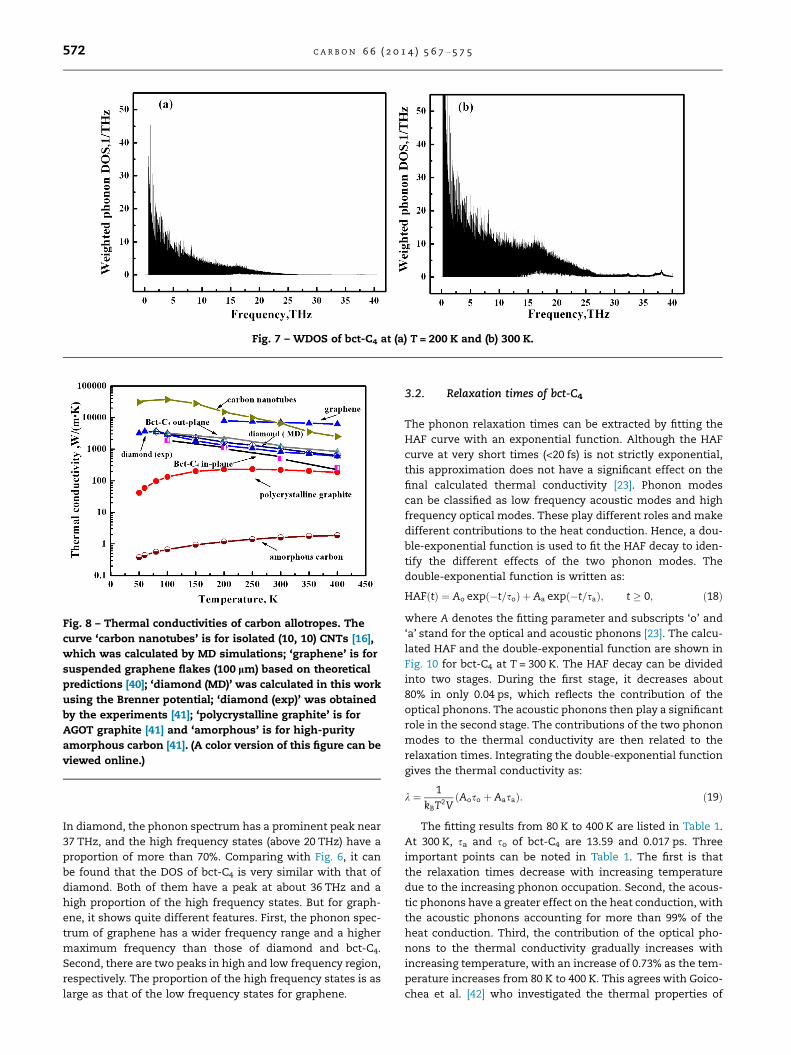
Fig. 7 – WDOS of bct-C4 at (a) T = 200 K and (b) 300 K.
Fig. 8 – Thermal conductivities of carbon allotropes. The
curve ‘carbon nanotubes’ is for isolated (10, 10) CNTs [16],
which was calculated by MD simulations; ‘graphene’ is for
suspended graphene flakes (100 lm) based on theoretical
predictions [40]; ‘diamond (MD)’ was calculated in this work
using the Brenner potential; ‘diamond (exp)’ was obtained
by the experiments [41]; ‘polycrystalline graphite’ is for
AGOT graphite [41] and ‘amorphous’ is for high-purity
amorphous carbon [41]. (A color version of this figure can be
viewed online.)
572 C A R B O N 6 6 ( 2 0 1 4 ) 5 6 7 – 5 7 5
In diamond, the phonon spectrum has a prominent peak near
37 THz, and the high frequency states (above 20 THz) have a
proportion of more than 70%. Comparing with Fig. 6, it can
be found that the DOS of bct-C4 is very similar with that of
diamond. Both of them have a peak at about 36 THz and a
high proportion of the high frequency states. But for graph-
ene, it shows quite different features. First, the phonon spec-
trum of graphene has a wider frequency range and a higher
maximum frequency than those of diamond and bct-C4.
Second, there are two peaks in high and low frequency region,
respectively. The proportion of the high frequency states is as
large as that of the low frequency states for graphene.
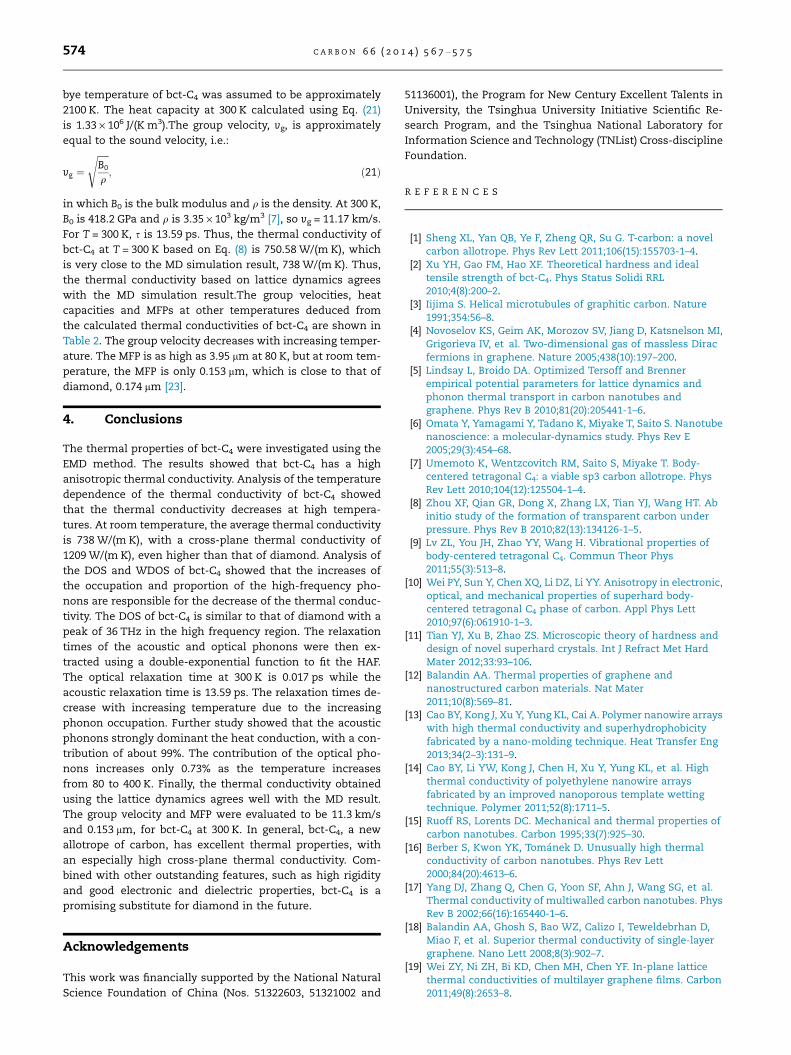
3.2. Relaxation times of bct-C4
The phonon relaxation times can be extracted by fitting the
HAF curve with an exponential function. Although the HAF
curve at very short times (<20 fs) is not strictly exponential,
this approximation does not have a significant effect on the
final calculated thermal conductivity [23]. Phonon modes
can be classified as low frequency acoustic modes and high
frequency optical modes. These play different roles and make
different contributions to the heat conduction. Hence, a dou-
ble-exponential function is used to fit the HAF decay to iden-
tify the different effects of the two phonon modes. The
double-exponential function is written as:
HAFðtÞ ¼ Ao expð�t=soÞ þ Aa expð�t=saÞ; t � 0; ð18Þ
where A denotes the fitting parameter and subscripts ‘o’ and
‘a’ stand for the optical and acoustic phonons [23]. The calcu-
lated HAF and the double-exponential function are shown in
Fig. 10 for bct-C4 at T = 300 K. The HAF decay can be divided
into two stages. During the first stage, it decreases about
80% in only 0.04 ps, which reflects the contribution of the
optical phonons. The acoustic phonons then play a significant
role in the second stage. The contributions of the two phonon
modes to the thermal conductivity are then related to the
relaxation times. Integrating the double-exponential function
gives the thermal conductivity as:
k ¼ 1
kBT2VðAoso þ AasaÞ: ð19Þ
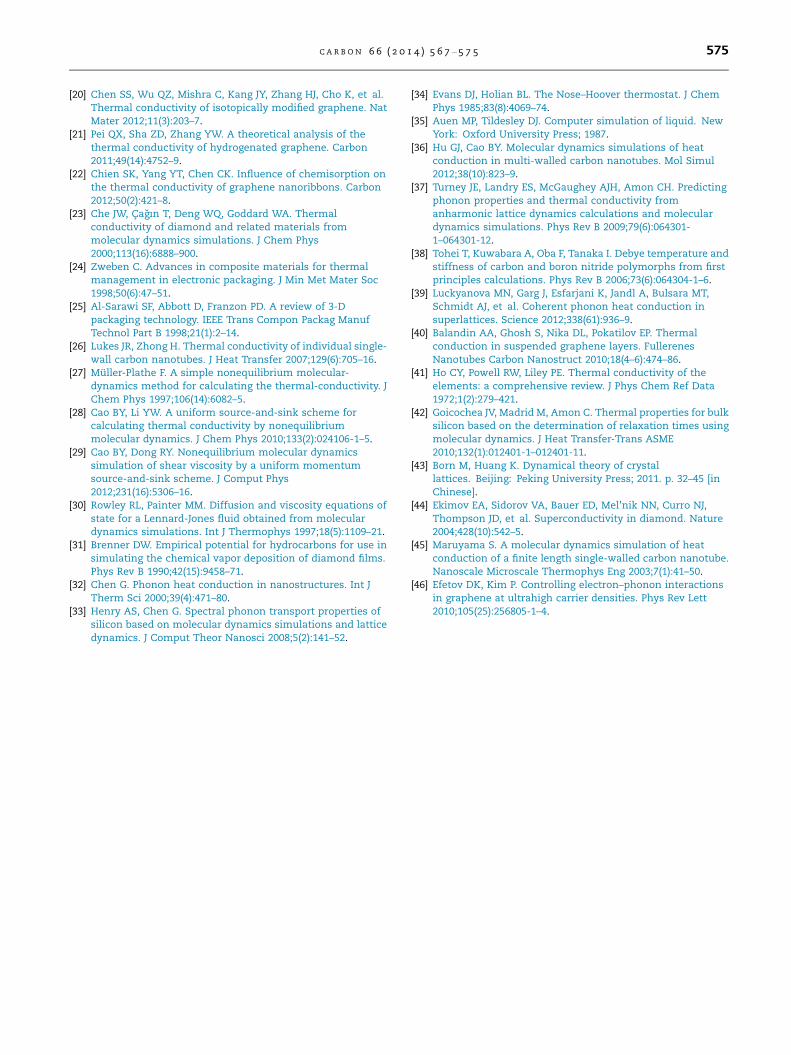
The fitting results from 80 K to 400 K are listed in Table 1.
At 300 K, sa and so of bct-C4 are 13.59 and 0.017 ps. Three
important points can be noted in Table 1. The first is that
the relaxation times decrease with increasing temperature
due to the increasing phonon occupation. Second, the acous-
tic phonons have a greater effect on the heat conduction, with
the acoustic phonons accounting for more than 99% of the
heat conduction. Third, the contribution of the optical pho-
nons to the thermal conductivity gradually increases with
increasing temperature, with an increase of 0.73% as the tem-
perature increases from 80 K to 400 K. This agrees with Goico-
chea et al. [42] who investigated the thermal properties of
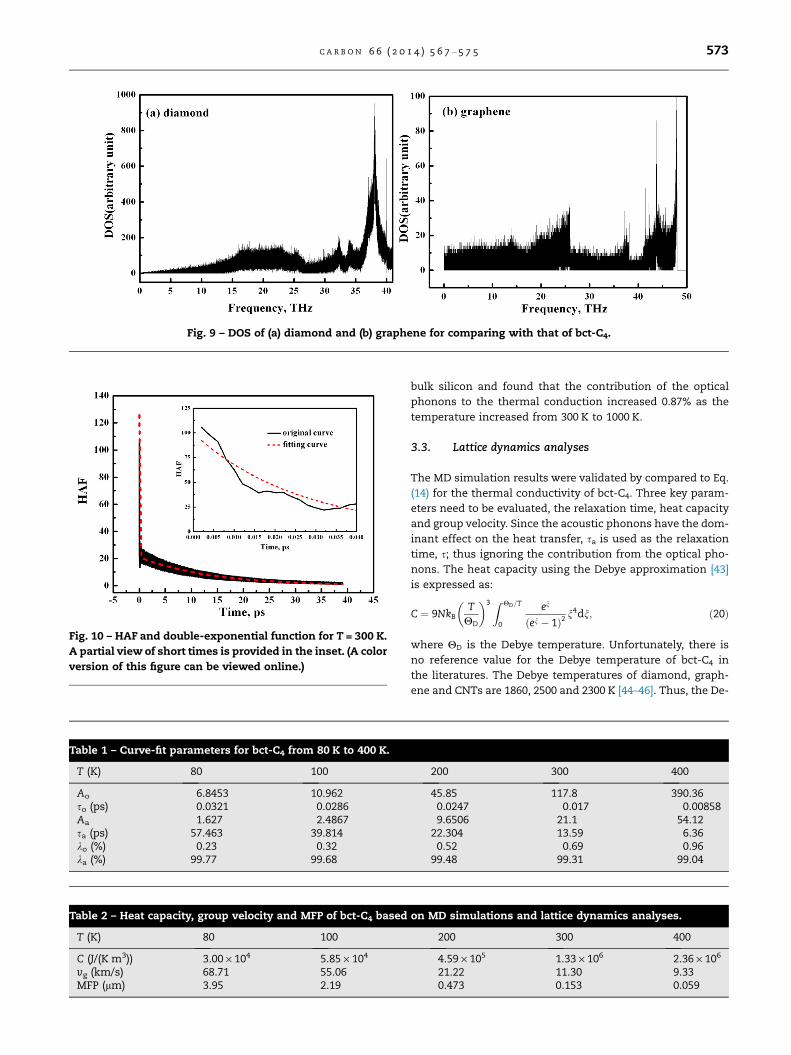
Fig. 9 – DOS of (a) diamond and (b) graphene for comparing with that of bct-C4.
Fig. 10 – HAF and double-exponential function for T = 300 K.
A partial view of short times is provided in the inset. (A color
version of this figure can be viewed online.)
Table 2 – Heat capacity, group velocity and MFP of bct-C4 based
T (K) 80 100
C (J/(K m3)) 3.00 · 104 5.85 · 104
vg (km/s) 68.71 55.06MFP (lm) 3.95 2.19
Table 1 – Curve-fit parameters for bct-C4 from 80 K to 400 K.
T (K) 80 100
Ao 6.8453 10.962so (ps) 0.0321 0.0286Aa 1.627 2.4867sa (ps) 57.463 39.814ko (%) 0.23 0.32ka (%) 99.77 99.68
C A R B O N 6 6 ( 2 0 1 4 ) 5 6 7 – 5 7 5 573
bulk silicon and found that the contribution of the optical
phonons to the thermal conduction increased 0.87% as the
temperature increased from 300 K to 1000 K.
3.3. Lattice dynamics analyses
The MD simulation results were validated by compared to Eq.
(14) for the thermal conductivity of bct-C4. Three key param-
eters need to be evaluated, the relaxation time, heat capacity
and group velocity. Since the acoustic phonons have the dom-
inant effect on the heat transfer, sa is used as the relaxation
time, s; thus ignoring the contribution from the optical pho-
nons. The heat capacity using the Debye approximation [43]
is expressed as:
C ¼ 9NkBT
HD
� �3 Z HD=T
0
en
ðen � 1Þ2n4dn; ð20Þ
where HD is the Debye temperature. Unfortunately, there is
no reference value for the Debye temperature of bct-C4 in
the literatures. The Debye temperatures of diamond, graph-
ene and CNTs are 1860, 2500 and 2300 K [44–46]. Thus, the De-
on MD simulations and lattice dynamics analyses.
200 300 400
4.59 · 105 1.33 · 106 2.36 · 106
21.22 11.30 9.330.473 0.153 0.059
200 300 400
45.85 117.8 390.360.0247 0.017 0.008589.6506 21.1 54.12
22.304 13.59 6.360.52 0.69 0.96
99.48 99.31 99.04
574 C A R B O N 6 6 ( 2 0 1 4 ) 5 6 7 – 5 7 5
bye temperature of bct-C4 was assumed to be approximately
2100 K. The heat capacity at 300 K calculated using Eq. (21)
is 1.33 · 106 J/(K m3).The group velocity, vg, is approximately
equal to the sound velocity, i.e.:
vg ¼ffiffiffiffiffiB0
q
s; ð21Þ
in which B0 is the bulk modulus and q is the density. At 300 K,
B0 is 418.2 GPa and q is 3.35 · 103 kg/m3 [7], so vg = 11.17 km/s.
For T = 300 K, s is 13.59 ps. Thus, the thermal conductivity of
bct-C4 at T = 300 K based on Eq. (8) is 750.58 W/(m K), which
is very close to the MD simulation result, 738 W/(m K). Thus,
the thermal conductivity based on lattice dynamics agrees
with the MD simulation result.The group velocities, heat
capacities and MFPs at other temperatures deduced from
the calculated thermal conductivities of bct-C4 are shown in
Table 2. The group velocity decreases with increasing temper-
ature. The MFP is as high as 3.95 lm at 80 K, but at room tem-
perature, the MFP is only 0.153 lm, which is close to that of
diamond, 0.174 lm [23].
4. Conclusions
The thermal properties of bct-C4 were investigated using the
EMD method. The results showed that bct-C4 has a high
anisotropic thermal conductivity. Analysis of the temperature
dependence of the thermal conductivity of bct-C4 showed
that the thermal conductivity decreases at high tempera-
tures. At room temperature, the average thermal conductivity
is 738 W/(m K), with a cross-plane thermal conductivity of
1209 W/(m K), even higher than that of diamond. Analysis of
the DOS and WDOS of bct-C4 showed that the increases of
the occupation and proportion of the high-frequency pho-
nons are responsible for the decrease of the thermal conduc-
tivity. The DOS of bct-C4 is similar to that of diamond with a
peak of 36 THz in the high frequency region. The relaxation
times of the acoustic and optical phonons were then ex-
tracted using a double-exponential function to fit the HAF.
The optical relaxation time at 300 K is 0.017 ps while the
acoustic relaxation time is 13.59 ps. The relaxation times de-
crease with increasing temperature due to the increasing
phonon occupation. Further study showed that the acoustic
phonons strongly dominant the heat conduction, with a con-
tribution of about 99%. The contribution of the optical pho-
nons increases only 0.73% as the temperature increases
from 80 to 400 K. Finally, the thermal conductivity obtained
using the lattice dynamics agrees well with the MD result.
The group velocity and MFP were evaluated to be 11.3 km/s
and 0.153 lm, for bct-C4 at 300 K. In general, bct-C4, a new
allotrope of carbon, has excellent thermal properties, with
an especially high cross-plane thermal conductivity. Com-
bined with other outstanding features, such as high rigidity
and good electronic and dielectric properties, bct-C4 is a
promising substitute for diamond in the future.
Acknowledgements
This work was financially supported by the National Natural
Science Foundation of China (Nos. 51322603, 51321002 and
51136001), the Program for New Century Excellent Talents in
University, the Tsinghua University Initiative Scientific Re-
search Program, and the Tsinghua National Laboratory for
Information Science and Technology (TNList) Cross-discipline
Foundation.
R E F E R E N C E S
[1] Sheng XL, Yan QB, Ye F, Zheng QR, Su G. T-carbon: a novelcarbon allotrope. Phys Rev Lett 2011;106(15):155703-1–4.
[2] Xu YH, Gao FM, Hao XF. Theoretical hardness and idealtensile strength of bct-C4. Phys Status Solidi RRL2010;4(8):200–2.
[3] Iijima S. Helical microtubules of graphitic carbon. Nature1991;354:56–8.
[4] Novoselov KS, Geim AK, Morozov SV, Jiang D, Katsnelson MI,Grigorieva IV, et al. Two-dimensional gas of massless Diracfermions in graphene. Nature 2005;438(10):197–200.
[5] Lindsay L, Broido DA. Optimized Tersoff and Brennerempirical potential parameters for lattice dynamics andphonon thermal transport in carbon nanotubes andgraphene. Phys Rev B 2010;81(20):205441-1–6.
[6] Omata Y, Yamagami Y, Tadano K, Miyake T, Saito S. Nanotubenanoscience: a molecular-dynamics study. Phys Rev E2005;29(3):454–68.
[7] Umemoto K, Wentzcovitch RM, Saito S, Miyake T. Body-centered tetragonal C4: a viable sp3 carbon allotrope. PhysRev Lett 2010;104(12):125504-1–4.
[8] Zhou XF, Qian GR, Dong X, Zhang LX, Tian YJ, Wang HT. Abinitio study of the formation of transparent carbon underpressure. Phys Rev B 2010;82(13):134126-1–5.
[9] Lv ZL, You JH, Zhao YY, Wang H. Vibrational properties ofbody-centered tetragonal C4. Commun Theor Phys2011;55(3):513–8.
[10] Wei PY, Sun Y, Chen XQ, Li DZ, Li YY. Anisotropy in electronic,optical, and mechanical properties of superhard body-centered tetragonal C4 phase of carbon. Appl Phys Lett2010;97(6):061910-1–3.
[11] Tian YJ, Xu B, Zhao ZS. Microscopic theory of hardness anddesign of novel superhard crystals. Int J Refract Met HardMater 2012;33:93–106.
[12] Balandin AA. Thermal properties of graphene andnanostructured carbon materials. Nat Mater2011;10(8):569–81.
[13] Cao BY, Kong J, Xu Y, Yung KL, Cai A. Polymer nanowire arrayswith high thermal conductivity and superhydrophobicityfabricated by a nano-molding technique. Heat Transfer Eng2013;34(2–3):131–9.
[14] Cao BY, Li YW, Kong J, Chen H, Xu Y, Yung KL, et al. Highthermal conductivity of polyethylene nanowire arraysfabricated by an improved nanoporous template wettingtechnique. Polymer 2011;52(8):1711–5.
[15] Ruoff RS, Lorents DC. Mechanical and thermal properties ofcarbon nanotubes. Carbon 1995;33(7):925–30.
[16] Berber S, Kwon YK, Tomanek D. Unusually high thermalconductivity of carbon nanotubes. Phys Rev Lett2000;84(20):4613–6.
[17] Yang DJ, Zhang Q, Chen G, Yoon SF, Ahn J, Wang SG, et al.Thermal conductivity of multiwalled carbon nanotubes. PhysRev B 2002;66(16):165440-1–6.
[18] Balandin AA, Ghosh S, Bao WZ, Calizo I, Teweldebrhan D,Miao F, et al. Superior thermal conductivity of single-layergraphene. Nano Lett 2008;8(3):902–7.
[19] Wei ZY, Ni ZH, Bi KD, Chen MH, Chen YF. In-plane latticethermal conductivities of multilayer graphene films. Carbon2011;49(8):2653–8.
C A R B O N 6 6 ( 2 0 1 4 ) 5 6 7 – 5 7 5 575
[20] Chen SS, Wu QZ, Mishra C, Kang JY, Zhang HJ, Cho K, et al.Thermal conductivity of isotopically modified graphene. NatMater 2012;11(3):203–7.
[21] Pei QX, Sha ZD, Zhang YW. A theoretical analysis of thethermal conductivity of hydrogenated graphene. Carbon2011;49(14):4752–9.
[22] Chien SK, Yang YT, Chen CK. Influence of chemisorption onthe thermal conductivity of graphene nanoribbons. Carbon2012;50(2):421–8.
[23] Che JW, Cagın T, Deng WQ, Goddard WA. Thermalconductivity of diamond and related materials frommolecular dynamics simulations. J Chem Phys2000;113(16):6888–900.
[24] Zweben C. Advances in composite materials for thermalmanagement in electronic packaging. J Min Met Mater Soc1998;50(6):47–51.
[25] Al-Sarawi SF, Abbott D, Franzon PD. A review of 3-Dpackaging technology. IEEE Trans Compon Packag ManufTechnol Part B 1998;21(1):2–14.
[26] Lukes JR, Zhong H. Thermal conductivity of individual single-wall carbon nanotubes. J Heat Transfer 2007;129(6):705–16.
[27] Muller-Plathe F. A simple nonequilibrium molecular-dynamics method for calculating the thermal-conductivity. JChem Phys 1997;106(14):6082–5.
[28] Cao BY, Li YW. A uniform source-and-sink scheme forcalculating thermal conductivity by nonequilibriummolecular dynamics. J Chem Phys 2010;133(2):024106-1–5.
[29] Cao BY, Dong RY. Nonequilibrium molecular dynamicssimulation of shear viscosity by a uniform momentumsource-and-sink scheme. J Comput Phys2012;231(16):5306–16.
[30] Rowley RL, Painter MM. Diffusion and viscosity equations ofstate for a Lennard-Jones fluid obtained from moleculardynamics simulations. Int J Thermophys 1997;18(5):1109–21.
[31] Brenner DW. Empirical potential for hydrocarbons for use insimulating the chemical vapor deposition of diamond films.Phys Rev B 1990;42(15):9458–71.
[32] Chen G. Phonon heat conduction in nanostructures. Int JTherm Sci 2000;39(4):471–80.
[33] Henry AS, Chen G. Spectral phonon transport properties ofsilicon based on molecular dynamics simulations and latticedynamics. J Comput Theor Nanosci 2008;5(2):141–52.
[34] Evans DJ, Holian BL. The Nose–Hoover thermostat. J ChemPhys 1985;83(8):4069–74.
[35] Auen MP, Tildesley DJ. Computer simulation of liquid. NewYork: Oxford University Press; 1987.
[36] Hu GJ, Cao BY. Molecular dynamics simulations of heatconduction in multi-walled carbon nanotubes. Mol Simul2012;38(10):823–9.
[37] Turney JE, Landry ES, McGaughey AJH, Amon CH. Predictingphonon properties and thermal conductivity fromanharmonic lattice dynamics calculations and moleculardynamics simulations. Phys Rev B 2009;79(6):064301-1–064301-12.
[38] Tohei T, Kuwabara A, Oba F, Tanaka I. Debye temperature andstiffness of carbon and boron nitride polymorphs from firstprinciples calculations. Phys Rev B 2006;73(6):064304-1–6.
[39] Luckyanova MN, Garg J, Esfarjani K, Jandl A, Bulsara MT,Schmidt AJ, et al. Coherent phonon heat conduction insuperlattices. Science 2012;338(61):936–9.
[40] Balandin AA, Ghosh S, Nika DL, Pokatilov EP. Thermalconduction in suspended graphene layers. FullerenesNanotubes Carbon Nanostruct 2010;18(4–6):474–86.
[41] Ho CY, Powell RW, Liley PE. Thermal conductivity of theelements: a comprehensive review. J Phys Chem Ref Data1972;1(2):279–421.
[42] Goicochea JV, Madrid M, Amon C. Thermal properties for bulksilicon based on the determination of relaxation times usingmolecular dynamics. J Heat Transfer-Trans ASME2010;132(1):012401-1–012401-11.
[43] Born M, Huang K. Dynamical theory of crystallattices. Beijing: Peking University Press; 2011. p. 32–45 [inChinese].
[44] Ekimov EA, Sidorov VA, Bauer ED, Mel’nik NN, Curro NJ,Thompson JD, et al. Superconductivity in diamond. Nature2004;428(10):542–5.
[45] Maruyama S. A molecular dynamics simulation of heatconduction of a finite length single-walled carbon nanotube.Nanoscale Microscale Thermophys Eng 2003;7(1):41–50.
[46] Efetov DK, Kim P. Controlling electron–phonon interactionsin graphene at ultrahigh carrier densities. Phys Rev Lett2010;105(25):256805-1–4.