Embed Size (px)
Citation preview

High Desert Corridor: Investment Grade Ridership & Revenue Forecasts
High Desert Corridor Joint Powers Authority
Executive Summary March 2017
Our ref: 22876601


Steer Davies Gleave has prepared this material for High Desert Corridor Joint Powers Authority. This material
may only be used within the context and scope for which Steer Davies Gleave has prepared it and may not be
relied upon in part or whole by any third party or be used for any other purpose. Any person choosing to use
any part of this material without the express and written permission of Steer Davies Gleave shall be deemed
to confirm their agreement to indemnify Steer Davies Gleave for all loss or damage resulting therefrom. Steer
Davies Gleave has prepared this material using professional practices and procedures using information
available to it at the time and as such any new information could alter the validity of the results and
conclusions made.
High Desert Corridor: Investment Grade Ridership & Revenue Forecasts
High Desert Corridor Joint Powers Authority
Executive Summary March 2017
Our ref: 22876601
Prepared by:
Prepared for:
Steer Davies Gleave 883 Boylston Street, 3rd Floor Boston, MA 02116
High Desert Corridor Joint Powers Authority 385 No. Arrowhead Ave, 5th Floor San Bernardino CA 92415-0130
+1 (617) 391 2300 na.steerdaviesgleave.com
March 2017
Contents
Executive summary ............................................................................................................................ 5
Overview ............................................................................................................................................. 5
The market for HSR ............................................................................................................................. 6
Existing travel options ........................................................................................................................ 6
The High Desert Corridor project ....................................................................................................... 7
Our forecasting approach ................................................................................................................. 10
The in-scope market ......................................................................................................................... 11
Market growth .................................................................................................................................. 12
Market share..................................................................................................................................... 12
Other forecasting assumptions ........................................................................................................ 13
Base Case forecasts .......................................................................................................................... 15
Sensitivity tests ................................................................................................................................. 16

March 2017 | 5
Executive summary
Overview
In January 2016, the High Desert Corridor Joint Powers Authority (HDC JPA) commissioned Steer
Davies Gleave (SDG) to produce Investment Grade4 Ridership & Revenue Forecasts for a proposed
high-speed rail (HSR) line across the High Desert Corridor (HDC) between Victorville and Palmdale.
The HDC will provide a critical link in creating a HSR corridor between California and Nevada.
Figure E.1: Map of High Desert Corridor and proposed connections to Las Vegas and Southern California5
Source: Steer Davies Gleave
The focus of this study is on forecasting the potential ridership and revenue for HSR through the
corridor, generated by direct services between Las Vegas and Burbank/Los Angeles/Anaheim, and
serving destinations in Northern California via a connection with California High Speed Rail
(CaHSR) trains at Palmdale.
In this report we explore the characteristics of the existing travel patterns between California and
Las Vegas and the various markets which will be in-scope6 to use the HDC. We then analyze how
this demand might change in the future following the introduction of HSR and present our
4 There are no formal rules that define Investment Grade forecasts: they are characterized by their outputs rather than a specific methodology. “Investment Grade” in the context of this study means we present forecasts of revenue that explain and quantify uncertainties, and that we stand by these forecasts as providing a sound basis for investors to rely on to make an investment decision. To this end we ensure full transparency of all assumptions, forecasting methodology and processes and the final outputs; use recently observed data for all key components; and, as far as practicable, base our analysis on parameters specific to the project, rather than imported from other studies.
5 There are currently multiple potential alignments being considered by the CaHSRA; each of these options are highlighted within the figure (labeled “SR14 Refined”, “E1 Refined” and “E2 Refined”).
6 For definition see section entitled “the in-scope market” on page 10/11 of this Executive Summary.

March 2017 | 6
forecasts of ridership and revenue for each phase of infrastructure development reflecting the
anticipated phased roll out of the HSR infrastructure over the period from 2021 to 2050.
The market for HSR
The High Desert Corridor infrastructure will link Victorville with Palmdale, enabling trains running
over XpressWest lines between Las Vegas and Victorville to access CaHSR infrastructure and run
on to Burbank, Los Angeles and Anaheim.
Las Vegas presents a unique combination of gaming, entertainment, leisure activities and world–
class convention and business facilities. Its scale makes it a worldwide brand and destination of
choice for much of the US population as well as international visitors. 2015 was a record-breaking
year with total visitors to Las Vegas exceeding 42.3 million. In the last five years (2010 to 2015)
visitor volume has increased at a compound annual growth rate of 2.6%. The majority of visitors
are tourists, but there is an important convention and business visitor market, and a number are
also visiting friends and relatives.
Californian residents accounted for 29% of all visitors to Las Vegas in 2015, of which 80-85% reside
in the Counties of Southern California7. The Las Vegas visitor market from Southern California is
the key determinant of the future use of the HDC. However, there will also be potential to attract
a share of the non-resident visitor market traveling via California. Travel by Las Vegas and wider
Clark County residents to California provides an additional in-scope market for the HDC.
A further 16% of visitors to Las Vegas are international travelers, almost three-quarters of whom
do not fly direct to Las Vegas, but arrive via other US gateways including Los Angeles and San
Francisco. A proportion of US domestic visitors also combine their trip to Las Vegas with a visit to
California. Taken together, these statistics indicate a substantial market segment accessing Las
Vegas via California, also potentially in-scope for HSR.
Existing travel options
Visitors arriving in Las Vegas by road8 accounted for 57% of the total market in 2015, with this
proportion rising to over 90% for residents of Southern California.
Uncongested drive times between Southern California and Las Vegas range from under four hours
from San Bernardino to approximately six hours from parts of Santa Barbara and Imperial
Counties. From Northern California, for example San Francisco, the uncongested drive time can be
as much as nine hours.
Almost all drivers from California to Las Vegas travel on the I-15, which they typically join south of
the Cajon Pass, or along SR-18 from Palmdale, before passing Victorville in San Bernardino County
and then crossing the Mojave Desert. Highway traffic peaks on Thursdays and Fridays northbound
to Las Vegas, when many travelers depart, and on Sunday in the southbound direction from Las
7 Defined by the Las Vegas Convention and Visitors Authority (LVCVA) as the eight counties of Imperial, Los Angeles, Orange, Riverside, San Bernardino, San Diego, Santa Barbara and Ventura.
8 All modes including car, RV and bus.

March 2017 | 7
Vegas for the return leg. Nearly one quarter of car trips throughout a typical week are made in
one or both directions during these peak times, when journey times can be extended by
congestion and unpredictable delays.
Las Vegas McCarran International Airport (LAS) is served by flights from six major airports in
Southern California9 and another five in Northern California10 which in combination offer over 170
daily flights in each direction. Air travel, like car travel, peaks on Thursdays and Fridays to Las
Vegas and Sundays from Las Vegas. Round-trip air fares vary from $40 to over $450 depending on
the carrier, dates and times of travel.
A number of commercial bus operators also run services between California and Las Vegas but
journey times are longer than auto and air, at between five and eight hours depending on the
number of stops en-route.
There are no existing rail passenger services between California and Las Vegas11.
The High Desert Corridor project
The HDC project is a proposed link between State Route (SR)-14 in Los Angeles County and SR-18
in San Bernardino County. This project would connect some of the fastest growing residential,
commercial and industrial areas in Southern California, including the cities of Palmdale, Lancaster,
Adelanto, Victorville and the Town of Apple Valley. The HDC is expected to be multi-modal and
includes a freeway/tollway and “Green Corridor” alongside a dedicated HSR line.
The HSR line is a proposed 54-mile section of new grade-separated dedicated railway track
between Pamdale, Los Angeles County, CA and Victorville, San Bernardino County, CA, which will
enable high-speed trains to travel between Palmdale and Victorville in under 30 minutes. The line
will provide an important link between the California High Speed Rail (CaHSR) network and Las
Vegas via Victorville using XpressWest infrastructure. Specifically, it will provide rail service to:
Southern California initially via connection with Metrolink’s Antelope Valley Line, then by
through services using CaHSR track; and
Northern California via a connection with CaHSR services.
There are four primary infrastructure Phases which have been considered, building on the initial
line planned by XpressWest between Las Vegas and Victorville. The subsequent phasing reflects
the anticipated roll out of the CaHSR infrastructure:
1. One-seat high-speed ride linking Las Vegas-Victorville-Palmdale, with transfers to the existing
Metrolink services on the Antelope Valley Line, feeder bus services or auto access with
parking facilities at Palmdale & Victorville;
9 Los Angeles International (LAX); San Diego International (SAN); Burbank – Glendale – Pasadena (BUR); John Wayne (SNA); Ontario (ONT); Long Beach (LGB).
10 Fresno Yosemite International (FAT); Oakland International (OAK); San Francisco International (SFO); San Jose International (SJC); Sacramento International (SMF).
11 Although Amtrak does offer a Thruway bus service from Los Angeles and Bakersfield.

March 2017 | 8
2. One-seat high-speed ride between Las Vegas and Burbank, using new CaHSR infrastructure
from Palmdale (with intermediate stops at Victorville and Palmdale);
3. One-seat high-speed ride between Las Vegas and Los Angeles Union Station / Anaheim
Station using new CaHSR infrastructure from Palmdale (with intermediate stops at Victorville,
Palmdale and Burbank)12; and
4. One-seat high-speed ride between Las Vegas and Los Angeles Union Station / Anaheim
Station, with an advertized connection at Palmdale for transfer (typically within 15 minutes)
to/from CaHSR trains serving Northern California. Specific CaHSR services will have varying
stopping patterns, but will include combinations of stops at: Bakersfield; Kings/Tulare; Fresno;
Merced; Gilroy; San Jose; Millbrae; and San Francisco.
Some of the system parameters specified in this report for the CaHSR system, developed by SDG
in consultation with the HDC JPA, vary from those set forth in the CaHSRA’s 2016 Business Plan
adopted by the Authority’s Board of Directors in April 2016. These assumptions are SDG’s planning
assumptions and do not reflect any change in the Authority’s plans at this time. In addition,
parameters regarding how proposed services will operate on future infrastructure between
Palmdale and Anaheim (including train frequencies, span of service and passenger fares) are not
reflected in the plans or assumptions made by the Authority. HSR services to/from Las Vegas are
assumed to operate entirely independently of any future service offer by CaHSR south of
Palmdale, and are thus expected to have no impact on CaHSR operations. The HSR services via the
HDC are assumed not to carry passengers between any station pair south of Palmdale, so there is
no impact on the level of demand or passenger revenues expected to accrue to CaHSR services
over these lines.
Figure E.2 shows the planned extent of the HSR network in California/Nevada and the critical role
that the HDC rail link will play within that network.
12 There is a potential for a further station at either Norwalk/Santa Fe Springs or Fullerton. At this stage however these remains as options within the CaHSR 2016 Business Plan.

March 2017 | 9
Figure E.2: Map of proposed HSR service
Source: Steer Davies Gleave
The timing of each phase of infrastructure has been developed based upon a combination of the
2016 CaHSR Business Plan13 and agreed assumptions with the HDC JPA and wider stakeholders:
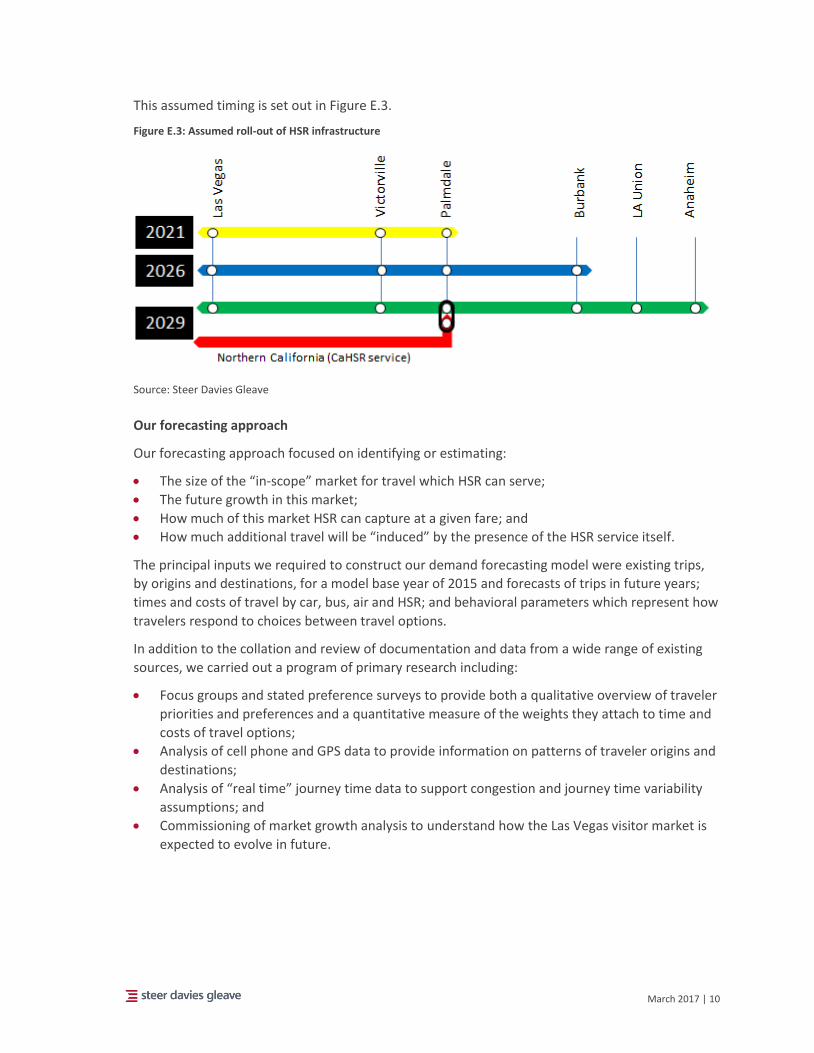
2021: Phase 0: Las Vegas-Victorville (base line position);
2021: Phase 1: Las Vegas-Palmdale;
2026: Phase 2: Las Vegas-Burbank;
2029: Phase 3: Las Vegas-Anaheim; and
2029: Phase 4: CaHSR to Central Valley and Northern California.
13 http://www.hsr.ca.gov/docs/about/business_plans/2016_BusinessPlan.pdf.
March 2017 | 10
This assumed timing is set out in Figure E.3.
Figure E.3: Assumed roll-out of HSR infrastructure
Source: Steer Davies Gleave
Our forecasting approach
Our forecasting approach focused on identifying or estimating:
The size of the “in-scope” market for travel which HSR can serve;
The future growth in this market;
How much of this market HSR can capture at a given fare; and
How much additional travel will be “induced” by the presence of the HSR service itself.
The principal inputs we required to construct our demand forecasting model were existing trips,
by origins and destinations, for a model base year of 2015 and forecasts of trips in future years;
times and costs of travel by car, bus, air and HSR; and behavioral parameters which represent how
travelers respond to choices between travel options.
In addition to the collation and review of documentation and data from a wide range of existing
sources, we carried out a program of primary research including:
Focus groups and stated preference surveys to provide both a qualitative overview of traveler
priorities and preferences and a quantitative measure of the weights they attach to time and
costs of travel options;
Analysis of cell phone and GPS data to provide information on patterns of traveler origins and
destinations;
Analysis of “real time” journey time data to support congestion and journey time variability
assumptions; and
Commissioning of market growth analysis to understand how the Las Vegas visitor market is
expected to evolve in future.

March 2017 | 11
The in-scope market
The “in-scope” market represents current demand for travel between Las Vegas and California
from travelers who might consider traveling by HSR in future14. We estimate that the in-scope
market includes approximately 26 million round-trips in 2015, with a split by origin and current
mode as summarized in Table E.1 below.
Table E.1: 2015 in-scope traveling market, millions of round-trips
Market Auto Air Bus Total
Southern CA to Las Vegas 12.4 1.9 1.3 15.6
Northern CA to Las Vegas 0.9 1.4 0.2 2.6
Las Vegas/Clark County to CA 3.6 0.7 0.0 4.3
Other locations to Las Vegas via CA 2.215 0.7 0.1 3.0
Southern CA to Victorville 0.8 0.0 0.0 0.8
Total 20.0 4.8 1.6 26.3
Source: Steer Davies Gleave
The total size of the in-scope market has been estimated using three primary sources of data:
The 2015 Las Vegas Visitor and Convention Authority visitor statistics and surveys16;
Visit California statistics on state visitors and their origins from 201417; and
Population estimates for Clark County18.
Each of the 4,000 plus respondents to the behavioral survey provided information on their origin
and destination, travel purpose, group size and composition, day of travel, and most recent trip
cost. This and other information19 was used to subdivide the total in-scope car, air and bus
markets into segments based on traveler origin and destination, journey purpose, current mode,
time of travel and group size.
14 The “out-of-scope” market includes all other trips currently made that would not consider traveling by HSR in future; for example through-trips on the I-15 traveling beyond Las Vegas, or trips made by commercial vehicles.
15 Including trips arriving into CA by air, but continuing in rental car.
16 www.lvcva.com.
17 http://industry.visitcalifornia.com/find-research/california-statistics-trends/.
18 http://www.clarkcountynv.gov/comprehensive-planning/demographics/Documents/2015_Population_Forecasts.pdf.
19 Including Airsage cell phone demand data, StreetLight GPS demand data, LVCVA 2015 Visitor Profile survey, Visit California data and T-100 data on air passengers published by the USDOT.

March 2017 | 12
Market growth
Our Base Case projections of growth rates are summarized in Table E.2.
Table E.2: Growth rates (CAGR) by market segment – Base Case
Market segment 2015-2022 2022-2030 2030-2040 2040-2050
Southern California Tourists 1.35% 1.15% 1.30% 1.11%
Northern California Tourists 2.40% 1.97% 1.70% 1.49%
Convention Attendees+ 3.41% 0.95% 0.74% 0.74%
Other US visitors via CA+ 1.15% 0.80% 0.63% 0.63%
Foreign visitors via CA 4.39% 3.03% 2.12% 2.00%
Las Vegas/Clark County residents 3.88% 2.97% 2.45% 2.30%
Source: Steer Davies Gleave; +Applied Analysis Base Case
Forecasts of future year in-scope market size among residents of California are based on expected
changes in behaviors in response to factors such as population growth in the primary catchment
areas of California, taking into account age and ethnicity, and the relative attractiveness of the Las
Vegas experience to the particular market segments based on recent visitor profiles and
propensity to visit Las Vegas.
Higher propensity to visit among young Hispanics have a particularly strong impact on SoCal
tourist market growth in future years, counteracting an absolute decline in the ageing White Non-
Hispanic population. Further details on growth assumptions are provided in section 8 of this
report.
Market share
We constructed two demand forecasting models to estimate HSR’s potential to capture market
share: one for car travelers and one for air travelers. The models contain, for each market
segment:
The number of in-scope travelers in 2015 and future years based on the values presented in
Tables E.1 and E.2;
The times and costs of travel by existing mode and by HSR;
The generalized cost of each mode, which combines the individual times and costs for each
element of the entire trip; and
The mode choice “logit” function, which allocates future travelers between the two modes –
existing mode and HSR - according to the differences in their generalized costs.
California DoF
county
population
projections
Propensity to
visit LV by age
and ethnicity
Potential
visitors in
future years
Share of
visitors to LV by
county
X X
Behavioral Survey data
=

March 2017 | 13
The principal elements of time and costs incorporated in the generalized costs are as follows:
For auto travelers:
Journey time to Las Vegas;
Costs of fuel reflecting current and forecast fuel consumption and gas prices for autos;
Costs of other items, including depreciation, maintenance and tires.
For air and HSR travelers:
Access journey time to their local airport if they fly, or to their preferred HSR station if
they use HSR;
Cost of driving to airport/station or taxi/public transportation fare as appropriate;
Cost of parking at airport/station as appropriate;
Time on the plane or the train, at departure and arrival airport or station, and accessing
downtown Las Vegas by taxi or shuttle bus; and
Costs of the air fare or HSR fare.
Each respondent who took part in our behavioral survey was presented with eight scenarios for
which they were asked to make a choice between using their current mode and HSR. Their
responses on which mode they would choose were used to infer the weight they attached to time
and cost. These weightings were applied to the times and costs for each mode and market
segment to calculate a total generalized cost.
The mode choice model or “logit” function is an established choice modeling technique which we
have used on a large number of transportation projects and is embedded in our demand
forecasting model. If the generalized costs of two alternative modes are equal, the model
allocates half the travelers to each mode. If they differ, it allocates more travelers to the mode
with the lower generalized cost. The greater the difference between the costs, the more it
allocates to the “cheaper” mode. It is through this method that we calculate key sensitivities
within the model; for example the sensitivity to changes in future gas prices.
Other forecasting assumptions
The ridership and revenue forecasts produced by our demand forecasting model were adjusted
for “ramp-up” and “induced” demand.
“Ramp-up” is typically seen when a new mode is introduced, as it takes time for travelers to
become aware of and adapt to it. From our experience of other new rail projects, such as Eurostar
services in Europe, we assumed that the initial HDC service to Palmdale would achieve 50% of its
potential market share in 2021, 75% in 2022, 95% in 2023 and achieve its full potential market
share thereafter. Ramp-up is also applied to each incremental addition to the HSR service as the
line is extended to Burbank, Los Angeles Union and Anaheim, although at a faster rate, reflecting
greater awareness of the service and the fact that a proportion of the demand will be switching
stations. In the case of the connection with CaHSR for points north of Palmdale, the more
conservative ramp-up assumption was applied.
We estimated the scope for additional travel “induced” by HSR itself. These estimates were based
on the proportion of survey respondents who indicated they would make more trips if HSR was
available. In total we estimated these effects would increase HSR ridership by 7% to 11%,
depending on the level of infrastructure in place, and increase revenue by 6% to 9%.
March 2017 | 14
A summary of the other key assumptions adopted within the development of the forecasts is
provided below:
HSR journey times: A selection of key journey times by HSR are provided below:
Victorville-Las Vegas: 1 hour 20 minutes;
Palmdale-Las Vegas: 1 hour 50 minutes;
Burbank-Las Vegas: 2 hours 19 minutes;
Los Angeles-Las Vegas: 2 hours 28 minutes;
Anaheim-Las Vegas: 3 hours 6 minutes; and
San Francisco-Las Vegas: 5 hours 19 minutes, including 15 minute transfer at Palmdale.
HSR service frequency: Every 20-30 minutes throughout the day;
Average HSR fares: Between $91 and $206 round-trip, based on the stations used; all fares
will be set according to market demand using yield management to optimize net revenues;
Parking at HSR stations: Free at Las Vegas, Victorville and Palmdale; market rates (up to $20
per day) elsewhere;
Future auto drive times: Developed based on forecasts from the Southern California
Association of Governments (SCAG) model; lower growth assumed along the I-15 to Las Vegas
reflecting that a portion of traffic on the highway is anticipated to be captured by HSR;
Future gas prices: Developed based on long-term forecasts from the Energy Information
Administration (EIA);
Future air service: Assumed to be maintained at current levels; this compares to experience
in Europe which suggests that airlines do not seek to compete aggressively for flows where
there is direct competition between HSR and air - typically flight frequencies are reduced.
Further details on all assumptions are provided in section 9 and appendix A of this report.

March 2017 | 15
Base Case forecasts
Our Base Case ridership and revenue forecasts are summarized in Table E.3 below.
Table E.3: Summary of Base Case annual ridership forecasts
Forecast element 2021 2024 2026 2029 2035 2040 2050
Operational Phases Phases
0-1 Phases
0-1 Phases
0-2 Phases
0-4 Phases
0-4 Phases
0-4 Phases
0-4
In-scope market (million round-trips) 27.5 29.0 29.9 34.5 37.9 40.8 47.0
HSR capture rate (%) 11% 21% 24% 25% 27% 27% 27%
Captured HSR ridership (million round-trips) 2.9 6.1 7.1 8.8 10.2 10.8 12.6
Induced HSR ridership (million round-trips) 0.2 0.4 0.6 1.0 1.1 1.2 1.4
Total HSR ridership (million round-trips) 3.1 6.5 7.8 9.7 11.3 12.1 14.0
Average HSR round-trip fare ($, 2015 prices) 96 96 100 108 115 117 117
HSR revenue ($m, 2015 prices) 300 626 781 1,049 1,297 1,412 1,632
Net ramp-up assumed (%)20 50% 100% 96% 93% 100% 100% 100%
Source: Steer Davies Gleave
The initial phase of the HSR line connecting Las Vegas, Victorville and Palmdale is assumed to open
in 2021. In the first year of operation, 11% of the in-scope market is forecast to be captured at an
average round-trip fare of $96. With the addition of induced trips, this results in forecast annual
ridership of just over 3 million round-trips and forecast annual revenue of just over $300m.
The level of captured demand increases significantly over the first few years as a result of our
ramp-up assumptions which impact forecasts from 2021 through 2023. By 2024, 21% of the in-
scope market is forecast to be captured, resulting in forecast annual ridership of approximately
6.5 million round-trips and annual revenue of approximately $630m.
The second phase of the line to Burbank is forecast to open in 2026. In this year, 24% of the in-
scope market is forecast to be captured at an average round-trip fare of $100. The average fare
value assumes application of yield management; the underlying fares paid by individual
passengers will vary depending on their time of travel. This results in forecast annual ridership of
just less than 8 million round-trips and annual revenue of approximately $780m.
By 2029, the HSR line is assumed to be extended south to Los Angeles Union and Anaheim, and a
connection with CaHSR services north of Palmdale is assumed to be available. Approximately 25%
of the in-scope market is forecast to be captured at an average round-trip fare of $108. With the
addition of induced trips, this results in forecast annual ridership of just less than 10 million round-
trips and forecast annual revenue of approximately $1,050m.
20 The net ramp-up assumed shows the impact on total HSR ridership of the ramp-up assumptions. Unless otherwise stated, all forecasts are shown including ramp-up. For example, forecast ridership in 2026 is 7.8 million with ramp-up of 96%. Excluding ramp-up, forecast ridership would be 7.8 / 96% = 8.2 million.

March 2017 | 16
Following additional ramp-up to 2031, the level of forecast capture is broadly maintained at
around 27% throughout the remainder of the model forecast period up to 2050. By 2050 we
forecast annual ridership of approximately 14.0 million round-trips and annual revenue of just
over $1,630m.
Yield management
The forecasts provided in Table E.3 assume application of yield management principles widely
applied by airlines and increasingly applied in the intercity rail market. Evidence from the intercity
rail market indicates that use of yield management can increase average yields, and accordingly
revenue, by around 6%. This impact is included within our forecasts by assuming fares vary
according to the time of travel, group size and anticipated level of demand for services at any
given time. The spread of fares which underpins this yield is similar to the spread of fares which
around 90% of focus group participants indicated that they would be willing to pay.
The specific characteristics of the Las Vegas visitor market, and the detailed customer data
collected on repeat visitors, could provide scope for more targeted offers. If the experience of
casino resorts proved directly transferrable to HSR, this could raise the potential revenue gain
from yield management by 15%. Table E.4 summarizes the impact this could have on HSR
revenue.
Table E.4: Illustrative impact of enhanced yield management results based on casino resort experience
Forecast element 2021 2024 2026 2029 2035 2040 2050
Operational Phases Phases
0-1 Phases
0-1 Phases
0-2 Phases
0-4 Phases
0-4 Phases
0-4 Phases
0-4
HSR revenue with enhanced yield management ($m, 2015 prices)
327 682 851 1,143 1,413 1,539 1,778
Source: Steer Davies Gleave
Sensitivity tests
We subjected our forecasts to a range of sensitivity tests.
In addition to our Base Case we developed a series of internally consistent scenarios based on
distinct combinations of circumstances. The appropriate range of input variables and their
potential interactions and associated implications has been carefully considered to develop a
range of plausible scenarios for HSR ridership.
We examined possible changes to the competitive environment, including the elimination or
worsening of highway delays on the I-15, changes in gas price trends, and higher or lower round-
trip air fares. We also investigated the effects of changing a number of the HSR service
characteristics including average fares, journey times, service frequency, station parking charges
and operating hours. These sensitivity tests demonstrate the resilience of the forecasts across a
range of areas of uncertainty.
Finally we developed a series of internally consistent scenarios based on distinct combinations of
circumstances to produce a range of plausible scenarios for HSR ridership. Table E.4 provides
summary results for the following scenarios:

March 2017 | 17
High economic growth coupled with high gas price growth:
GDP per capita grows on average 1% per annum faster each year;
Real incomes grow on average 0.6% per annum faster each year;
Demand for business/convention trips to Las Vegas grows in line with the high case
forecasts produced by Applied Analysis; and
Gas prices grow in line with the EIA’s “high oil” scenario.
Low economic growth coupled with low gas price growth:
GDP per capita grows on average 1% per annum slower each year;
Real incomes grow on average 0.6% per annum slower each year;
Demand for business/convention trips to Las Vegas grows in line with the low case
forecasts produced by Applied Analysis; and
Gas prices grow in line with the EIA’s “low oil” scenario.
Operation of HSR between Palmdale and Burbank by 2029:
The line between Palmdale and Burbank opens in 2029, at the same time as the section
to Los Angeles and Anaheim, compared to 2026 in the Base Case.
Early completion of HSR between Palmdale and Anaheim:
The line to Anaheim (including stops at Burbank and Los Angeles) is fully open in 2024,
compared to being open between 2026 and 2029 in the Base Case.
No change in trip propensity by ethnic group:
Trends in visitation rates among younger age ethnic groups to Las Vegas do not continue
in future years.
Potential upside from Las Vegas-specific experience:
High-speed rail is able to achieve faster ramp-up and enhanced yield management results
reflecting the potential ability to capitalise on the distinct characteristics of the Las Vegas
visitor market and aligned with evidence on the uplift achieved by casino resorts using
their detailed customer database.
Table E.5: Summary of scenario revenue forecasts relative to the Base Case forecasts
% change in revenue relative to Base Case 2021 2026 2029 2035 2040 2050
High economic and gas price growth 16% 19% 20% 19% 19% 22%
Low economic and gas price growth -9% -12% -13% -14% -16% -18%
Line to Burbank open in 2029 - -18% -4% - - -
Early completion of HSR to Anaheim - 21% 3% - - -
No change in trip propensity by ethnic group -2% -4% -4% -6% -8% -11%
Potential upside from Las Vegas experience 111% 14% 21% 9% 9% 9%
Source: Steer Davies Gleave
Further details of all sensitivity analyses are provided in section 12 of this report.

steerdaviesgleave.com