Embed Size (px)
Citation preview
High dietary salt during pregnancy in ewes alters the
responses of offspring to an oral salt challenge
A thesis submitted in total fulfilment of the requirements for the degree of
Doctor of Philosophy
By
Serina Digby
B.Ag.Sc (Honours)
Department of Agricultural and Animal Science
Roseworthy Campus
The University of Adelaide, Australia
March 2007
II
TABLE OF CONTENTS
TABLE OF CONTENTS……………………………………………………………………..II
ABSTRACT……………………………………………………………………………….….V
DECLARATION…………………………………………………………………………...VIII
ACKNOWLEDGEMENTS…………………………………………………………………..IX
ABBREVIATIONS……………………………………………………………………………X
CHAPTER ONE: Introduction and Literature Review
1.1 INTRODUCTION……………………………………………………………………..1
1.2 SALT AND WATER BALANCE IN DRY SHEEP…………………………………..4
1.2.1 Kidney function………………………………………………………………..4
1.2.2 The renin-angiotensin system (RAS)…………………………………………..5
1.2.3 Salt in feed or water……………………………………………………………7
1.2.4 Salt tolerance in dry sheep……………………………………………………..8
1.3 SALT AND WATER BALANCE IN THE PREGNANT SHEEP…………………..11
1.3.1 Cardiovascular, renal and haemodynamic alterations………………………...11
1.3.2 Renin-angiotensin system (RAS) during pregnancy………………………….13
1.3.3 Salt tolerance in pregnant sheep………………………………………………15
1.3.4 Consequences of hypertension during pregnancy…………………………….16
1.4 MATERNAL INFLUENCES ON FOETAL GROWTH AND DEVELOPMENT….19
1.4.1 Placental function……………………………………………………………..19
1.4.2 Foetal development of the cardiovascular and renal system………………….21
1.4.3 Foetal programming………………………………………………………..... 23
1.5 LONGER TERM POSTNATAL EFFECTS OF HIGH SALT DIETS………………26
CHAPTER TWO: Physiological effects of high dietary salt in pregnant ewes
2.1 INTRODUCTION……………………………………………………………………27
2.2 MATERIALS AND METHODS…………………………………………………….29
2.2.1 Experimental Design…………………………………………………………29
2.2.2 Diets………………………………………………………………………….30
2.2.3 Ultrasound…………………………………………………………………. 31
2.2.4 Blood sampling………………………………………………………………32
2.2.4.1 Progesterone assay...............................................................................33
2.2.4.2 AVP assay……………………………………………………………35
2.2.4.3 Aldosterone assay…………………………………………………….36
2.2.5 Blood pressure………………………………………………………………..39
III
2.2.6 Water intake and urine analysis……………………………………………...40
2.2.7 Lambing………………………………………………………………………40
2.2.8 Udder volume and milk analysis……………………………………………..41
2.2.9 Statistical analysis…………………………………………………………….42
2.2.10 Ethics………………………………………………………………………….42
2.3 RESULTS…………………………………………………………………………….43
2.3.1 Pregnancy rates……………………………………………………………….43
2.3.2 General animal responses…………………………………………………….43
2.3.2.1 Death rates……………………………………………………………43
2.3.2.2 Live weight…………………………………………………………...44
2.3.2.3 Feed intake……………………………………………………………45
2.3.2.4 Water intake…………………………………………………………..46
2.3.2.5 Haematocrit, glucose and urinary analysis…………………………...46
2.3.3 Hormone analysis…………………………………………………………….47
2.3.4 Blood pressure………………………………………………………………..50
2.3.5 Lambing………………………………………………………………………51
2.3.6 Udder volume and milk analysis……………………………………………..51
2.4 DISCUSSION………………………………………………………………………..52
CHAPTER THREE: Responses of the offspring to an oral salt challenge
3.1 INTRODUCTION……………………………………………………………………58
3.2 MATERIALS AND METHODS…………………………………………………….61
3.2.1 Short-term preference testing………………………………………………...61
3.2.2 Long-term preference testing………………………………………………...61
3.2.3 Salt tolerance test on lambs…………………………………………………..62
3.2.3.1 Sodium concentration………………………………………………...62
3.2.3.2 Hormone analysis…………………………………………………….63
3.2.4 Statistical analysis…………………………………………………………….63
3.2.5 Ethics………………………………………………………………………….64
3.3 RESULTS…………………………………………………………………………….65
3.3.1 Short- and long-term preference testing………………………………………65
3.3.2 Salt tolerance test……………………………………………………………..65
3.3.2.1 Urinary output………………………………………………………...65
3.3.2.2 Water intake…………………………………………………………..66
3.3.2.3 Sodium excretion……………………………………………………..67
3.3.2.4 AVP concentration……………………………………………………68
IV
3.3.2.5 Aldosterone concentration……………………………………………69
3.4 DISCUSSION………………………………………………………………………...71
CHAPTER FOUR: Response of the offspring to an oral salt challenge with restricted
water intake or to consecutive salt challenges
4.1 INTRODUCTION……………………………………………………………………77
4.2 MATERIAL AND METHODS………………………………………………………79
4.2.1 Salt challenge with restricted water intake………………………………… ..79
4.2.2 Salt challenge at 0 and 8 hours………………………………………………..79
4.2.3 Statistical analysis…………………………………………………………….79
4.2.4 Ethics………………………………………………………………………….81
4.3 RESULTS…………………………………………………………………………….82
4.3.1 Salt challenge with restricted water intake…………………………………...82
4.3.2 Salt challenge at 0 and 8 hours………………………………………………..83
4.4 DISCUSSION………………………………………………………………………...87
CHAPTER FIVE: Response of the offspring to salty drinking water
5.1 INTRODUCTION……………………………………………………………………91
5.2 MATERIALS AND METHODS…………………………………………………….93
5.2.1 Salt tolerance test using salty water (1.5%NaCl)…………………………….93
5.2.2 Statistical analysis……………………………………………………………93
5.2.3 Ethics…………………………………………………………………………94
5.3 RESULTS…………………………………………………………………………….95
5.3.1 Water intake…………………………………………………………………..95
5.3.2 Urinary output………………………………………………………………...95
5.3.3 Sodium excretion……………………………………………………………..96
5.3.4 Feed intake……………………………………………………………………97
5.3.5 Aldosterone and AVP concentrations………………………………………...98
5.4 DISCUSSION……………………………………………………………………….100
CHAPTER SIX: General Discussion
6.1 GENERAL DISCUSSION………………………………………………………….105
APPENDIX ...………………………………………………………………………………112
REFERENCES……………………………………………………………………………..116
V
ABSTRACT
Most research to date has focused on non-pregnant sheep grazing saltbush to fill the
summer/autumn feed gap in temperate regions of southern Australia. However, the
summer/autumn period coincides with late pregnancy for autumn- or winter-lambing ewes,
and feeding saltbush may reduce the amount and cost of supplementary feed that is required
to meet the energy demands of late pregnancy. The challenge of dealing with a high-salt diet
may be exacerbated during pregnancy since pregnancy is a salt-retaining physiological state,
yet a high-salt intake requires an increase in mechanisms to excrete salt. The effect of high
dietary salt on the developing foetus(es) has been studied in rodent models, but less so in
sheep. Hence the aims of this thesis were to determine whether pregnant ewes can manage a
high dietary salt content resembling that found in saltbush, and whether there are
consequences to the offspring’s physiological responses to ingested salt.
Merino ewes were synchronized for ovulation and artificially inseminated. To mimic the
concentration of salt in animals grazing saltbush-based pastures in summer and autumn, a diet
of 13% NaCl was fed from insemination through to parturition. It was found that pregnant
ewes can be fed a 13% NaCl diet and manage the physiological conflict of high salt and
pregnancy by decreasing their aldosterone concentrations and increasing their water
consumption. There was no effect of high dietary salt on pregnancy rates, lamb birth weights,
lamb survival or milk composition (fat and protein percentages).
A series of experiments were conducted to test if the high-salt intake of ewes during
pregnancy was associated with a change in the dietary preference for salt and/or changes in
physiological responses to ingested salt in the offspring (‘S lambs’ vs. control, ‘C lambs’). C
lambs and S lambs were exposed to short- and long-term preference testing to determine if
there were differences in their voluntary selection for salt in their diet. There were no
significant differences in dietary salt preference between C and S lambs.
Abstract
VI
The lambs were subjected to salt 'challenges' (oral dose of 40 g NaCl in 25% w/v solution)
from 3-10 months of age and their water intake, urinary output, sodium excretion and
hormone concentrations were measured over the ensuing 23 hours, and compared against
counterparts dosed with an equal volume of water without salt. Following the initial salt
challenge further experiments were conducted with slight alterations; water intake was
manipulated immediately following the salt challenge; two consecutive salt challenges, 8
hours apart, were administered; and C and S lambs were offered salty water (1.5% NaCl) over
a period of two days.
The results of these salt challenge experiments showed that C and S lambs excreted a salt load
at a similar rate, but they differed in the magnitude of changes in water intake and hormone
concentrations required to achieve sodium homeostasis. S lambs were able excrete sodium at
the same rate as C lambs but without decreasing aldosterone concentrations to the same extent
and whilst consuming 400 mL less water in the first two hours post challenge. The
aldosterone results suggested a lowered responsiveness to aldosterone and the lower water
consumption suggested an altered thirst threshold. The experiment in which water
consumption was manipulated suggested that when the supply or access to fresh water is
limited, the capacity to remove a salt load is likely to be less impaired in S lambs than C
lambs; S lambs were able to excrete the salt load faster than the C lambs when the availability
of drinking water was limited. From the experiment in which lambs were treated with two
consecutive salt challenges, the rate of sodium excretion increased after the second dose, but
there remained no difference in the rate of excretion between C and S lambs; all animals were
able to excrete 95% of the administered dose of sodium within 23 hours. The final experiment
in which animals were given salty water (1.5% NaCl) for a period of two days showed
consistent results with the previous experiments for water consumption and aldosterone
concentrations between C and S lambs. There was no difference in sodium excretion between
Abstract
VII
C and S lambs. A novel finding was a markedly lower voluntary feed intake in S lambs than
C lambs. Although mechanisms for this are unknown, it may have profound effects on the
productivity of the animals.
The experiments reported in this thesis provide new information of relevance to pregnant
ewes grazing halophytic forages. It is apparent that they can withstand a high NaCl content
typical, of a saltbush-based pasture. Further work is warranted to conclude whether high salt
during pregnancy is (i) beneficial to the offspring in regards to a higher capacity to deal with
excess salt under farming conditions and (ii) consistently associated with a lower voluntary
feed intake of the offspring.
VIII
DECLARATION
I hereby declare that this work contains no material which has been accepted for the award of
any other degree or diploma in any university or other tertiary institution. To the best of my
knowledge and belief, this thesis does not contain material previously published or written by
another person, except where due reference has been made in the text.
I give consent to this copy of my thesis, when deposited in the University Library, being
available for loan and photocopying.
Serina Digby
IX
ACKNOWLEDGEMENTS
I would like to express my sincere appreciation to my supervisors, Dr. Dean Revell, Dr.
David Masters and Professor Phil Hynd, for your support, knowledge and enthusiasm during
my canditure. To Dean specifically, thank you for everything, your patience, you
encouragement, your humour, your friendship and the door of your office to lean against and
make sour faces. You have been there for me every step of the way, through my
undergraduate years, my honours and my PhD. I have learnt so much from you, not just in
research, but also in life, and I have valued every pep talk that you gave me. I wish you and
your family all the best in the years to come.
A special thanks goes to Grant who helped move, drench and treat my animals whilst on the
Roseworthy farm. Thank you to students that helped perform the experiments, with a special
mention to Anna Toland, and husband, Dan Thompson, who not only helped but provided me
with a bed and food on those late nights of lambing and collection.
A sincere thank you goes to the team at the University of Western Australia, specifically
Margaret Blackberry and Dominique Blanche for analysing blood samples for progesterone,
aldosterone and AVP. Also, thank you to the team at the University of Adelaide, Waite
Campus for analysing urine and feed samples. For statistical analysis I would like to thank Dr.
Julian Taylor. Financial support from an Australian Postgraduate Award, CSIRO top up and
funding for operating costs from the CRC for Plant-based Management of Dryland Salinity
was greatly appreciated and acknowledged.
Finally I would like to thank my family who have supported me through 7 years at University.
The financial and emotional support was appreciated and will never be forgotten. Thank you
Mum, Dad and Chantelle and also thank you Ryan for just being there and being you.
X
ABBREVIATIONS
µg: Microgram
µL: Microlitre
˚C: Degrees Celcius
ACE: Angiotensin-converting enzyme
ad libitum: Without restraint
ADF: Acid Detergent Fibre
Ang II: Angiotensin II
ANP: Atrial natriuretic peptide
AQP2: Aquaporin 2
AT1: Angiotensin II receptor 1
AT2: Angiotensin II receptor 2
AVP: Arginine Vasopressin
BSA: Bovine serum albumin
C: Control lambs
cm: Centimetres
CP: Crude protein
cpm: Cycles per minute
DM: Dry Matter
DOC: Desoxycorticosterone
EDTA: Ethylenediamine tetraacetic acid
et al: and others
g: Grams
GPB: Gelatin phosphate buffer
H2O: Water
HCl: Hydrochloric acid
hrs: Hour
IGF1: Insulin like growth factor-1
IU: International Units
IUGR: Intrauterine growth retardation
kg: Kilogram
L: Litres
m: Metre
M: Molar
mg: milligrams
XI
mins: Minutes
mL: Millilitre
mm: Millimetre
mmHg: Millimetres of Mercury
mmol: Millimolar
mOsm: Milliosmole
mRNA: Messenger RNA
n: Number
NA2HPO4: Disodium hydrogen phosphate
NaCl: Sodium chloride (salt)
NAH2PO4.2H2O: Sodium dihydrogen phosphate (aqueos)
ng: Nanograms
NRS: Normal rabbit serum
NSB: Non specific binding
P: Probability
PBS: Phosphate buffered saline
PCO2: Partial pressure of carbon dioxide
PEG: Polyethylene Glycol
pg: Picogram
PGI2: Prostacyclin
PMSG: Pregnant Mare Serum Gonadotropin
PRA: Plasma renin activity
RAS: Renin-angiotensin system
S: Salt lambs
SE: Standard error
TC: Total counts
V2R: Vasopressin 2 receptor
w/v: Weight per volume
CHAPTER ONE:
Introduction and Literature Review
Chapter One Introduction and Literature Review
1
1.1 INTRODUCTION
The land area affected by human-induced salinity is increasing at a rapid rate and presents
both economic and environmental land use problems (Masters et al. 2001). The use of
saltbush, which can contain 15-30% NaCl on a digestible matter basis (Wilson 1975), is one
option available to some landholders to revegetate saline landscapes and convert it from close
to zero productivity into an asset (Condon et al. 1994) as part of a grazing enterprise. There is
a large body of research (Wilson 1966; Hanjra and Rasool 1993; Morcombe et al. 1996;
Warren and Casson 1996; Masters et al. 2001; Franklin–McEvoy 2002) on sheep
performance on saltbush (and other salt-tolerant forages). In Australia the majority of this
research has considered only the performance of dry (non-pregnant and non-lactating) sheep,
with particular focus on the use of saltbush to fill the summer/autumn feed gap. During this
time, autumn-lambing ewes are in mid to late gestation, and hence saltbush could be used as a
feed source for pregnant or lactating ewes, if they can tolerate the high salt content without
detrimental effects on themselves or their offspring. There is little information on potential
consequences of high dietary salt in pregnant or lactating sheep. Potential effects on ewe
health, foetal development and persistent postnatal ramifications are yet to be defined.
The maternal physiological adaptations to pregnancy are profound and vital for successful
foetal growth and development (Bocking 2001). The adaptations that occur during pregnancy
involve physiological changes to the cardiovascular, renal, gastrointestinal and endocrine
systems, as well as alterations to carbohydrate metabolism and the immune system (Kincaid-
Smith and Fairley 1993). When these changes do not take place, foetal growth and
development can be compromised (Bocking 2001).
Ewe health during this time may be affected by high dietary salt intake as a result of increased
water reabsorption required to maintain a salt/water balance. When a large amount of salt is
ingested, the absorption of water into the rumen increases to maintain fluid balance (Wilson
Chapter One Introduction and Literature Review
2
and Dudzinski 1973), and the rate of passage of feed through the gut is increased (Elam
1961). This influx of water can result in a higher osmotic pressure and a lower microbial
population and activity in the rumen of sheep (Elam 1961). Following absorption of salt,
reabsorption of water by the kidneys is necessary to maintain the salt/water balance in the
body. As the pregnant ewe already has increased water retention as part of the normal
physiological responses to pregnancy, any additional water reabsorption would further
increase the volume of extracellular fluid in the body, and consequently blood pressure may
rise. High blood pressure can damage the kidney glomeruli, affecting the filtration of sodium,
water and waste products from the blood stream. Glomerular destruction due to hypertension
is one of the most common causes of a reduction in kidney function, or in extreme cases,
renal failure. Impaired kidney function may cause acute oedema due to salt and water
retention and a raft of other metabolic disorders (Laing et al. 2005; Takahashi et al. 2005).
Hypertension during pregnancy can lead to maternal kidney failure, breathing problems,
stroke or seizure. Complications for the foetus may include intrauterine growth restriction,
oxygen complications and premature labour (Roberts et al. 2003).
There are little data on the long-term consequences of high dietary salt during pregnancy on
foetal or postnatal metabolism in sheep. It is possible that an elevated salt load in the pregnant
dam affects renal development in the foetus, with longer-term consequences to the foetus in
terms of regulating salt and water balance. There is growing evidence of prenatal events
having long-term postnatal consequences (Stevens and Lumbers 1986; Hegarty et al. 2000;
Fowden 2001; Marsh et al. 2001; Revell et al. 2002; Wintour 2002; Mohamed and Phillips
2003) and in particular, effects of an altered in utero environment on postnatal kidney
function (Marsh et al. 2002; Wintour 2002; Dickinson et al. 2005; Mortiz et al. 2005;
Rattanatray et al. 2005). Studies with rats in relation to high-salt diets prenatally and/or
postnatally have shown an increase in salt preference (Kosten et al. 1983; Smriga et al. 2002;
Chapter One Introduction and Literature Review
3
Curtis et al. 2004) and changes in renin-angiotensin system (RAS) and blood pressure
(Contreras 1993; Arguelles et al. 1996; Butler et al. 2002; Alves da Silva et al. 2003).
In the following sections salt and water balance in dry and pregnant sheep will be discussed,
including the effects on the renin-angiotensin system and hypertension during pregnancy.
Foetal growth and development, including placental function, and studies investigating foetal
programming will also be discussed in relation to pre and/or postnatal manipulations. The
evidence from the literature outlines the importance for the current study of physiological
effects of high dietary salt intake in pregnant ewes and the effects on the offspring.
Chapter One Introduction and Literature Review
4
1.2 SALT AND WATER BALANCE IN DRY SHEEP
1.2.1 Kidney function
The kidneys play an important role in the regulation of water balance, electrolyte balance,
acid/base balance, maintenance of osmotic pressures of body fluids and in the removal of
metabolic waste products and other toxic substances (Sherwood 1997). The effectiveness of
this regulation is directly related to the rate of renal blood flow, glomerular filtration and renal
tubular excretion and reabsorption. Water and electrolyte homeostasis is maintained by
osmoreceptors that detect changes in the concentration and osmolality of solutes in body
fluids (Randall et al. 2002). Osmoreceptors stimulate the kidneys to maintain water and
electrolyte balance. For example, when there is excess salt present, osmoreceptors stimulate
the kidney to decrease sodium reabsorption, thus maintaining homeostasis. If this process is
impaired, fluid retention increases and salt concentrations may also rise. This can be
detrimental to the health of the animal through increasing plasma volume, resulting in
hypertension and associated health disorders.
To ensure that changes in plasma volume and cardiac output have little effect on the
glomerular filtration rate under normal circumstances, a number of regulatory processes exist
that control blood flow through the nephrons of the mammalian kidney. Firstly, the afferent
arteriole responds to the initial stretch that occurs with increased plasma volume by
contracting, thus reducing the diameter of the arteriole and increasing the resistance to flow
(Randall et al. 2002). This myogenic mechanism reduces variations in flow to the glomerulus
in the face of oscillations in blood pressure. Secondly, granular and macula cells in the
juxtaglomerular apparatus secrete substances that modulate renal blood flow. The granular
cells release the enzyme renin, which indirectly affects blood pressure and therefore renal
blood flow (August 2000). The macula densa releases various substances that act in a
paracrine fashion causing vasoconstriction or vasodilation of the afferent arteriole in response
Chapter One Introduction and Literature Review
5
to variable flow through the tubule. In addition the glomerular filtration rate is subject to
neuronal control originating from outside the digestive tract (Randall et al. 2002).
1.2.2 The renin – angiotensin system (RAS)
Renin is an enzyme that triggers a cascade of responses involved in regulating blood volume
and pressure (Figure 1). Its release by the kidneys is controlled by several factors (Davis and
Freeman 1976). The juxtaglomerular cells act as miniature pressor transducers that sense
renal perfusion pressure, which are perceived via distortions in the stretch on the arterial wall.
For example, a reduction in renal perfusion pressure and afferent arteriolar pressure occurs
with a reduction in circulating blood volume. The release of renin is increased when low
pressure is sensed by the juxtaglomerular cells. This leads to normalised blood volume and
blood pressure via the effect of angiotensin II on aldosterone (these hormones promote
sodium reabsorption in the kidney; see later) and vascular tone (Seely and Moore 1994). Thus
the RAS controls blood volume by appropriate modification of renal tubular sodium transport
(Rhoades and Pflanzer 1996).
A second control mechanism for renin release is centred in the macula densa cells. It has been
suggested that these cells may function as chemoreceptors, monitoring the sodium load
present in distal tubules, and relaying that information back to the juxtaglomerular cells,
where appropriate modifications of renin release take place (Seely and Moore 1994). A third
mechanism involves the sympathetic nervous system via direct effects on the juxtaglomerular
cells leading to renin release (Rhoades and Pflanzer 1996). Finally, a number of circulating
factors may alter renin release, such as potassium (increased dietary potassium directly
decreases renin release) and angiotensin II (increased angiotensin II concentration decreases
renin release via a direct short feedback loop) (Dluhy et al. 1970; Williams et al. 1978).
Chapter One Introduction and Literature Review
6
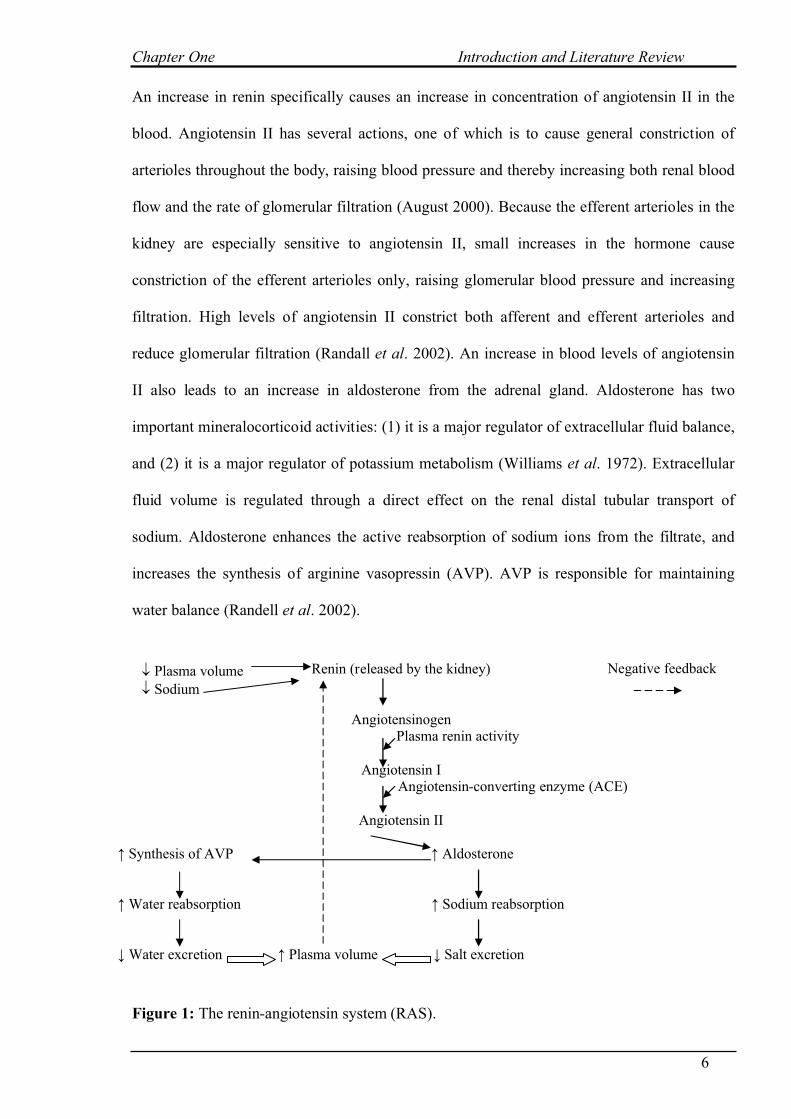
An increase in renin specifically causes an increase in concentration of angiotensin II in the
blood. Angiotensin II has several actions, one of which is to cause general constriction of
arterioles throughout the body, raising blood pressure and thereby increasing both renal blood
flow and the rate of glomerular filtration (August 2000). Because the efferent arterioles in the
kidney are especially sensitive to angiotensin II, small increases in the hormone cause
constriction of the efferent arterioles only, raising glomerular blood pressure and increasing
filtration. High levels of angiotensin II constrict both afferent and efferent arterioles and
reduce glomerular filtration (Randall et al. 2002). An increase in blood levels of angiotensin
II also leads to an increase in aldosterone from the adrenal gland. Aldosterone has two
important mineralocorticoid activities: (1) it is a major regulator of extracellular fluid balance,
and (2) it is a major regulator of potassium metabolism (Williams et al. 1972). Extracellular
fluid volume is regulated through a direct effect on the renal distal tubular transport of
sodium. Aldosterone enhances the active reabsorption of sodium ions from the filtrate, and
increases the synthesis of arginine vasopressin (AVP). AVP is responsible for maintaining
water balance (Randell et al. 2002).
Figure 1: The renin-angiotensin system (RAS).
Renin (released by the kidney)
AngiotensinogenPlasma renin activity
Angiotensin IAngiotensin-converting enzyme (ACE)
Angiotensin II
↑ Synthesis of AVP ↑ Aldosterone
↑ Water reabsorption ↑ Sodium reabsorption
↓ Water excretion ↑ Plasma volume ↓ Salt excretion
↓ Plasma volume
↓ Sodium
Negative feedback
Chapter One Introduction and Literature Review
7
When plasma volume is increased, due to aldosterone-induced expansion, it is usually
accompanied by high blood pressure. This is also due to angiotensin-mediated
vasoconstriction independently affecting kidney function (August 2000). Also when plasma
volume is high there is an independent decrease in AVP from the posterior pituitary (Rhoades
and Pflanzer 1996).
AVP synthesis increases permeability of the distal tubule and collecting duct to water,
promoting its reabsorption. Aldosterone then acts with AVP to enhance both sodium and
water reabsorption by the kidney (Randall et al. 2002).
Atrial natriuretic peptide (ANP) released by the cells in the heart in response to an increase in
venous pressure causes an increase in urine production and sodium excretion (Rhoades and
Pflanzer 1996). ANP inhibits the release of AVP and renin and the production of aldosterone
by the adrenal gland. ANP acts directly on the kidney to reduce sodium and therefore, water
reabsorption (Randall et al. 2002).
1.2.3 Salt in feed or water
Research has shown that the means of ingestion of salt (feed or water) alters the effects that
salt may have on food intake and the health of the animal and, that the acceptability or tastes
of food or water containing high levels of salt is a factor in determining the salt tolerance of
sheep (Wilson 1966). There are differences in the tolerable concentrations of salt when
ingested with water or with feed. The upper concentration of salt in water (1.3% NaCl; Peirce
1968) is lower compared to the upper concentration of salt in food (13.1%; Meyer and Weir
1954); however the total daily load is similar given that feed intake is often about 1kg/day and
water intake can be up to 10L/day (Wilson 1966). The tolerance of higher concentrations of
salt in food is due to the availability of fresh water, which helps avoid high osmolality
(Wilson 1966).
Chapter One Introduction and Literature Review
8
1.2.4 Salt tolerance in dry sheep
Research to date of animal responses to high-salt intake has focused on dry sheep grazing
saltbush (and other halophytic plants), dissolved salts in drinking water and added sodium
chloride in the diet.
Studies by Wilson in the 1960s showed that the intake of salty feed is influenced by both salt
content and the quality of the feed. As salt concentrations increased the intake of feed
decreased but this also depended on the type of feed (halophytic plants or constituents of diets
with salt added); the higher the quality and digestibility of feed, or the more moisture in the
leaves (halophytic plants), the more tolerant the animals were of the salt concentration in
relation to depressed feed intake. The supply of fresh water also has a significant bearing on
intake of halophytic plants such as Atriplex (saltbush) and Kochia (bluebush) (Wilson 1966;
Wilson and Hindley 1968). When access to water is restricted to once daily, there is a
reduction in food intake, which is exacerbated as the salt content increases. Wilson (1966)
showed that sodium intake is related to voluntary water consumption where the ratio of
sodium chloride intake to total water intake was between 1.8-2.2%. Studies through the 1990s
(Hanjra and Rasool 1993; Morcombe et al. 1996) further showed that saltbush could be used
as maintenance feed during the summer/autumn feed gap and that animals are capable of
maintaining weight.
A number of researchers (Wilson 1966; Wilson and Hindley 1968; Hemsley 1975; Hopkins
and Nicholson 1999; Masters et al. 2005) have also investigated the effects of high sodium
chloride when added to the diet on sheep. There are differences between studies in the
responses of feed intake and wool production, which may reflect differences in breed, diet
constituents and quality and availability of water between experiments. However the overall
conclusions are that high-salt diets decrease feed intake and wool growth, although wool
growth efficiency (wool gown per kg of organic matter) is increased. The most recent study
Chapter One Introduction and Literature Review
9
(Masters et al. 2005) found that increasing sodium in the diet for 45 days significantly
decreased feed intake, digestibility, live-weight gain and wool growth. This study suggested a
physiological limitation to the intake of sodium chloride and that there was no long-term
adaptation or recovery in daily intake over the 45 days. Although total wool growth decreased
at high sodium intakes, the amount of wool grown per kg of organic matter intake increased
indicating that improvement in the efficiency of wool growth could be achieved, as similarly
reported by Hemsley (1975).
The tolerance of sheep to dissolved salts in their drinking water has also been studied
extensively (Peirce 1957; Potter 1963; 1968; Wilson 1966; Wilson and Dudzinski 1973;
Hamilton and Webster 1987). Sheep are tolerant of NaCl concentrations <1.0%, but are very
sensitive as the concentration increases to 2.0%. Drinking water containing 1.3 – 1.5% NaCl
results in a small decrease in food intake, but a concentration of 2.0% is associated with a
severe reduction in food intake and possibly death (Peirce 1957).
Potter (1963, 1968) also studied sheep consuming salty water (1.3% NaCl) and found that the
ability of sheep to tolerate salty water was associated with an adaptation, which increases the
rate of renal excretion of ingested sodium and chloride ions. The adaptation involves
adjustments leading to increases in glomerular filtration rate and filtration fraction without
any pronounced change in renal plasma flow. The elimination of additional salts is
accomplished by a reduction of reabsorption of sodium chloride in individual nephrons of the
sheep kidney. This suggests the renal response in these animals becomes more efficient when
sheep are exposed for months to 1.3% salty water. Potter et al. (1972) further investigated the
effect of 1.3% NaCl in drinking water on intraruminal function and found significant
increases in osmotic pressure. The rate of passage of rumen fluid was increased due to the
greater influx of water when fresh water was replaced with saline water. An increase in fluid
Chapter One Introduction and Literature Review
10
flow was observed in the chaffed diet compared to an increased rate of passage in total digesta
when fed the pelleted diet and this consequently reduced microbial population. These changes
may indirectly attribute to depressed feed intake that has been observed when animals are
consuming >1.5% sodium chloride.
Further studies (Wilson and Dudzinski 1973; Hamilton and Webster 1987) also showed that
an increase of sodium chloride in drinking water (Wilson and Dudzinski 1973) or in a daily
oral dose (Hamilton and Webster 1987) causes a reduction in feed intake and wool
production, and increases water consumption, presumably in an attempt to increase the
excretion of sodium through increased urinary output.
Therefore dry sheep tolerate salt concentrations of up to 1.5% in drinking water by adapting
the RAS. Angiotensin II concentration increases causing increases in the rate of glomerular
filtration and aldosterone release. However, the tolerance of pregnant ewes to salts in drinking
water has been shown to be dramatically reduced when compared to their dry sheep
counterparts. Concentrations as low as 1.3% can cause neonatal mortalities in lambs (Peirce
1968; McIntosh and Potter 1972; Potter and McIntosh 1974).
Pregnancy is characterised by important changes in fluid and electrolyte balance, which are
largely dictated by pregnancy-induced changes in the RAS and in AVP (Seely and Moore
1994). Therefore the ability of the pregnant animal to maintain homeostasis is altered due to
the considerable alterations in cardiovascular and renal haemodynamics. These changes in
physiological status during pregnancy will now be discussed in detail.
Chapter One Introduction and Literature Review
11
1.3 SALT AND WATER BALANCE IN THE PREGNANT EWE
1.3.1 Cardiovascular, renal and haemodynamic alterations
Marked alterations in cardiac, renal and hemodynamic parameters are apparent at the
beginning of gestation. Cardiac output rises 30-40% relative to the non-pregnant state in
humans, and is a result of increased stroke volume and heart rate (August 2000). The
increased stroke volume is due to the increase in plasma volume. Despite these increases,
blood pressure falls during normal pregnancy and is associated with a reduced peripheral
vascular resistance due to the vascular effects of ovarian steroid hormones (Wilson et al.
1980) and nitric oxide (August 1999). In the latter half of pregnancy blood pressure gradually
rises until the mean blood pressure in most near-term pregnant subjects is approximately
equal to that in the non-pregnant state.
Accompanying the increase in renal blood flow observed during pregnancy is a substantial
increase in glomerular filtration rate. Filtration fraction, which is the fraction of plasma
flowing through the glomeruli that is filtered into the tubule, falls in early pregnancy due to a
smaller increase in glomerular filtration rate than in effective renal plasma flow (the amount
of plasma perfusing the kidney tubules per unit time) (Kincaid-Smith and Fairley 1993).
Filtration fraction rises again in late pregnancy. An increased filtered load inevitably
accompanies the substantial increase in glomerular filtration rate during pregnancy (Kincaid-
Smith and Fairley 1993); hence changes in tubular function are necessary to avoid a
considerable loss in urine of various substances such as water, nutrients and electrolytes
present in the glomerular filtrate. Tubular reabsorption increases in order to prevent rapid
depletion from the body of sodium, chloride, glucose, potassium and water (Blackburn 2003).
Conversely, tubular reabsorption rates cannot always accommodate the increased filtered load
and leads to excretion of substances such as glucose and amino acids.
Chapter One Introduction and Literature Review
12
In pregnant women, the filtered load of sodium increases during pregnancy from 20,000 to
30,000 mmol/day (Kincaid-Smith and Fairley 1993). The increased filtered load of sodium
requires a considerable increase in sodium reabsorption by the renal tubule to avoid massive
sodium loss (Kincaid-Smith and Fairley 1993). The capacity to avoid excessive sodium
retention during pregnancy may be enhanced by high circulating levels of progesterone,
which has an antagonistic effect on aldosterone (Landau and Lugibihl 1958). Although
progesterone is a competitive inhibitor of aldosterone, it also induces a natriuretic effect that
activates the RAS by the same mechanisms as dietary sodium restriction (Braley et al. 1996).
Thus, sodium balance is achieved during periods of increased progesterone concentrations via
control of opposing effects: increased plasma concentrations of aldosterone through a direct
effect on the RAS balanced by an antagonistic effect on aldosterone through competitive
inhibition.
Plasma osmolality decreases from conception and persists throughout pregnancy. In humans
the decrease is approximately 8 to 10 mOsm/kg below non-pregnant values, 280 vs. 270
mOsm/kg (Duvekot and Peeters 1994). This change is associated with changes in the plasma
concentration of sodium, urea and other ions and may arise from the decrease in PCO2 and
subsequent compensatory adjustments in renal ion excretion (Duvekot and Peeters 1994).
Massive water diuresis due to the inhibition of AVP secretion would normally occur with a
decrease in osmolality of this degree; however, this does not occur in pregnancy. The
threshold osmolality that stimulates AVP secretion and thirst is decreased (Kincaid-Smith and
Fairley 1993), and the mean AVP concentration in plasma increases. An increase in total body
water during pregnancy is associated with and contributes to this decrease in osmolality (6-8
litres in humans, 60-70% of which is extracellular and distributed approximately 50/50
between the maternal and foetal-placental compartments; Seely and Moore 1994). The
mechanisms controlling intracellular and extracellular volume during pregnancy are poorly
Chapter One Introduction and Literature Review
understood, but renal sodium handling is a major determinant of the changes that
occur. Several factors including high oestrogen and plasma desoxycorticosterone
(DOC) levels may enhance sodium retention during pregnancy (Hutchinson-Williams
and Decherney 1992). The increase in aldosterone secretion during pregnancy (Seely
and Moore 1994) provides another salt-retaining mechanism.
1.3.2 Renin – angiotensin system (RAS) during pregnancy
Plasma renin activity (PRA) increases substantially during normal pregnancy.
Angiotensin II concentrations also increase to nearly twice normal, due to the increase
of the renin substrate, angiotensinogen, produced by the liver in response to increased
levels of oestrogen (Hutchinson-Williams and Decherney 1992). As a result of the
increased angiotensin II, aldosterone concentrations increase, and cause increases in
blood volume (Figure 2). Oestrogen infusions into the body also increase blood flow;
however this effect is secondary to a rise in angiotensin II. Angiotensin II increases
uterine blood flow and local production of prostaglandin E or prostacyclin within the
vessel wall leads to vasodilation (Resnick 1981).
NOTE: This figure is included on page 13 of the print copy of the thesis held in the University of Adelaide Library.
Figure 2: The effect of oestrogen during pregnancy on angiotensin and blood volume (Hutchinson-Williams and Decherney 1992).
13
Chapter One Introduction and Literature Review
14
Even though angiotensin II concentration is significantly elevated during the course of
pregnancy, the elevated levels in a normal pregnancy do not produce an increase in blood
pressure because of a reduced responsiveness to angiotensin II (Abdual-Karim et al. 1961).
Reduced responsiveness to angiotensin II occurs via an increased production of
prostaglandins by the uterus or placenta. A critically important adaptive response is the
decrease by mid pregnancy of systolic and diastolic pressures. These fall by 10 to 20mmHg.
If blood pressure does not decrease there is an increased risk of developing pregnancy-
induced hypertension (Hutchinson-Williams and Decherney 1992). Circumstances in which a
defective response may occur include genetics, where individuals are predisposed to high
blood pressure, or gestational diabetes.
Associated with high concentrations of angiotensin II are elevated concentrations of
aldosterone during pregnancy (Kincaid-Smith and Fairley 1993). Even though plasma
aldosterone concentrations are markedly increased during pregnancy, the regulation of
aldosterone secretion appears to be normal. Some studies suggest that pregnancy would be a
chronic sodium-losing state without the elevated levels of aldosterone necessary to maintain
normal sodium balance (Seely and Moore 1994). Thus aldosterone secretion is increased to
compensate for this salt-losing tendency and when its secretion is inhibited, salt wasting
occurs (Ehrlich 1971).
An interesting feature of the increased levels of mineralocorticoids in pregnancy is that
potassium wasting does not occur. Thus even though there is an 8- to 10-fold increase in
aldosterone secretion rates, serum potassium levels are normal (Kincaid-Smith and Fairley
1993). The elevated levels of progesterone observed in pregnancy can probably best explain
this apparent paradox (Tulchinsky and Okada 1975). Progesterone acts as an antagonist to
aldosterone at the renal tubule and inhibits both its sodium-retaining and potassium-losing
Chapter One Introduction and Literature Review
15
tendencies (Landau and Lugibihl 1958). Therefore the RAS responds to the hormonally-
mediated changes of pregnancy and maintains and supports blood pressure and blood flow as
well as sodium and potassium balance.
1.3.3 Salt tolerance in pregnant sheep
Studies have shown that ewes have adverse reproductive effects when drinking water with
high salt concentration. McIntosh and Potter (1972) showed that concentrations of sodium
chloride up to 1.3% in drinking water produced distress in some ewes and neonatal mortalities
in their lambs. These results were associated with adaptive changes similar to those found in
dry sheep that interfered with normal sodium chloride status of the pregnant animal
(McIntosh and Potter 1972). Peirce (1968) also found that the reproductive performance of
ewes was adversely affected by excess (1.3% or above) salt in drinking water, with ewes
failing to conceive and mortality of neonatal lambs prevalent. The susceptibility of pregnant
ewes to salt water ingestion increases with age and/or multiple births (Potter and McIntosh
1974). Elevated progesterone levels were observed in ewes that consumed salty water (Potter
and McIntosh 1974). Progesterone has been shown to be a natriuretic agent in some species
and exerts an antagonistic effect on the salt-retaining influence of aldosterone (Landau and
Lugibihl 1958). This indicates the elevated progesterone results from a need to maintain
sodium homeostasis by increasing sodium clearance from the body. However, under salt
loading, an increase in progesterone concentration may contribute to an extended gestation. If
progesterone stays elevated during pregnancy in sheep, the onset of parturition may be
delayed as normal pregnancy in sheep involves a rapid decline in progesterone before the
onset of parturition (Rurak 2001).
Potassium and chloride concentrations in plasma, both significantly increase in response to
increased salt intake, while calcium and magnesium are reduced in sheep (Potter et al. 1972).
Plasma potassium increases were associated with reduced secretion of corticosteroids and the
Chapter One Introduction and Literature Review
16
increase of plasma chloride might be a reflection of greater rumen chloride concentrations as
observed previously in non-pregnant sheep drinking 1.3% saline water (Potter et al. 1972).
Therefore the effect of drinking water containing 1.3% sodium chloride on pregnant ewes,
particularly those carrying twins, is associated with changes in plasma progesterone and
electrolyte concentration, but the significance of these changes is not clear. It is possible that
the biological mechanisms available to the animal for removing excess sodium chloride may
conflict with salt retention associated with pregnancy.
The reproductive success of ewes fed a high-salt diet could be compromised because the
availability of energy for reproduction, which is an energy-dependent physiological state,
might become limited if it reduces voluntary feed intake and the efficiency of energy use for
production to the same extent as it does in dry sheep (Wilson, 1966; Arieli et al., 1989;
Masters et al., 2005; Blache et al., 2007).. The metabolic status of the animal is the most
powerful internal regulator of reproductive function. When the metabolic status of an animal
decreases either due to a decrease in voluntary feed intake or a decrease in fat reserves it is
usually associated with a decrease in the concentration of metabolic hormones such as insulin
and leptin (Chilliard et al., 2005). Indeed, high salt ingestion has recently been shown by
Blache et al. (2007) to affect energy metabolism through changes in insulin concentrations in
wethers fed high-salt (20% NaCl) diets. Thus, the ingestion of large amount of salt may
impact on energy availability and impair reproductive performance.
1.3.4 Consequences of hypertension during pregnancy
Hypertension causes glomerular destruction and is one of the most common causes in
reducing kidney function, or in extreme cases, renal failure. Impaired kidney function may
cause acute oedema due to salt and water retention. Acidosis can also be caused by impaired
kidney function due to the inability of the kidneys to excrete acidic substances (Laing et al.
2005). Other effects include increased blood concentrations of urea due to impaired renal

Chapter One Introduction and Literature Review
17
excretion of metabolic waste products, elevated potassium levels than can lead to cardiac
arrest and anaemia because the kidneys no longer produce enough erythropoietin for adequate
red blood cell production (Takahashi et al. 2005). Chronic kidney failure decreases
glomerular filtration rate and increases blood levels of nitrogen containing wastes and
creatinine.
If hypertension is induced in pregnancy due to excess salt loads a number of health situations,
such as stroke, heart attack, loss of kidney function or renal failure and impaired vision and
even blindness can arise (Roberts et al. 2003). These in turn can affect the growth and
development of the foetus. The maternal RAS may also play a significant role in the
regulation of foeto-placental blood pressure (Hutchinson-Williams and Decherney 1992). If
the RAS is impaired and blood pressure increases, the foetus may experience an increase in
blood pressure resulting in hypertension and other health problems after birth. Hypertension
may also damage maternal blood vessels resulting in a deficient maternal blood supply, foetal
retardation of growth, or even foetal death as adequate maternal blood supply is essential for
foetal growth and development (Liggins 1982).
Therefore hypertension during pregnancy may have direct effects on maternal health and have
both direct and indirect effects on foetal development. Feeding high-salt diets to ewes could
result in hypertension due to the increase in extracellular water from pregnancy in addition to
the increased salt loads. This may have important consequences to both the ewe and her
offspring.
Factors other than hypertension in the mother during pregnancy have been shown to either
directly or indirectly effect foetal growth and development through placental function and
cardiovascular and renal changes. These factors in turn can influence foetal programming and
Chapter One Introduction and Literature Review
18
thus life-long consequences. The major factors in relation to maternal influences and foetal
growth and development will now be discussed.
Chapter One Introduction and Literature Review
19
1.4 MATERNAL INFLUENCES ON FOETAL GROWTH AND DEVELOPMENT
Maternal nutritional status is one of the major extrinsic factors programming nutrient
partitioning and ultimately growth, development and function of the major foetal organ
systems. Prenatal growth is sensitive to the direct and indirect effects of maternal dietary
intake and body composition from the earliest stages of embryonic life (Wallace 2000) and
manipulation of maternal dietary intake can lead to behavioural and physiological changes of
the offspring later in life. For example, restricted maternal nutrition in early to mid-gestation
increases body fatness and the incidence of coronary heart disease (Symonds et al. 2001) and
maternal undernutrition during late gestation increases arterial blood pressure in the sheep
foetus (Edwards and McMillen 2001). Therefore, nutritional manipulation either throughout
and/or at specific stages of pregnancy can have profound effects on the embryo, placenta or
foetus.
1.4.1 Placental function
The placenta combines to perform many functions, all of which assist the growth and
development of the foetus (Renfree 1982). It is a partial barrier to the transfer of cells from
the mother to the foetus or vice versa and hence provides an immunological ‘fence’. It
facilitates the delivery of oxygen to the foetus; assists in the preferential transfer of amino
acids and limits the transfer of large molecules; provides the substrates for foetal metabolism
and disposes of waste products; is a site of hormone production and adapts to the increasing
metabolic demands of the foetus (Rurak 2001). Diffusion is the most common, and
quantitatively the most significant, transfer mechanism in the placenta (Liggins 1982). It
accounts for the transfer of oxygen, carbon dioxide, fatty acids, glucose, steroids, nucleosides,
some electrolytes, fat-soluble vitamins and most therapeutic agents.
Placental effects can influence foetal growth and development. The weight of the placenta is
an important predictor of birth weight (Sanin et al. 2001). Experimental reduction in placental
Chapter One Introduction and Literature Review
20
size also reduces foetal growth in a number of species. In the ewe, removal of the placental
implantation sites before pregnancy reduces placental mass and lowers foetal body weight at
term by as much as 70% (Fowden 2001). Reductions in the functional mass of the placenta by
the umbilical artery ligation or partial immobilisation of the foetal placental vasculature with
microspheres also result in intrauterine growth retardation (IUGR) (Anthony et al. 2003).
Wallace et al. (2004) also showed that overnourishing adolescent dams resulted in a major
restriction in placental growth, due to competition for nutrients between the maternal body
and the gravid uterus, which leads to decreased lamb birth weight. Foetal growth is therefore
highly dependent on the functional and structural integrity of the placenta. The nutrients taken
up by the placenta provide energy for the transport and biosynthetic activities of the placenta.
They also provide precursors for the synthesis of hormones and other molecules that are
released into both the umbilical and uterine circulations. For growth and oxidative
metabolism the foetus uses some of the substances synthesised by the placenta, such as lactate
and certain amino acids. The hormones produced by the placenta, such as progesterone may
also have effects on foetal growth and development either directly or indirectly via changes in
placental or maternal metabolism (Fowden 2001).
The RAS has regulatory functions in the placenta (Schauser et al. 1998) but these regulatory
effects differ between species. Wilkes et al. (1985) have identified and characterised human
placental angiotensin II receptors and Schauser et al. (1998) have identified bovine placental
angiotensin II receptors, however the proportion of AT1 and AT2 receptors at specific
locations are different between the two species and thus the regulatory functions also differ.
Angiotensin II is one of the factors that regulate the blood flow in the uteroplacental unit, and
it thereby indirectly influences the foetal volume homeostasis and oxygenation (Wilkes et al.
1985). Angiotensin II also stimulates placental lactogen in humans, pregnancy-specific ß1-
Chapter One Introduction and Literature Review
21
glycoprotein, and estradiol secretion in human trophoblast cells via AT1 receptors (Schauser et
al. 1998).
1.4.2 Foetal development of the cardiovascular and renal system
The cardiovascular system is composed of the heart and blood vessels and is the first system
in the embryo to begin to function (Blackburn 2003). Blood formation in the embryo begins
in the liver after a few weeks and can be seen circulating through the embryonic body at the
end of those few weeks. As tissues and organs differentiate, the regional networks elaborate to
meet metabolic demands. Development of the heart is controlled by a group of cardiac genes
and transcription factors (Blackburn 2003). Alterations in these genes or factors or sequencing
may to lead to failure in development, incomplete or defective development (hypoplasia),
abnormal development (dysplasia), malposition, failure of adjoining parts, abnormal fusion,
incomplete resorption, persistence of a vessel or early obliteration of a vessel and thus cardiac
defects (Carlson 1999). Environmental factors may also play a role in the etiology of
congenital cardiac malformations. Foetal exposure to teratogens through maternal ingestion of
drugs such as antiepileptic drugs or warfarin, or alcohol, as well as viral infections, can result
in alterations in cardiac development. Forty to fifty percent of the foetal cardiac output is
directed toward the placenta, with 14% to the brain and 10-12% to the lungs. The remainder is
divided among the gastro-intestinal tract, kidneys and the rest of the body.
Kidney development begins in early gestation with the formation of the adult number of
nephrons by mid to late gestation. Urine formation is occurring by 5 weeks and by mid
gestation urine production by the foetus is a major component of amniotic fluid. The kidney
develops through three successive overlapping stages. The initial steps involve formation of
transient non-functional structures on either side of midline, from which the permanent
kidney develops. Formation of the kidney involves two separate, interrelated processes. These
processes are under the control of genes that are differentially expressed to form proteins that
Chapter One Introduction and Literature Review
22
encode for extracellular matrix, cell adhesion, growth factors and cell receptor proteins
(Blackburn 2003). Factors influencing nephrogenesis include platelet-derived growth factor,
protein proteases and the RAS (Guillery 1997). Maternal hyperglycemia, alterations in the
RAS, a reduction in the supply of vitamin A to the foetus and pharmacologic agents and
maternal undernutrition alter renal development. Lumbers et al. (1996) have proposed that
one pathway by which maternal undernutrition may do so is through its effects on the
developing RAS. Lumbers et al. (1996) showed that the RAS is essential for maintenance of
the foetal glomerular filtration rate. Both angiotensin converting enzyme inhibitors and
angiotensin receptor antagonists administered to the dam cause acute renal failure in the
foetus due to the direct effects on the foetal RAS. Zhang et al. (2000) have shown that in
placental insufficiency, which is associated with IUGR, renal renin levels are low. On the
other hand infusion of insulin like growth factor-1 (IGF1), which stimulates foetal renal
growth, is associated with up-regulation of the activity of the foetal RAS in the absence of
significant changes in foetal arterial pressure (Marsh et al. 2001). Since kidney disease and
dysfunction are intimately involved in the aetiology of hypertension, abnormal renal
development may leave the foetus predisposed to hypertension in adult life (Lumbers et al.
1996).
Foetal ability to concentrate urine and conserve sodium is limited. Urine is hypotonic due to
greater tubular reabsorption of more solute than water. The major solute in foetal urine is
sodium. The foetus is not dependent on the kidney for sodium conservation since sodium is
readily transported across the placenta. The RAS is active in the foetus and is necessary for
normal development. However the foetus is very susceptible to changes in maternal fluid
balance. For example, foetal urine flow rate falls and urine osmolarity rises when the ewe is
dehydrated or infused with hypertonic mannitol (Lumbers and Stevens 1983). By contrast, the
foetus appears to be protected from both a high maternal salt intake (0.17M NaCl) and
Chapter One Introduction and Literature Review
23
moderate salt depletion (Stevens and Lumbers 1986). This protection is probably largely
because of the efficiency of maternal homeostatic mechanisms. However, if the mother has
renal disease these homeostatic mechanisms may be impaired. Therefore if the pregnant ewe
has a salt load, it may not be the salt that directly affects foetal growth and development, but
rather the effect that the salt has on the mother, i.e. if the dam can’t maintain homeostasis due
to a loss in kidney function or a malfunction in the RAS, this is likely to affect the foetus
predisposing it to high blood pressure, or impairing its ability to excrete or reabsorb salt and
water.
The adaptations that the foetus makes to its pattern of growth to survive adverse nutritional
conditions in utero may therefore program tissues for subsequent pathophysiology. Hence, the
availability of nutrients in utero and their metabolic fate in the foetus have important
implications for adult morbidity and mortality.
1.4.3 Foetal programming
There is growing evidence that prenatal events can have long-term postnatal consequences.
Studies with rats have found that adults exposed to high salt pre and/or postnatally have an
increased preference for salt and a change in RAS and blood pressure. Alves da Silva et al.
(2003) found that offspring exposed to 8% NaCl through gestation until weaning had
increased angiotensin II, high blood pressure and blood pressure that was less responsive to
salt intake. Arguelles et al. (1996) also found rats exposed in utero and perinatally to a high
salt environment increased angiotensin II sensitivity. This may have been the result of a
feedback mechanism in which angiotensin II receptors are up regulated in the foetus in
response to lower activity of the RAS in the mother (Arguelles et al. 1996; Butler et al. 2002).
Evidence by Mohamed and Phillips (2003) has shown that maternal high-salt intake does
effect foetal development with postnatal consequences. Their studies showed that calves from
cows that had received supplementary sodium during pregnancy had a higher appetite for
Chapter One Introduction and Literature Review
24
sodium, indicating that appetite regulation of the offspring could be entrained by the sodium
intake of the dam during late pregnancy. Similarly, Curtis et al. (2004) found results where
adult rats exposed to dietary NaCl and born to dams exposed to high NaCl during gestation
had a profound effect on NaCl intake, particularly on stimulated NaCl intake. Results showed
striking differences in the temporal patterns of water and salt solution intake in offspring from
dams that received 3% NaCl in their diet and that these rats drank less water for each unit of
NaCl consumed. It was concluded that early dietary NaCl manipulations had selected
consequences that occur despite unimpaired sodium regulation, and that taste driven
alterations in NaCl intake and the behavioural response to preabsorptive taste signals is
associated with NaCl (Curtis et al. 2004).
Smriga et al. (2002) also found that adult rats whose tongues were exposed to a NaCl-
enriched milk formula during 7-8 days of postnatal development had an increased acceptance
of salty and sweet solutions. However when exposed 14 -15 days of age the same results was
not observed, indicating that the time of taste exposure is important. Contreras and Kosten
(1983) hypothesise that the mechanisms behind the changes in offspring may be due to
changes in sensitivity of taste receptors and/or changes in salt and water balance. However, as
salt appetite can be increased by inducing extracellular dehydration (Nicolaidis et al. 1990)
during pregnancy, thus not exposing the dam or offspring to high-salt intakes, the RAS may
be the primary mechanism involved in the changes of the offspring.
There is evidence to suggest that similar postnatal effects would be found in sheep as in rats
exposed to high-salt diets during gestation. Wintour (2002) found that when sheep were
stressed in early pregnancy, through infusing the pregnant ewes with cortisol, their lambs had
stunted kidneys that predisposed them to high blood pressure as adults. Stress forces the cells
destined to form the kidney to mature too fast, giving the organ less time to grow, resulting in
Chapter One Introduction and Literature Review
25
animals that have only two thirds of the normal number of fluid-filtering units in their
kidneys. Over time, the inability of the kidney to expel water and salts efficiently may cause
blood pressure to rise. Hegarty et al. (2000) also found that cortisol infusions into foetuses
caused a physiological increase in plasma cortisol concentration in the foetus and this was
associated with an increase in systolic blood pressure as foetuses.
Chapter One Introduction and Literature Review
26
1.5 LONGER TERM POSTNATAL EFFECTS OF HIGH SALT DIETS
It is possible, as stated previously, that high-salt intake when the mother is pregnant could
lead to maternal hypertension, which can result in kidney damage and impairment of the
dam’s RAS. This, in turn, could possibly result in abnormal renal development and profound
changes in foetal development. This may then predispose the foetus to hypertension and
further complications after birth. A study by Bogdarina et al. (2007) showed a direct link
between maternal environmental factors that cause hypertension and epigenetic modification
of a gene promoter in the offspring. The exact mechanisms that underlie the alteration have
not yet been determined, however maternal undernutrition resulted in offspring with an
increased expression of the AT1b receptor mRNA and protein in the adrenal and an
undermethylated AT1b gene promoter, which control blood pressure. However, if the high
salt load does not induce hypertension during pregnancy, the increase in salt may predispose
the lamb to an increased preference to salt, thus influence their response to high-salt feeds
(such as saltbush). It may also increase the capacity to deal with high salt ingestion through
the renal adaptations originating during foetal development. Thus not only might the animal
prefer high-salt feeds, it may also be able to manage the high salt through more efficient
sodium excretion.
The general hypotheses of this thesis are:
1). High-salt diets during pregnancy will interfere with the ability to conceive and continue
pregnancy to term.
2.) The offspring will differ in responses to high salt ingestion and will have an increased
preference for salt.
CHAPTER TWO:
Physiological effects of high dietary salt
on pregnant ewes
Chapter Two Physiological effects of high dietary salt on pregnant ewes
27
2.1 INTRODUCTION
Pregnancy is characterised by sodium retention and increased extracellular volume both in
humans (Hytten and Klopper 1963) and in sheep (Davison 1974). These changes are mediated
by alterations in renal function and the renin-angiotensin system (RAS) (Blackburn 2003).
The specific mechanisms for water and sodium retention during pregnancy are unclear but are
important for the maintenance of the mother and growth of the foetus (Davison and
Lindheimer 1989). In humans, the maintenance of sodium balance during pregnancy is related
to a balance between sodium-conserving factors such as increased renin, aldosterone and
oestrogen and sodium excretion factors such as increased glomerular filtration rate,
vasodilating prostaglandins and progesterone (Blackburn 2003). The sequence of events
involves an increase in sodium retention and plasma osmolality due to an increase in
oestrogen. This change is detected by osmoreceptors that signal to the pituitary gland to
increase AVP (Blackburn 2003). Water excretion is consequently decreased and water
retention is increased. The osmolality threshold for the release of AVP is reset during
pregnancy causing an increase in extracellular volume at a lower plasma osmolality
(Lindheimer et al. 1987). However, other studies (Durr et al. 1981; Olsson et al. 1982;
Davison et al. 1984) suggest that there is considerable species variation in the effect of
pregnancy on plasma osmolality and the concentration of AVP. Bell et al. (1986) found that
pregnant ewes do not have an altered AVP concentration or plasma osmolality.
High salt consumption leads to an increase in plasma osmolality that induces an AVP
response similar to that which has been reported (Blackburn 2003) to occur in pregnant
humans. However, an increase in plasma osmolality in this case also has a negative feed back
on the RAS, decreasing aldosterone release and therefore decreasing sodium retention and
increasing sodium excretion. High salt consumption is also associated with an increase in
water intake (Wilson and Hindley 1968; Meintjes and Olivier 1992) due to changes in
osmolality detected in the thirst centre located in the hypothalamus.
Chapter Two Physiological effects of high dietary salt on pregnant ewes
28
Therefore, the challenge of dealing with a high-salt diet may be exacerbated during pregnancy
since pregnancy is a salt-retaining physiological state, yet a high salt intake requires an
increase in mechanisms to excrete salt. Thus pregnancy and high salt consumption require
opposing physiological responses to regulate sodium retention. It is not clear how pregnant
ewes resolve this apparent conflict. The aim of this experiment was to determine if ewes fed a
high-salt diet could conceive, continue pregnancy to term and avoid hypertension. It also
investigated how pregnant ewes fed a high-salt diet manage the potential physiological
conflict of salt retention for pregnancy and salt excretion for the overload of salt, through the
hormones involved in the RAS.
Chapter Two Physiological effects of high dietary salt on pregnant ewes
29
2.2 MATERIALS AND METHODS
2.2.1 Experimental Design
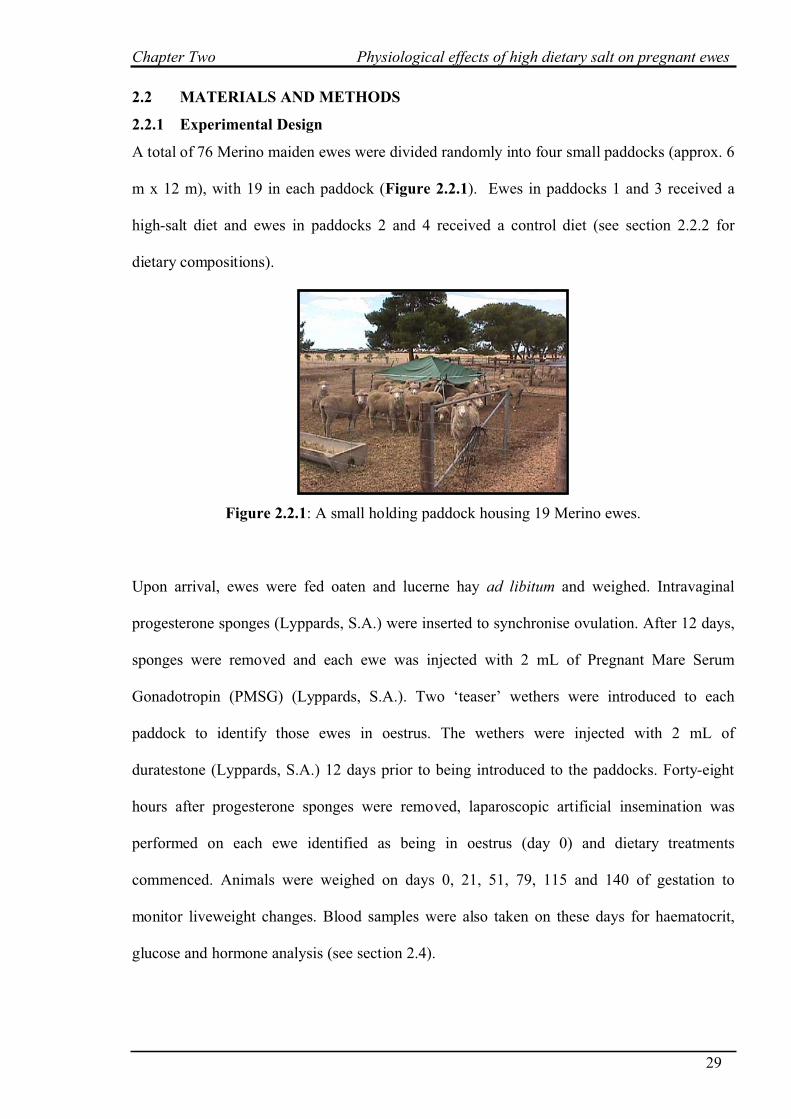
A total of 76 Merino maiden ewes were divided randomly into four small paddocks (approx. 6
m x 12 m), with 19 in each paddock (Figure 2.2.1). Ewes in paddocks 1 and 3 received a
high-salt diet and ewes in paddocks 2 and 4 received a control diet (see section 2.2.2 for
dietary compositions).
Figure 2.2.1: A small holding paddock housing 19 Merino ewes.
Upon arrival, ewes were fed oaten and lucerne hay ad libitum and weighed. Intravaginal
progesterone sponges (Lyppards, S.A.) were inserted to synchronise ovulation. After 12 days,
sponges were removed and each ewe was injected with 2 mL of Pregnant Mare Serum
Gonadotropin (PMSG) (Lyppards, S.A.). Two ‘teaser’ wethers were introduced to each
paddock to identify those ewes in oestrus. The wethers were injected with 2 mL of
duratestone (Lyppards, S.A.) 12 days prior to being introduced to the paddocks. Forty-eight
hours after progesterone sponges were removed, laparoscopic artificial insemination was
performed on each ewe identified as being in oestrus (day 0) and dietary treatments
commenced. Animals were weighed on days 0, 21, 51, 79, 115 and 140 of gestation to
monitor liveweight changes. Blood samples were also taken on these days for haematocrit,
glucose and hormone analysis (see section 2.4).
Chapter Two Physiological effects of high dietary salt on pregnant ewes
30
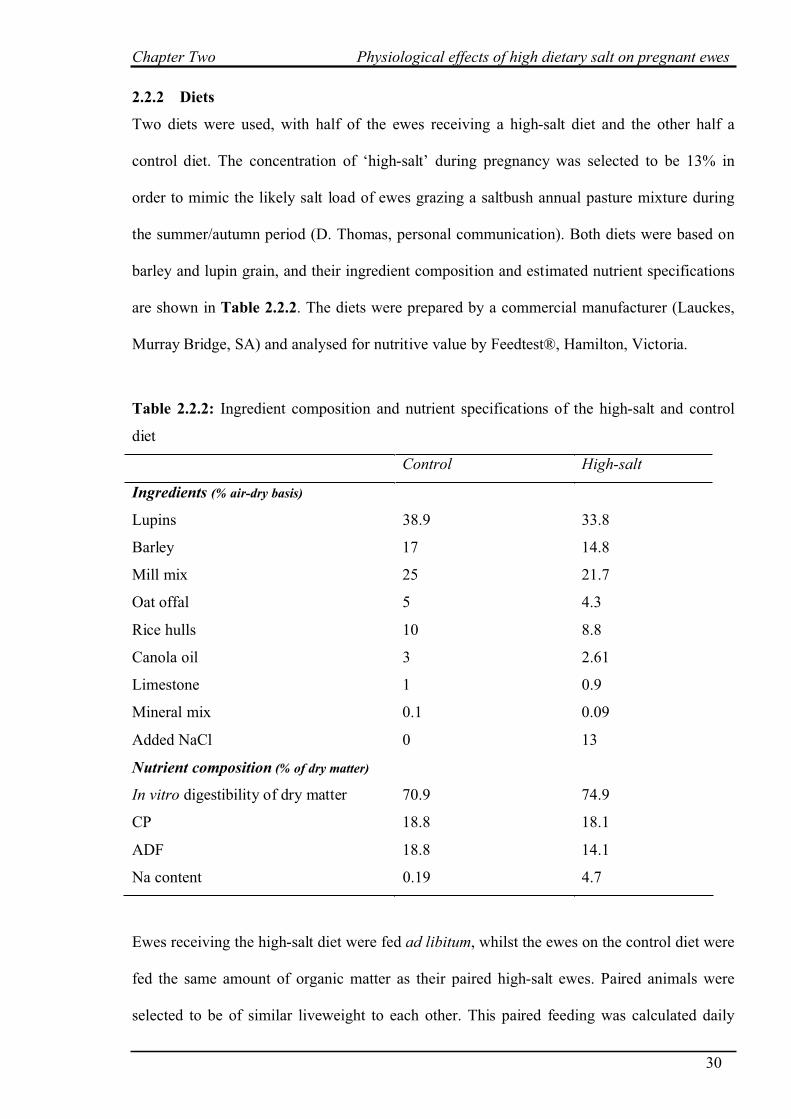
2.2.2 Diets
Two diets were used, with half of the ewes receiving a high-salt diet and the other half a
control diet. The concentration of ‘high-salt’ during pregnancy was selected to be 13% in
order to mimic the likely salt load of ewes grazing a saltbush annual pasture mixture during
the summer/autumn period (D. Thomas, personal communication). Both diets were based on
barley and lupin grain, and their ingredient composition and estimated nutrient specifications
are shown in Table 2.2.2. The diets were prepared by a commercial manufacturer (Lauckes,
Murray Bridge, SA) and analysed for nutritive value by Feedtest®, Hamilton, Victoria.
Table 2.2.2: Ingredient composition and nutrient specifications of the high-salt and control
diet
Control High-salt
Ingredients (% air-dry basis)
Lupins 38.9 33.8
Barley 17 14.8
Mill mix 25 21.7
Oat offal 5 4.3
Rice hulls 10 8.8
Canola oil 3 2.61
Limestone 1 0.9
Mineral mix 0.1 0.09
Added NaCl 0 13
Nutrient composition (% of dry matter)
In vitro digestibility of dry matter 70.9 74.9
CP 18.8 18.1
ADF 18.8 14.1
Na content 0.19 4.7
Ewes receiving the high-salt diet were fed ad libitum, whilst the ewes on the control diet were
fed the same amount of organic matter as their paired high-salt ewes. Paired animals were
selected to be of similar liveweight to each other. This paired feeding was calculated daily
Chapter Two Physiological effects of high dietary salt on pregnant ewes
31
with the organic matter intake of high-salt ewes on day ‘n’ being fed to paired control ewes on
day ‘n+1’. From day 0 to day 45 (ultrasound scanning) ewes were paired fed on a group basis
of similar average liveweight. From day 45 through to parturition, each ewe fed the control
diet was paired with a ewe of similar liveweight fed the high-salt diet.
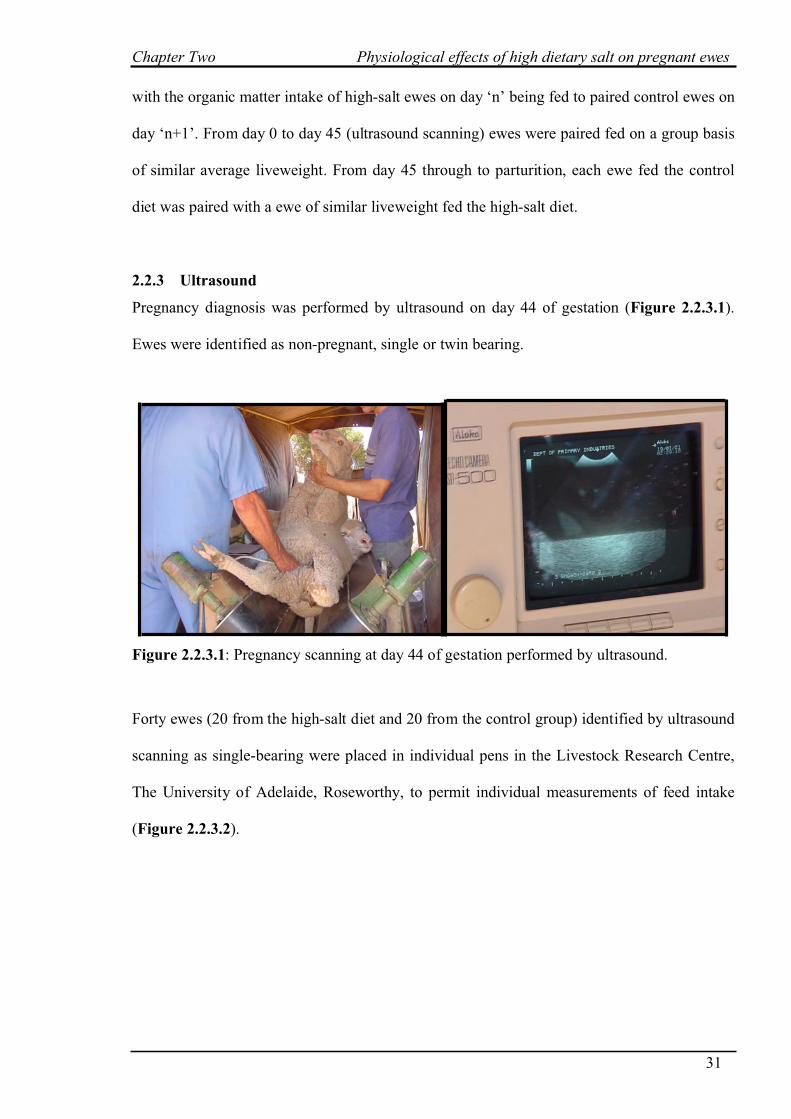
2.2.3 Ultrasound
Pregnancy diagnosis was performed by ultrasound on day 44 of gestation (Figure 2.2.3.1).
Ewes were identified as non-pregnant, single or twin bearing.
Figure 2.2.3.1: Pregnancy scanning at day 44 of gestation performed by ultrasound.
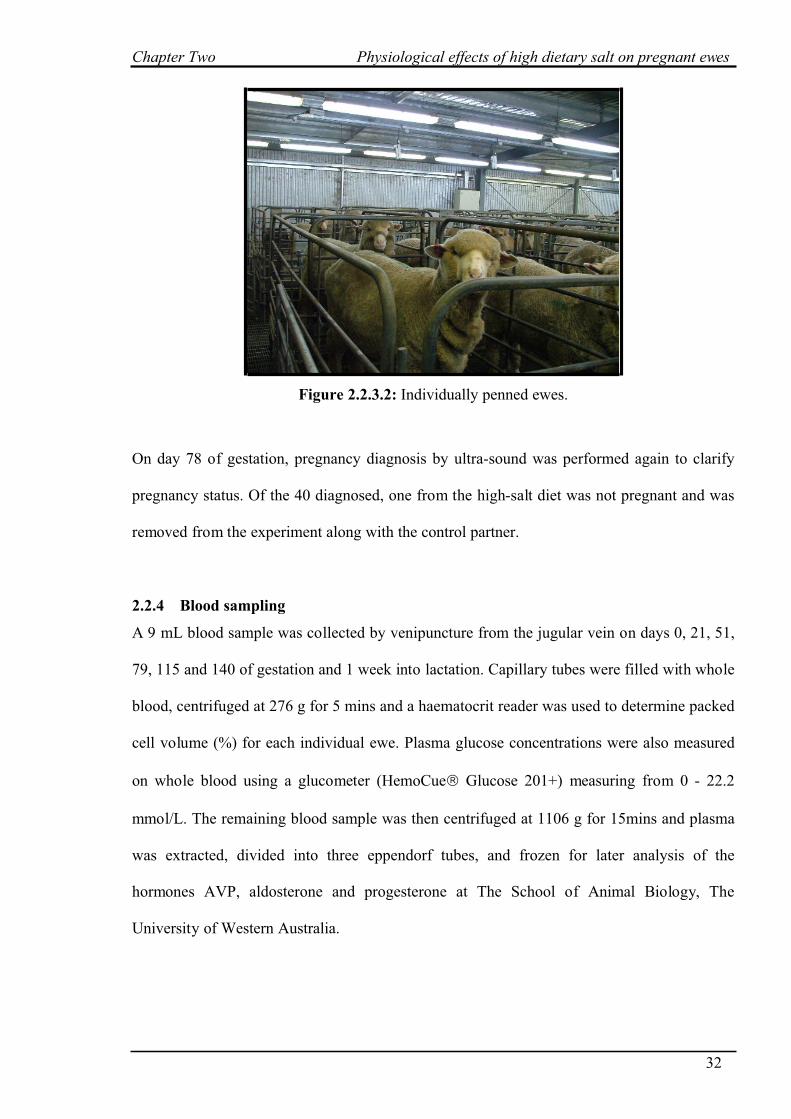
Forty ewes (20 from the high-salt diet and 20 from the control group) identified by ultrasound
scanning as single-bearing were placed in individual pens in the Livestock Research Centre,
The University of Adelaide, Roseworthy, to permit individual measurements of feed intake
(Figure 2.2.3.2).
Chapter Two Physiological effects of high dietary salt on pregnant ewes
32
Figure 2.2.3.2: Individually penned ewes.
On day 78 of gestation, pregnancy diagnosis by ultra-sound was performed again to clarify
pregnancy status. Of the 40 diagnosed, one from the high-salt diet was not pregnant and was
removed from the experiment along with the control partner.
2.2.4 Blood sampling
A 9 mL blood sample was collected by venipuncture from the jugular vein on days 0, 21, 51,
79, 115 and 140 of gestation and 1 week into lactation. Capillary tubes were filled with whole
blood, centrifuged at 276 g for 5 mins and a haematocrit reader was used to determine packed
cell volume (%) for each individual ewe. Plasma glucose concentrations were also measured
on whole blood using a glucometer (HemoCue® Glucose 201+) measuring from 0 - 22.2
mmol/L. The remaining blood sample was then centrifuged at 1106 g for 15mins and plasma
was extracted, divided into three eppendorf tubes, and frozen for later analysis of the
hormones AVP, aldosterone and progesterone at The School of Animal Biology, The
University of Western Australia.
Chapter Two Physiological effects of high dietary salt on pregnant ewes
33
2.2.4.1 Progesterone assay
The concentration of plasma progesterone was measured using a double antibody
radioimmunoassay after extraction with hexane as described by Gales et al. (1997).
Buffers:
0.1M phosphate
1.226% NA2HPO4, 0.212% NAH2PO4.2H2O, 0.10% sodium azide, pH 7.5.
Phosphate buffered saline (PBS)
0.01 M phosphate, 0.15 M sodium chloride, 0.1% sodium azide, pH 7.5
Buffer 2
PBS, 0.1% bovine serum albumin (BSA, Fraction V, Sigma), pH 7.5
Buffer 3
PBS, 0.1% BSA, 0.05M EDTA and normal rabbit serum (NRS), pH 7.5
Buffer 4
PBS, 0.001 M EDTA, 1% BSA, pH 7.5
Extraction:
Two mL of distilled hexane were added to 100 µL duplicate aliquots of plasma and pools in
disposable glass tubes of 12 x 75 mm. The tubes were then vortexed for 5 minutes and placed
in a dry ice/acetone bath for a few minutes. The hexane was poured off into 10 x 75 mm
disposable glass assay tubes and dried under a stream of compressed air at 37°C. The
recovery of progesterone from plasma was determined by adding labelled steroid to pooled
samples, incubating them for 60 min at 37°C, and then extracting.
Standards:
Powdered progesterone (Sigma Australia) dissolved in ethanol was used to prepare the
standards by serial dilution to the following concentrations: 32, 16, 8, 4, 2, 1, 0.5, 0.25 0.125,
Chapter Two Physiological effects of high dietary salt on pregnant ewes
34
0.0625, 0.03125 ng/mL which were dried under compressed air after adding 2 mL of distilled
hexane.
Antiserum:
The antibody (GT1) was raised in a rabbit against progesterone -11α-carboxymethyloxime-
human serum albumin and the major cross-reactions with deoxycorticosterone (2% w/v) and
20α-OH progesterone, 17β-OH progesterone, 17α-OH progesterone and allopregnenolone
were all <1%.
Tracer:
[1,2,6,7-3
H](N)-progesterone (Amersham) was diluted in Buffer 3 to give approximately
20,000 cpm/100 µL
Assay procedure:
The assay included 6 replicates of three quality controls pools. On the first day, 200 µL of
antiserum at 1:12.000 in buffer 2 were added to the extraction samples and standard tubes but
not to those for total counts (TC) and non specific binding (NSB). They were vortexed and
left overnight at 4°C. On the second day, 100 µL labelled progesterone was added to all tubes,
which were incubated for a further 24h at 4°C prior to the addition of 100 µL of second
antibody (Donkey 5, Batch1) 1:7 in PBS. The tubes were vortexed and incubated overnight at
4°C. On the fourth day, 1mL of 2% polyethylene glycol 6000 in PBS was added to all tubes,
except TC, and centrifuged at 3000 g for 25 min at 4°C, and the supernatant was aspirated.
The precipitate was dissolved in 0.5 mL of 0.05M HCl. The dissolved pellet was aspirated
from assay tubes and dispensed into scintillation vials with 2 mL scintillation fluid (Starcint,
Packard). Vials were shaken and left to stand for one hour before counting for 3 minutes in a
Chapter Two Physiological effects of high dietary salt on pregnant ewes
35
beta counter (Packard Tri Carb 1500). The Intra-assay variation was 6.7% at 1.03 ng/mL,
5.3% at 2.18 ng/mL and 5.2% at 4.10 ng/mL. The limit of detection was 0.10 ng/mL.
2.2.4.2 AVP assay
The concentration of plasma AVP was measured using a double antibody radioimmunoassay
from The University of W.A.
Iodination:
Arginine vasopressin (Sigma Australia) was dissolved in 0.2 M Acetic acid to a concentration
of 0.1 mg/mL. Aliquots of 2 µg/20 µL was stored at -80oC. Arginine vasopressin is not stable
in buffer.
To a 2 µg aliquot 20 µL 0.5M phosphate was added followed by 5 µL 125
I and then 5 µL
chloramine T (5 mg/10 mLs in 0.5M phosphate) and incubated for 20 seconds with mixing.
Finally 100 µL 25% BSA was added and the solution was then added to 3 mL plastic tubes
containing 150 mg Dowex 2-2x 8–5 and 1 mL H2O and inverted constantly for 10 minutes.
During this time 500 µL NRS was added to G25 column and allowed to run in to the top of
the column. The liquid from the tube containing Dowex was added to the column and 1 mL
fractions were collected. The peak fractions were pooled and run through a second G25
column also with NRS. Peak fractions were again pooled and stored at 4oC.
Extraction:
C18 sep-Pak cartridges were pre wet with 5 mL methanol and then washed with 10 mLs
DDW. One mL of plasma was acidified by adding 0.1 mL 1M HCL and the sample was
loaded into 1 mL syringe and run into the cartridge over the course of a minute. The cartridge
was rinsed with 2 x 10 mL of 4% acetic acid. Elute with 4.5 mLs 75% aqueous acetonitrile
Chapter Two Physiological effects of high dietary salt on pregnant ewes
36
with 25% of 4% acetic acid into glass extraction tubes. The elute was evaporated to dryness at
37oC under compressed air and reconstituted in 500 µL of buffer #1. 200 µL/tube in assay
(400 µL of plasma) was used. To reuse sep-Pak flush between extractions with 5 mL 8M Urea
followed by 10 mL distilled water prior to methanol wash.
Assay:
200 µL of extract was added in duplicate to plastic assay tubes and then 100 µL buffer #1 and
100 µL buffer #2 was added. Standards ranging from 0.63 pg/mL – 320 pg/mL (stable for 2
weeks only) were assayed in triplicate. The standards were made in buffer #2 100 µL/tube and
300 µL buffer #1 was also added. To the extract in plastic assay tubes 50 µL of the 1st
antibody diluted 1 in 30K in buffer #1 was added and incubated overnight at 4oC. Then 50 µL
of tracer diluted to 5000 cpm in buffer #1 was added and incubated overnight at 4oC. 100 µL
of the 2nd Antibody diluted 1 in 15 in buffer #1 containing 1 in 800 normal rabbit serum was
added followed by 500 µL of 10% PEG and incubated overnight at 4oC. The solution was
then spun at 2000 g for 25 minutes and the supernatant was aspirated and counted.
The first antibody was purchased from Fitzgerald Industries International (USA); it had been
raised in a rabbit using arginine vasopressin-thyroglobulin as the immunogen. The antibody
reacts with rat, mouse, human, sheep and rabbit and has less than 1% reactivity to oxytocin.
The intra-assay coefficient of variation for AVP concentration was 4.90% and the inter-assay
coefficient was 5.02%. The limit of detection was 1.7pg/mL.
2.2.4.3 Aldosterone assay
The concentration of plasma aldosterone was measured using a radioimmunoassay described
previously by James and Wilson (1976) and modified at The University of Western Australia.
Chapter Two Physiological effects of high dietary salt on pregnant ewes
37
Assay buffer:
Phosphate buffered saline (PBS): 1 litre 0.1 M stock phosphate buffer; 0.14 M sodium
chloride (89 g); 0.1% sodium azide (10 g); double distilled water to 10 litres (pH 7.5). 0.1 M
stock phosphate buffer: 61.3 g Na2HPO4 + 10.6 g NaH2PO4.2H2O + 5 g sodium azide,
dissolved in 5 litres of double distilled water (pH7.5). Gelatin phosphate buffer (GPB): PBS
with 0.1% gelatin (pH 7.5).
Tracer:
The tracer (1,2,6,7-)3H-aldosterone (Amersham) was diluted to give 10,000 dpm per 100 µL.
Charcoal:
Charcoal solution was made 24 hours before use with 3 g of activated charcoal, 0.3 g of
dextran and 300 mL of GPB. The solution was mixed thoroughly for 1hr prior to use.
Aldosterone Standards:
A stock solution of aldosterone (Sigma Aust) was prepared in ethanol 100 ng/mL. Standards
were made by serial dilution to concentrations of 5, 2.5, 1.25, 0.625, 0.312, 0.156, 0.078,
0.039, 0.0195, 0.0095 and 0.0047 ng/mL in ethanol.
Antiserum:
The antiserum (rabbit) was raised against aldosterone-3-BSA and was purchased from
Fitzgerald Industries International (USA). The antisera cross reactivity was 1.1% with11-
deoxycorticosterone, 0.01% with testosterone and less than 0.001% with estradiol, 11-
deoxycortisol, androsterone, 21-deoxycortisol, estriol, cortisone, estrone and
dihydrotesterone.
Chapter Two Physiological effects of high dietary salt on pregnant ewes
38
Assay method:
0.2 mL of sample was added to glass test tubes (12 x 75 mm) and the aldosterone was
extracted using 2 mL dichloromethane (AR) by vortexing for 5 minutes and the tubes were
placed in a dry ice/acetone bath to freeze the plasma layer. The solvent containing the
aldosterone was poured off into 10 x 75 mm disposable glass assay tubes and dried under a
stream of compressed air at 37°C. The recovery of aldosterone from plasma was determined
by adding labelled steroid to pooled samples incubating them for 60 min at 37°C and then
extracting. The efficiency was greater than 95% and solvent blank read less than the minimum
standard. 100 µL of standards in triplicate were also extracted.
The dried extracts were reconstituted in 200 µL PBS + 0.5% BSA and 100 µL 1st antibody
was added at 1:30,000 dilution followed by 100 µL of tracer (approx 10,000 dpm/tube) which
was also diluted in PBS + 0.5% BSA. The tubes were incubated at 4oC for 48 hours and then
200 µL cold Dextran coated charcoal (1%) made in GPB was added. The tubes were
incubated at 4oC for 20 minutes and then spun for 10 minutes at 4
oC. The supernatant was
removed and dispensed into counting vials with 2 mL of scintillant (Starcint, Packard
Chemical Operations). Vials were capped, shaken and allowed to stand for 1 hour before
counting in a liquid scintillation counter (Packard Tri Carb 1500) for 3 minutes.
The intra-assay coefficient of variation for aldosterone concentration 6.60% and the inter-
assay coefficient was 4.91%. The limit of detection was 1.7 pg/mL .
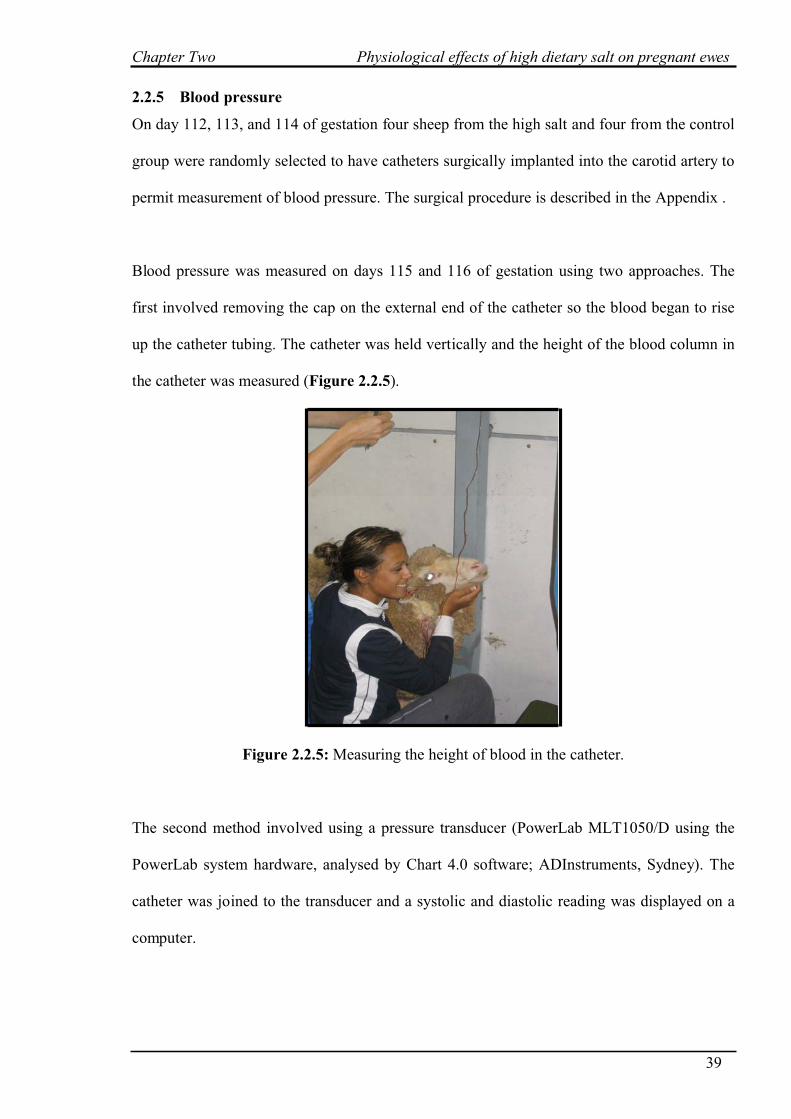
Chapter Two Physiological effects of high dietary salt on pregnant ewes
39
2.2.5 Blood pressure
On day 112, 113, and 114 of gestation four sheep from the high salt and four from the control
group were randomly selected to have catheters surgically implanted into the carotid artery to
permit measurement of blood pressure. The surgical procedure is described in the Appendix .
Blood pressure was measured on days 115 and 116 of gestation using two approaches. The
first involved removing the cap on the external end of the catheter so the blood began to rise
up the catheter tubing. The catheter was held vertically and the height of the blood column in
the catheter was measured (Figure 2.2.5).
Figure 2.2.5: Measuring the height of blood in the catheter.
The second method involved using a pressure transducer (PowerLab MLT1050/D using the
PowerLab system hardware, analysed by Chart 4.0 software; ADInstruments, Sydney). The
catheter was joined to the transducer and a systolic and diastolic reading was displayed on a
computer.
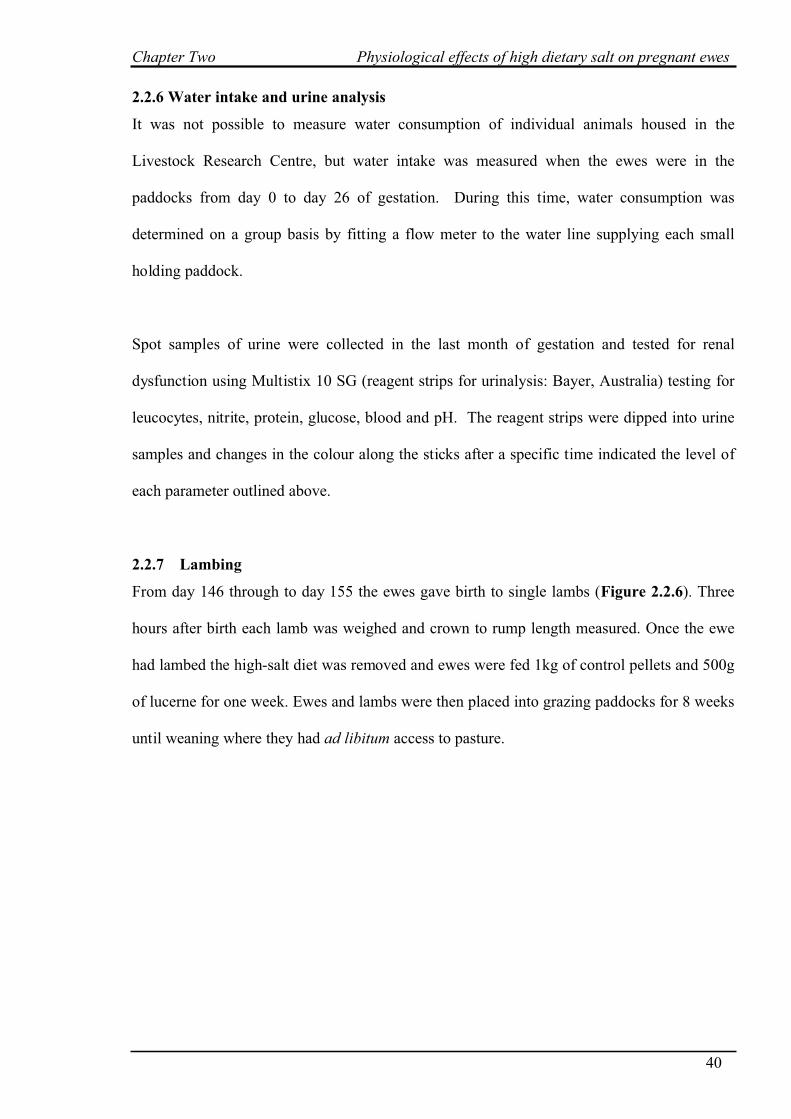
Chapter Two Physiological effects of high dietary salt on pregnant ewes
40
2.2.6 Water intake and urine analysis
It was not possible to measure water consumption of individual animals housed in the
Livestock Research Centre, but water intake was measured when the ewes were in the
paddocks from day 0 to day 26 of gestation. During this time, water consumption was
determined on a group basis by fitting a flow meter to the water line supplying each small
holding paddock.
Spot samples of urine were collected in the last month of gestation and tested for renal
dysfunction using Multistix 10 SG (reagent strips for urinalysis: Bayer, Australia) testing for
leucocytes, nitrite, protein, glucose, blood and pH. The reagent strips were dipped into urine
samples and changes in the colour along the sticks after a specific time indicated the level of
each parameter outlined above.
2.2.7 Lambing
From day 146 through to day 155 the ewes gave birth to single lambs (Figure 2.2.6). Three
hours after birth each lamb was weighed and crown to rump length measured. Once the ewe
had lambed the high-salt diet was removed and ewes were fed 1kg of control pellets and 500g
of lucerne for one week. Ewes and lambs were then placed into grazing paddocks for 8 weeks
until weaning where they had ad libitum access to pasture.
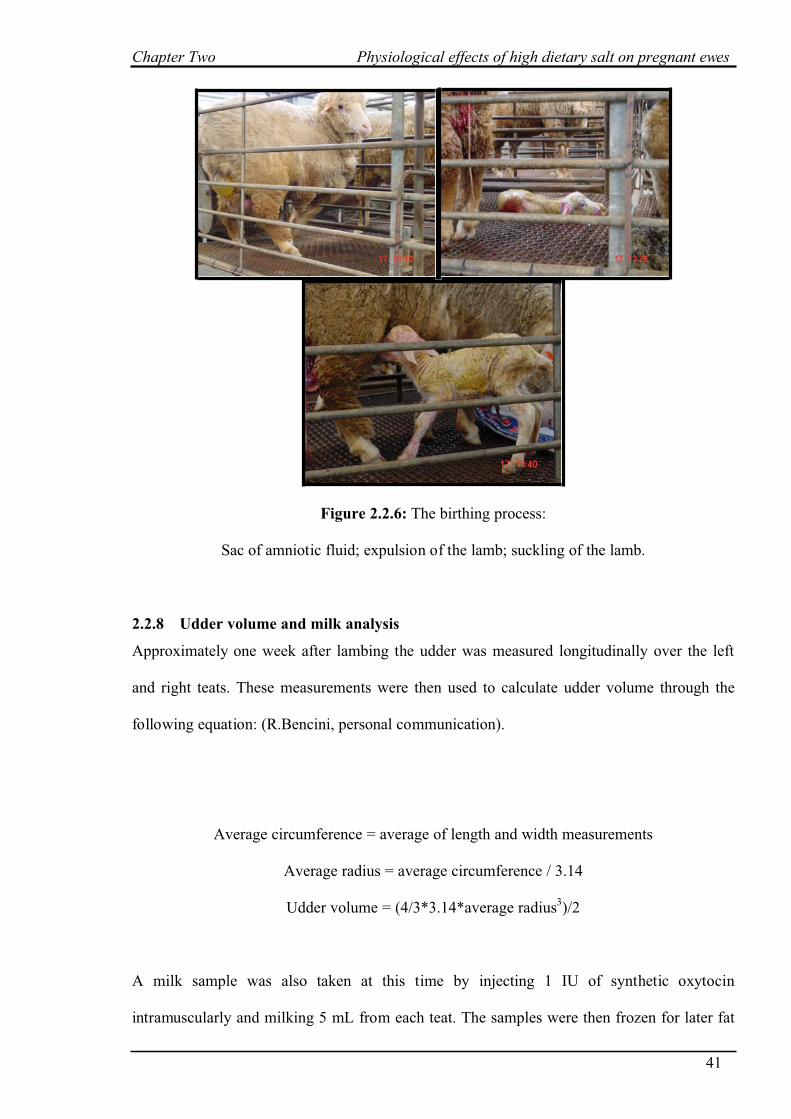
Chapter Two Physiological effects of high dietary salt on pregnant ewes
41
Figure 2.2.6: The birthing process:
Sac of amniotic fluid; expulsion of the lamb; suckling of the lamb.
2.2.8 Udder volume and milk analysis
Approximately one week after lambing the udder was measured longitudinally over the left
and right teats. These measurements were then used to calculate udder volume through the
following equation: (R.Bencini, personal communication).
Average circumference = average of length and width measurements
Average radius = average circumference / 3.14
Udder volume = (4/3*3.14*average radius3)/2
A milk sample was also taken at this time by injecting 1 IU of synthetic oxytocin
intramuscularly and milking 5 mL from each teat. The samples were then frozen for later fat
Chapter Two Physiological effects of high dietary salt on pregnant ewes
42
and protein analysis. Samples of milk were analysed with a Milko Scan 133 (Foss Electric,
Denmark) calibrated for sheep as described by Bencini (1999).
2.2.9 Statistical Analysis
The data were analysed using Genstat 8th
Edition. The analysis performed on pregnancy rates
was an analysis of variance. The analysis performed on hormone data, liveweight, feed intake,
water intake and lambing was a repeated measures analysis of variance, using conservative F-
tests, with the data transformed to better approximate the assumption of equal variance:
AVP concentration - log transformed
Aldosterone concentration - log transformed
Progesterone concentration – transformed to the fourth root. One outlier and
replaced with a missing value.
2.2.10 Ethics
The University of Adelaide’s Animal Ethics Committee approved the experiment. Approval
Number: W-28-2003
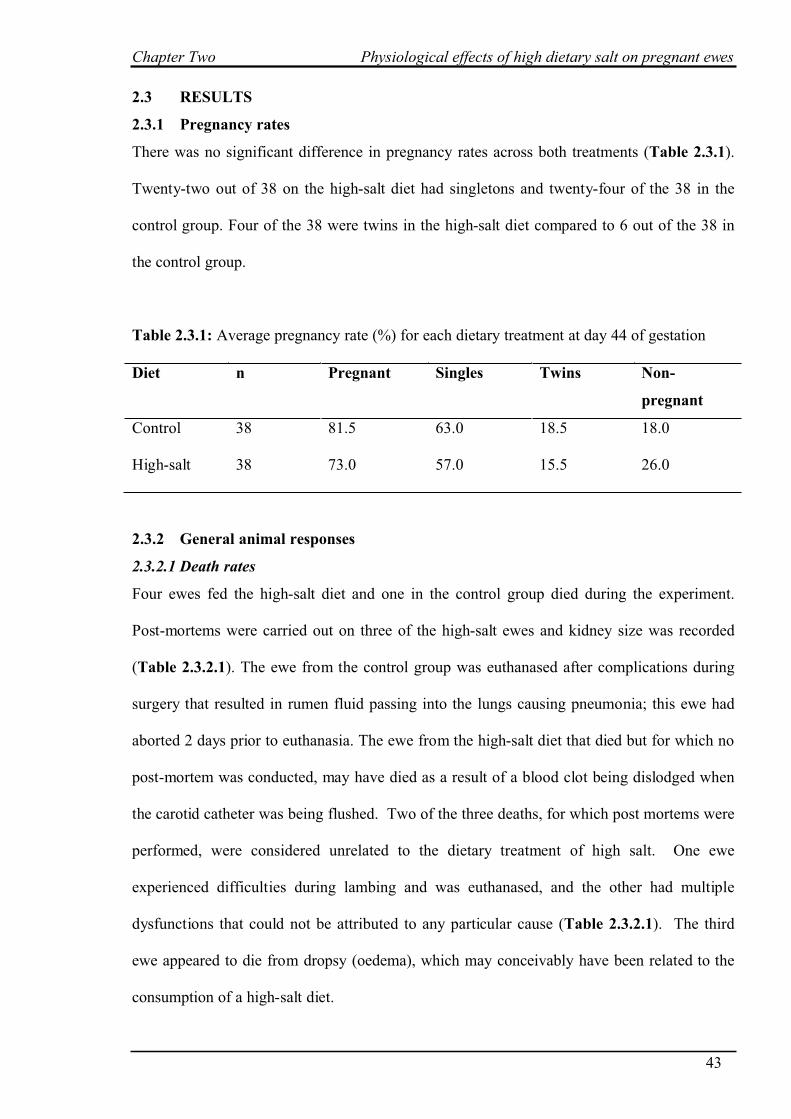
Chapter Two Physiological effects of high dietary salt on pregnant ewes
43
2.3 RESULTS
2.3.1 Pregnancy rates
There was no significant difference in pregnancy rates across both treatments (Table 2.3.1).
Twenty-two out of 38 on the high-salt diet had singletons and twenty-four of the 38 in the
control group. Four of the 38 were twins in the high-salt diet compared to 6 out of the 38 in
the control group.
Table 2.3.1: Average pregnancy rate (%) for each dietary treatment at day 44 of gestation
Diet n Pregnant Singles Twins Non-
pregnant
Control 38 81.5 63.0 18.5 18.0
High-salt 38 73.0 57.0 15.5 26.0
2.3.2 General animal responses
2.3.2.1 Death rates
Four ewes fed the high-salt diet and one in the control group died during the experiment.
Post-mortems were carried out on three of the high-salt ewes and kidney size was recorded
(Table 2.3.2.1). The ewe from the control group was euthanased after complications during
surgery that resulted in rumen fluid passing into the lungs causing pneumonia; this ewe had
aborted 2 days prior to euthanasia. The ewe from the high-salt diet that died but for which no
post-mortem was conducted, may have died as a result of a blood clot being dislodged when
the carotid catheter was being flushed. Two of the three deaths, for which post mortems were
performed, were considered unrelated to the dietary treatment of high salt. One ewe
experienced difficulties during lambing and was euthanased, and the other had multiple
dysfunctions that could not be attributed to any particular cause (Table 2.3.2.1). The third
ewe appeared to die from dropsy (oedema), which may conceivably have been related to the
consumption of a high-salt diet.
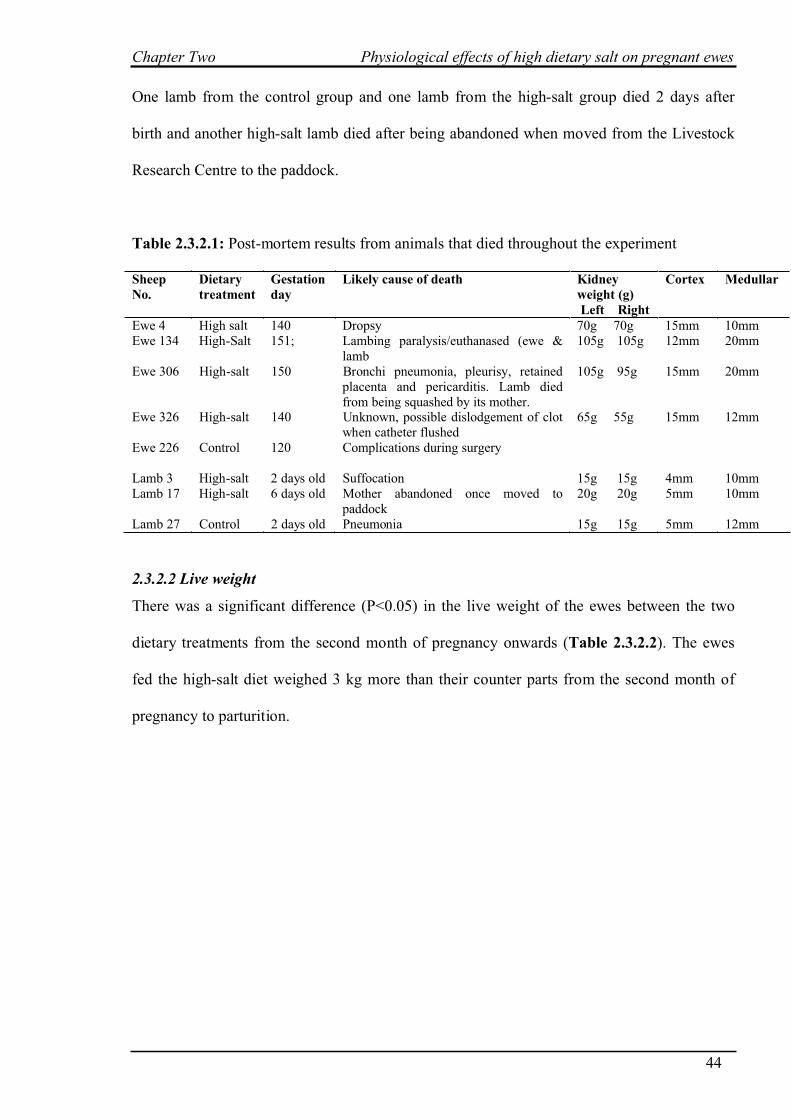
Chapter Two Physiological effects of high dietary salt on pregnant ewes
44
One lamb from the control group and one lamb from the high-salt group died 2 days after
birth and another high-salt lamb died after being abandoned when moved from the Livestock
Research Centre to the paddock.
Table 2.3.2.1: Post-mortem results from animals that died throughout the experiment
Sheep
No.
Dietary
treatment
Gestation
day
Likely cause of death Kidney
weight (g)
Left Right
Cortex Medullar
Ewe 4 High salt 140 Dropsy 70g 70g 15mm 10mm
Ewe 134 High-Salt 151; Lambing paralysis/euthanased (ewe &
lamb
105g 105g 12mm 20mm
Ewe 306 High-salt 150 Bronchi pneumonia, pleurisy, retained
placenta and pericarditis. Lamb died
from being squashed by its mother.
105g 95g 15mm 20mm
Ewe 326 High-salt 140 Unknown, possible dislodgement of clot
when catheter flushed
65g 55g 15mm 12mm
Ewe 226 Control 120 Complications during surgery
Lamb 3 High-salt 2 days old Suffocation 15g 15g 4mm 10mm
Lamb 17 High-salt 6 days old Mother abandoned once moved to
paddock
20g 20g 5mm 10mm
Lamb 27 Control 2 days old Pneumonia 15g 15g 5mm 12mm
2.3.2.2 Live weight
There was a significant difference (P<0.05) in the live weight of the ewes between the two
dietary treatments from the second month of pregnancy onwards (Table 2.3.2.2). The ewes
fed the high-salt diet weighed 3 kg more than their counter parts from the second month of
pregnancy to parturition.
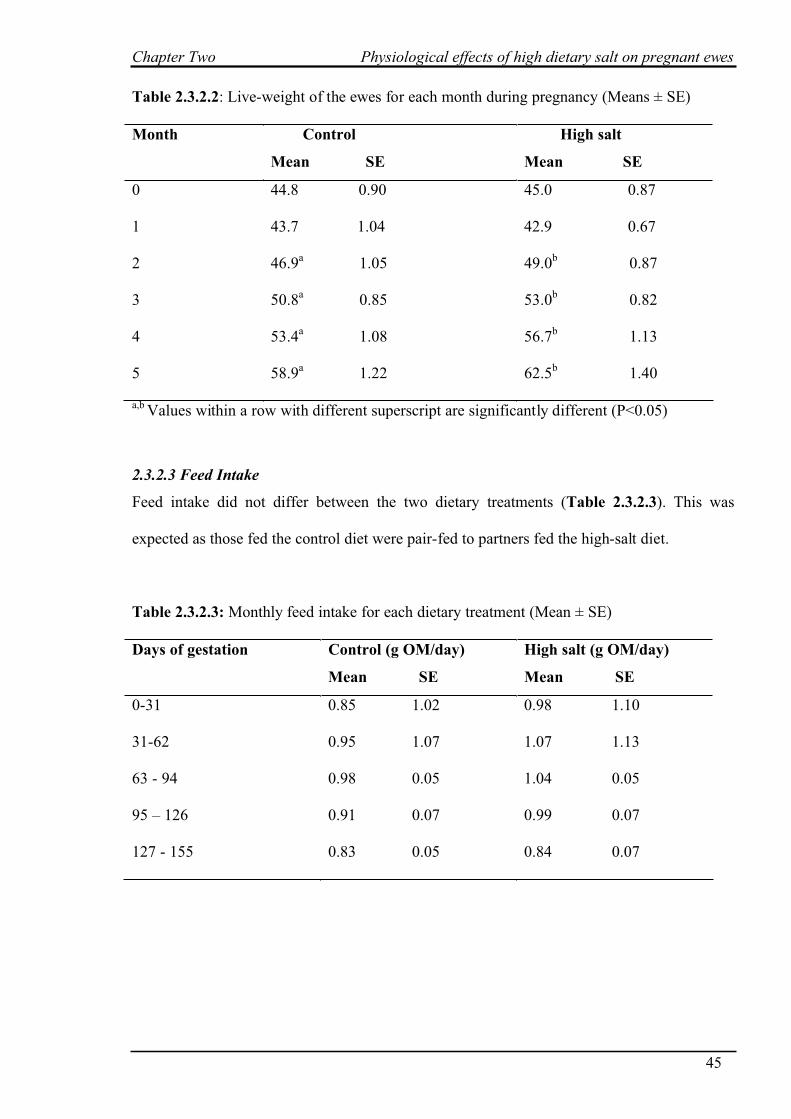
Chapter Two Physiological effects of high dietary salt on pregnant ewes
45
Table 2.3.2.2: Live-weight of the ewes for each month during pregnancy (Means ± SE)
Month Control
Mean SE
High salt
Mean SE
0 44.8 0.90 45.0 0.87
1 43.7 1.04 42.9 0.67
2 46.9a
1.05 49.0b
0.87
3 50.8a
0.85 53.0b
0.82
4 53.4a
1.08 56.7b
1.13
5 58.9a
1.22 62.5b
1.40
a,b Values within a row with different superscript are significantly different (P<0.05)
2.3.2.3 Feed Intake
Feed intake did not differ between the two dietary treatments (Table 2.3.2.3). This was
expected as those fed the control diet were pair-fed to partners fed the high-salt diet.
Table 2.3.2.3: Monthly feed intake for each dietary treatment (Mean ± SE)
Days of gestation Control (g OM/day)
Mean SE
High salt (g OM/day)
Mean SE
0-31 0.85 1.02 0.98 1.10
31-62 0.95 1.07 1.07 1.13
63 - 94 0.98 0.05 1.04 0.05
95 – 126 0.91 0.07 0.99 0.07
127 - 155 0.83 0.05 0.84 0.07
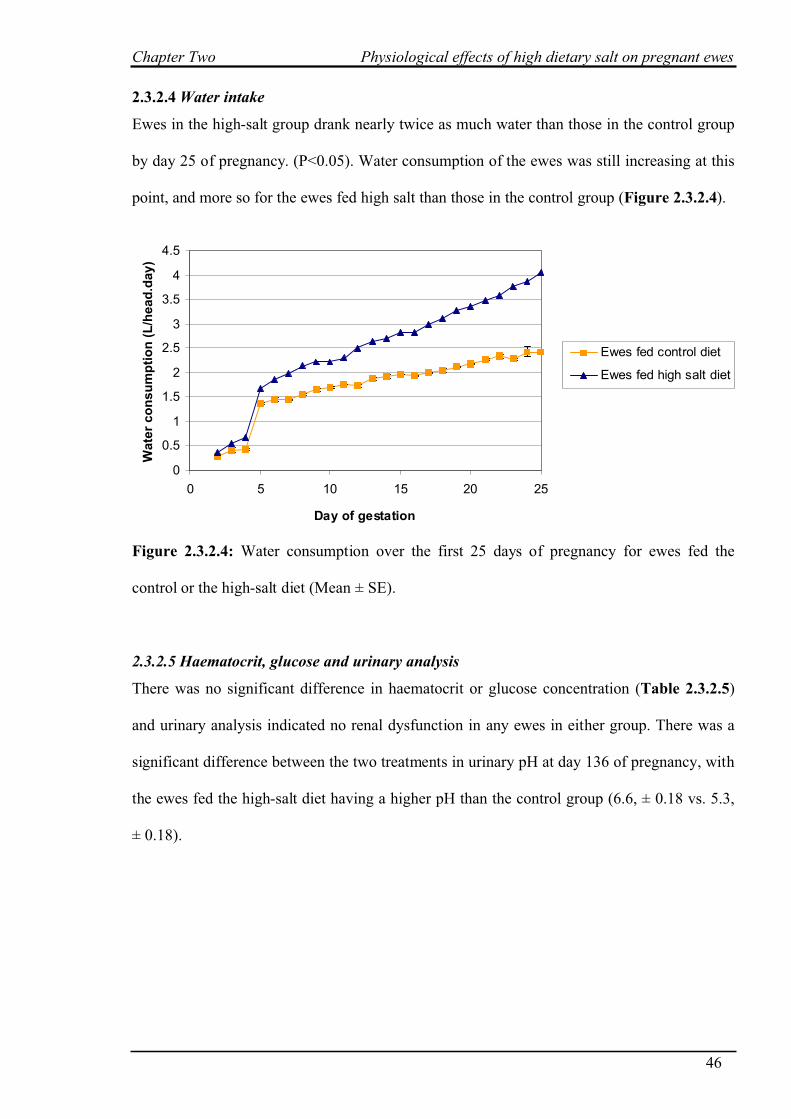
Chapter Two Physiological effects of high dietary salt on pregnant ewes
46
2.3.2.4 Water intake
Ewes in the high-salt group drank nearly twice as much water than those in the control group
by day 25 of pregnancy. (P<0.05). Water consumption of the ewes was still increasing at this
point, and more so for the ewes fed high salt than those in the control group (Figure 2.3.2.4).
0
0.5
1
1.5
2
2.5
3
3.5
4
4.5
0 5 10 15 20 25
Day of gestation
Wate
r co
nsu
mp
tio
n (
L/h
ead
.day)
Ewes fed control diet
Ewes fed high salt diet
Figure 2.3.2.4: Water consumption over the first 25 days of pregnancy for ewes fed the
control or the high-salt diet (Mean ± SE).
2.3.2.5 Haematocrit, glucose and urinary analysis
There was no significant difference in haematocrit or glucose concentration (Table 2.3.2.5)
and urinary analysis indicated no renal dysfunction in any ewes in either group. There was a
significant difference between the two treatments in urinary pH at day 136 of pregnancy, with
the ewes fed the high-salt diet having a higher pH than the control group (6.6, ± 0.18 vs. 5.3,
± 0.18).
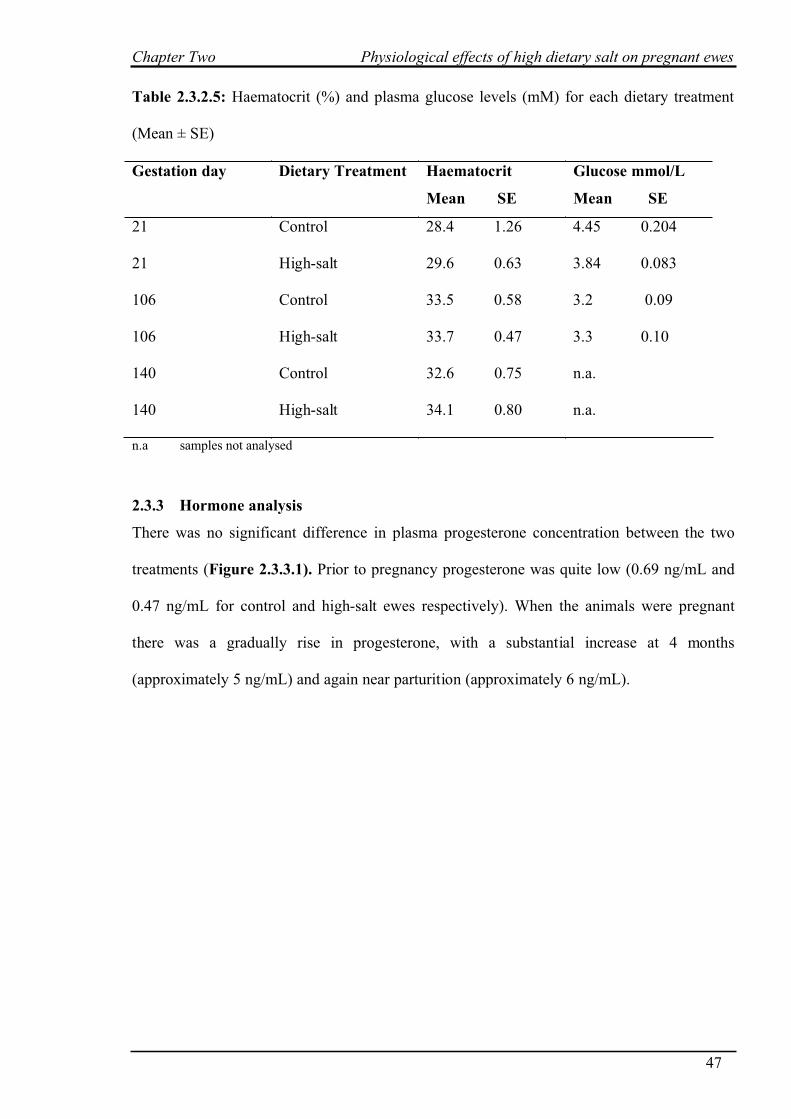
Chapter Two Physiological effects of high dietary salt on pregnant ewes
47
Table 2.3.2.5: Haematocrit (%) and plasma glucose levels (mM) for each dietary treatment
(Mean ± SE)
Gestation day Dietary Treatment Haematocrit
Mean SE
Glucose mmol/L
Mean SE
21 Control 28.4 1.26 4.45 0.204
21 High-salt 29.6 0.63 3.84 0.083
106 Control 33.5 0.58 3.2 0.09
106 High-salt 33.7 0.47 3.3 0.10
140 Control 32.6 0.75 n.a.
140 High-salt 34.1 0.80 n.a.
n.a samples not analysed
2.3.3 Hormone analysis
There was no significant difference in plasma progesterone concentration between the two
treatments (Figure 2.3.3.1). Prior to pregnancy progesterone was quite low (0.69 ng/mL and
0.47 ng/mL for control and high-salt ewes respectively). When the animals were pregnant
there was a gradually rise in progesterone, with a substantial increase at 4 months
(approximately 5 ng/mL) and again near parturition (approximately 6 ng/mL).
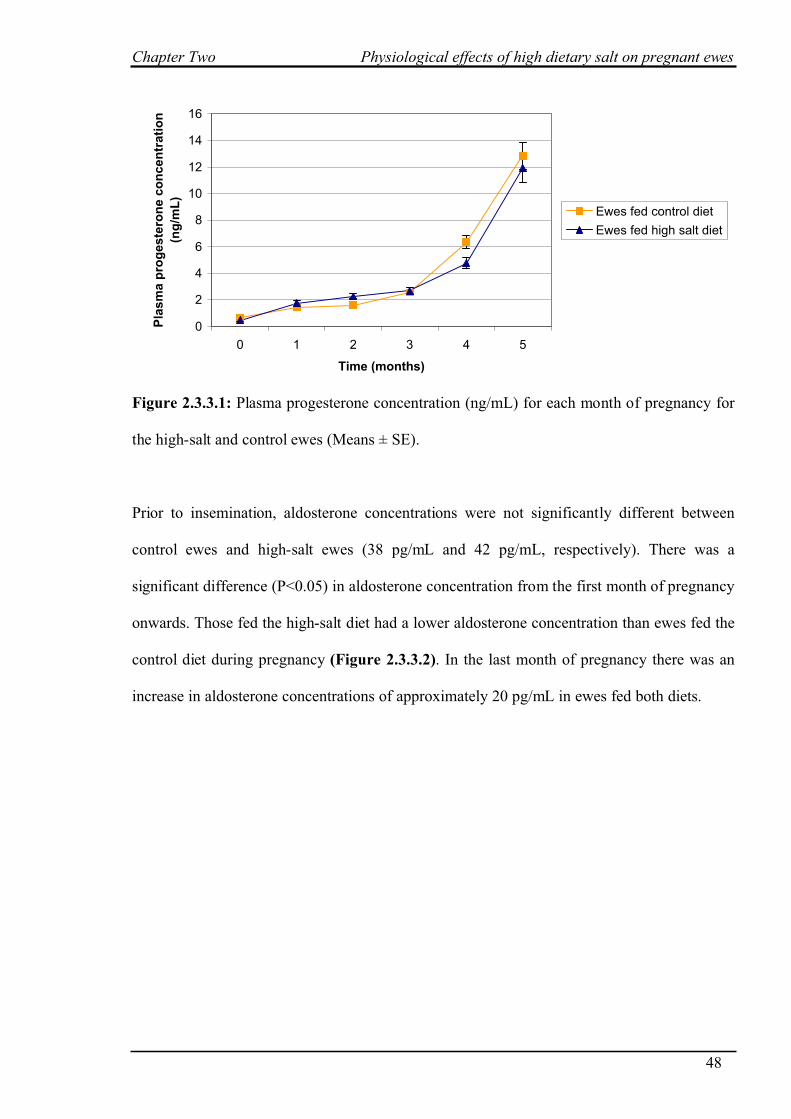
Chapter Two Physiological effects of high dietary salt on pregnant ewes
48
0
2
4
6
8
10
12
14
16
0 1 2 3 4 5
Time (months)
Pla
sm
a p
rog
este
ron
e c
on
cen
trati
on
(ng
/mL
)
Ewes fed control diet
Ewes fed high salt diet
Figure 2.3.3.1: Plasma progesterone concentration (ng/mL) for each month of pregnancy for
the high-salt and control ewes (Means ± SE).
Prior to insemination, aldosterone concentrations were not significantly different between
control ewes and high-salt ewes (38 pg/mL and 42 pg/mL, respectively). There was a
significant difference (P<0.05) in aldosterone concentration from the first month of pregnancy
onwards. Those fed the high-salt diet had a lower aldosterone concentration than ewes fed the
control diet during pregnancy (Figure 2.3.3.2). In the last month of pregnancy there was an
increase in aldosterone concentrations of approximately 20 pg/mL in ewes fed both diets.

Chapter Two Physiological effects of high dietary salt on pregnant ewes
49
0
10
20
30
40
50
60
70
80
90
0 1 2 3 4 5
Time (months)
Pla
sm
a a
ldo
ste
ron
e c
on
cen
trati
on
(pg
/mL
)
Ewes fed control diet
Ewes fed high salt diet
Figure 2.3.3.2: Plasma aldosterone concentration (pg/mL) for each month of pregnancy for
the high-salt and control ewes (Means ± SE).
There was no significant difference between the ewes treatment for plasma AVP
concentration during pregnancy (Figure 2.3.3.3). Prior to pregnancy AVP concentrations
were quite high (27 pg/mL and 15 pg/mL for the high salt and control ewes respectively).
When the ewes became pregnant AVP concentration decreased (approximately 18 pg/mL and
10 pg/mL) although in the first month of pregnancy high-salt ewes were 8 pg/mL higher in
AVP concentration than the control ewes. AVP concentration remained fairly constant until
the last month of pregnancy where there was a slight increase of approximately 5 pg/mL.
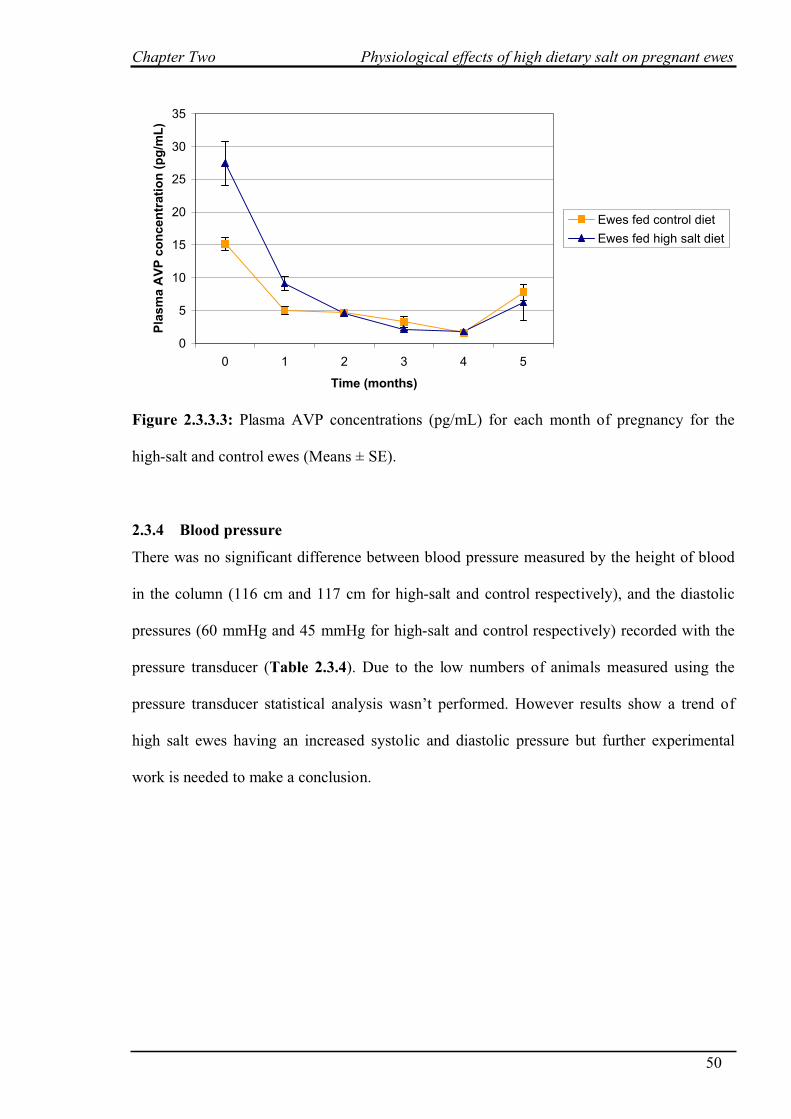
Chapter Two Physiological effects of high dietary salt on pregnant ewes
50
0
5
10
15
20
25
30
35
0 1 2 3 4 5
Time (months)
Pla
sm
a A
VP
co
ncen
trati
on
(p
g/m
L)
Ewes fed control diet
Ewes fed high salt diet
Figure 2.3.3.3: Plasma AVP concentrations (pg/mL) for each month of pregnancy for the
high-salt and control ewes (Means ± SE).
2.3.4 Blood pressure
There was no significant difference between blood pressure measured by the height of blood
in the column (116 cm and 117 cm for high-salt and control respectively), and the diastolic
pressures (60 mmHg and 45 mmHg for high-salt and control respectively) recorded with the
pressure transducer (Table 2.3.4). Due to the low numbers of animals measured using the
pressure transducer statistical analysis wasn’t performed. However results show a trend of
high salt ewes having an increased systolic and diastolic pressure but further experimental
work is needed to make a conclusion.
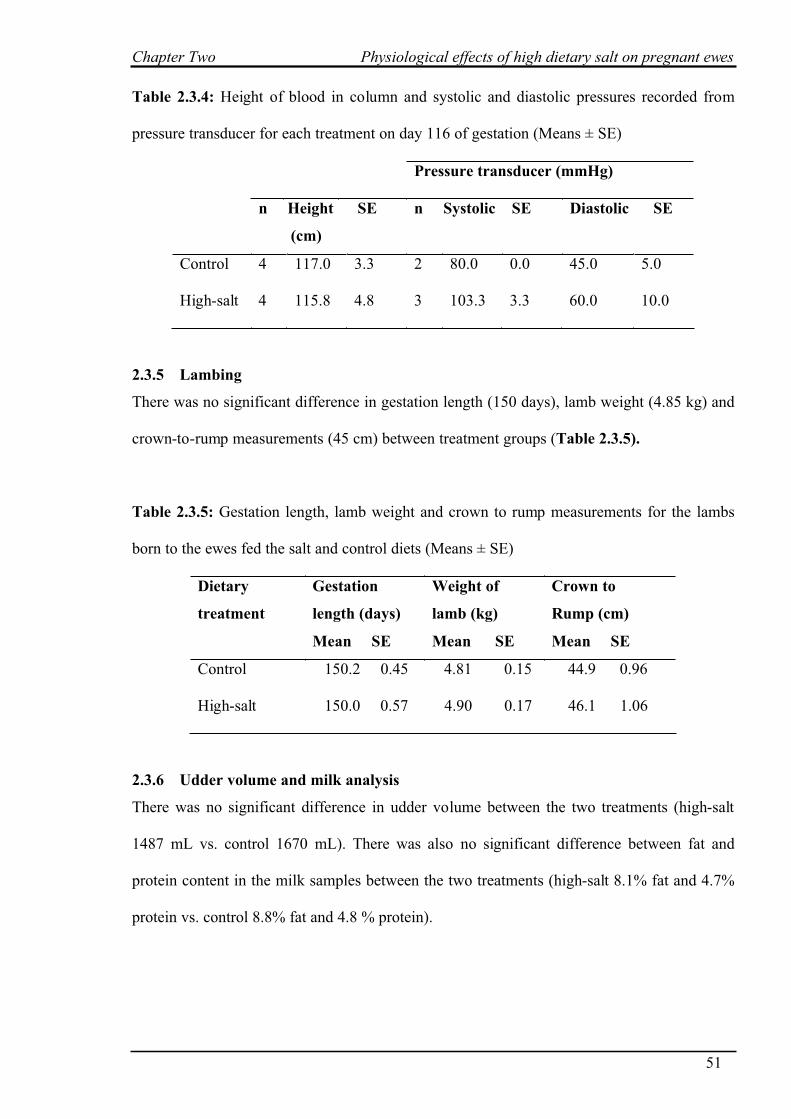
Chapter Two Physiological effects of high dietary salt on pregnant ewes
51
Table 2.3.4: Height of blood in column and systolic and diastolic pressures recorded from
pressure transducer for each treatment on day 116 of gestation (Means ± SE)
Pressure transducer (mmHg)
n Height SE
(cm)
n Systolic SE Diastolic SE
Control 4 117.0 3.3 2 80.0 0.0 45.0 5.0
High-salt 4 115.8 4.8 3 103.3 3.3 60.0 10.0
2.3.5 Lambing
There was no significant difference in gestation length (150 days), lamb weight (4.85 kg) and
crown-to-rump measurements (45 cm) between treatment groups (Table 2.3.5).
Table 2.3.5: Gestation length, lamb weight and crown to rump measurements for the lambs
born to the ewes fed the salt and control diets (Means ± SE)
Dietary
treatment
Gestation
length (days)
Mean SE
Weight of
lamb (kg)
Mean SE
Crown to
Rump (cm)
Mean SE
Control 150.2 0.45 4.81 0.15 44.9 0.96
High-salt 150.0 0.57 4.90 0.17 46.1 1.06
2.3.6 Udder volume and milk analysis
There was no significant difference in udder volume between the two treatments (high-salt
1487 mL vs. control 1670 mL). There was also no significant difference between fat and
protein content in the milk samples between the two treatments (high-salt 8.1% fat and 4.7%
protein vs. control 8.8% fat and 4.8 % protein).
Chapter Two Physiological effects of high dietary salt on pregnant ewes
52
2.4 DISCUSSION
This study has shown that feeding ewes on a high-salt (13% NaCl) diet from the time of
insemination until lambing did not compromise insemination rates, pregnancy rates or lamb
birth weights. Conception rates based on ultrasound scanning at day 44 after insemination
were 73% and pregnancy rates were 98% when ewes were identified as pregnant on day 78
after ultrasound scanning. These figures are typical for laparoscopic artificial insemination in
sheep (Hill et al. 1998). There is therefore no evidence that the ingestion of a large amount of
salt from insemination onwards, or the consequential high water consumption, altered the
environment of the oviduct or uterus to affect conception or implantation. Gestation length
and lamb birth weights were unaffected by feeding the high-salt diet. Some degree of caution
is required in making this conclusion because one ewe fed high salt died of a condition caused
by excessive fluid accumulation, and this could conceivable have been related to a high-salt
diet. Oedema is generally a symptom of cardiac insufficiency, which may be secondary to
kidney disease, such as nephritis, leptospirosis or other kidney functional abnormality
(Hungerford 1975). In this case, it is possible that cardiac insufficiency was associated with
ascites (excess fluid in the peritoneal cavity). No other ewes from the high-salt treatment
showed any signs of excessive fluid accumulation, and haematocrit values (packed cell
volume) were not elevated in any ewes.
The apparent tolerance of the ewes to the high-salt diet may have been enhanced by their
young age (two years old) and the fact they were bearing single lambs. Potter and McIntosh
(1974) found that drinking water containing 1.3% NaCl only had a negative affect on twin-
bearing, older ewes (7 years old) or older single-bearing ewes indicating that age and/or
multiple births are important in the apparent susceptibility of pregnant ewes to salt water.
Whether this susceptibility occurs with high-salt feed is yet to be determined.
Chapter Two Physiological effects of high dietary salt on pregnant ewes
53
The adaptive mechanisms by which the ewes tolerated the high-salt diet will now be
discussed.
AVP concentration and water retention
Plasma AVP concentrations in this current study did not differ between the two dietary
treatments from the second month of pregnancy to parturition. The reason that the high-salt
diet did not induce in increase in AVP was probably because the ewes were able to
considerably increase their intake of non-salty water, a response frequently observed with
sheep fed salty feeds (eg, Wilson and Hindley 1968; Meintjes and Olivier 1992). Exposure to
high salt was likely to have been perceived physiologically by the animal as dehydration due
to an increase in osmolality of the extracellular fluid. This would have stimulated the thirst
centre (Bie 1980) and triggered an increase in the amount of water consumed. As water
intake increased, plasma osmolality would have begun to return to normal levels. In non-
pregnant animals, a declining osmolality would normally decrease AVP release but during
pregnancy, AVP is not suppressed at the usual levels of body tonicity (at least in humans;
Lindheimer and Davison 1995), as part of the normal water-retaining mechanisms of
pregnancy. Therefore, the physiological ‘objective’ of sheep in the present experiment to
increase water retention to sustain a normal pregnancy was achieved without a change in AVP
concentration because they adapted by drinking more water.
Body water content was not determined in the present experiment due to a technical error, so
the increase in water retention could not be quantified. However, a comparison of live weight
during pregnancy between ewes fed the high-salt diet and control diet can provide some
indication of extra water retention. Since the ewes were ‘pair fed’ on an equal organic matter
basis, and because lamb birth weight was unchanged (and therefore foetal weights during
pregnancy were unlikely to have differed), any difference in live weight between the groups is
likely to be due to different water retention. By the end of pregnancy, ewes fed the high-salt
Chapter Two Physiological effects of high dietary salt on pregnant ewes
54
diet were 3 kg heavier than their control counterparts. Warren et al. (1995) found an increase
of 10 to 15% in total body water, which equates 3 to 5 kg more in weight when animals were
fed saltbush containing 15-20% salt. This is consistent with the current data. Masters et al.
(2005) suggested that the increase in live weight associated with high salt consumption is due
to a change in body composition. A high-salt diet increases protein flow to the small intestine
(Hemsley et al. 1975), which may increase protein accretion. Protein retained in muscle is
accompanied by water (Searle and Graham 1975). Thus the increase of 3 kg in live weight of
the high-salt ewes may be a combination of increased water retention to maintain osmolality
of body fluids and water retained in muscle.
As gestation progresses, body water is continually monitored (via changes in osmolality and
blood pressure) by the animal, and there are continual adjustments in the volume-sensing
AVP release mechanisms (Lindheimer et al. 1989). This mechanism could possibly explain
the increase in AVP in the last month of pregnancy in both groups of sheep. Although plasma
osmolality may have decreased due to high water retention in late pregnancy, the osmotic
threshold that triggers a decline in AVP release may have been adjusted to a higher set point,
resulting in an elevated AVP concentration.
Aldosterone concentration
The ewes fed a high-salt diet managed the physiological conflict of salt retention for
pregnancy and salt excretion for an overload of salt by reducing their plasma aldosterone
concentration by approximately 50% of control values. When pregnant ewes are fed a normal
or low-salt diet, aldosterone is required to increase water reabsorption and thus increase
extracellular fluid. When pregnant ewes are fed a high-salt diet, aldosterone is not required as
the high salt from the diet results in increased water intake and thus extracellular volume is
increased. Therefore pregnant ewes fed high salt were able to avoid complications such as
hypertension (Rafestin-Oblin et al. 1991) or neonatal mortalities (Potter and McIntosh 1974)
Chapter Two Physiological effects of high dietary salt on pregnant ewes
55
by reducing their plasma aldosterone concentrations and increasing water intake to increase in
extracellular fluid without accumulating excessive fluid.
Blood pressure
The techniques used to assess blood pressure in this experiment were not as successful as
intended due to difficulties in maintaining patency of carotid artery catheters. Consequently
blood pressure was measured only in a small number of ewes over two days. Results seem to
be within a normal blood pressure range reported from other studies although pressures
appear to be quite variable (Table 2.4). It is not possible to make conclusions from these
limited data and further work is required to provide a conclusive case. There are two main
forms of gestational hypertension; preeclampsia which is characterised by high blood pressure
and protein in the urine and gestational hypertension, which has no typical symptoms other
than, elevated blood pressure. As neither of these symptoms was found in the ewes it can be
suggested that blood pressure was probably not elevated. The consequences of gestational
hypertension include decreased birth weight (August 2000), pre-term delivery, and placental
abruption causing massive bleeding from the vagina. Again, these consequences were not
found in the pregnant ewes and lamb birth weight was not affected by feeding high-salt diets,
and this suggests that blood pressure was not above normal levels in the ewes of this
experiment.
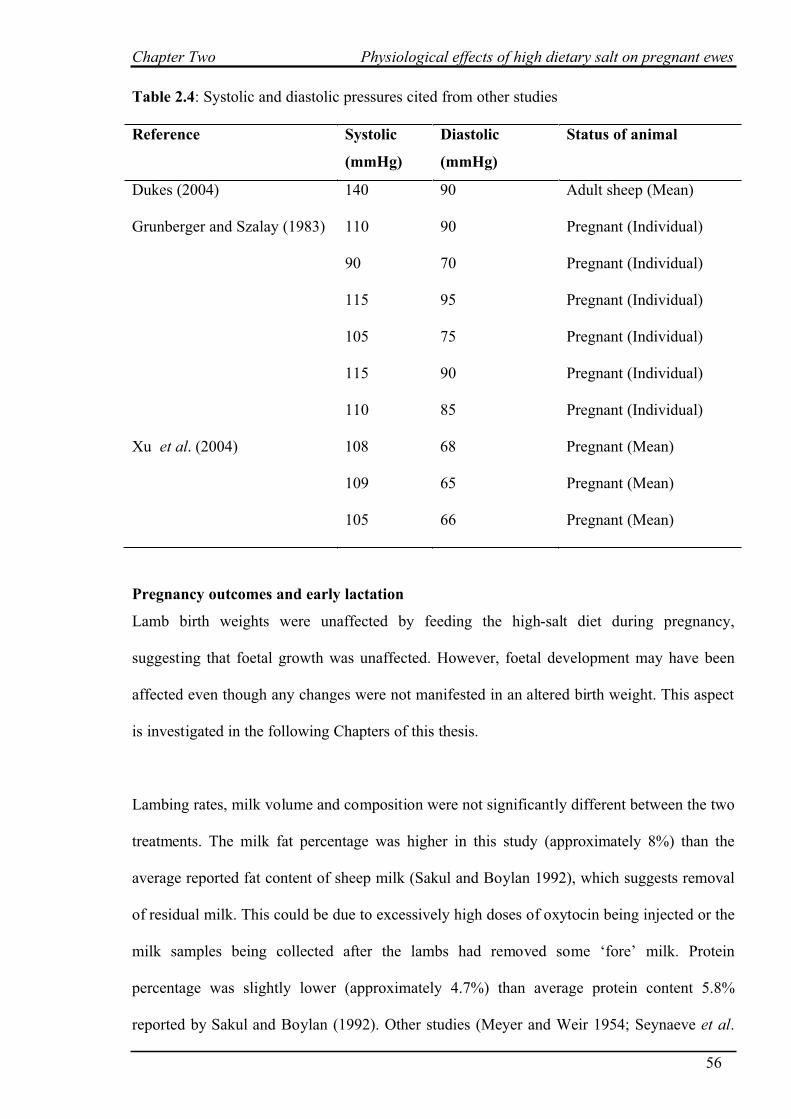
Chapter Two Physiological effects of high dietary salt on pregnant ewes
56
Table 2.4: Systolic and diastolic pressures cited from other studies
Reference Systolic
(mmHg)
Diastolic
(mmHg)
Status of animal
Dukes (2004) 140 90 Adult sheep (Mean)
Grunberger and Szalay (1983) 110 90 Pregnant (Individual)
90 70 Pregnant (Individual)
115 95 Pregnant (Individual)
105 75 Pregnant (Individual)
115 90 Pregnant (Individual)
110 85 Pregnant (Individual)
Xu et al. (2004) 108 68 Pregnant (Mean)
109 65 Pregnant (Mean)
105 66 Pregnant (Mean)
Pregnancy outcomes and early lactation
Lamb birth weights were unaffected by feeding the high-salt diet during pregnancy,
suggesting that foetal growth was unaffected. However, foetal development may have been
affected even though any changes were not manifested in an altered birth weight. This aspect
is investigated in the following Chapters of this thesis.
Lambing rates, milk volume and composition were not significantly different between the two
treatments. The milk fat percentage was higher in this study (approximately 8%) than the
average reported fat content of sheep milk (Sakul and Boylan 1992), which suggests removal
of residual milk. This could be due to excessively high doses of oxytocin being injected or the
milk samples being collected after the lambs had removed some ‘fore’ milk. Protein
percentage was slightly lower (approximately 4.7%) than average protein content 5.8%
reported by Sakul and Boylan (1992). Other studies (Meyer and Weir 1954; Seynaeve et al.
Chapter Two Physiological effects of high dietary salt on pregnant ewes
57
1996) found that there was no difference in protein percentage when sheep (Meyer and Weir,
1954) or sows (Seynaeve et al. 1996) were fed high-salt diets during lactation.
In summary pregnant ewes can consume 13% NaCl diet without experiencing pregnancy
difficulties and neonatal mortalities. However, future studies should be undertaken before it
can be categorically concluded that the ewe fatalities during pregnancy in this experiment
were unrelated to the high-salt treatment. The adaptive mechanisms involved in maintaining a
successful pregnancy outcome are a decrease in the RAS, where aldosterone concentration
decreased in pregnant ewes fed a high-salt diet and AVP remained the same as control ewes.
It is important to note however, that further research is required before it can be concluded
that pregnant ewes can graze on saltbush as other factors present in saltbush may influence
outcomes. There are also further investigations required on the effect of the offspring because
if the increased salt intake of the pregnant ewes lowered the activity of the RAS, there may be
affects on the kidney function of the offspring (Alves da Silva et al. 2003). The exact
mechanisms by which these changes in the offspring occur are largely unknown, however
there is mounting evidence that high-salt intake pre and/or postnatally effects the offspring
(Arguelles et al. 1996; Smriga et al. 2002; Alves da Silva et al. 2003; Curtis et al. 2004).
Consequences on kidney function and salt tolerance in the offspring are investigated in the
following Chapters.
CHAPTER THREE:
Responses of the offspring to an oral salt
challenge
Chapter Three Responses of the offspring to an oral salt challenge
58
3.1 INTRODUCTION
Evidence from experiment one (Chapter 2) has shown that pregnant ewes fed a high-salt diet
(13% NaCl) do not experience adverse effects in pregnancy rates, blood pressure or lamb
birth weights. The ewes managed the potential physiological conflict between salt retention
for pregnancy and salt excretion for high-salt intake by reducing their plasma aldosterone
concentration by approximately 50% of control values and increasing water consumption at
least two-fold. Reducing aldosterone concentrations during pregnancy may have
consequences beyond the successful completion of pregnancy as it has been implicated in
altering kidney function and development of the offspring (Arguelles et al. 1996; Alves da
Silva et al. 2003).
Studies with rats have indicated that high maternal salt intake (3-8% NaCl) during gestation,
or exposure to high salt during early postnatal development, affects the offspring. They
display increased preference for dietary salt and changes in the RAS and blood pressure.
Smriga et al. (2002) found that rats whose tongues had been exposed to a sodium chloride-
enriched milk formula (85 mmol/L NaCl) during 7-8 days of postnatal development had an
increased acceptance of salty and sweet solutions as adults. However when exposed to the
high-salt milk at 14 -15 days of age, the same results were not observed, indicating that the
time of salt or taste exposure is important. Curtis et al. (2004) similarly found that; rats born
to dams exposed to high NaCl (3%) during gestation and lactation and then exposed 9 days
post weaning to a high-salt (3%) chow consumed, as adults, more of a 0.5M NaCl diet after
10 days of dietary Na deprivation than offspring from dams fed either 1% or 0.1% NaCl
during pregnancy. The temporal patterns of intake of water and salt solution in offspring
from dams that received 3% NaCl in their diet during pregnancy and lactation also differed
from controls. These rats drank less water for each unit of NaCl consumed. It was concluded
that manipulating dietary NaCl early in life did not impair sodium regulation, but did affect
Chapter Three Responses of the offspring to an oral salt challenge
59
the dietary preference for NaCl (i.e., feeding behaviour) and the intake of NaCl (Curtis et al.
2004). Contreras and Kosten (1983) hypothesised that mechanisms behind these changes may
relate to the sensitivity of taste receptors and/or changes in salt and water balance. However,
as salt appetite of offspring can also be increased by inducing extracellular dehydration of
their dam during pregnancy (Nicolaidis et al. 1990), the RAS, rather than the salt per se, may
be the primary mechanism involved in the changes in the offspring. Alves da Silva et al.
(2003) found, with rats, that offspring whose mothers were exposed to 8% NaCl through
gestation until weaning increased angiotensin II, had higher blood pressure and lower
responsiveness of blood pressure to salt intake. Arguelles et al. (1996), using a similar
experimental design, reported that offspring of dams fed high-salt had increased sensitivity to
angiotensin II. This may have been the result of a feedback mechanism in which angiotensin
II receptors were up-regulated in the foetus in response to lower activity of the RAS in the
mother (Arguelles et al. 1996; Butler et al. 2002).
There is evidence that similar pre- and postnatal effects as described above with rats may also
be found in sheep. Dodic et al. (2002) found that when pregnant sheep are infused with
cortisol for 2 days at 27 days of gestation, their lambs had stunted kidneys that predisposed
them to high blood pressure at 5 months of age. Hegarty et al. (2000) also found that cortisol
infusions into foetuses caused an increase in plasma cortisol concentration in the foetus and
this was associated with an increase in systolic blood pressure. However, Stevens and
Lumbers (1986), found that the ovine foetus appears to be protected from both a high dietary
salt intake by the pregnant dam and moderate salt depletion (achieved using furosemide)
presumably because of the efficiency of maternal homeostatic mechanisms. Data with cattle
(Mohamed and Phillips 2003) have shown that maternal high-salt intake affected foetal calf
development with postnatal consequences. Their studies indicated that calves from cows that
had received supplementary sodium (70 g NaCl per day) during the last two months of
Chapter Three Responses of the offspring to an oral salt challenge
60
pregnancy had a higher appetite for sodium, indicating that sodium appetite regulation of
offspring could be entrained by the sodium intake of the dam during late pregnancy.
The hypotheses underlying this experiment are that lambs born to ewes fed a high-salt diet (‘S
lambs’) will have a higher preference for a salty diet than their control counterparts (‘C
lambs’), and S lambs will exhibit differences in urinary output, water intake, sodium excretion
and hormone (AVP and aldosterone) concentration when administered a salt tolerance test.
The latter would be consistent with a developmental change in the sensitivity and function of
the RAS for regulating sodium and water balance.
Chapter Three Responses of the offspring to an oral salt challenge
61
3.2 MATERIALS AND METHODS
3.2.1 Short term preference testing
At eight weeks of age a total of 24 lambs (12 C and 12 S) born in Experiment 1 (Chapter 2)
were weaned and placed into individual pens in the Livestock Research Centre, Roseworthy
Campus, University of Adelaide. In this and following chapters, the two groups of lambs are
referred to as ‘C’ and ‘S’ lambs to indicate that they were born to ewes fed the control or
high-salt diet during pregnancy. After weaning, the lambs were fed 1 kg of lucerne chaff and
500 g of the same control pellets as used in the preceding chapter (Refer to Chapter 2 section
2.2.2). Two weeks after an adaptation period the lambs were offered high-salt pellets and
control pellets simultaneously in adjacent feeders for 5 minutes. After each animal was
offered the two feeds for 5 minutes the uneaten feed was weighed and the intake of each was
calculated. The preference for the high-salt diet was determined as a percentage of the total
amount of feed consumed. The high-salt pellets and the control pellets were of the same
formulation as fed to pregnant ewes in the preceding chapter (see Section 2.2.2, Table 2.2.2
for dietary composition). After the preference test the feed was taken away for one hour. This
was repeated 4 times per day and over 3 days. At the end of each trial all lambs received 500
g lucerne chaff and 500 g control pellets overnight.
3.2.2 Long term preference testing
One week after completing the short-term preference testing the animals were subjected to
longer term preference testing. They were offered the high-salt and control pellets (as above)
in adjacent feeders for 24 hours and, after each day, the feed was weighed and the amount of
each diet consumed was calculated. This was repeated for four consecutive days and
preference for the high-salt diet was determined as a percentage of the total amount of feed
consumed expressed on a daily basis.
Chapter Three Responses of the offspring to an oral salt challenge
62
3.2.3 Salt tolerance test on lambs
One week after the preference testing was completed, 12 lambs (six C lambs and six S lambs)
were placed into metabolism crates. Between and during experiments all animals were fed
1kg of lucerne and 500 g of maintenance sheep pellets each day (8.5% crude protein; 8.5 MJ
ME/kg; J.T Johnson and Sons, Kapunda, S.A.). On the first day, half the lambs from each
treatment (three C lambs and three S lambs) were given an oral dose of 40 g NaCl in solution
whilst the other six lambs received a dose of deionised water of equal volume. A dose of 40 g
NaCl was selected to represent approximately 20% of maximum daily intake of salt (Masters
et al. 2005). Thus, as a single dose, it represents a significant physiological dose but within
the range encountered by animals on halophytic forages (Masters et al. 2005). The salt
solution was made up as a 25% w/v solution in 160 mL of distilled water. Before the oral
dose was given a 9 mL blood sample was collected by venipuncture of the jugular vein for
basal concentrations of AVP and aldosterone. Sequential blood samples were taken at 4, 8
and 23 hours after the oral salt dose to monitor hormone concentrations in response to the salt
tolerance test. Every two hours for 10 hours, and at 23 hours, urine output was determined. A
10 mL sample of urine at each time point was taken and frozen for later analysis of sodium
concentration. Water intake was also measured over the same time intervals as urine output.
On the second day the treatments were switched, so those that had received the oral salt dose
received the water (control) dose, and vice versa, and the same sampling protocol was
followed. These two days of tolerance testing were repeated the following week with another
group of 12 lambs, such that a total of 24 lambs (12 C lambs and 12 S lambs) were tested.
3.2.3.1 Sodium Concentration
Urine samples were analysed for Na+
concentration by inductively coupled plasma atomic
emission spectrometry (Dahlquist et al. 1978) using a Spectro CIROS ICPAES machine
(Waite Analytical Services, The University of Adelaide). Samples were digested with nitric
Chapter Three Responses of the offspring to an oral salt challenge
63
acid and finished with hydrochloric acid as described by McQuaker et al. (1979). The intra-
assay coefficient of variation for sodium concentration was 2.88%.
3.2.3.2 Hormone Analysis
Hormone analysis was carried out at the University of Western Australia, School of Animal
Biology. Refer to section 2.2.4 for methodology and intra- and inter-assay coefficients of
variation and limit of detection.
3.2.4 Statistical Analysis
The data were analysed using Genstat 8th
Edition and used a balanced set of data. The model
used was a mixed model as it contains both fixed and random effects (Table 3.2.4).
For a given transformed response variable γ the full model equation is
γ = µ + u + e
where µ represents a vector of fixed effects, u represents a vector of random effects and e a
random error term.
Each of the fixed effects were tested using a variance ratio statistic obtained from the Mean
Square of the fixed effect of interest divided by the Residual Mean Square for that strata of
the ANOVA table. Interactions that were not significant were removed from the model. Most
of the data had to be transformed to meet the assumptions of the model; outliers were replaced
with missing values. These transformations are listed below:
Aldosterone concentration in plasma: Log transformation minus two outliers;
AVP concentration in plasma: Square root transformation minus three outliers;
Water intake: Square root transformation minus one outlier;
Urinary output: Square root transformation minus three outliers;
Sodium excretion: Square root transformation minus five outliers
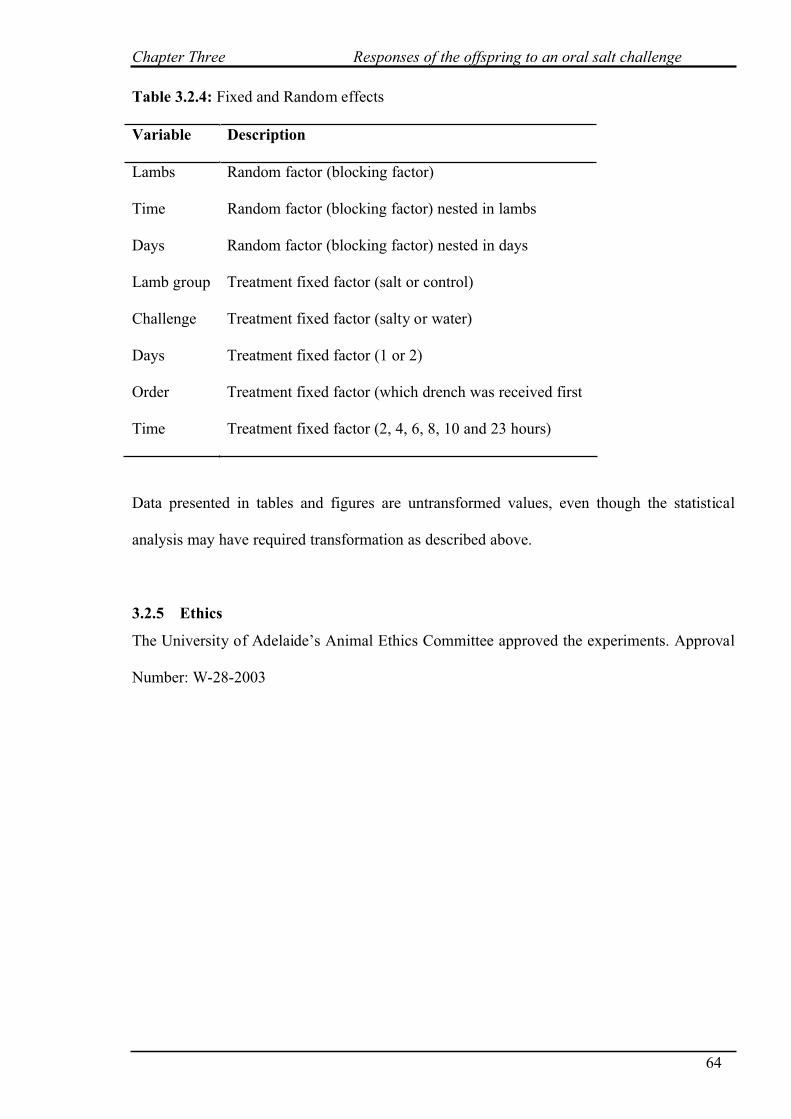
Chapter Three Responses of the offspring to an oral salt challenge
64
Table 3.2.4: Fixed and Random effects
Variable Description
Lambs Random factor (blocking factor)
Time Random factor (blocking factor) nested in lambs
Days Random factor (blocking factor) nested in days
Lamb group Treatment fixed factor (salt or control)
Challenge Treatment fixed factor (salty or water)
Days Treatment fixed factor (1 or 2)
Order Treatment fixed factor (which drench was received first
Time Treatment fixed factor (2, 4, 6, 8, 10 and 23 hours)
Data presented in tables and figures are untransformed values, even though the statistical
analysis may have required transformation as described above.
3.2.5 Ethics
The University of Adelaide’s Animal Ethics Committee approved the experiments. Approval
Number: W-28-2003
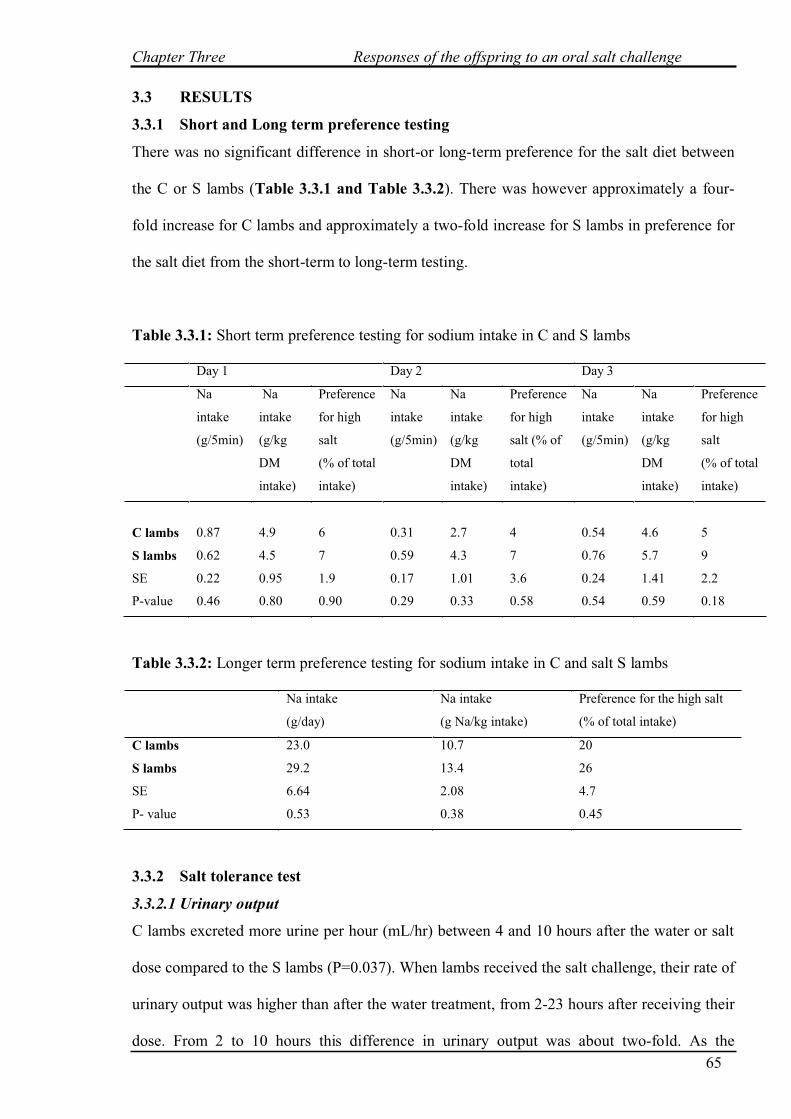
Chapter Three Responses of the offspring to an oral salt challenge
65
3.3 RESULTS
3.3.1 Short and Long term preference testing
There was no significant difference in short-or long-term preference for the salt diet between
the C or S lambs (Table 3.3.1 and Table 3.3.2). There was however approximately a four-
fold increase for C lambs and approximately a two-fold increase for S lambs in preference for
the salt diet from the short-term to long-term testing.
Table 3.3.1: Short term preference testing for sodium intake in C and S lambs
Day 1 Day 2 Day 3
Na
intake
(g/5min)
Na
intake
(g/kg
DM
intake)
Preference
for high
salt
(% of total
intake)
Na
intake
(g/5min)
Na
intake
(g/kg
DM
intake)
Preference
for high
salt (% of
total
intake)
Na
intake
(g/5min)
Na
intake
(g/kg
DM
intake)
Preference
for high
salt
(% of total
intake)
C lambs 0.87 4.9 6 0.31 2.7 4 0.54 4.6 5
S lambs 0.62 4.5 7 0.59 4.3 7 0.76 5.7 9
SE 0.22 0.95 1.9 0.17 1.01 3.6 0.24 1.41 2.2
P-value 0.46 0.80 0.90 0.29 0.33 0.58 0.54 0.59 0.18
Table 3.3.2: Longer term preference testing for sodium intake in C and salt S lambs
Na intake
(g/day)
Na intake
(g Na/kg intake)
Preference for the high salt
(% of total intake)
C lambs 23.0 10.7 20
S lambs 29.2 13.4 26
SE 6.64 2.08 4.7
P- value 0.53 0.38 0.45
3.3.2 Salt tolerance test
3.3.2.1 Urinary output
C lambs excreted more urine per hour (mL/hr) between 4 and 10 hours after the water or salt
dose compared to the S lambs (P=0.037). When lambs received the salt challenge, their rate of
urinary output was higher than after the water treatment, from 2-23 hours after receiving their
dose. From 2 to 10 hours this difference in urinary output was about two-fold. As the
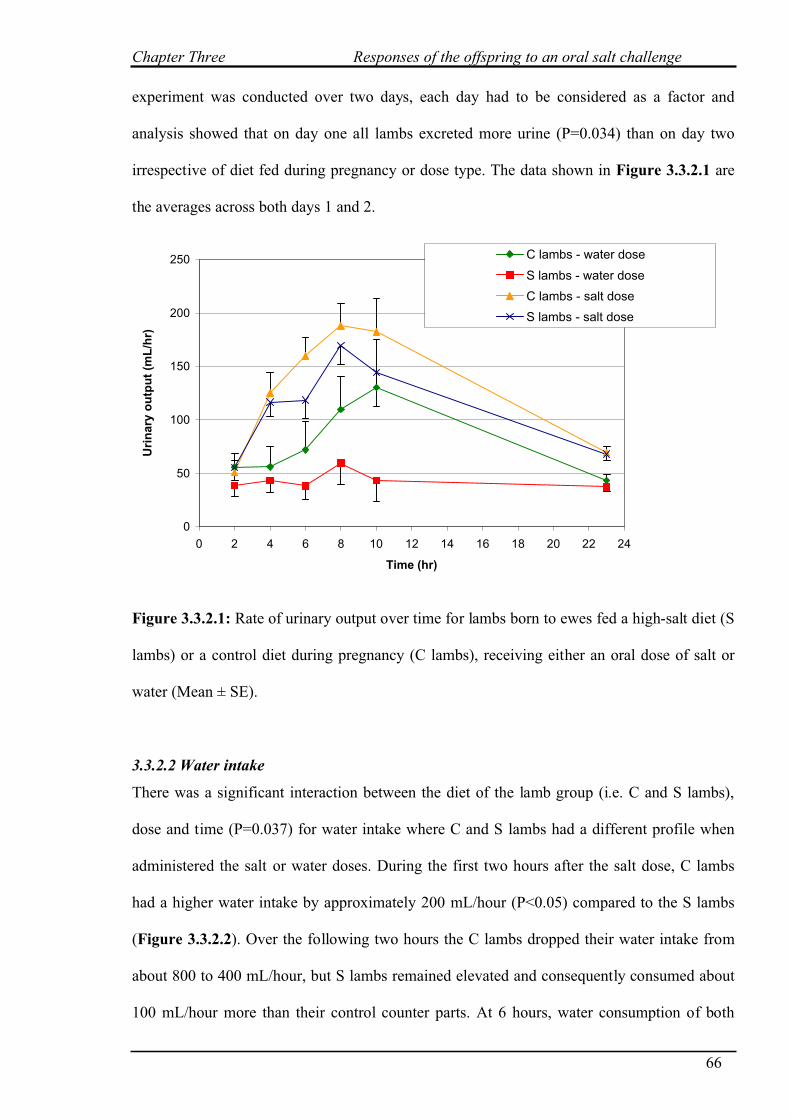
Chapter Three Responses of the offspring to an oral salt challenge
66
experiment was conducted over two days, each day had to be considered as a factor and
analysis showed that on day one all lambs excreted more urine (P=0.034) than on day two
irrespective of diet fed during pregnancy or dose type. The data shown in Figure 3.3.2.1 are
the averages across both days 1 and 2.
0
50
100
150
200
250
0 2 4 6 8 10 12 14 16 18 20 22 24
Time (hr)
Uri
na
ry o
utp
ut
(mL
/hr)
C lambs - water dose
S lambs - water dose
C lambs - salt dose
S lambs - salt dose
Figure 3.3.2.1: Rate of urinary output over time for lambs born to ewes fed a high-salt diet (S
lambs) or a control diet during pregnancy (C lambs), receiving either an oral dose of salt or
water (Mean ± SE).
3.3.2.2 Water intake
There was a significant interaction between the diet of the lamb group (i.e. C and S lambs),
dose and time (P=0.037) for water intake where C and S lambs had a different profile when
administered the salt or water doses. During the first two hours after the salt dose, C lambs
had a higher water intake by approximately 200 mL/hour (P<0.05) compared to the S lambs
(Figure 3.3.2.2). Over the following two hours the C lambs dropped their water intake from
about 800 to 400 mL/hour, but S lambs remained elevated and consequently consumed about
100 mL/hour more than their control counter parts. At 6 hours, water consumption of both
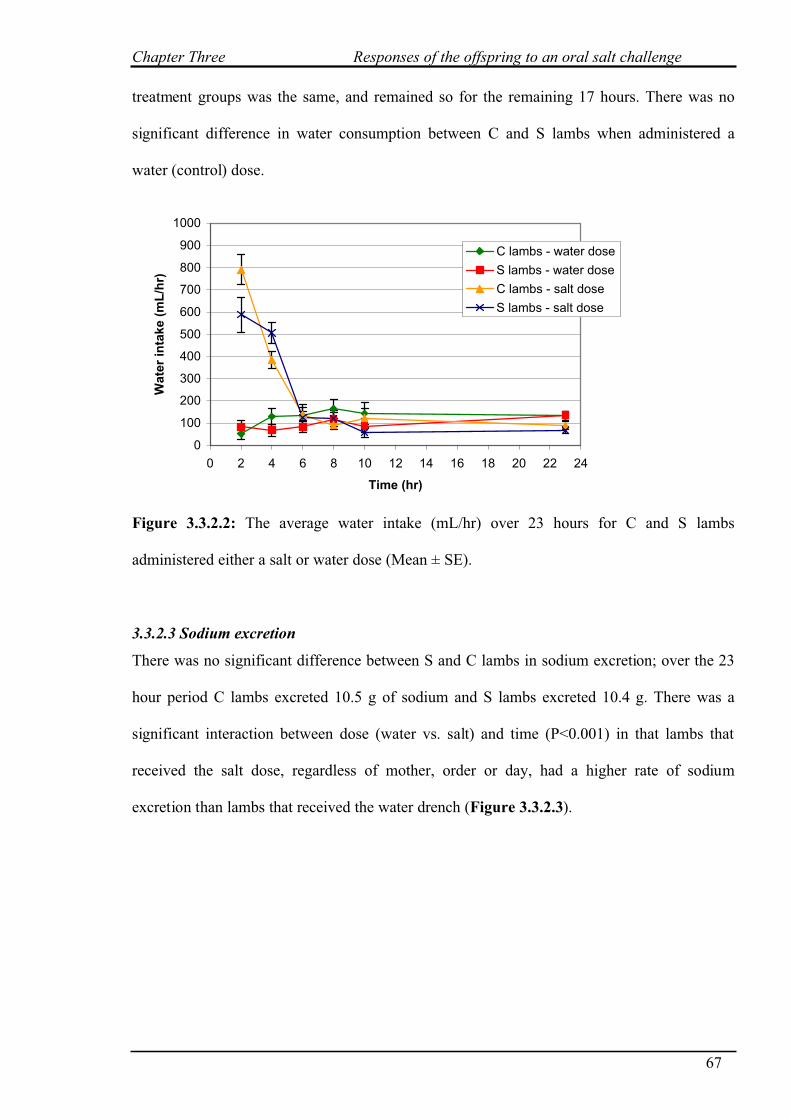
Chapter Three Responses of the offspring to an oral salt challenge
67
treatment groups was the same, and remained so for the remaining 17 hours. There was no
significant difference in water consumption between C and S lambs when administered a
water (control) dose.
Figure 3.3.2.2: The average water intake (mL/hr) over 23 hours for C and S lambs
administered either a salt or water dose (Mean ± SE).
3.3.2.3 Sodium excretion
There was no significant difference between S and C lambs in sodium excretion; over the 23
hour period C lambs excreted 10.5 g of sodium and S lambs excreted 10.4 g. There was a
significant interaction between dose (water vs. salt) and time (P<0.001) in that lambs that
received the salt dose, regardless of mother, order or day, had a higher rate of sodium
excretion than lambs that received the water drench (Figure 3.3.2.3).
0
100
200
300
400
500
600
700
800
900
1000
0 2 4 6 8 10 12 14 16 18 20 22 24
Time (hr)
Wa
ter
inta
ke
(m
L/h
r)
C lambs - water dose
S lambs - water dose
C lambs - salt dose
S lambs - salt dose
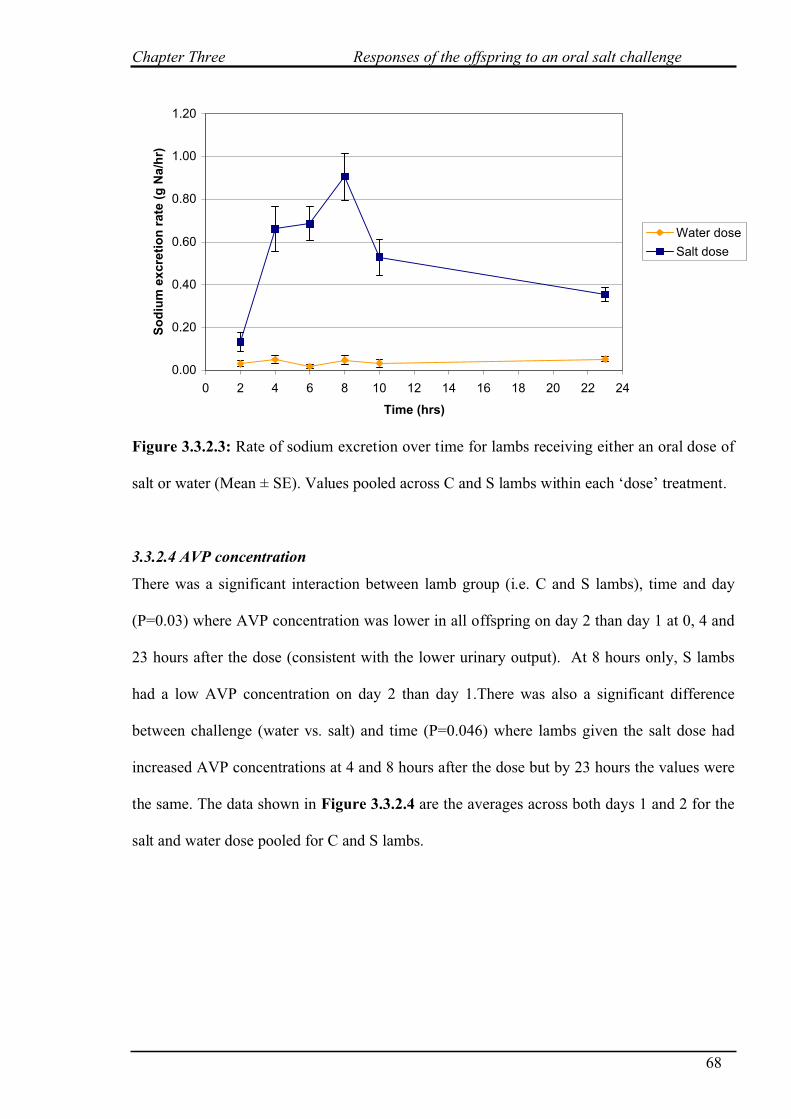
Chapter Three Responses of the offspring to an oral salt challenge
68
0.00
0.20
0.40
0.60
0.80
1.00
1.20
0 2 4 6 8 10 12 14 16 18 20 22 24
Time (hrs)
So
diu
m e
xcre
tio
n r
ate
(g
Na/h
r)
Water dose
Salt dose
Figure 3.3.2.3: Rate of sodium excretion over time for lambs receiving either an oral dose of
salt or water (Mean ± SE). Values pooled across C and S lambs within each ‘dose’ treatment.
3.3.2.4 AVP concentration
There was a significant interaction between lamb group (i.e. C and S lambs), time and day
(P=0.03) where AVP concentration was lower in all offspring on day 2 than day 1 at 0, 4 and
23 hours after the dose (consistent with the lower urinary output). At 8 hours only, S lambs
had a low AVP concentration on day 2 than day 1.There was also a significant difference
between challenge (water vs. salt) and time (P=0.046) where lambs given the salt dose had
increased AVP concentrations at 4 and 8 hours after the dose but by 23 hours the values were
the same. The data shown in Figure 3.3.2.4 are the averages across both days 1 and 2 for the
salt and water dose pooled for C and S lambs.
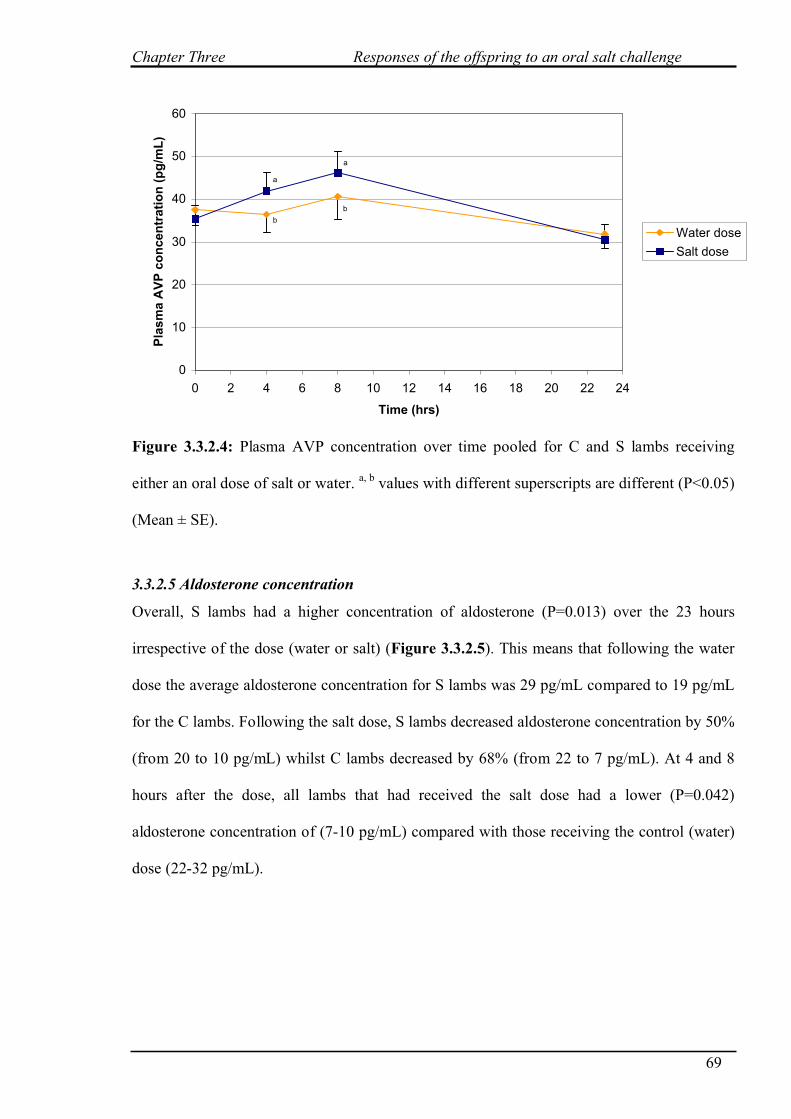
Chapter Three Responses of the offspring to an oral salt challenge
69
0
10
20
30
40
50
60
0 2 4 6 8 10 12 14 16 18 20 22 24
Time (hrs)
Pla
sm
a A
VP
co
ncen
trati
on
(p
g/m
L)
Water dose
Salt dose
a
b
a
b
Figure 3.3.2.4: Plasma AVP concentration over time pooled for C and S lambs receiving
either an oral dose of salt or water. a, b
values with different superscripts are different (P<0.05)
(Mean ± SE).
3.3.2.5 Aldosterone concentration
Overall, S lambs had a higher concentration of aldosterone (P=0.013) over the 23 hours
irrespective of the dose (water or salt) (Figure 3.3.2.5). This means that following the water
dose the average aldosterone concentration for S lambs was 29 pg/mL compared to 19 pg/mL
for the C lambs. Following the salt dose, S lambs decreased aldosterone concentration by 50%
(from 20 to 10 pg/mL) whilst C lambs decreased by 68% (from 22 to 7 pg/mL). At 4 and 8
hours after the dose, all lambs that had received the salt dose had a lower (P=0.042)
aldosterone concentration of (7-10 pg/mL) compared with those receiving the control (water)
dose (22-32 pg/mL).
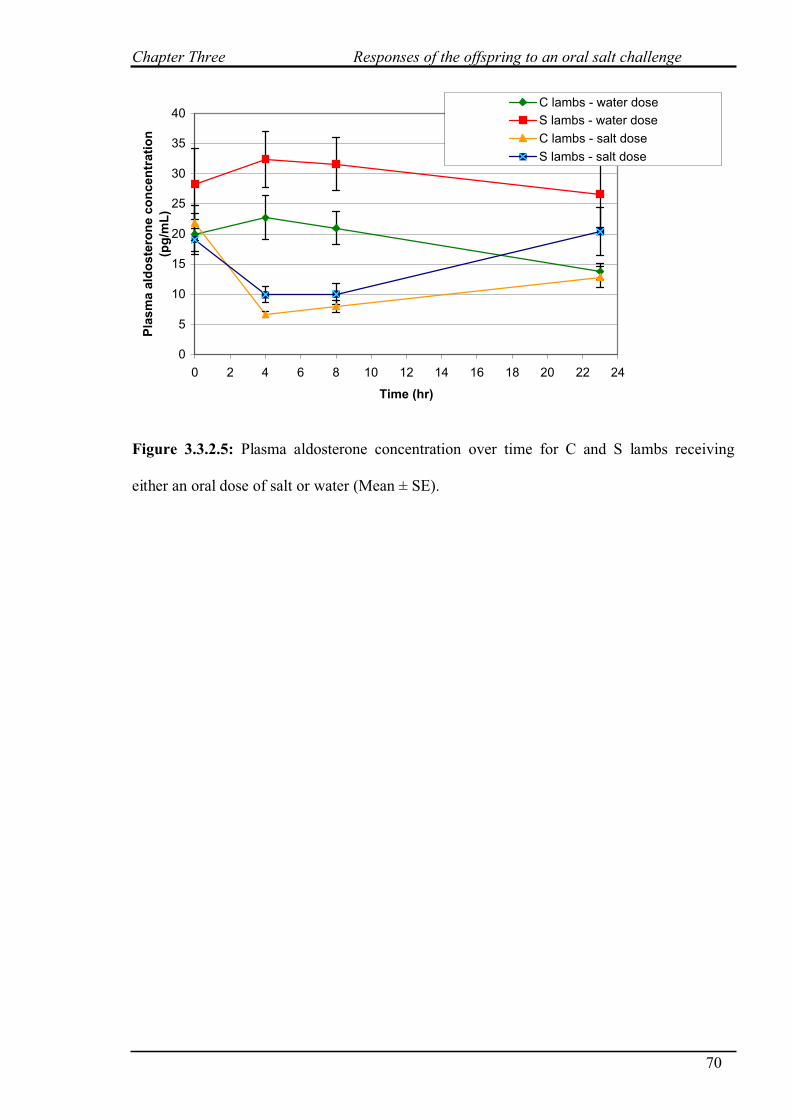
Chapter Three Responses of the offspring to an oral salt challenge
70
0
5
10
15
20
25
30
35
40
0 2 4 6 8 10 12 14 16 18 20 22 24
Time (hr)
Pla
sm
a a
ldo
ste
ron
e c
on
cen
trati
on
(pg
/mL
)
C lambs - water dose
S lambs - water dose
C lambs - salt dose
S lambs - salt dose
Figure 3.3.2.5: Plasma aldosterone concentration over time for C and S lambs receiving
either an oral dose of salt or water (Mean ± SE).
Chapter Three Responses of the offspring to an oral salt challenge
71
3.4 DISCUSSION
Animal responses to the oral salt dose (40 g NaCl) in this study are consistent with other
research (Wilson and Dudzinski 1973; Hamilton and Webster 1987) where high-salt
consumption has increased water intake, urinary output and sodium excretion. The single dose
of salt used in this experiment (and following experiments) is a novel approach in testing the
response to oral salt load. This has shown for the first time that there are differences in the
responses to a salt or water challenge between lambs born to dams fed high salt (S lambs) and
lambs born to dams fed a control diet (C lambs) were different. In response to the high salt
challenge, S lambs drank 400 mL less in the first two hours compared to C lambs. S lambs
also had a higher concentration of aldosterone following the control (water) dose and
exhibited a smaller decline in aldosterone concentration following the salt challenge.
Furthermore, C lambs showed an increased urinary output compared to S lambs when
receiving a control (water) dose. This is consistent with aldosterone results under ‘normal’
conditions where decreased aldosterone results in increased water excretion. These results
partially support the second part of the hypothesis in that lambs born to ewes fed a high-salt
diet during pregnancy would differ in their responses to manage a salt load and also provides
evidence that C and S lambs differ under ‘normal’ conditions. The first part of the hypothesis
is rejected as there was no difference between C and S lambs for the preference of high-salt
diets.
Water consumption
Total water intake over the 23-hour period was similar for both lamb groups (i.e. C and S
lambs) after they received the salt drench, but S lambs drank approximately 400 mL less than
the C lambs over the first 2 hours after the salt dose. This suggests that the thirst set points for
the S lambs were higher and the drive to increase water consumption immediately after the
salt load was comparatively less than for C lambs. In the following two hours (2-4 hours), the
water intake of S lambs remained elevated, more so than the C lambs, possibly suggesting
Chapter Three Responses of the offspring to an oral salt challenge
72
that the initially lower water intake (at 2 hours) of S lambs meant that their plasma osmolality
was not reduced as quickly as the C lambs and hence their water intake did not decline much
over the second 2-hour period (2-4 hours) compared with C lambs. The different pattern of
water intake between the two groups of lambs, and the importance of water consumption
immediately after a salt load on the sequalae of physiological events (i.e., urinary output and
sodium excretion) is investigated in more detail in the following chapters.
Aldosterone
The data suggest a lowered responsiveness to aldosterone for S lambs. The S lambs had a
higher mean aldosterone concentration following the water (control) dose than the C lambs
and also the required drop in aldosterone concentration, following a salt dose, was less than
the C lambs. A lowered responsiveness to aldosterone would result in Na-retaining effects
being less potent that normal. A similar study in rats by Alves da Silva et al. (2003) showed
that adult rats exposed to perinatal salt overload had increased kidney angiotensin II. High
angiotensin II leads to increased aldosterone, so although not measured by Alves da Silva et
al. (2003) aldosterone concentrations may also have been elevated. The implications of
increased aldosterone concentrations are higher blood pressure. This was not measured in the
current experiment, however Alves da Silva et al. (2003) did find elevated blood pressure and
hypothesized it to be due to increased aldosterone concentration. Alves da Silva et al. (2003)
suggested that higher renal angiotensin II was a possible mechanism responsible for the shift
of the pressure natriuresis curve and consequently higher blood pressure. Their results also
showed that blood pressure was less responsive to salt intake in animals with high perinatal
exposure the salt.
Both C and S lambs increased sodium excretion after the salt challenge and no differences
could be attributed to the diet during pregnancy. Under these experimental conditions S lambs
excreted sodium at the same rate as C lambs however they did not consume as much water
Chapter Three Responses of the offspring to an oral salt challenge
73
during the first 4 hours after the salt dose or decrease their aldosterone concentration to the
same degree as C lambs. This suggests that although sodium excretion rates were the same,
the magnitude of difference within the mechanisms by which the animals dealt with the
excess salt were different. For example both lamb groups drank more water and decreased
aldosterone concentrations after a salt dose, but S lambs were less perturbed by the salt dose
than the C lambs.
Figure 3.4.1 shows from 2 hours to 23 hours there was a 2 phase linear increase in sodium
excretion; i.e.; increased rapidly up to 10 hours, then the rate declined. Over 23 hours, both C
and S lambs only excreted approximately 64% of Na from the 16 g of Na administered. Soon
after the dose, the increase in osmolality of body fluids would trigger an increase in water
intake and sodium renal excretion. As osmolality began to return to normal, so too would the
rate of sodium excretion. With a repeated dose, or with continual exposure to high salt (as
found in field studies with animals grazing halophytic plants), the rate of excretion would
need to increase to avoid an accumulation of sodium in the body. This is dealt with in the
following chapters in more detail.
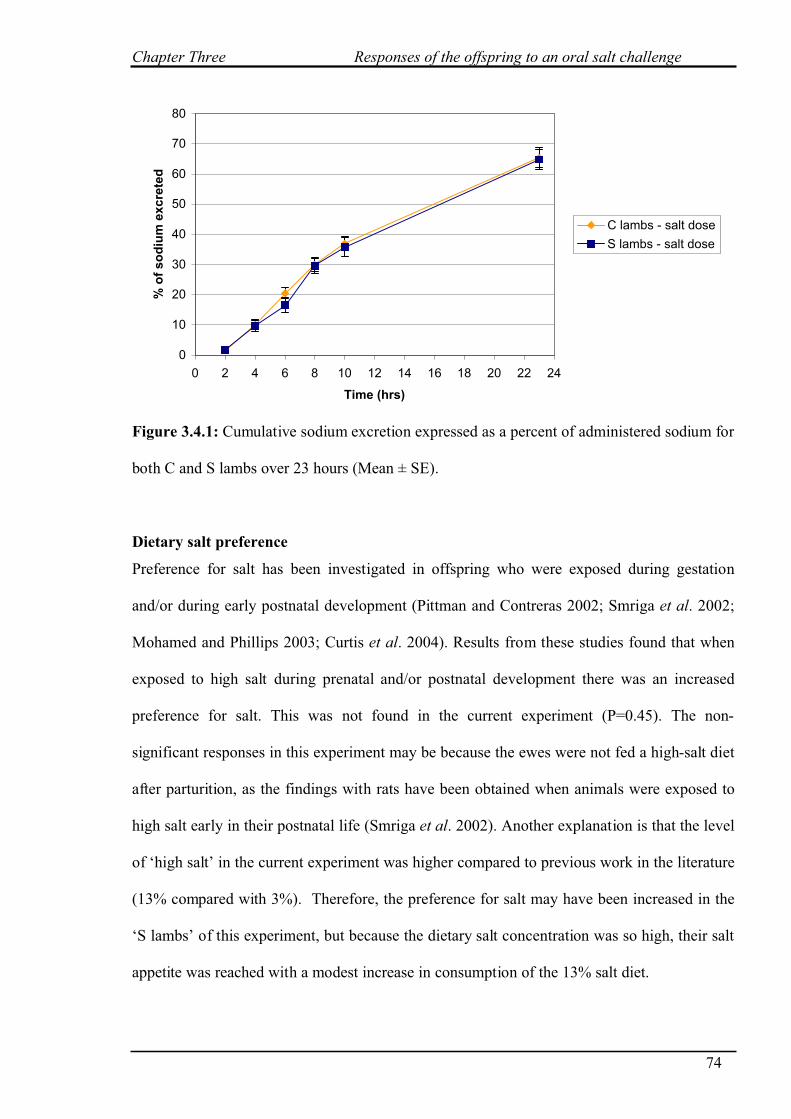
Chapter Three Responses of the offspring to an oral salt challenge
74
0
10
20
30
40
50
60
70
80
0 2 4 6 8 10 12 14 16 18 20 22 24
Time (hrs)
% o
f so
diu
m e
xcre
ted
C lambs - salt dose
S lambs - salt dose
Figure 3.4.1: Cumulative sodium excretion expressed as a percent of administered sodium for
both C and S lambs over 23 hours (Mean ± SE).
Dietary salt preference
Preference for salt has been investigated in offspring who were exposed during gestation
and/or during early postnatal development (Pittman and Contreras 2002; Smriga et al. 2002;
Mohamed and Phillips 2003; Curtis et al. 2004). Results from these studies found that when
exposed to high salt during prenatal and/or postnatal development there was an increased
preference for salt. This was not found in the current experiment (P=0.45). The non-
significant responses in this experiment may be because the ewes were not fed a high-salt diet
after parturition, as the findings with rats have been obtained when animals were exposed to
high salt early in their postnatal life (Smriga et al. 2002). Another explanation is that the level
of ‘high salt’ in the current experiment was higher compared to previous work in the literature
(13% compared with 3%). Therefore, the preference for salt may have been increased in the
‘S lambs’ of this experiment, but because the dietary salt concentration was so high, their salt
appetite was reached with a modest increase in consumption of the 13% salt diet.
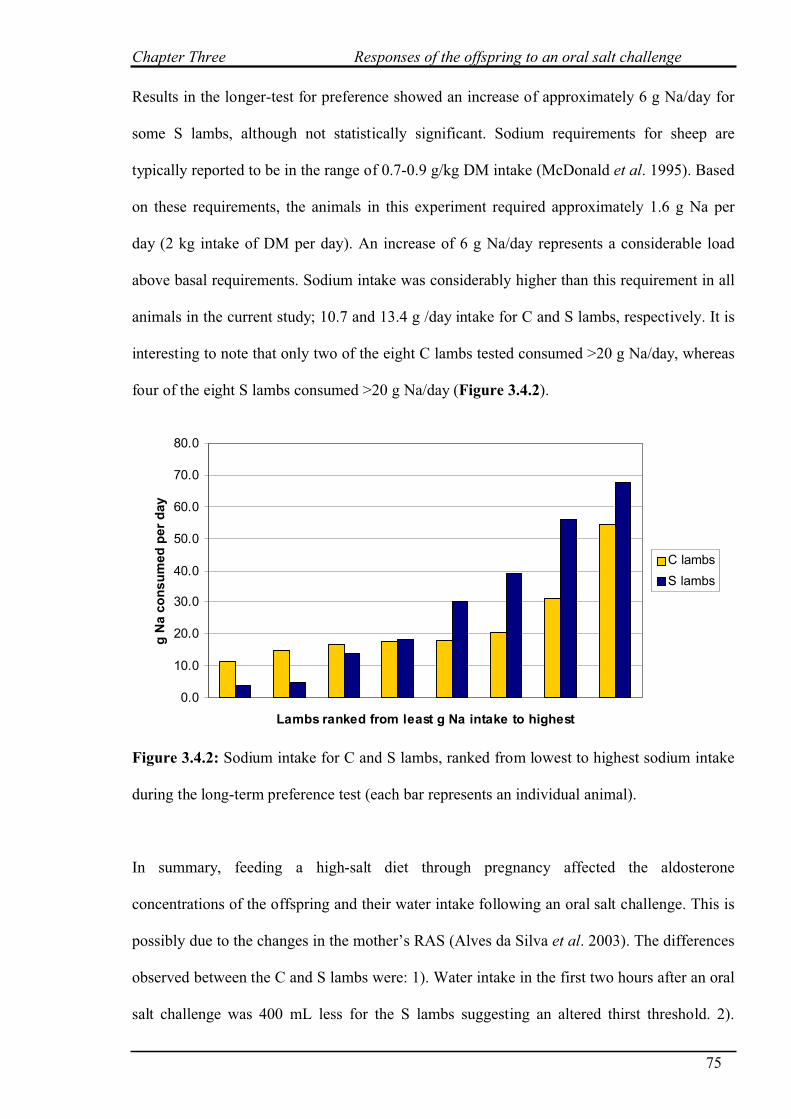
Chapter Three Responses of the offspring to an oral salt challenge
75
Results in the longer-test for preference showed an increase of approximately 6 g Na/day for
some S lambs, although not statistically significant. Sodium requirements for sheep are
typically reported to be in the range of 0.7-0.9 g/kg DM intake (McDonald et al. 1995). Based
on these requirements, the animals in this experiment required approximately 1.6 g Na per
day (2 kg intake of DM per day). An increase of 6 g Na/day represents a considerable load
above basal requirements. Sodium intake was considerably higher than this requirement in all
animals in the current study; 10.7 and 13.4 g /day intake for C and S lambs, respectively. It is
interesting to note that only two of the eight C lambs tested consumed >20 g Na/day, whereas
four of the eight S lambs consumed >20 g Na/day (Figure 3.4.2).
0.0
10.0
20.0
30.0
40.0
50.0
60.0
70.0
80.0
Lambs ranked from least g Na intake to highest
g N
a c
on
su
med
per
day
C lambs
S lambs
Figure 3.4.2: Sodium intake for C and S lambs, ranked from lowest to highest sodium intake
during the long-term preference test (each bar represents an individual animal).
In summary, feeding a high-salt diet through pregnancy affected the aldosterone
concentrations of the offspring and their water intake following an oral salt challenge. This is
possibly due to the changes in the mother’s RAS (Alves da Silva et al. 2003). The differences
observed between the C and S lambs were: 1). Water intake in the first two hours after an oral
salt challenge was 400 mL less for the S lambs suggesting an altered thirst threshold. 2).
Chapter Three Responses of the offspring to an oral salt challenge
76
Aldosterone concentrations were higher in S lambs when administered a water (control) dose
and, when administered a salt dose, the decrease in aldosterone was not as great compared to
the C lambs, possibly reflecting a lowered responsiveness to aldosterone. S lambs excreted
sodium at the same rate as C lambs however, they did not have to consume the initial high
levels of water or decrease their aldosterone concentrations to the same degree as C lambs
indicating that physiological set points and/or hormone responsiveness had been altered in
offspring by the consumption of a high-salt diet by their mothers (dams) during pregnancy.
CHAPTER FOUR:
Response of the offspring to an oral salt
challenge with restricted water intake or
to consecutive salt challenges
Chapter Four Response of the offspring to an oral salt challenge with restricted water water intake or to consecutive salt challenges
77
4.1 INTRODUCTION
Evidence from experiment two (Chapter 3) showed that lambs born to dams fed high-salt
during pregnancy (S lambs) drank approximately 400 mL less than the control (C) lambs
during the first two hours after a salt dose. This suggests that the thirst set points for the S
lambs were higher and the drive to increase water consumption immediately after the salt load
was comparatively less than for C lambs. This difference in initial water consumption may
influence urinary output and sodium excretion between C and S lambs.
Experiments with humans (Shepard et al. 1987; Lindheimer et al. 1989; Penney and Hampton
1990; Gordon et al. 1997; Evbuomwan et al. 2001; Stachenfeld and Keefe 2002; Smith et al.
2004) have shown that the thirst threshold is not fixed for an individual, but can change in
response to physiological state or dehydration. For example, during pregnancy a decreased
threshold stimulates an increase in water intake and dilution of body fluids (Lindheimer et al.
1989) that are necessary to maintain pregnancy (refer to Chapter 1, Section 1.3.1). The
control of thirst in humans is affected by sodium balance, possibly mediated via endogenous
angiotensin II (Gordon et al. 1997). Therefore, any change in the angiotensin II or other
components of RAS in S lambs in the current work may be manifested in an altered thirst
threshold and a greater capacity to deal with excess salt if access to fresh water is limited.
Previous results (Chapter 3) showed that C lambs excreted sodium at the same rate as S lambs
but their water consumption was initially higher, indicating a greater reliance on increased
water intake to deal with excess salt. Limited access to fresh water may compromise the
capacity of C lambs to excrete sodium. Thus the hypothesis tested in this chapter is that when
C and S lambs have an equal intake of fresh water, restricted to that below the voluntary
intake of C lambs over the first 6 hours post-salt challenge, S lambs can excrete sodium faster.
Chapter Four Response of the offspring to an oral salt challenge with restricted water water intake or to consecutive salt challenges
78
The differences between C and S lambs in response to a single (bolus) salt challenge (Chapter
3) were expressed over the first 4-6 hours and began to diminish over time. Indeed, by the
23-hour point, cumulative sodium excretion was the same across both groups (at
approximately 64% of the sodium dose being excreted). This raises two issues. First, it was
unexpected to find only two-thirds of a 40 g dose of NaCl excreted in urine over the course of
23 hours. Second, it may be that the differences between C and S lambs evident in the short
term do not confer any longer-term advantages to S lambs unless the challenge of salt
ingestion is maintained. Therefore in this chapter, the consequences of administering a second
dose of salt within one day were investigated. The hypothesis tested is that S lambs will be
better able to respond to a secondary dose of salt because of a greater capacity to increase
sodium excretion immediately after each oral dose.
Chapter Four Response of the offspring to an oral salt challenge with restricted water water intake or to consecutive salt challenges
79
4.2 MATERIALS AND METHODS
The same lambs that were used in the salt tolerance test in Chapter 3 were used in the
following experiments. Before each experiment animals, were placed into the metabolism
crates and given two days to allow them to adapt to the conditions. Between and during
experiments all animals were fed to 1.5 maintenance (1kg of lucerne chaff and 500 g of sheep
pellets) (8.5% crude protein; 8.5 MJ ME/kg; J.T Johnson and Sons, Kapunda, S.A.). The
animals were 8 months of age at the commencement of these experiments.
4.2.1 Salt challenge with restricted water intake
The same protocol was followed as 3.2.3 Salt tolerance test, however water intake was
restricted to a maximum of 500 mL/hr for each animal. Water intake and urine output was
measured every hour for 10 hours and then again at 23 hours. Urine samples were analysed
for sodium concentration as described in 3.2.3.1 Sodium concentration analysis.
4.2.2 Salt challenges at 0 and 8 hours
The same protocol was followed as 3.2.3 Salt tolerance test, however a second salt challenge
was administered at 8 hours. Water intake and urine output was measured at 2, 4, 6, 8, 10, 12,
14, 16 and 23 hours. Eight hours was chosen as the time for the second salt challenge because
this is when water intake and urine output has returned to baseline in the previous chapter.
Urine samples were analysed for sodium concentration as described in 3.2.3.1 Sodium
concentration analysis.
4.2.4 Statistical Analysis
Salt challenge with restricted water intake
The data were analysed using Genstat 8th
Edition. The model used was a mixed model as it
contained both fixed and random effects (Table 4.2.4).
Chapter Four Response of the offspring to an oral salt challenge with restricted water water intake or to consecutive salt challenges
80
For a given transformed response variable y the full model equation was
euµy ++=
where µ represents a vector of fixed effects, u represents a vector of random effects and e a
random error term.
Each of the fixed effects was tested using a variance ratio statistic obtained from the Mean
Square of the fixed effect of interest divided by the Residual Mean Square for that strata of
the ANOVA table. Interactions that were not significant were removed from the model. Most
of the data had to be transformed to meet the assumptions of the model; outliers were replaced
with missing values. These transformations are listed below:
Water intake: Arcsin transformation;
Urinary output: Square root transformation minus 3 outliers;
Sodium excretion: Square root transformation minus 13 outliers
Table 4.2.4: Fixed and Random effects
Variable Description
Lambs Random factor (blocking factor)
Time Random factor (blocking factor) nested in lambs
Days Random factor (blocking factor) nested in days
Lamb group Treatment fixed factor (salt or control)
Challenge Treatment fixed factor (salty or water)
Days Treatment fixed factor (1 or 2)
Order Treatment fixed factor (which drench was received first
Time Treatment fixed factor (2, 4, 6, 8, 10 and 23 hours)
Chapter Four Response of the offspring to an oral salt challenge with restricted water water intake or to consecutive salt challenges
81
Salt challenge at 0 and 8 hours
In the double dose experiment the data were analysed using the model above. However, due
to the abundance of zero values at specific time points for water and/or urine output following
the water (control) dose, data were only analysed for the salt challenge. Most of the data had
to be transformed to meet the assumptions of the model; outliers were replaced with missing
values. These transformations are listed below:
Water intake: Square root transformation minus one outlier;
Urinary output: No transformation required minus four outliers;
Sodium excretion: No transformation but minus six outliers.
As data were analysed for the salt challenge only, the fixed effects sub-model was
lkiijl TOMµ **=
where 2,1=i (No. of Lamb group); 2,1=k (No. of Orders); tl ,...2,1= (No. of Times).
The random effects for the sub-model can be expressed as
alaalu γα +=
where 24,...,2,1=a (No. of lambs); tl ,...,2,1= (No. of times). These random effects have
assumed distributions:
),0(~ ασα Na : Random effect associated with lambs
),0(~ γσγ Nal : Random effect associated with times nested in lambs.
All data in tables and figures are presented as untransformed values, even though the
statistical analysis may have required transformation as described above.
4.2.5 Ethics
The University of Adelaide’s Animal Ethics Committee approved the experiments. Approval
Number: S-99-2004
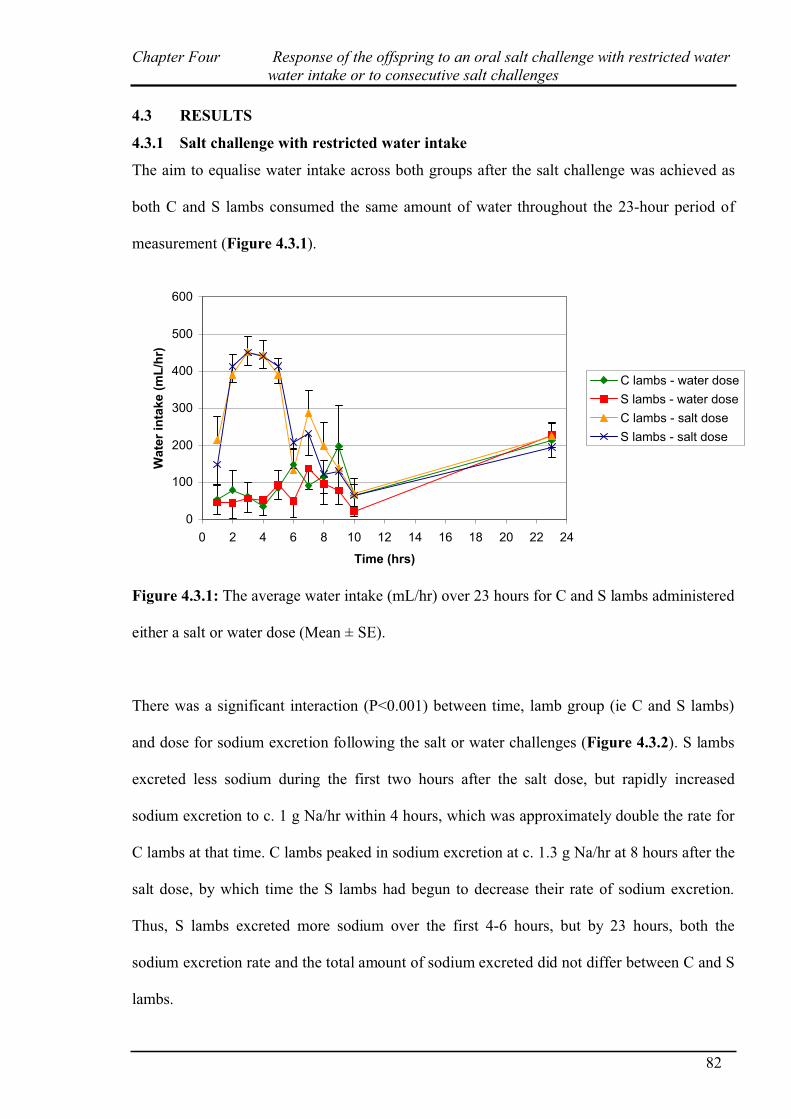
Chapter Four Response of the offspring to an oral salt challenge with restricted water water intake or to consecutive salt challenges
82
4.3 RESULTS
4.3.1 Salt challenge with restricted water intake
The aim to equalise water intake across both groups after the salt challenge was achieved as
both C and S lambs consumed the same amount of water throughout the 23-hour period of
measurement (Figure 4.3.1).
0
100
200
300
400
500
600
0 2 4 6 8 10 12 14 16 18 20 22 24
Time (hrs)
Wa
ter
inta
ke
(m
L/h
r)
C lambs - water dose
S lambs - water dose
C lambs - salt dose
S lambs - salt dose
Figure 4.3.1: The average water intake (mL/hr) over 23 hours for C and S lambs administered
either a salt or water dose (Mean ± SE).
There was a significant interaction (P<0.001) between time, lamb group (ie C and S lambs)
and dose for sodium excretion following the salt or water challenges (Figure 4.3.2). S lambs
excreted less sodium during the first two hours after the salt dose, but rapidly increased
sodium excretion to c. 1 g Na/hr within 4 hours, which was approximately double the rate for
C lambs at that time. C lambs peaked in sodium excretion at c. 1.3 g Na/hr at 8 hours after the
salt dose, by which time the S lambs had begun to decrease their rate of sodium excretion.
Thus, S lambs excreted more sodium over the first 4-6 hours, but by 23 hours, both the
sodium excretion rate and the total amount of sodium excreted did not differ between C and S
lambs.
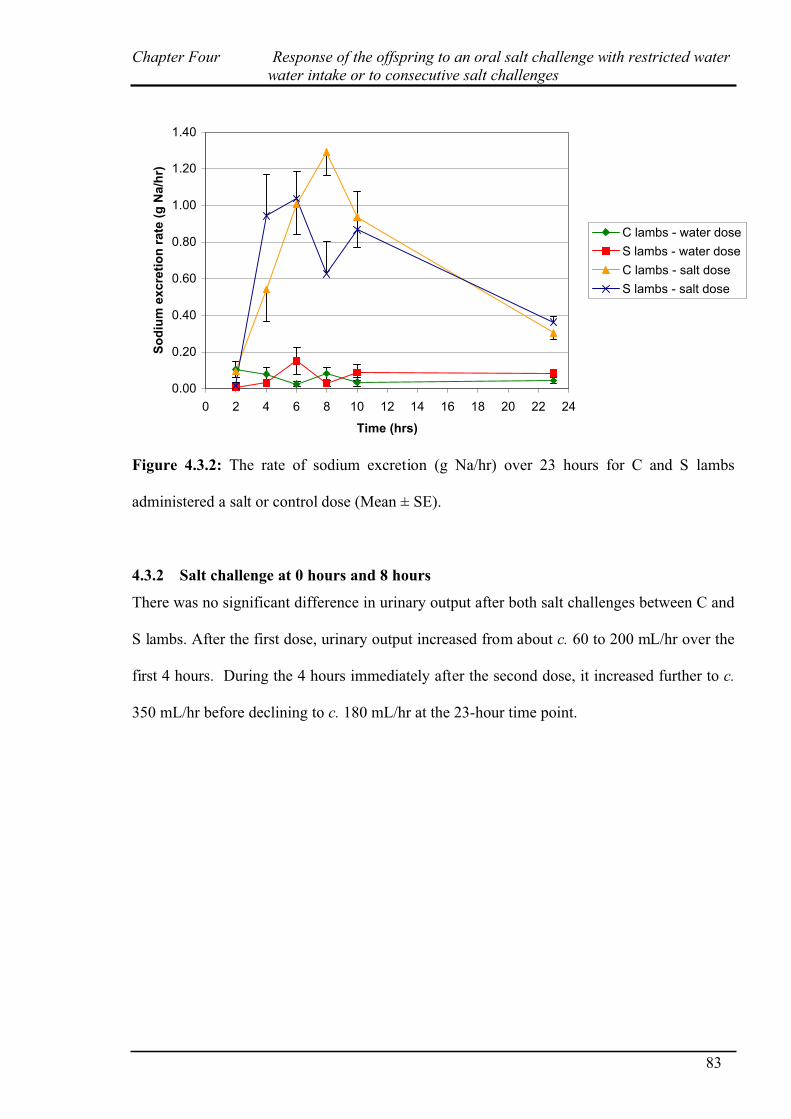
Chapter Four Response of the offspring to an oral salt challenge with restricted water water intake or to consecutive salt challenges
83
0.00
0.20
0.40
0.60
0.80
1.00
1.20
1.40
0 2 4 6 8 10 12 14 16 18 20 22 24
Time (hrs)
So
diu
m e
xcre
tio
n r
ate
(g
Na/h
r)
C lambs - water dose
S lambs - water dose
C lambs - salt dose
S lambs - salt dose
Figure 4.3.2: The rate of sodium excretion (g Na/hr) over 23 hours for C and S lambs
administered a salt or control dose (Mean ± SE).
4.3.2 Salt challenge at 0 hours and 8 hours
There was no significant difference in urinary output after both salt challenges between C and
S lambs. After the first dose, urinary output increased from about c. 60 to 200 mL/hr over the
first 4 hours. During the 4 hours immediately after the second dose, it increased further to c.
350 mL/hr before declining to c. 180 mL/hr at the 23-hour time point.

Chapter Four Response of the offspring to an oral salt challenge with restricted water water intake or to consecutive salt challenges
84
0
50
100
150
200
250
300
350
400
450
500
0 2 4 6 8 10 12 14 16 18 20 22 24
Time (hrs)
Av
era
ge
uri
na
ry o
utp
ut
(mL
/hr)
C lambs - water dose
S lambs - water dose
C lambs - salt dose
S lambs - salt dose
First dose Second dose
Figure 4.3.2.1: The average urinary output (mL/hr) over 23 hours for C and S lambs
administered either a salt or water dose. Arrows indicate the timing of the two salt doses
(Mean ± SE).
Sodium excretion (g/hr) reflected the pattern of urinary output. There was an interaction
between lamb group (ie C and S lambs) and time (P=0.08) on sodium excretion caused by the
lower sodium excretion at 8 hours for C lambs in comparison to S lambs. After the second
salt challenge there was a marked increase in the rate of sodium excretion for both C and S
lambs, a pattern that was the same for C and S lambs (Figure 4.3.2.2). This equal sodium
excretion rate was achieved even though S lambs had a tendency to produce less urine
between 10 and 23 hours (Figure 4.3.2.1), which indicates that S lambs had a more
concentrated urinary output (Figure. 4.3.2.3).
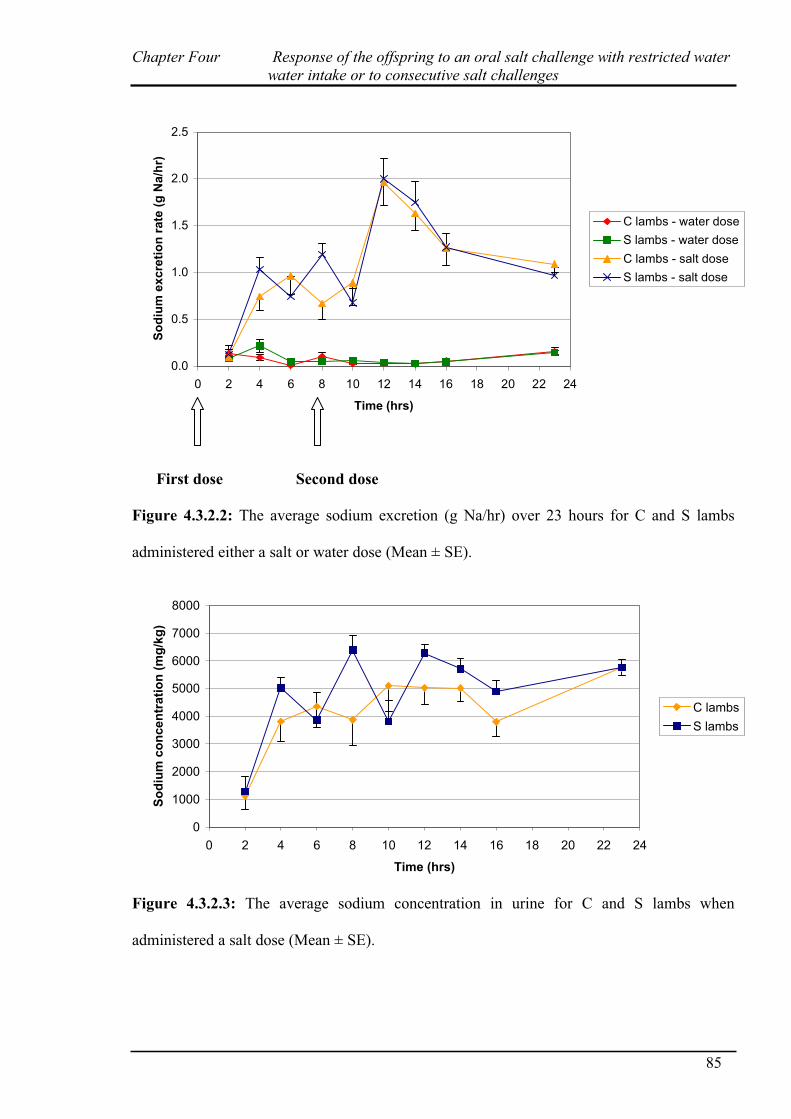
Chapter Four Response of the offspring to an oral salt challenge with restricted water water intake or to consecutive salt challenges
85
0.0
0.5
1.0
1.5
2.0
2.5
0 2 4 6 8 10 12 14 16 18 20 22 24
Time (hrs)
So
diu
m e
xc
reti
on
ra
te (
g N
a/h
r)
C lambs - water dose
S lambs - water dose
C lambs - salt dose
S lambs - salt dose
First dose Second dose
Figure 4.3.2.2: The average sodium excretion (g Na/hr) over 23 hours for C and S lambs
administered either a salt or water dose (Mean ± SE).
0
1000
2000
3000
4000
5000
6000
7000
8000
0 2 4 6 8 10 12 14 16 18 20 22 24
Time (hrs)
So
diu
m c
on
cen
trati
on
(m
g/k
g)
C lambs
S lambs
Figure 4.3.2.3: The average sodium concentration in urine for C and S lambs when
administered a salt dose (Mean ± SE).
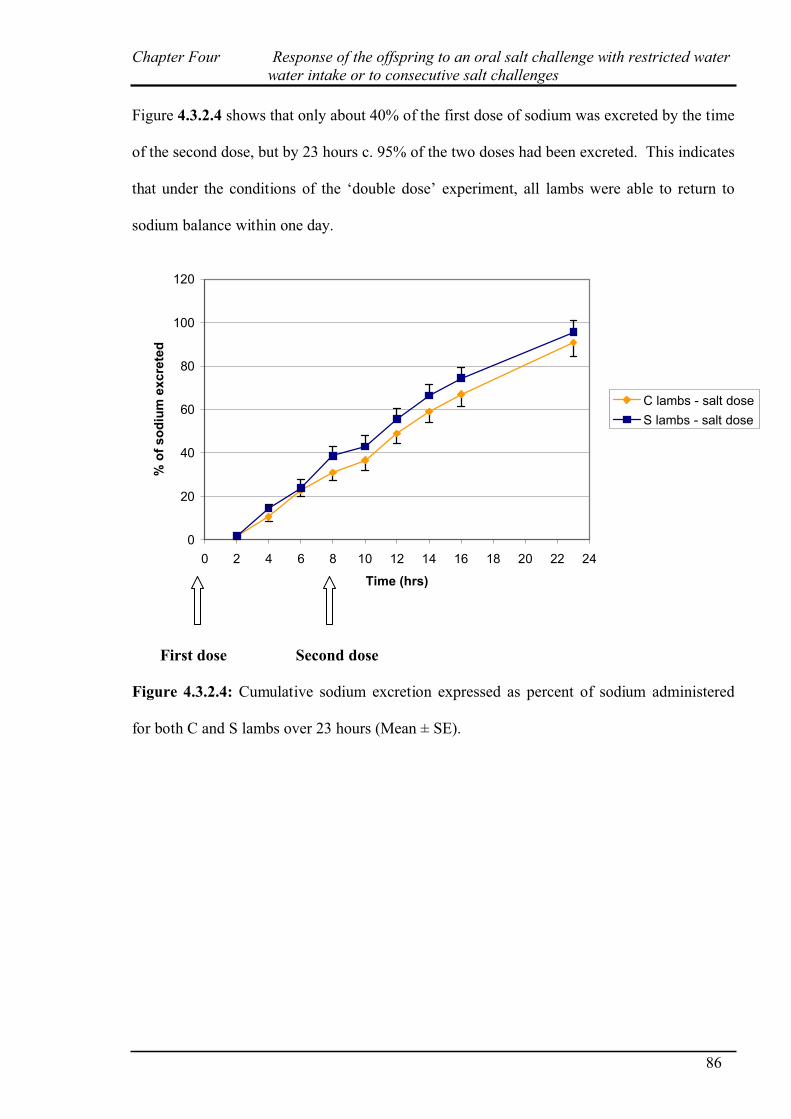
Chapter Four Response of the offspring to an oral salt challenge with restricted water water intake or to consecutive salt challenges
86
Figure 4.3.2.4 shows that only about 40% of the first dose of sodium was excreted by the time
of the second dose, but by 23 hours c. 95% of the two doses had been excreted. This indicates
that under the conditions of the ‘double dose’ experiment, all lambs were able to return to
sodium balance within one day.
0
20
40
60
80
100
120
0 2 4 6 8 10 12 14 16 18 20 22 24
Time (hrs)
% o
f so
diu
m e
xcre
ted
C lambs - salt dose
S lambs - salt dose
First dose Second dose
Figure 4.3.2.4: Cumulative sodium excretion expressed as percent of sodium administered
for both C and S lambs over 23 hours (Mean ± SE).
Chapter Four Response of the offspring to an oral salt challenge with restricted water water intake or to consecutive salt challenges
87
4.4 DISCUSSION
The first hypothesis of this Chapter can be accepted because restricting the water intake of the
C lambs below their ad libitum intake of fresh water over the first few hours reduced their
short-term (2-4 hours) capacity to excrete sodium. Therefore, the S lambs appeared to have a
physiological advantage during the first 4-6 hours after the oral salt dose. When C and S
sheep both had free access to fresh water in Chapter 3, this advantage was not apparent.
These data suggest that (i) when sheep are consuming a high-salt diet and not able to regularly
consume fresh water immediately after ingesting the salt, S lambs may be better able to cope;
and (ii) if fresh water is freely available, over time and in close proximity, then the differences
between C and S sheep may not be apparent.
The observed short-term increase in excreting the salt load for S lambs indicates a greater
capacity to rapidly increase the sodium concentration in urine (5500 vs 4000 mg Na/kg urine).
This could possibly be due to decreased reabsorption of sodium, fewer renal receptors for
AVP, or an altered distribution of aquaporins in the tubules. These possibilities will now be
discussed briefly.
The amplitude of the cortico-medullary gradient governs the final urine concentration and is
generated by the counter current multipliers of the descending and ascending limbs of the
loop of Henle (de Rouffignac 2001). An increase in the length of the loop of Henle is likely to
increase the hypertonicity of the solution in the tubules. An example of this change in
architecture is found in desert animals which produce extremely concentrated urine, and
evidence shows that a correlation exists between the length of the thin limb and the ability to
concentrate urine (Mbassa 1988). Therefore the longer the loop of Henle, the more efficient
retention of water and the more concentrated urine is produced by building an osmotic
gradient along the extended loop of Henle (Shanas and Haim 2004). There is also evidence
Chapter Four Response of the offspring to an oral salt challenge with restricted water water intake or to consecutive salt challenges
88
that dietary salt concentration can influence the area of short and long loops of the medullary
thick ascending limb in rat kidneys (Stillman et al. 1994). In addition to morphological
changes, dietary salt is known to cause physiological changes in the kidney, such as
medullary osmolality, endothelin production (Herrara and Garvin 2005) and expression of
endothelial nitric oxide synthase (Mattson and Higgins 1996). These changes may be
involved in the adaptive responses to a dietary salt load. It remains to be tested if such
changes noted in other species also occur in sheep and if any of these characteristics may be
altered by the foetal environment associated with high-salt feeding during pregnancy.
Higher aldosterone concentrations observed in S lambs (Chapter 3) could reflect a lowered
responsiveness to aldosterone. Aldosterone promotes sodium reabsorption so the lowered
responsiveness to aldosterone results in a decreased reabsorption of sodium in the kidney, and
higher concentrations of sodium in the urine immediately after a single dose of NaCl.
Another important factor in determining the sodium concentration of urine is AVP. When
AVP concentrations are increased, the final urinary output is hypertonic as the kidneys retain
as much water as possible to compensate for a deficit in body water. No differences were
observed between AVP concentrations for the C and S lambs in Chapter 3, but the number of
receptors for AVP may have differed. If receptors for AVP were lower in the S lambs there
would be a decreased reabsorption of water from the loop of Henle, resulting in a more
concentrated urinary output. Park et al. (1998) found that vasopressin V2 receptor (V2R)
mRNA decreased in a time dependent manner in the cortex and medulla through 48 hours of
water restriction in rats. Their data suggested that water restriction leads to a regional time-
dependent down-regulation of V2R mRNA and protein within the rat kidney allowing for
maximisation of concentrating urine and minimising water loss. The current experiment did
not measure AVP receptors, so it is not possible to confirm if receptor numbers or their
Chapter Four Response of the offspring to an oral salt challenge with restricted water water intake or to consecutive salt challenges
89
binding affinity were down regulated when water was restricted, or whether differences
existed between C and S lambs.
Another possible explanation for a higher urinary sodium concentration is a decreased
expression of aquaporin 2 in S lambs. Aquaporin 2 plays a pivotal role in renal water
regulation. An example of changes in aquaporin 2 expression without differences in AVP
concentration is shown in a study by Ohara et al. (1998). They found that AVP concentration
in pregnant rats did not differ significantly from non-pregnant rats but the mRNA of
aquaporin 2 was increased in pregnancy, as was aquaporin 2 protein. This indicated that up-
regulation of AQP2 contributes to water retention during pregnancy even though AVP
remains unchanged. Therefore hormonal changes associated with pregnancy appear to
influence AQP2 expression without influencing AVP concentration. It remains to be tested if
the changes induced by feeding a high-salt diet during pregnancy, such as an alteration in the
ewes’ RAS system, may cause similar changes in renal aquaporin 2 expression in the
offspring.
A practical implication of an adaptation that allows a rapid increase in the renal capacity to
concentrate sodium in urine is that if fresh water is limited when animals are grazing high-salt
forages (eg brackish water, or if fresh water is distant from foraging sites), ‘adapted’ animals
may (i) be able to consume more feed before needing to stop and drink or (ii) take longer to
reach their salt limit and thus maintain intake and liveweight above ‘control’ animals. Further
experiments are required and warranted to quantify any practical benefits.
A marked difference between field conditions with sheep grazing high-salt forages and both
the first experiment in this chapter and the preceding experiment in Chapter 3 is that in the
former case, sheep receive a near-continuous salt ‘challenge’ rather than a moderately-sized,
Chapter Four Response of the offspring to an oral salt challenge with restricted water water intake or to consecutive salt challenges
90
one-off dose. The second experiment in this chapter was designed to test the effects of two
salt challenges within 8 hours of each other (with free access to fresh water). This showed,
consistent with the first experiment of this chapter, that S lambs excrete more sodium over the
first 4 hours after one dose but, after the second dose, sodium excretion was identical.
Therefore, the second hypothesis for this experiment is rejected. This suggests that any benefit
conferred to S lambs in terms of adaptability to salt ingestion will only be evident in the
immediate short-term, and that under conditions of repeated (or continual) oral salt
‘challenge’, all sheep (C and S lambs) have virtually the same capacity to excrete excess
sodium. The consequences of a continual salt challenge (rather than two separate doses as
used here), combined with a limited capacity to consume more water to maintain salt balance,
will be investigated further in the next chapter.
CHAPTER FIVE:
Response of the offspring to salty
drinking water
Chapter Five Response of the offspring to salty drinking water
91
5.1 INTRODUCTION
In Chapter 3 it was found that C lambs and S lambs excreted sodium after an oral salt dose at
the same rate, but the immediate increase in water consumption was less in S lambs than C
lambs. S lambs also exhibited a smaller decrease in aldosterone concentration after the salt
dose, indicative of a lowered responsiveness to aldosterone. In Chapter 4 it was found that
limiting access to fresh water resulted in S lambs excreting sodium faster over the first 8
hours, suggesting that S lambs have a greater renal capacity to concentrate sodium in the
urine. To further investigate whether S lambs do indeed have a greater capacity to concentrate
sodium, a salt load was administered in the following experiment by replacing fresh drinking
water with salty water (1.5% NaCl). This methodology was used in an attempt to restrict the
opportunity for the animals to consume more water to reduce the osmolality of body fluids
and promote the mechanisms that concentrate sodium in the urine. Thus the focus was on
comparing renal capacities of the C and S lambs.
Peirce (1957) indicated that a NaCl concentration of 1.0% in drinking water had no adverse
effects on sheep in terms of body weight or feed intake. A small proportion of sheep in the
study where affected by 1.5% NaCl and all sheep in the study were affected by 2.0% NaCl, as
evidenced by a decline in food consumption and body weight with those receiving the 2.0%
NaCl becoming emaciated and weak. As the NaCl concentration in drinking water increases
to 1.5%, the intake of water also increases (Peirce 1957; Potter 1961; Wilson 1966), as does
the excretion of urine (Peirce 1957; Potter 1961). Potter (1961) found that the glomerular
filtration rate and filtration fraction increased, together with a slight reduction in effective
renal plasma flow for sheep exposed to 1.3% NaCl in the drinking water. This suggested that
the sheep had efficient renal mechanisms for the rapid elimination of excess sodium chloride.
Potter (1961) hypothesized that the increased glomerular filtration rate was probably the result
of either an increase in the number of functioning glomeruli or an increased hydrostatic
Chapter Five Response of the offspring to salty drinking water
92
glomerular pressure resulting from an increase in arterial blood pressure. Potter (1963)
investigated this hypothesis and found that the prolonged ingestion of 1.3% NaCl did not
induce an increase in the number of active tubules in the kidneys. However it confirmed that
the elimination of additional salt is accomplished by a reduction of reabsorption in individual
nephrons.
An increased renal capacity in S lambs would likely be beneficial when sheep are grazing
halophytic plants. Animals may have a greater feed intake if salt could be excreted at faster
rates. Further, if access to fresh water was limited, salt excretion would not be jeopardized as
much compared to the animals that are more reliant on increased water consumption to deal
with an excess salt load. In the following experiment the hypothesis tested was that lambs
born to mothers fed high salt during pregnancy (S lambs) are able to excrete sodium faster
after a 48-hour oral salt load in the drinking water. In addition to urinary and sodium
excretion, water intake and feed intake were also measured.
Chapter Five Response of the offspring to salty drinking water
93
5.2 MATERIALS AND METHODS
5.2.1 Salt tolerance test using salt water (1.5% NaCl)
The 24 lambs used in this experiment were the same lambs used in Chapters 3 and 4. The age
of the animals at the commencement of these experiments was 10 months. Prior to the
treatment being applied, all lambs were placed in metabolism crates for two days for
adaptation and on the second day catheters were inserted into the jugular vein for blood
sampling. The catheters were flushed with heparin saline solution (1000 IU heparin/mL) after
each sample. Twelve lambs (six C lambs and six S lambs) were offered ad libitum amounts of
drinking water containing 1.5% NaCl and a conventional feed (sheep pellets; 8.5% crude
protein 8.5 MJ ME/kg; J.T Johnson and Sons, Kapunda, S.A.) for two consecutive days.
Blood and urine samples were collected at 0, 2, 4, 8, 20, 24, 28, 32, 44 and 48 hours. Water
and feed were measured at 0.5, 1, 1.5, 2, 4, 8, 20, 24, 28, 32, 44 and 48 hours. The experiment
was then repeated on the remaining 12 lambs.
5.2.2 Statistical analysis
The data were analysed in S-PLUS 6.2 (Insightful Inc.) using a package called Spatial
Analysis of Mixed Models. For a given transformed response variable y the full model
equation is
euµy ++= (1)
where µ represents a vector of fixed effects, u represents a vector of random effects and e a
random error term. This is a mixed model as it contains both fixed and random effects.
The fixed effects component of (1), µ , can be expressed as
liil TMµ *= (2)
where 2,1=i (No. of Lamb group); tl ,...2,1= (No. of Times). The random effects component
of (1), u , can be expressed as
aau α= (3)
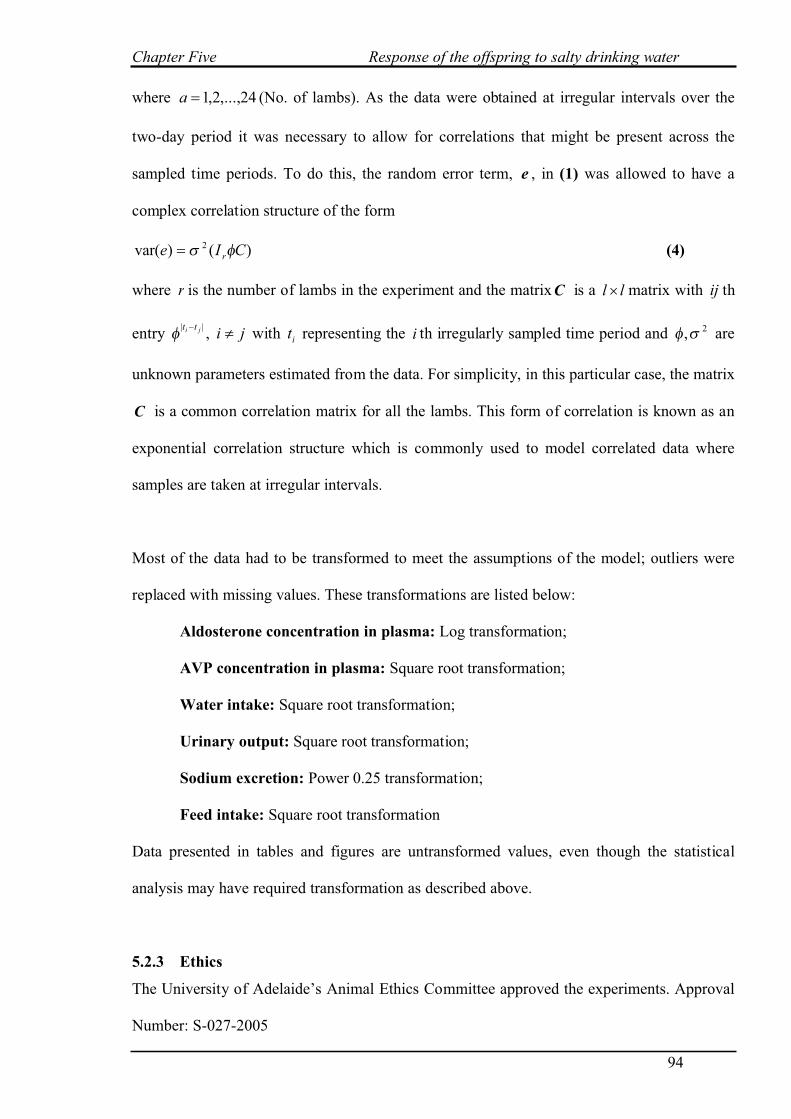
Chapter Five Response of the offspring to salty drinking water
94
where 24,...,2,1=a (No. of lambs). As the data were obtained at irregular intervals over the
two-day period it was necessary to allow for correlations that might be present across the
sampled time periods. To do this, the random error term, e , in (1) was allowed to have a
complex correlation structure of the form
)()var( 2 CIe rφσ= (4)
where r is the number of lambs in the experiment and the matrixC is a ll × matrix with ij th
entry |tt| ji −φ , ji ≠ with it representing the i th irregularly sampled time period and 2,σφ are
unknown parameters estimated from the data. For simplicity, in this particular case, the matrix
C is a common correlation matrix for all the lambs. This form of correlation is known as an
exponential correlation structure which is commonly used to model correlated data where
samples are taken at irregular intervals.
Most of the data had to be transformed to meet the assumptions of the model; outliers were
replaced with missing values. These transformations are listed below:
Aldosterone concentration in plasma: Log transformation;
AVP concentration in plasma: Square root transformation;
Water intake: Square root transformation;
Urinary output: Square root transformation;
Sodium excretion: Power 0.25 transformation;
Feed intake: Square root transformation
Data presented in tables and figures are untransformed values, even though the statistical
analysis may have required transformation as described above.
5.2.3 Ethics
The University of Adelaide’s Animal Ethics Committee approved the experiments. Approval
Number: S-027-2005
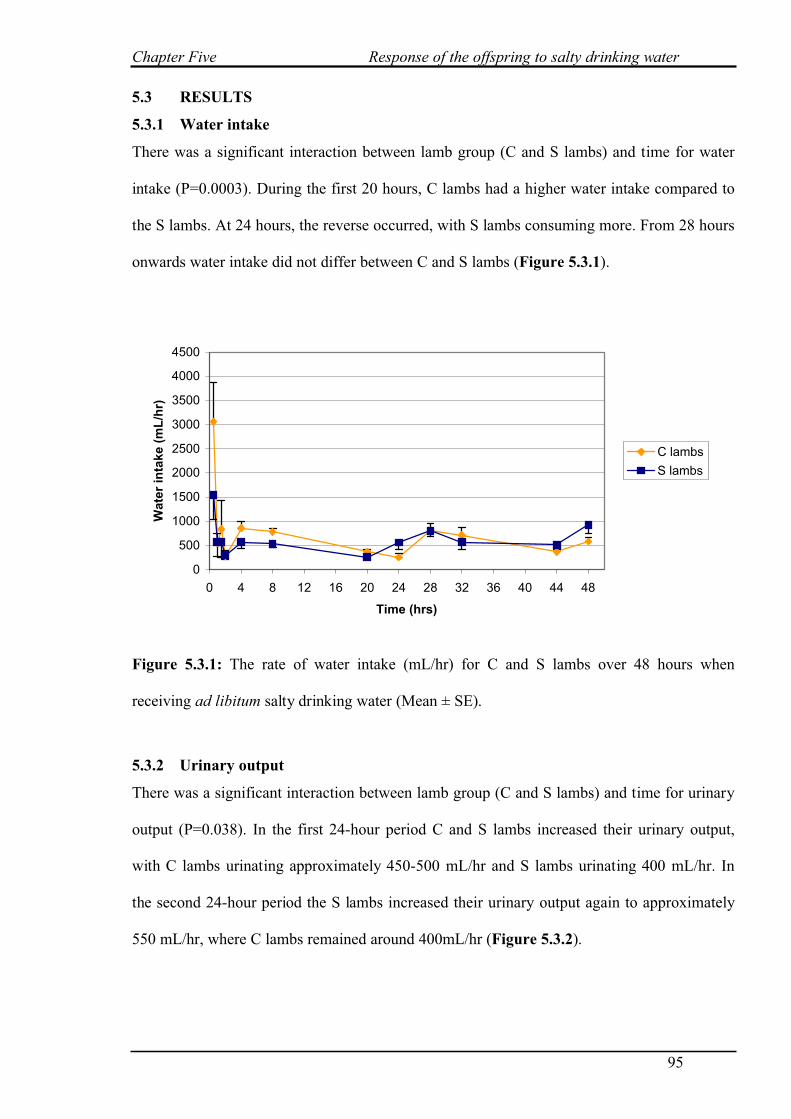
Chapter Five Response of the offspring to salty drinking water
95
5.3 RESULTS
5.3.1 Water intake
There was a significant interaction between lamb group (C and S lambs) and time for water
intake (P=0.0003). During the first 20 hours, C lambs had a higher water intake compared to
the S lambs. At 24 hours, the reverse occurred, with S lambs consuming more. From 28 hours
onwards water intake did not differ between C and S lambs (Figure 5.3.1).
0
500
1000
1500
2000
2500
3000
3500
4000
4500
0 4 8 12 16 20 24 28 32 36 40 44 48
Time (hrs)
Wate
r in
take (
mL
/hr)
C lambs
S lambs
Figure 5.3.1: The rate of water intake (mL/hr) for C and S lambs over 48 hours when
receiving ad libitum salty drinking water (Mean ± SE).
5.3.2 Urinary output
There was a significant interaction between lamb group (C and S lambs) and time for urinary
output (P=0.038). In the first 24-hour period C and S lambs increased their urinary output,
with C lambs urinating approximately 450-500 mL/hr and S lambs urinating 400 mL/hr. In
the second 24-hour period the S lambs increased their urinary output again to approximately
550 mL/hr, where C lambs remained around 400mL/hr (Figure 5.3.2).
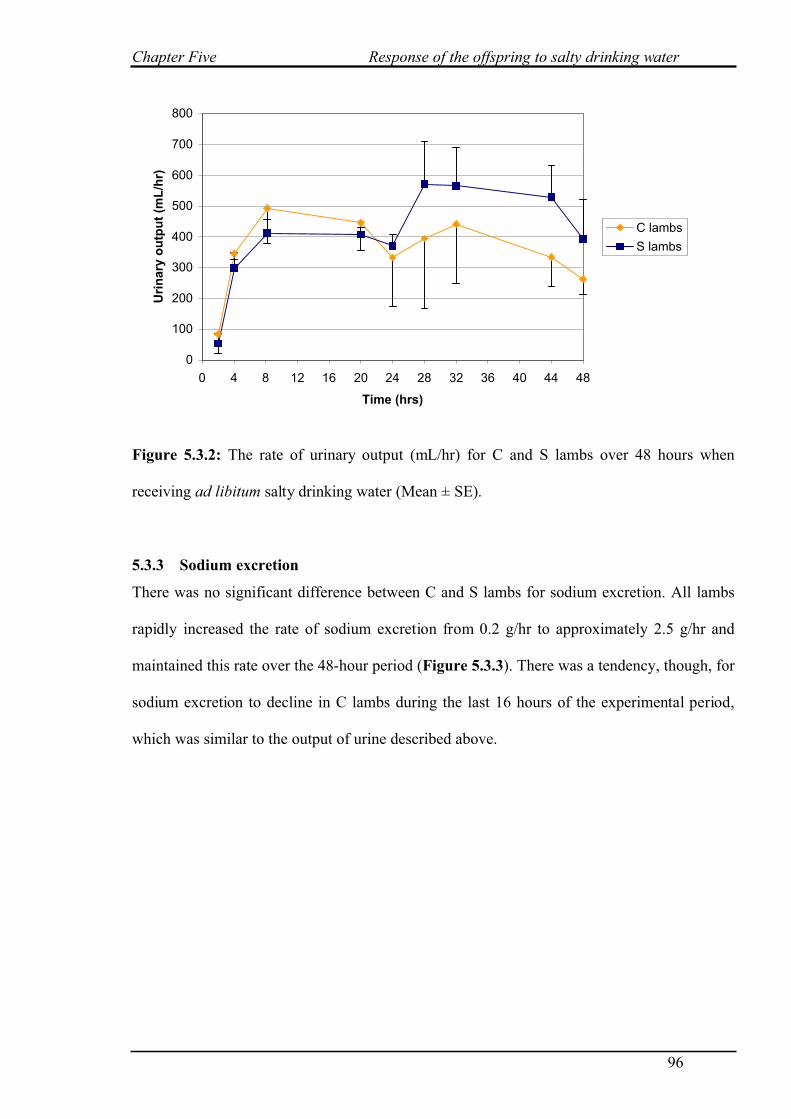
Chapter Five Response of the offspring to salty drinking water
96
0
100
200
300
400
500
600
700
800
0 4 8 12 16 20 24 28 32 36 40 44 48
Time (hrs)
Uri
na
ry o
utp
ut
(mL
/hr)
C lambs
S lambs
Figure 5.3.2: The rate of urinary output (mL/hr) for C and S lambs over 48 hours when
receiving ad libitum salty drinking water (Mean ± SE).
5.3.3 Sodium excretion
There was no significant difference between C and S lambs for sodium excretion. All lambs
rapidly increased the rate of sodium excretion from 0.2 g/hr to approximately 2.5 g/hr and
maintained this rate over the 48-hour period (Figure 5.3.3). There was a tendency, though, for
sodium excretion to decline in C lambs during the last 16 hours of the experimental period,
which was similar to the output of urine described above.
Chapter Five Response of the offspring to salty drinking water
97
0.0
0.5
1.0
1.5
2.0
2.5
3.0
3.5
4.0
0 4 8 12 16 20 24 28 32 36 40 44 48
Time (hrs)
So
diu
m e
xcre
ted
(g
Na/h
r)
C lambs
S lambs
Figure 5.3.3: The rate of sodium excretion (g Na/hr) for C and S lambs over 48 hours when
receiving ad libitum salty drinking water (Mean ± SE).
5.3.4 Feed Intake
There is a significant difference between C and S lambs for feed intake (P=0.009). After one
hour of offering salty water, feed intake dropped severely from c. 800 g/hr to approximately
100 g/hr for both C and S lambs. On average over the two days, S lambs had a voluntary feed
intake 35% lower than C lambs (0.89 kg/day vs. 1.36 kg/day). Data presented in Figure 5.3.4
has excluded the first hour of feed intake and shows the average daily intake for C and S
lambs for each of the two days.
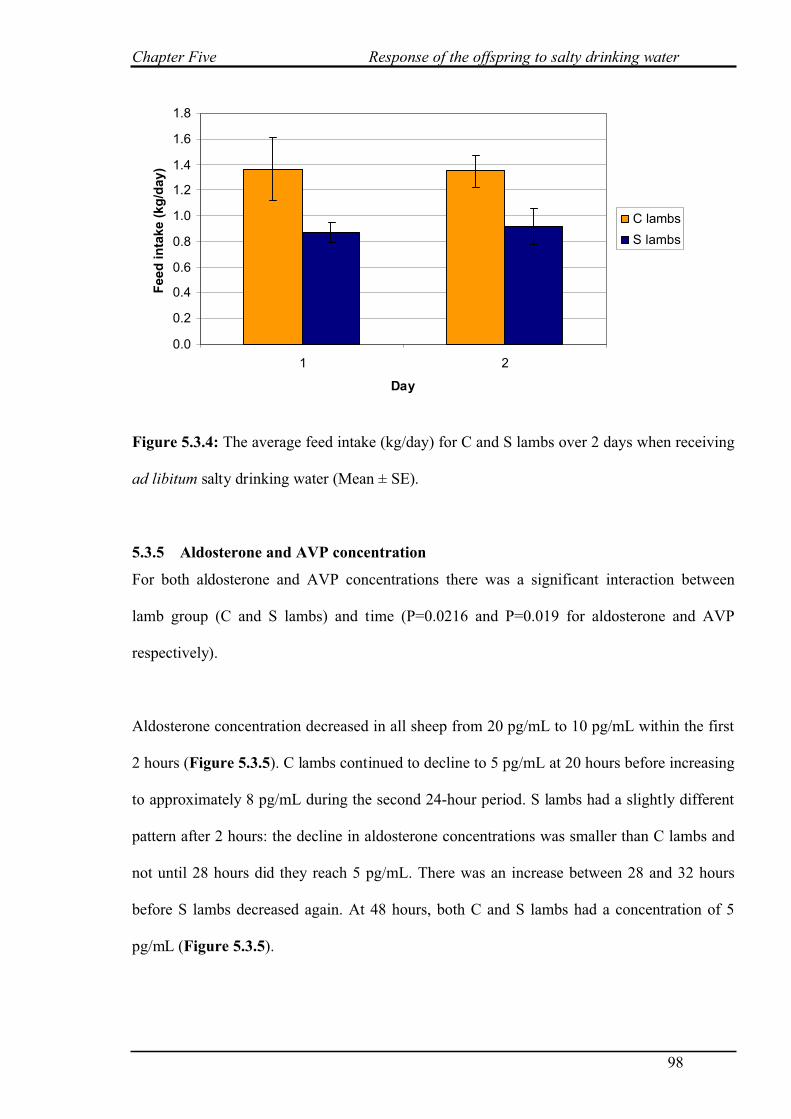
Chapter Five Response of the offspring to salty drinking water
98
0.0
0.2
0.4
0.6
0.8
1.0
1.2
1.4
1.6
1.8
1 2
Day
Feed
in
take (
kg
/day)
C lambs
S lambs
Figure 5.3.4: The average feed intake (kg/day) for C and S lambs over 2 days when receiving
ad libitum salty drinking water (Mean ± SE).
5.3.5 Aldosterone and AVP concentration
For both aldosterone and AVP concentrations there was a significant interaction between
lamb group (C and S lambs) and time (P=0.0216 and P=0.019 for aldosterone and AVP
respectively).
Aldosterone concentration decreased in all sheep from 20 pg/mL to 10 pg/mL within the first
2 hours (Figure 5.3.5). C lambs continued to decline to 5 pg/mL at 20 hours before increasing
to approximately 8 pg/mL during the second 24-hour period. S lambs had a slightly different
pattern after 2 hours: the decline in aldosterone concentrations was smaller than C lambs and
not until 28 hours did they reach 5 pg/mL. There was an increase between 28 and 32 hours
before S lambs decreased again. At 48 hours, both C and S lambs had a concentration of 5
pg/mL (Figure 5.3.5).
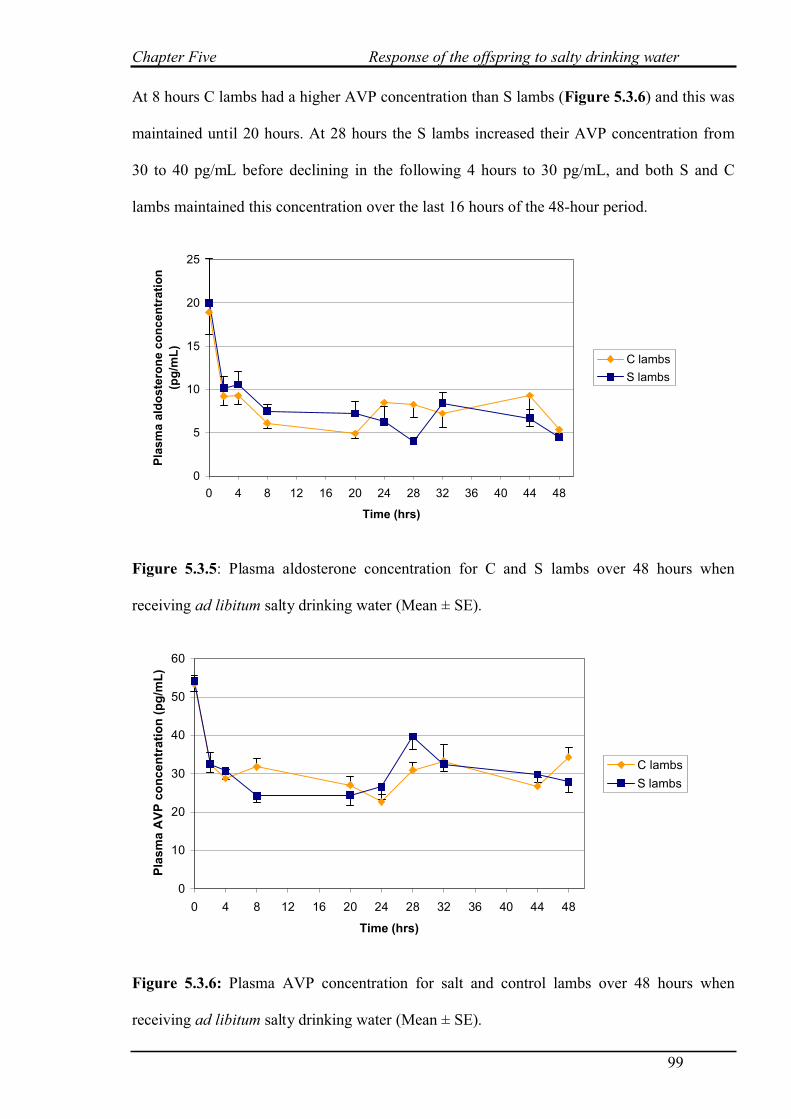
Chapter Five Response of the offspring to salty drinking water
99
At 8 hours C lambs had a higher AVP concentration than S lambs (Figure 5.3.6) and this was
maintained until 20 hours. At 28 hours the S lambs increased their AVP concentration from
30 to 40 pg/mL before declining in the following 4 hours to 30 pg/mL, and both S and C
lambs maintained this concentration over the last 16 hours of the 48-hour period.
0
5
10
15
20
25
0 4 8 12 16 20 24 28 32 36 40 44 48
Time (hrs)
Pla
sm
a a
ldo
ste
ron
e c
on
ce
ntr
ati
on
(pg
/mL
)
C lambs
S lambs
Figure 5.3.5: Plasma aldosterone concentration for C and S lambs over 48 hours when
receiving ad libitum salty drinking water (Mean ± SE).
0
10
20
30
40
50
60
0 4 8 12 16 20 24 28 32 36 40 44 48
Time (hrs)
Pla
sm
a A
VP
co
nc
en
tra
tio
n (
pg
/mL
)
C lambs
S lambs
Figure 5.3.6: Plasma AVP concentration for salt and control lambs over 48 hours when
receiving ad libitum salty drinking water (Mean ± SE).
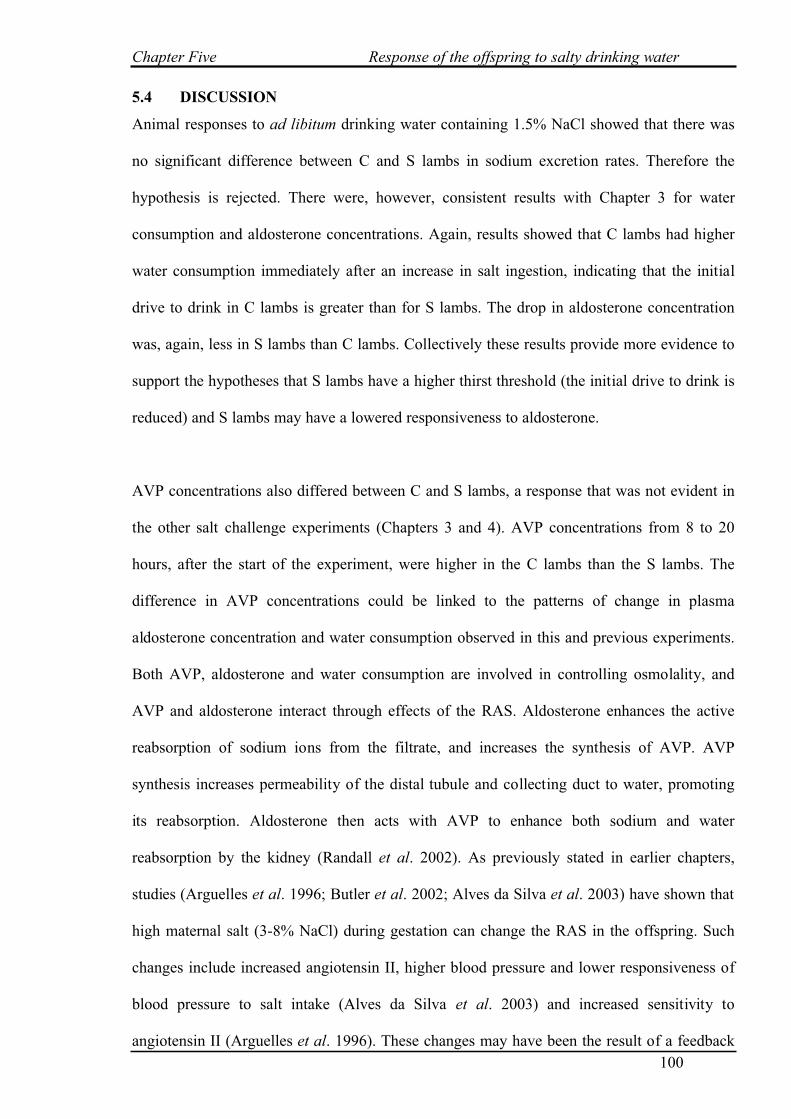
Chapter Five Response of the offspring to salty drinking water
100
5.4 DISCUSSION
Animal responses to ad libitum drinking water containing 1.5% NaCl showed that there was
no significant difference between C and S lambs in sodium excretion rates. Therefore the
hypothesis is rejected. There were, however, consistent results with Chapter 3 for water
consumption and aldosterone concentrations. Again, results showed that C lambs had higher
water consumption immediately after an increase in salt ingestion, indicating that the initial
drive to drink in C lambs is greater than for S lambs. The drop in aldosterone concentration
was, again, less in S lambs than C lambs. Collectively these results provide more evidence to
support the hypotheses that S lambs have a higher thirst threshold (the initial drive to drink is
reduced) and S lambs may have a lowered responsiveness to aldosterone.
AVP concentrations also differed between C and S lambs, a response that was not evident in
the other salt challenge experiments (Chapters 3 and 4). AVP concentrations from 8 to 20
hours, after the start of the experiment, were higher in the C lambs than the S lambs. The
difference in AVP concentrations could be linked to the patterns of change in plasma
aldosterone concentration and water consumption observed in this and previous experiments.
Both AVP, aldosterone and water consumption are involved in controlling osmolality, and
AVP and aldosterone interact through effects of the RAS. Aldosterone enhances the active
reabsorption of sodium ions from the filtrate, and increases the synthesis of AVP. AVP
synthesis increases permeability of the distal tubule and collecting duct to water, promoting
its reabsorption. Aldosterone then acts with AVP to enhance both sodium and water
reabsorption by the kidney (Randall et al. 2002). As previously stated in earlier chapters,
studies (Arguelles et al. 1996; Butler et al. 2002; Alves da Silva et al. 2003) have shown that
high maternal salt (3-8% NaCl) during gestation can change the RAS in the offspring. Such
changes include increased angiotensin II, higher blood pressure and lower responsiveness of
blood pressure to salt intake (Alves da Silva et al. 2003) and increased sensitivity to
angiotensin II (Arguelles et al. 1996). These changes may have been the result of a feedback
Chapter Five Response of the offspring to salty drinking water
101
mechanism in which angiotensin II receptors were up-regulated in the foetus in response to
lower activity of the RAS in the mother (Arguelles et al. 1996; Butler et al. 2002). This
evidence provides support to the notion that changes in the mothers RAS may change
sensitivity and/or secretion of hormones in the offspring’s RAS resulting in differed responses
to high salt.
The differences observed in AVP concentrations between this experiment and previous
experiments are likely to have arisen because the salt challenge was administered via salty
drinking water rather than a single oral dose. In the previous experiments, AVP
concentrations did not need to increase because fresh water was readily available and animals
were able to consume more water to control osmolality. Without fresh water being available
in the present study, increased AVP concentrations were presumably required to increase
water reabsorption in the kidneys to help cope with the excess salt load. A study by Cowley et
al. (1986) provides evidence towards this hypothesis. Dogs fed high-salt diets with access to
readily available fresh water did not increase AVP concentrations, as the primary adaptive
mechanism was the consumption of water. However, if access to fresh water was restricted
dogs fed high-salt diets increased AVP concentrations to control osmolality of body fluids.
In the present experiment, it was also hypothesised that S lambs, if able to excrete sodium at a
faster rate, would have a higher feed intake than C lambs. The opposite response in feed
intake was found even though no difference was observed in sodium excretion. S lambs had a
voluntary feed intake 35% lower than C lambs (0.89 kg/day vs. 1.36 kg/day), which is
approximately 0.5 kg/day less than C lambs. This is the first finding that shows offspring of
dams fed high salt during pregnancy have a lower voluntary feed intake. Presumably, if this
had continued, S lambs would have decreased in liveweight and thus it is important to
determine the cause of a depressed feed intake. The immediate effect of salt on feed intake is
Chapter Five Response of the offspring to salty drinking water
102
consistent with Thomas et al. (2007) where feed intake was high during the first half hour
after a high-salt (18.5% NaCl) diet was introduced, followed by a dramatic decrease
(approximately 200g DM/sheep h) and then a consistent rate of intake thereafter.
It is possible that the differences observed in feed intake may be due to changes in leptin or
insulin secretion or plasma concentrations (Baskin et al. 1999). Increased leptin
concentrations have been shown to suppress feed intake (Barb et al. 1998; Morrison et al.
2001) and does so by inhibiting glucose absorption in the small intestine. Leptin concentration
is influenced by nutritional status (Morrison et al. 2001; Morrison et al. 2002) and further
studies have shown that high-salt intake could contribute to elevated plasma leptin levels
(Dobrian et al. 2003). The mechanism for possible increased leptin concentrations in response
to a high-salt intake is unclear. However it is possible that the S lambs may have been
influenced by their dam’s diet of high-salt intake during pregnancy, which may have
programmed S lambs to have higher concentrations of leptin postnatally. Leptin levels were
not measured in this experiment thus further work should be carried out to determine whether
leptin is a factor influencing the decreased feed intake in S lambs.
The regulation of feed intake and insulin are also related, however the evidence from various
studies is conflicting. Some studies have found increased insulin results in increased feed
intake (Houpt 1974; Rodin 1985; Roberts et al. 1994), where others have found that increased
insulin decreases feed intake (Porte and Woods 1981; Woods et al. 1985; Woods et al. 1990;
Isganaitis and Lustig 2005).
It has been reported that high-salt diets may be a factor in promoting insulin resistance
(Ogihara et al. 2001) due to an increase in circulating free fatty acids (Donovan et al. 1993).
Randle et al. (1963) proposed that via substrate competition, increased circulating free fatty
Chapter Five Response of the offspring to salty drinking water
103
acids caused insulin resistance, from an inhibition of key rate limiting enzymes involved in
glycolysis and glucose oxidation. The mechanism by which sodium intake influences
circulating free fatty acids is unclear, however the observed insulin resistance to a high-salt
diet may represent a normal physiological response to dietary salt loading (Donovan et al.
1993). Insulin resistance is coupled with increased insulin secretion, due to homeostatic
mechanisms compensating the insensitivity (Isganaitis and Lustig 2005), thus resulting in
higher concentrations of insulin. One report (Vidonho et al. 2004) has shown that low-salt
diets during pregnancy and lactation in rats causes insulin resistance in the offspring, thus
providing evidence that maternal salt during pregnancy and lactation have long term
influences on insulin sensitivity of the adult offspring. It remains to be tested if high-salt
feeding during pregnancy has an effect on insulin resistance in the offspring. The secretion of
insulin and leptin is influenced by the amount of adipocytes and short-term changes in energy
and consequently, leptin secretion under ‘normal’ conditions is under the control of insulin
and glucocorticoids (Isganaitis and Lustig 2005). It is possible that both leptin and insulin act
together to decrease feed intake in response to high salt ingestion.
Further work is essential to establish why offspring born to dams fed high salt diet during
pregnancy have a lower feed intake as it could result in a decreased liveweight when animals
are exposed to long periods of high salt.
In summary, when C and S lambs are exposed to 1.5% NaCl in their drinking water there was
a difference in adaptive mechanisms between C and S lambs. As seen in previous chapters, C
lambs had lower aldosterone concentrations and an initial higher drive to increase water
consumption. AVP concentrations were increased to contribute to maintaining osmotic
balance, which could not be achieved by increased water consumption and sodium excretion
alone, and were higher in C lambs than S lambs. C lambs were found to consume more feed
Chapter Five Response of the offspring to salty drinking water
104
than S lambs, although the mechanisms behind this remains unknown. Collectively, the
differences observed between C and S lambs provides evidence to support the general
hypothesis that high salt during pregnancy influences adaptive mechanisms in response to salt
ingestion in the offspring.

CHAPTER SIX:
GENERAL DISCUSSION
Chapter Six: General Discussion
105
6.1 GENERAL DISCUSSION
Saline lands are increasing rapidly within Australia particularly in Southern and Western
Australia. McFarlane et al. (2004) estimates that 4.4 million hectares in Western Australia are
at risk with a predicted increase of approximately 14,000 hectares per annum. In South
Australia 4.1 million hectares are at risk with some predictions suggesting up to 60% may be
affected in 50 years (Australian Dryland Salinity Assessment, 2000). Landholders are using
salt tolerant forages (halophytic plants that can tolerate saline soil) to re-vegetate these
landscapes (Condon et al. 1994) and are incorporating them into grazing enterprises. Research
to date of animal responses to high-salt intake has focused on dry sheep grazing saltbush (and
other halophytic plants) to fill the summer/autumn feed gap and concluded that dry sheep can
tolerate the high salt loads and maintain weight (Wilson 1966; Hanjra and Rasool 1991;
Morcombe et al. 1996; Masters et al. 2001; Franklin – McEvoy 2002). During the
summer/autumn period lambing ewes could be in mid to late gestation and hence the initial
focus of this thesis was whether pregnant ewes could manage the high salt content found in
saltbush.
Effects of high dietary salt during pregnancy
There are physiological ‘conflicts’ for pregnant ewes fed high-salt diets. Pregnancy is
characterized by sodium retention and increased extracellular volume necessary for the
maintenance of the mother and growth of the foetus (Davison and Lindheimer 1989). High
salt consumption leads to decreased aldosterone concentration, which reduces sodium
reabsorption and increases sodium excretion (Randell et al. 2002). Therefore pregnancy and
high salt consumption lead to opposing signals that regulate sodium retention. The aims of
this component of the thesis were addressed in two parts. The first part investigated if ewes
fed a high-salt diet could complete a successful pregnancy with a lamb of normal birth
weight. It also investigated the physiological basis for how pregnant ewes fed a high-salt diet
managed the potential physiological conflict of salt retention for pregnancy and salt excretion
Chapter Six: General Discussion
106
associated with a high-salt diet by examining the hormones involved in the renin-angiotensin
system (RAS).
Two year old single-bearing ewes fed 13% NaCl in their diet appeared to cope from the time
of insemination through to lambing. There was no evidence to suggest that the high salt
consumption, or consequential increase in water consumption, affected pregnancy rates,
which where within typical ranges for laparoscopic artificial insemination (Hill et al. 1998).
Previous studies by Potter and McIntosh (1974) with salty drinking water (1.3% NaCl)
showed that age and/or multiple births increased the susceptibility to high salt for neonatal
mortalities and complicated births. As the ewes in the present study were maiden ewes,
further studies are warranted to determine whether higher parity ewes and/or those bearing
twins (or triplets) would be equally capable of tolerating a high-salt feed.
Pregnant ewes in this study that consumed the high-salt diet were able to complete pregnancy
successfully, with gestation and lamb birth weights remaining unchanged from control ewes
fed a standard (low salt) diet. The mechanisms by which the ewes tolerated the high-salt diet
included an increase in water consumption and a decrease by approximately 50% in
aldosterone concentrations compared to the control ewes.
An increase in AVP was not induced through the first four months of pregnancy, presumably
because of the increase in water intake. Exposure to high salt was likely to have been
perceived physiologically by the animal, initially, as dehydration due to an increase in
osmolality of the extracellular fluid. This would have stimulated the thirst centre and triggered
an increase in the amount of water consumed. As water intake increased, plasma osmolality
would have begun to return to normal levels. In non-pregnant animals, a declining osmolality
would normally decrease AVP release but, during pregnancy, AVP is not suppressed at the
Chapter Six: General Discussion
107
usual levels of body tonicity (at least in humans; Lindheimer and Davison 1995) as part of the
normal water-retaining mechanisms of pregnancy. It appears that the physiological ‘objective’
of sheep in the present experiment to increase water retention to sustain a normal pregnancy
was achieved without a change in AVP concentration because their high-salt intake induced
an increase in water consumption that would have led to an increase in water retention in
body fluids. As gestation progresses, body water is continually assessed (via changes in
osmolality and blood pressure) by the animal, and there are continual adjustments in the
volume-sensing AVP release mechanisms (Lindheimer et al. 1989). This mechanism could
possibly explain the increase in AVP in the last month of pregnancy in both groups of sheep;
i.e., an elevated AVP concentration may have resulted from a higher set point of the osmotic
threshold.
The decline in aldosterone concentrations is probably the most important adaptive mechanism
that allowed the ewes to successfully complete pregnancy whilst consuming high salt. When
pregnant ewes were fed the control diet, aldosterone concentrations increased as pregnancy
progressed to increase water reabsorption from the kidneys, and thus extracellular fluid
increased as part of a normal pregnancy. When pregnant ewes were fed the high-salt diet, the
mechanism of increased aldosterone concentration was apparently not required as the high
salt ingestion triggered an increased water intake, which may have sufficiently increased
extracellular volume to reach the ‘target’ level for a pregnant ewe. Therefore pregnant ewes
fed high salt were likely able to avoid complications such as hypertension (Rafestin-Oblin et
al. 1991) or neonatal mortalities (Potter and McIntosh 1974) by reducing their plasma
aldosterone below the concentration in control animals and increasing water intake.
The implications of the research reported in this thesis are limited to salty feed as previous
studies have shown different implications when pregnant animals drink salty water (Potter
Chapter Six: General Discussion
108
and McIntosh 1974). Wilson (1966) also stated that the means of ingestion of salt (feed or
water) alters the effects that salt may have on food intake and the health of the animal and that
the acceptability or tastes of food or water containing high levels of salt is a factor in
determining the salt tolerance of sheep.
The initial conclusions provide evidence that pregnant ewes can tolerate 13% NaCl in their
feed whilst they have access to fresh drinking water. This provides the initial step to further
investigate whether pregnant ewes can graze halophytic forages. It is apparent that they could
withstand the high sodium chloride content typical, for example, of a saltbush-based pasture
(Wilson 1975), but saltbush and other halophytes contain a secondary compounds that were
not evaluated in the present study. Such compounds found in significant quantities in saltbush
are oxalates and nitrates (Norman et al. 2004). Research has shown that oxalates cause
calcium deficiency and causes the precipitation of insoluble calcium oxalate in the rumen and
kidney and could ultimately lead to death (Dynes and Schlink 2002). The mechanisms by
which high levels of nitrates becomes toxic to livestock is through the conversion in the
rumen to nitrites. Absorption of nitrites results in the conversion of haemoglobin to
methaemoglobin which is unable to bind to oxygen. This then leads to anoxia, which is
accompanied by increased pulse and respiration rates (Dynes and Schlink 2002). Nitrates also
result in depressed feed intake.
Effects of high dietary salt during pregnancy on offspring
Previous research in rats (Arguelles et al. 1996; Alves da Silva et al. 2003) have shown high-
salt diets during pregnancy have been associated with lowering the RAS in the dam, which
may possibly alter kidney development/function of the offspring. Also high-salt diets during
pregnancy and postnatally have been associated with an increased preference for salt in the
offspring (Smriga et al. 2002; Curtis et al. 2004).
Chapter Six: General Discussion
109
The sequence of experiments reported in this thesis on the offspring found for the first time
that there are physiological differences between lambs born to ewes fed a high-salt diet during
pregnancy (S lambs) and lambs born to ewes fed a control (standard salt) diet (C lambs).
When lambs were administered an oral dose of salt (40 g NaCl in solution), S lambs drank
400 mL less during the following two-hour period than C lambs, suggesting that S lambs had
an altered thirst threshold. S lambs also had a lower concentration of aldosterone following
the control challenge and exhibited a smaller decline in aldosterone concentration following a
salt challenge. This difference possibly reflects a lowered responsiveness to aldosterone.
When water was restricted, S lambs were able to increase their rate of sodium excretion
significantly more than C lambs. These data suggest that (i) when sheep are consuming a
high-salt diet and not able to regularly consume fresh water immediately after ingesting the
salt, S lambs may be better able to cope; and (ii) if fresh water is freely available over time
and in close proximity to the salty feed (or forage), then the differences between C and S
sheep may not be apparent.
A second challenge of salt after 8 hours of the first, indicates that a more continual exposure
to salt may influence the ability to excrete the entire salt load and suggests that animals are
able to adapt to high-salt feeds. In the first 4 hours after the first dose of NaCl, S lambs were
able to excrete more sodium than C lambs, however after the second dose, excretion was
identical across both groups. This suggests that any benefit conferred to S lambs in terms of
adaptability to salt ingestion will only be evident in the immediate short-term, and that under
conditions of repeated (or continual) oral salt ‘challenge’, all sheep (C and S lambs) have
virtually the same capacity to excrete excess sodium. A practical implication of this finding is
that S lambs may more readily adapt to high salt ingestion when first moved onto a high-salt
forage such as saltbush. However, over time, this advantage may be lost as all sheep adapt to
Chapter Six: General Discussion
110
the salty feed. This was confirmed in the last experiment in which a continual salt challenge
was administered via drinking water. This experiment showed that there was no difference in
sodium excretion between C and S lambs. There were however, changes in the differences for
water consumption and aldosterone concentrations for C and S lambs, consistent with the
earlier experiments in this thesis.
Collectively, the experiments reported in this thesis provide evidence to support the
hypotheses that S lambs have a higher thirst threshold and a lowered responsiveness to
aldosterone. Thus they excrete sodium at the same rate as C lambs but do so without the
initial drive of water consumption and without lowering their aldosterone concentrations to
the same degree. Whether this adaptation is beneficial in the field remains to be determined.
For example, are there advantages for S lambs in increased liveweights or increased feed
intakes? Data in the final experiment showed, for the first time, that feed intake in S lambs
was actually reduced compared to C lambs. The mechanisms for this remain unknown, but it
is a potentially important result as it may override any of the adaptive advantages described
above. That is, the net effect of high-salt feeding during pregnancy on the offspring may be
negative because of a reduced voluntary feed intake. This needs to be confirmed with animals
offered forage (pasture) rather than a concentrate-based diet as used in the studies reported
here.
Future research
A next step in research is to identify the exact mechanisms that account for the effects on the
offspring. It would be useful to identify if there is a window of time during pregnancy that
feeding high salt could increase the capacity of the offspring to deal with high salt, instead of
feeding high dietary salt through entire pregnancy.
Chapter Six: General Discussion
111
There are many factors that are involved in sodium excretion, urinary output and water intake,
including mechanisms that were not measured within this thesis. These include possible
changes in glomerular filtration rates (Potter 1968), the expression of aquaporins (Ohara et al.
1998), the length of the glomerulus and the loop of Henle (Shanas and Haims 2004), the
sensitivity to salt (i.e. salt receptors), altered renin and renin activity and angiotensin II
concentrations (Alves da Silva et al. 2003). In addition, the finding in the last experiment of
this thesis that S lambs had a markedly lower voluntary feed intake needs to be confirmed.
This response was observed with the sheep being exposed to high salt via drinking water. We
need to determine if the same result occurs with animals exposed to salty feed and/or with
animals consuming low (normal) salt levels with fresh drinking water. After investigation of
these parameters, further research will need to determine the net benefits or costs to the
offspring in terms of feed intake, liveweight and feed conversion ratios.
This thesis has provided new insights into the physiological consequences of high-salt diets
during pregnancy on ewes and their offspring. Further research will determine if the
differences observed in C and S lambs translate to differences under field conditions.
APPENDIX
Appendix
112
Catheter preparation
Three metres of tygon microbore tubing (ID 0.04”; OD 0.070”; Wall 0.015”; Scientific
Supplies Ltd, Australia) was measured and cut. Knotting both ends of the tubing it was then
folded in the middle to make two catheters (1.5m long each). The catheters were then placed
in a 2% Trition solution (Solution A) and left on an agitator over night. The following day the
catheters were rinsed with deionised water and placed in 1% Norocillin solution (Solution B)
and left on an agitator over night. The catheters were then removed from the solution and
were hung in a drying area where disturbance was minimal (One day was sufficient for
drying). The cuffs were then made (Figure A). To insert the cuffs onto the catheter the 3m
tubing was cut at the fold in the middle and the knots were cut off. A marking was made
20cm from one end where the catheter would enter the artery and the cuff would be placed on
top of the artery wall. A drop of Norocillin was used as a lubricant to push the cuff onto the
tubing to the 20cm mark on the catheter. It was then left overnight to dry and a drop of glue
was placed in between the cuff and catheter the following day to ensure the cuff was securely
attached to the catheter. After the glue had dried a number of catheters were placed into a
measuring cylinder with approximately 3ml of Trididecylmethyammonium chloride heparin
(TDMAC; Bioscientific Pty., Ltd., Gymea, NSW). Using a 20mL syringe the TDMAC
heparin was drawn into the catheter in order to coat the inside of the catheter. The TDMAC
heparin was then allowed to drain out of the catheter by gravity. A 20mL syringe was used to
expel the remaining TDMAC heparin from the catheter. The catheters were then left to dry
and then sterilised in ethylene gas at 55°C for 2.5 hours, with an 8-hour aeration cycle (King
Edward Memorial Hospital, Subiaco, WA).
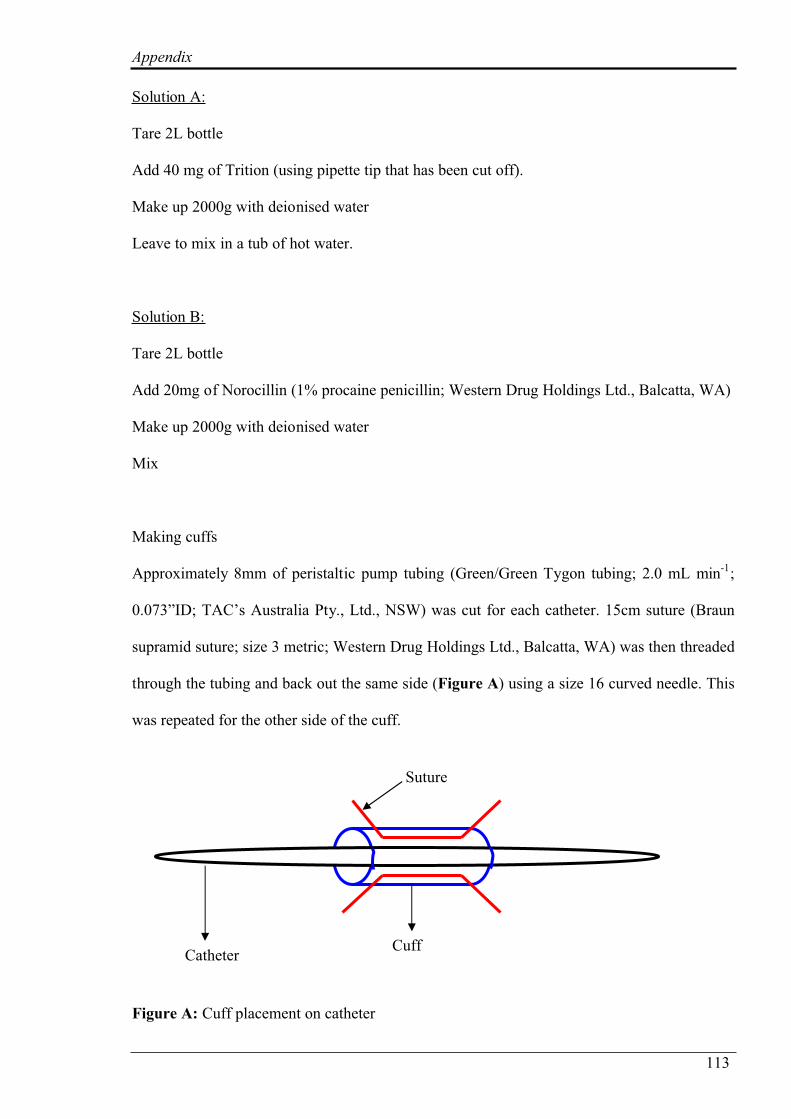
Appendix
113
Solution A:
Tare 2L bottle
Add 40 mg of Trition (using pipette tip that has been cut off).
Make up 2000g with deionised water
Leave to mix in a tub of hot water.
Solution B:
Tare 2L bottle
Add 20mg of Norocillin (1% procaine penicillin; Western Drug Holdings Ltd., Balcatta, WA)
Make up 2000g with deionised water
Mix
Making cuffs
Approximately 8mm of peristaltic pump tubing (Green/Green Tygon tubing; 2.0 mL min-1
;
0.073”ID; TAC’s Australia Pty., Ltd., NSW) was cut for each catheter. 15cm suture (Braun
supramid suture; size 3 metric; Western Drug Holdings Ltd., Balcatta, WA) was then threaded
through the tubing and back out the same side (Figure A) using a size 16 curved needle. This
was repeated for the other side of the cuff.
Figure A: Cuff placement on catheter
Suture
CuffCatheter
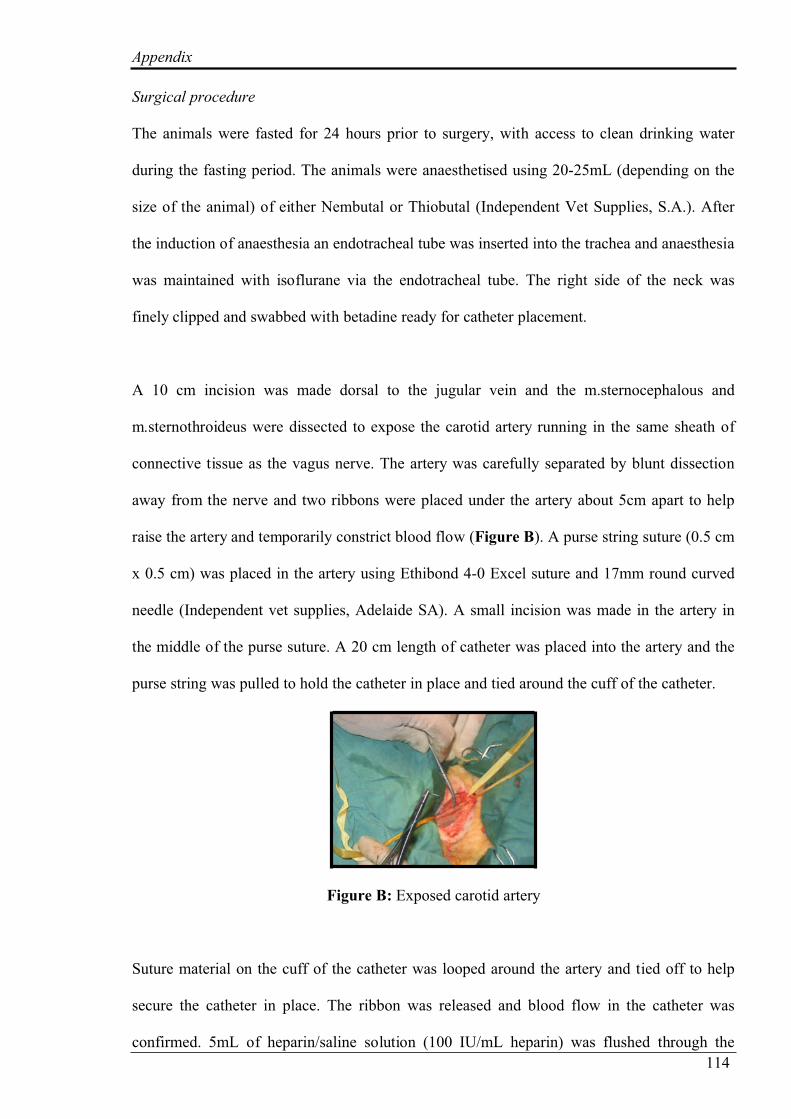
Appendix
114
Surgical procedure
The animals were fasted for 24 hours prior to surgery, with access to clean drinking water
during the fasting period. The animals were anaesthetised using 20-25mL (depending on the
size of the animal) of either Nembutal or Thiobutal (Independent Vet Supplies, S.A.). After
the induction of anaesthesia an endotracheal tube was inserted into the trachea and anaesthesia
was maintained with isoflurane via the endotracheal tube. The right side of the neck was
finely clipped and swabbed with betadine ready for catheter placement.
A 10 cm incision was made dorsal to the jugular vein and the m.sternocephalous and
m.sternothroideus were dissected to expose the carotid artery running in the same sheath of
connective tissue as the vagus nerve. The artery was carefully separated by blunt dissection
away from the nerve and two ribbons were placed under the artery about 5cm apart to help
raise the artery and temporarily constrict blood flow (Figure B). A purse string suture (0.5 cm
x 0.5 cm) was placed in the artery using Ethibond 4-0 Excel suture and 17mm round curved
needle (Independent vet supplies, Adelaide SA). A small incision was made in the artery in
the middle of the purse suture. A 20 cm length of catheter was placed into the artery and the
purse string was pulled to hold the catheter in place and tied around the cuff of the catheter.
Figure B: Exposed carotid artery
Suture material on the cuff of the catheter was looped around the artery and tied off to help
secure the catheter in place. The ribbon was released and blood flow in the catheter was
confirmed. 5mL of heparin/saline solution (100 IU/mL heparin) was flushed through the
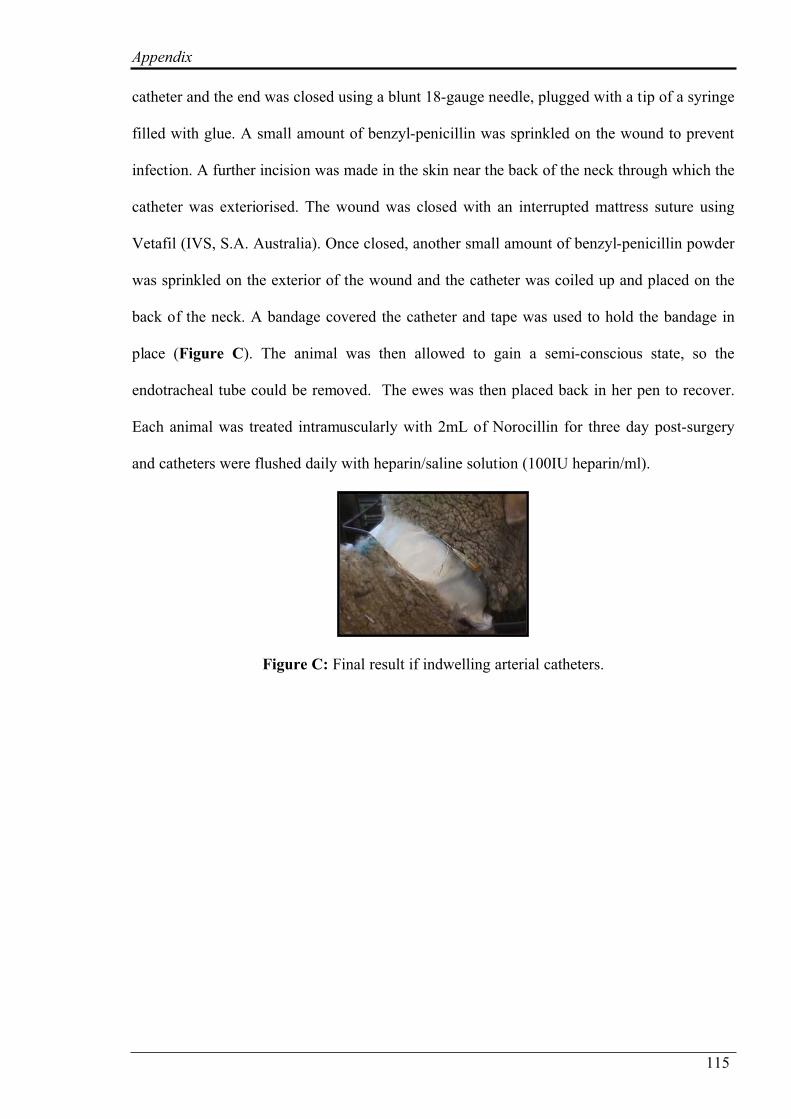
Appendix
115
catheter and the end was closed using a blunt 18-gauge needle, plugged with a tip of a syringe
filled with glue. A small amount of benzyl-penicillin was sprinkled on the wound to prevent
infection. A further incision was made in the skin near the back of the neck through which the
catheter was exteriorised. The wound was closed with an interrupted mattress suture using
Vetafil (IVS, S.A. Australia). Once closed, another small amount of benzyl-penicillin powder
was sprinkled on the exterior of the wound and the catheter was coiled up and placed on the
back of the neck. A bandage covered the catheter and tape was used to hold the bandage in
place (Figure C). The animal was then allowed to gain a semi-conscious state, so the
endotracheal tube could be removed. The ewes was then placed back in her pen to recover.
Each animal was treated intramuscularly with 2mL of Norocillin for three day post-surgery
and catheters were flushed daily with heparin/saline solution (100IU heparin/ml).
Figure C: Final result if indwelling arterial catheters.
REFERENCES
References
116
Abdul-Karim R and Assali NS 1961. Pressor response to angiotensin in pregnant and non
pregnant women. American Journal of Obstetrics and Gynaecology 82, 246.
Alves da Silva A, de Noronha IL, de Oliveira IB, Malheiros DM and Heimann JC 2003.
Renin-angiotensin system function and blood pressure in adult rats after perinatal salt
overload. Nutrition, Metabolism and Cardiovascular Disease 13, 133-139.
Anthony RV, Scheaffer AN, Wright CD and Regnault TR 2003. Ruminant models of prenatal
growth restriction. Reproduction Supplement 61,183-194.
Arguelles J, Lopez-Sela P, Brime JI, Costales M and Vijande M 1996. Changes of blood
pressure responsiveness in rats exposed in utero and perinatally to a high-salt environment.
Regulatory Peptides 66, 113-115.
Arieli ML, Naim E, Benjamin RW and Pasternak D 1989. The effect of feeding saltbush and
sodium chloride on energy metabolism in sheep. Animal Production 49, 451-457
August P 1999. Hypertensive disorders in pregnancy, In Medical complications during
pregnancy. Eds. GN Burrow and TP Duffy, 5th ed. W.B Saunders, Philadelphia.
August P 2000. The renin angiotensin system in hypertensive pregnancy, In Handbook of
Hypertension. Ed. P. Rubin, Elsevier Science B.V.
Australian Dryland Salinity Assessment 2000.
http://audit.ea.gov.au/anra/land/docs/national/Salinity_AUS.html
References
117
Barb CR, Yan X, Azain MJ, Kraeling RR, Rampacek GB and Ramsay TG 1998.
Recombinant porcine leptin reduces feed intake and stimulates growth hormone secretion in
swine. Domestic Animal Endocrinology 15, 77-86.
Baskin DG, Figlewicz Lattemann D, Seeley RJ, Woods SC, Porte D Jr. and Schwartz MW
1999. Insulin and leptin: dual adiposity signals to the brain for the regulation of food intake
and body weight. Brain Research 848, 114-123.
Bell RJ, Laurence BM, Meehan PJ, Congiu M, Scoggins BA and Wintour EM 1986.
Regulation and function of arginine vasopressin in pregnant sheep. American Journal of
Physiology – Renal Physiology 250, F777-F780.
Bencini R 1999. Development of specialty sheep milk dairy products - Increasing the market
scope. The Rural Industries Research and Development Corporation.
Bie P 1980. Osmoreceptors, vasopressin, and control of renal water excretion. Physiology
Review 60, 961-1048.
Blache D, Grandison MJ, Masters DG, Dynes RA, Blackberry MA and Martin GA 2007.
Relationships between metabolic endocrine systems and voluntary feed intake in Merino
sheep fed a high salt diet. Australian Journal of Agricultural Research 47, 544-550.
Blackburn ST 2003. Maternal, Fetal and Neonatal physiology - A Clinical Perspective.
Saunders Publishing, St. Louis.
References
118
Bocking AD 2001. Placental function, In Fetal growth and development. eds. R Harding and
AD Bocking, Cambridge University Press, Cambridge.
Bogdarina I, Welham S, King PJ, Burns SP and Clark AJ 2007. Epigenetic modification of
the renin-angiotensin system in the fetal programming of hypertension. Circulation Research
100, 520-526.
Braley LM, Menachery AI, Yao T, Mortensen RM and Williams GH 1996. Effect of
progesterone on aldosterone secretion in rats. Endocrinology 137, 4773-4778.
Butler DG, Pak SH, Midgely A and Nemati B 2002. AT (1) receptor blockade with losartan
during gestation in Wistar rats leads to an increase in thirst and sodium appetite in their adult
female offspring. Regulatory Peptides 105, 47-57.
Carlson B. 1999. Human embryology and development biology. 2nd ed. Mosby, St.Louis.
Chilliard Y, Delavaud C and Bonnet M 2005. Leptin expression in ruminants: nutritional and
physiological regulations in relation with energy metabolism. Domestic Animal
Endocrinology 29, 3-22.
Condon RW, Weir HN, Herbert RG, Naylor JL and Meares RC 1994. Old man saltbush for
saline soils and high water tables - some case studies. Third National Workshop on
Productive Use of Saline Land Murray-Darling Basin Commission and Salt Action, 113-118.
Contreras RJ and Kosten T 1983. Prenatal and early postnatal sodium chloride intake
modifies the solution preferences of adult rats. Journal of Nutrition 113, 1051-1062.
References
119
Contreras RJ 1993. High NaCl intake of rat dams alters maternal behaviour and elevates
blood pressure of adult offspring. American Journal of Physiology – Regulatory, Integrative
and Comparative Physiology 264, R296-R304.
Cowley AW Jr., Skelton MM and Merrill DC 1986. Osmoregulation during high salt intake:
relative importance of drinking and vasopressin secretion. American Journal of Physiology –
Regulatory, Integrative and Comparative Physiology 251, R878-R886.
Curtis KS, Krause EG, Wong DL and Contreras RJ 2004. Gestational and early postnatal
dietary NaCl levels affect NaCl intake, but not stimulated water intake, by adult rats.
American Journal of Physiology – Regulatory, Integrative and Comparative Physiology 286,
R1043-R1050.
Dahlquist RL and Knoll JW 1978. Inductively Coupled plasma-atomic emission
spectrometry: Analysis of biological material and soils for major, trace and ultra-trace
elements. Applied Spectroscopy 32, 1-29.
Davis JO and Freeman RH 1976. Mechanisms regulating renin release. Physiology Review
56, 1-56.
Davison JM 1974. Proceedings: Changes in renal function and other aspects of homeostasis in
early pregnancy. Journal of Obstetrics and Gynaecology British Commonwealth 81, 1003.
Davison JM, Gilmore EA, Durr J, Robertson GL and Lindheimer MD 1984. Altered osmotic
thresholds for vasopressin secretion and thirst in human pregnancy. American Journal of
Physiology – Renal Physiology 246, F105-F109.
References
120
Davison JM and Lindheimer MD 1989. Volume homeostasis and osmoregulation in human
pregnancy. Baillieres Clinical Endocrinology and Metabolism 3, 451-472.
de Rouffignac C 2001. The urinary concentrating mechanism: a model of integrative
physiology. Nephrology Dialysis Transplantation 16, 2127-2130.
Dickinson H, Wintour M, Walker D and Moritz K 2005. Renal function and prenatal
programming of hypertension in the Spiny mouse. The nineteenth national workshop on fetal
and neonatal physiology, A10.
Dluhy RG, Underwood RH and Williams GH 1970. Influence of dietary potassium on plasma
renin activity in normal man. Journal of Applied Physiology 28, 299-302.
Dobrian AD, Schriver SD, Lynch T and Prewitt RL 2003. Effect of salt on hypertension and
oxidative stress in a rat model of diet-induced obesity. American Journal of Physiology -
Renal Physiology 285, F619-F628.
Dodic M, Hantzis V, Duncan J, Rees S, Koukoulas I, Johnson K, Wintour EM and Moritz K
2002. Programming effects of short prenatal exposure to cortisol. Journal of the Federation of
American Societies for Experimental Biology 16, 1017-1026.
Donovan DS, Solomon CG, Seely EW, Williams GH and Simonson DC 1993. Effect of
sodium intake on insulin sensitivity. American Journal of Physiology – Endocrinology and
Metabolism 264, E730-E734.
References
121
Dukes HH 2004. Dukes' physiology of domestic animals. 12th ed Ed. Comstock, Ithaca, N.Y;
London.
Durr JA, Stamoutsos B and Lindheimer MD 1981. Osmoregulation during pregnancy in the
rat. Evidence for resetting of the threshold for vasopressin secretion during gestation. Journal
of Clinical Investigation 68, 337-346.
Duvekot JJ and Peeters LL 1994. Renal haemodynamics and volume homeostasis in
pregnancy. Obstetric and Gynaecology Survey 49, 830-839.
Dynes RA and Schlink AC 2002. Livestock potential of Australian species of Acacia.
Conservation Science Western Australia 4, 117-124.
Edwards LJ and McMillen IC 2001. Maternal undernutrition increases arterial blood pressure
in the sheep fetus during late gestation. Journal of Physiology 533, 561-570.
Ehrlich EN 1971. Heparinoid-induced inhibition of aldosterone secretion in pregnant women.
The role of augmented aldosterone secretion in sodium conservation during normal
pregnancy. American Journal of Obstetric Gynaecology 109, 963-970.
Elam CJ 1961. Effect of high salt intake on digestibility in cattle. Journal of Animal Science
20, 931.
References
122
Evbuomwan IO, Davison JM, Baylis PH and Murdoch AP 2001. Altered osmotic thresholds
for arginine vasopressin secretion and thirst during superovulation and in the ovarian
hyperstimulation syndrome (OHSS): relevance to the pathophysiology of OHSS. Fertility and
Sterilisation 75, 933-941.
Fowden 2001. Factors affecting fetal growth and development, In Fetal growth and
development. eds. R. Harding and A. D. Bocking, Cambridge University Press, Cambridge.
Franklin-McEvoy J 2002. Improving the performance of sheep grazing on saltbush. Honours
Thesis, University of Adelaide, Adelaide.
Gales NJ, Williamson P, Higgins LV, Blackberry MA and James I 1997. Evidence for a
prolonged postimplantation period in the Australian sea lion (Neophoca cinerea). Journal of
Reproductive Fertility 111, 159-163.
Gordon MS, Majzoub JA, Williams GH and Gordon MB 1997. Sodium balance modulates
thirst in normal man. Endocrinology Research 23, 377-392.
Grunberger W and Szalay S 1983. Uterine and systemic vascular responses to dopamine in
pregnant ewes. Archives of Gynaecology 233, 259-262.
Guillery EN 1997. Fetal and neonatal nephrology. Current Opinions in Paediatrics 9, 148-153.
Hamilton JA and Webster MED 1987. Food intake, water intake, urine output, growth rate
and wool growth of lambs accustomed to high or low intake of sodium chloride. Australian
Journal of Agricultural Research 38, 187-194.
References
123
Hanjra SH and Rasool S 1993. Potential of Atriplex as a forage for livestock in Pakistan.
Productive Use of Saline Lands 42, 68-70.
Hegarty BD, Burrell JH, Gibson KJ, McMullen JR and Lumbers ER 2000. Effect of cortisol
on fetal ovine vascular angiotensin II receptors and contractility. European Journal of
Pharmacology 406, 439-448.
Hemsley JA, Hogan JP and Weston RH 1975. Effect of high intakes of sodium chloride on
the utilisation of a protein concentrate by sheep. II Digestion and absorption of organic matter
and electrolytes. Australian Journal of Agricultural Research 26, 715-727.
Herrera M and Garvin JL 2005. A high-salt diet stimulates thick ascending limb eNOS
expression by raising medullary osmolality and increasing release of endothelin-1. American
Journal of Physiology - Renal Physiology 288, F58-F64.
Hill JR, Thompson JA and Perkins NR 1998. Factors affecting pregnancy rates following
laparoscopic insemination of 28,447 Merino ewes under commercial conditions: a survey.
Theriogenology 49, 697-709.
Hopkins DL and Nicholson A 1999. Meat quality of wether lambs grazed on saltbush
(Atriplex nummularia) plus supplements or lucerne (Medicago sativa). Meat Science 51, 91-
95.
Houpt TR 1974. Stimulation of food intake in ruminants by 2-deoxy-D-glucose and insulin.
American Journal of Physiology 227:161-167.
References
124
Hungerford TG 1975. Diseases of Livestock. 8th ed. McGraw-Hill, Sydney.
Hutchinson-Williams KA and Decherney AH 1992. The endocrinology of pregnancy, p. 97-
114, In Medicine of the Fetus and Mother. Eds. EA Reece, et al., JB Lippincott, Philadelphia.
Hytten FE and Klopper AI 1963. Response to a Water Load in Pregnancy. Journal of
Obstetrics and Gynaecology British Commonwealth 70, 811-816.
Isganaitis E and Lustig RH 2005. Fast food, central nervous system insulin resistance, and
obesity. Arteriosclerosis, Thrombosis and Vascular Biology 25, 2451-2462.
James VHT and Wilson GA 1976. Determination of aldosterone in biological fluids, p. 149-
158, In E. Reid, ed. Assay of drugs and other trace compounds in biological fluids. Elsevier,
Amsterdam.
Kincaid-Smith PS and Fairley KF 1993. The kidney and hypertension in pregnancy Churchill
Livingstone, Edinburgh.
Kosten T, Contreras RJ, Stetson PW and Ernest MJ 1983. Enhanced saline intake and
decreased heart rate after area postrema ablations in rat. Physiology and Behaviour 31, 777-
785.
Laing CM, Toye AM, Capasso G and Unwin RJ 2005. Renal tubular acidosis: developments
in our understanding of the molecular basis. The International Journal of Biochemistry and
Cell Biology 37, 1151-1161.
References
125
Landau RL and Lugibihl K 1958. Inhibition of the sodium-retaining influence of aldosterone
by progesterone. Journal of Clinical Endocrinology and Metabolism 18, 1237-1245.
Liggins 1982. Fetal growth and development, In Embryonic development. eds. MM Burger
and R Weber, A.R. Liss, New York.
Lindheimer MD, Barron WM, Durr J and Davison JM 1987. Water homeostasis and
vasopressin release during rodent and human gestation. American Journal of Kidney Disease
9, 270-275.
Lindheimer MD, Barron WM and Davison JM 1989. Osmoregulation of thirst and
vasopressin release in pregnancy. American Journal of Physiology – Renal Physiology 257,
F159-F169.
Lindheimer MD and Davison JM 1995. Osmoregulation, the secretion of arginine vasopressin
and its metabolism during pregnancy. European Journal of Endocrinology 132, 133-143.
Lumbers ER and Stevens AD 1983. Changes in fetal renal function in response to infusions of
a hyperosmotic solution of mannitol to the ewe. Journal of Physiology 343, 439-446.
Lumbers ER, Burrell JH, Stevens AD and Bernasconi C 1996. Responses of fetal sheep to
reduced maternal renal blood flow and maternal hypertension. American Journal of
Physiology – Regulatory, Integrative and Comparative Physiology 271, R1691-1700.
References
126
Lumbers ER, Bernasconi C and Burrell JH 1996. Effects of inhibition of the maternal renin-
angiotensin system on maternal and fetal responses to drainage of fetal fluids. Canadian
Journal of Physiology and Pharmacology 74, 973-982.
Marsh AC, Gibson KJ, Wu J, Owens PC, Owens JA and Lumbers ER 2001. Insulin-like
growth factor I alters renal function and stimulates renin secretion in late gestation fetal sheep.
Journal of Physiology 530, 253-262.
Marsh AC, Lumbers ER and Gibson KJ 2002. Renal, cardiovascular and endocrine responses
of fetal sheep at 0.8 of gestation to an infusion of amino acids. Journal of Physiology 540,
717-728.
Masters DG, Norman HC and Dynes RA 2001. Opportunities and Limitations for Animal
Production from Saline Lands. Asian-Australian Journal of Animal Science 14, 199-211.
Masters DG, Rintoul AJ, Dynes RA, Pearce KL and Norman HC 2005. Feed intake and
production in sheep fed diets high in sodium and potassium. Australian Journal of
Agricultural Research 56, 427-434.
Mattson DL and Higgins DJ 1996. Influence of dietary sodium intake on renal medullary
nitric oxide synthase. Hypertension 27, 688-692.
Mbassa GK 1988. Mammalian renal modifications in dry environments. Veterinary Research
Communications 12, 1-18.
References
127
McDonald P, Edwards RA, Greenhalgh JFD and Morgan CA 1995. Animal Nutrition
Addison Wesly Longman, Singapore.
McFarlane DJ, George RJ and Cacceta PA 2004. The extent and potential area of salt-affected
land in Western Australia estimated using remote sensing digital terrain models. Engineering
salinity solutions; 1st national salinity engineering conference, 55-60.
McIntosh GH and Potter BJ 1972. The influence of 1.3% saline ingestion upon pregnancy in
the ewe and lamb survival. Proceedings of the Australian Physiology and Pharmacological
Society 3, 61.
McQuaker NR, Brown DF and Kluckner PD 1979. Digestion of environmental materials for
analysis by inductively coupled plasma-atomic emission spectrometry. Analytical Chemistry
51, 1082-1084.
Meintjes RA and Olivier R 1992. The effects of salt loading via two different routes on feed
intake, body water turnover rate and electrolyte excretion in sheep. Onderstepoort Journal of
Veterinary Research 59, 91-96.
Meyer JH and Weir WC 1954. The tolerance of sheep to high intake of sodium chloride.
Journal of Animal Science 13, 445-449.
Mohamed MO and Phillips CJC 2003. The effect of increasing salt intake of pregnant dairy
cows on the salt appetite and growth of their calves. Animal Science, British Society of
Animal Science 77, 181-185.
References
128
Morcombe PW, Young GE and Boase KA 1996. Grazing a saltbush (Atriplex-Maireana)
stand by Merino wethers to fill the 'autumn feed-gap' experienced in the Western Australian
wheat belt. Australian Journal of Experimental Agriculture 36, 641-647.
Moritz K, Bartal D, Jefferies A, Dodic M, Boon WM, Bertram J, Wintour M and DeMatteo R
2005. Prenatal Glucocorticoids and the kidney - an update. The nineteenth National
Workshop on Fetal and Neonatal Physiology, A8.
Morrison CD, Daniel JA, Holmberg BJ, Djiane J, Raver N, Gertler A and Keisler DH 2001.
Central infusion of leptin into well-fed and undernourished ewe lambs: effects on feed intake
and serum concentrations of growth hormone and luteinizing hormone. Journal of
Endocrinology 168, 317-324.
Morrison CD, Wood R, McFadin EL, Whitley NC and Keisler DH 2002. Effect of
intravenous infusion of recombinant ovine leptin on feed intake and serum concentrations of
GH, LH, insulin, IGF-1, cortisol, and thyroxine in growing prepubertal ewe lambs. Domestic
Animal Endocrinology 22, 103-112.
Nicolaidis S, Galaverna O and Metzler CH 1990. Extracellular dehydration during pregnancy
increases salt appetite of offspring. American Journal of Physiology – Regulatory, Integrative
and Comparative Physiology 258, R281-R283.
Norman HC, Freind C, Masters DG, Rintoul AJ, Dynes RA and Williams IH 2004. Variation
between two saltbush species in plant composition and subsequent selection by sheep.
Australian Journal of Agricultural Research 55, 999-1007.
References
129
Ogihara T, Asano T, Ando K, Chiba Y, Sekine N, Sakoda H, Anai M, Onishi Y, Fujishiro M,
Ono H, Shojima N, Inukai K, Fukushima Y, Kikuchi M and Fujita T 2001. Insulin resistance
with enhanced insulin signalling in high-salt diet-fed rats. Diabetes 50, 573-583.
Ohara M, Martin PY, Xu DL, St John J, Pattison TA, Kim JK and Schrier RW 1998.
Upregulation of aquaporin 2 water channel expression in pregnant rats. Journal of Clinical
Investigation 101, 1076-1083.
Olsson K, Benlamlih S, Dahlborn K and Fyhrquist F 1982. Effects of water deprivation and
hyperhydration in pregnant and lactating goats. Acta Physiology Scandinavia 115, 361-367.
Park F, Koike G and Cowley AW Jr. 1998. Regional time-dependent changes in vasopressin
V2 receptor expression in the rat kidney during water restriction. American Journal of
Physiology – Renal Physiology 274, F906-F913.
Peirce AW 1957. Studies on salt tolerance of sheep. I. The tolerance of sheep for sodium
chloride in the drinking water. Australian Journal of Agricultural Research 8, 711-722.
Peirce AW 1968. Studies on salt tolerance of sheep. VIII. The tolerance of grazing ewes and
their lambs for drinking water of the types obtained from underground sources in Australia.
Australian Journal of Agricultural Research 19, 589-595.
Penney MD and Hampton D 1990. The effect of lithium therapy on arginine vasopressin
secretion and thirst in man. Clinical Biochemistry 23, 233-236.
References
130
Pittman DW and Contreras RJ 2002. Rearing on basal or high dietary NaCl modifies chorda
tympani nerve responses in rats. Physiology and Behaviour 77, 277-89.
Porte D Jr. and Woods SC 1981. Regulation of food intake and body weight in insulin.
Diabetologia 20 Suppl, 274-280.
Potter BJ 1961. The renal response of sheep to prolonged ingestion of sodium chloride.
Australian Journal of Agricultural Research.
Potter BJ 1963. The effect of saline water on kidney tubular function and electrolyte excretion
in sheep. Australian Journal of Agricultural Research 14, 518.
Potter BJ 1968. The influence of previous salt ingestion on the renal function of sheep
subjected to intravenous hypertonic saline. Journal of Physiology 194, 435-455.
Potter BJ, Walker DJ and Forrest WW 1972. Changes in intraruminal function of sheep when
drinking saline water. British Journal of Nutrition 25, 75-83.
Potter BJ and McIntosh GH 1974. Effect of salt water ingestion on pregnancy in the ewe and
on lamb survival. Australian Journal of Agricultural Research 25, 909-917.
Rafestin-Oblin ME, Couette B, Barlet-Bas C, Cheval L, Viger A and Doucet A 1991. Renal
action of progesterone and 18-substituted derivatives. American Journal of Physiology –
Renal Physiology 260, F828-F832.
References
131
Randall D, Burggren W and French K 2002. Eckert Animal Physiology - Mechanisms and
Adaptations. 5 ed. W.H Freeman and Company, New York.
Randle PJ, Garland PB, Hales CN and Newsholme EA 1963. The glucose fatty-acid cycle. Its
role in insulin sensitivity and the metabolic disturbances of diabetes mellitus. Lancet 1, 785-
789.
Rattanatray L, Schwartz J and Olson D 2005. Perinatal Rofecoxib exposure impairs normal
renal development of offspring in adulthood. The nineteenth national workshop on fetal and
neonatal physiology, A18.
Renfree 1982. Placental function, In Embryonic development. ed. M.M. Burger and R.
Weber, A.R. Liss, New York.
Resnick R 1981. The endocrine regulation of uterine blood flow in the non-pregnant uterus: a
review. American Journal of Obstetrics and Gynaecology 140, 151.
Revell DK, Morris ST, YH, C, Hanna JE, Thomas DT, Brown S and McCutheon SN 2002.
Shearing ewes at mid-pregnancy is associated with changes in fetal growth and development.
Australian Journal of Agricultural Research 53, 697-705.
Rhoades R and Pflanzer R 1996. Human Physiology. 3 ed. Saunders College Publishing,
London.
References
132
Roberts TJ, Azain MJ, Hausman GJ and Martin RJ 1994. Interaction of insulin and
somatotropin on body weight gain, feed intake, and body composition in rats. American
Journal of Physiology – Endocrinology and Metabolism 267, E293-E299.
Roberts JM, Pearson G, Cutler J and Lindheimer M 2003. Summary of the NHLBI Working
Group on Research on Hypertension during Pregnancy. Hypertension 41, 437-445.
Rodin J 1985. Insulin levels, hunger, and food intake: an example of feedback loops in body
weight regulation. Health Psychology 4, 1-24.
Rurak 2001. Endocrine factors in fetal growth and development, In Fetal growth and
development. Eds. R. Harding and A. D. Bocking, Cambridge University Press, Cambridge.
Sakul H and Boylan WJ 1992. Evaluation of U.S. sheep breeds for milk production. Small
Ruminant Research 7, 195-201.
Sanin LH, Lopez SR, Olivares ET, Terrazas MC, Silva MA and Carrillo ML 2001. Relation
between birth weight and placenta weight. Biology of the Neonate 80, 113-117.
Schauser KH, Nielsen AH, Winther H, Dantzer V and Poulsen K 1998. Autoradiographic
localization and characterization of angiotensin II receptors in the bovine placenta and fetal
membranes. Biology of Reproduction 59, 684-692.
Searle TW and Graham NM 1975. Studies of weaner sheep during and after a period of
weight stasis. II Body composition. Australian Journal of Agricultural Research 26, 355-361.
References
133
Seely EW and Moore TJ 1994. The Renin-Angiotensin-Aldosterone System and Vasopressin,
In D. Tulchinsky and A. B. Little, eds. Maternal-Fetal Endocrinology, 2 ed. WB Saunders
Company, Philadelphia.
Seynaeve M, De Wilde R, Janssens G and De Smet B 1996. The influence of dietary salt level
on water consumption, farrowing and reproductive performance of lactating sows. Journal of
Animal Science 74, 1047-1055.
Shanas U and Haim A 2004. Diet salinity and vasopressin as reproduction modulators in the
desert-dwelling golden spiny mouse (Acomys russatus). Physiology and Behaviour 81, 645-
650.
Shepherd R, Farleigh CA, Atkinson C and Pryor JS 1987. Effects of haemodialysis on taste
and thirst. Appetite 9, 79-88.
Sherwood L 1997. Human Physiology - From cells to systems. 3 ed. Wadsworth Publishing
Company, London.
Smith D, Moore K, Tormey W, Baylis PH and Thompson CJ 2004. Downward resetting of
the osmotic threshold for thirst in patients with SIADH. American Journal of Physiology -
Endocrinology and Metabolism 287, E1019-E1023.
Smriga M, Kameishi M and Torii K 2002. Brief exposure to NaCl during early postnatal
development enhances adult intake of sweet and salty compounds. Neuroreport 13, 2565-
2569.
References
134
Stachenfeld NS and Keefe DL 2002. Estrogen effects on osmotic regulation of AVP and fluid
balance. American Journal of Physiology - Endocrinology and Metabolism 283, E711-E721.
Stevens AD and Lumbers ER 1986. Effect on maternal and fetal renal function and plasma
renin activity of a high salt intake by the ewe. Journal of Developmental Physiology 8, 267-
275.
Stillman IE, Brezis M, Heyman SN, Epstein FH, Spokes K and Rosen S 1994. Effects of salt
depletion on the kidney: changes in medullary oxygenation and thick ascending limb size.
Journal of the American Society of Nephrology 4, 1538-1545.
Symonds ME, Budge H, Stephenson T and McMillen IC 2001. Fetal endocrinology and
development manipulation and adaptation to long-term nutritional and environmental
challenges. Reproduction 121, 853-862.
Takahashi M, Morita T, Sawada M, Uemura T, Haruna A and Shimada A 2005.
Glomerulocystic kidney in a domestic dog. Journal of Comparative Pathology 133, 205-208.
Thomas DT, Rintoul AJ and Masters DG 2007. Sheep select combinations of high and low
sodium chloride, energy and crude protein feed that improve their diet. Applied Animal
Behaviour Science 105, 140-153.
Tulchinsky D and Okada DM 1975. Hormones in human pregnancy. IV. Plasma
progesterone. American Journal of Obstetrics and Gynaecology 121, 293-299.
References
135
Vidonho AF Jr., da Silva AA, Catanozi S, Rocha JC, Beutel A, Carillo BA, Furukawa LN,
Campos RR, de Toledo Bergamaschi CM, Carpinelli AR, Quintao EC, Dolnikoff MS and
Heimann JC 2004. Perinatal salt restriction: a new pathway to programming insulin resistance
and dyslipidemia in adult wistar rats. Paediatric Research 56, 842-848.
Wallace JM 2000. Nutrient partitioning during pregnancy: adverse gestational outcome in
overnourished adolescent dams. Proceedings of the Nutrition Society 59, 107-117.
Wallace JM, Aitken RP, Milne JS and Hay WW Jr. 2004. Nutritionally mediated placental
growth restriction in the growing adolescent: consequences for the fetus. Biology of
Reproduction 71, 1055-1062.
Warren BE, Casson T and Barrett-Lennard E 1995. Value of saltbush questioned. Western
Australia Journal of Agriculture 36, 24-27.
Warren BE and Casson T 1996. Saltbushes for forage - where have we been and where are we
going? Australian Journal of Soil and Water conservation 9, 41-44.
Wilkes BM, Krim E and Mento PF 1985. Evidence for a functional renin-angiotensin system
in full-term fetoplacental unit. American Journal of Physiology – Endocrinology and
Metabolism 249, E366-E373.
Williams GH and Dluhy RG 1972. Aldosterone biosynthesis. Interrelationship of regulatory
factors. American Journal of Medicine 53, 595-605.
References
136
Williams GH, Hollenberg NK and Moore TJ 1978. Failure of renin suppression by
angiotensin II in hypertension. Circulatory Research 42, 46.
Wilson AD 1966. The value of Atriplex (saltbush) and Kochia (bluebush) species as food for
sheep. Australian Journal of Agricultural Research 17, 147-153.
Wilson AD 1966. The tolerance of sheep to sodium chloride in food or drinking water.
Australian Journal of Agricultural Research 17, 503-514.
Wilson AD 1966. The intake and excretion of sodium by sheep fed on species of Atriplex
(saltbush) and Kochia (bluebush). Australian Journal of Agricultural Research 17, 155-163.
Wilson AD and Hindley NL 1968. Effect of restricted access to water on the intake of salty
foods by Merino and Border Leicester sheep. Australian Journal of Agricultural Research 19,
597-604.
Wilson AD and Dudzinski ML 1973. Influence of the concentration and volume of saline
water on the food intake of sheep and on their excretion of sodium and water in urine and
faeces. Australian Journal of Agricultural Research 17, 245-256.
Wilson AD 1975. Influence of water salinity on sheep performance while grazing on natural
grassland and saltbush pastures. Australian Journal of Experimental Agriculture and Animal
Husbandry 15, 760-765.
References
137
Wilson M, Morganti AA, Zervoudakis I, Letcher RL, Romney BM, Von Oeyon P, Papera S,
Sealey JE and Laragh JH 1980. Blood pressure, the renin-aldosterone system and sex steroids
throughout normal pregnancy. American Journal of Medicine 68, 97-104.
Wintour M 2002. Early life of fetus effects organs' future health. Experimental biology.
Woods SC, Porte D Jr., Bobbioni E, Ionescu E, Sauter JF, Rohner-Jeanrenaud F and
Jeanrenaud B 1985. Insulin: its relationship to the central nervous system and to the control of
food intake and body weight. American Journal of Clinical Nutrition 42, 1063-1071.
Woods SC, Figlewicz Lattemann DP, Schwartz MW and Porte D Jr. 1990. A re-assessment of
the regulation of adiposity and appetite by the brain insulin system. International Journal of
Obesity 14 Suppl 3, 69-73; discussion 74-6.
Xu Z, Shi L and Yao J 2004. Central angiotensin II-induced pressor responses and neural
activity in utero and hypothalamic angiotensin receptors in preterm ovine fetus. American
Journal of Physiology - Heart and Circulatory Physiology 286, H1507-H1514.
Zhang DY, Lumbers ER, Simonetta G, Wu JJ, Owens JA, Robinson JS and McMillen IC
2000. Effects of placental insufficiency on the ovine fetal renin-angiotensin system.
Experimental Physiology 85, 79-84.