Embed Size (px)
Citation preview
High Economic Growth Equity and Sustainable Energy
Development of India
Prof. Ramprasad SenguptaCentre for Economic Studies & Planning
School of Social SciencesJawaharlal Nehru University
New DelhiDecember 2008
1
2
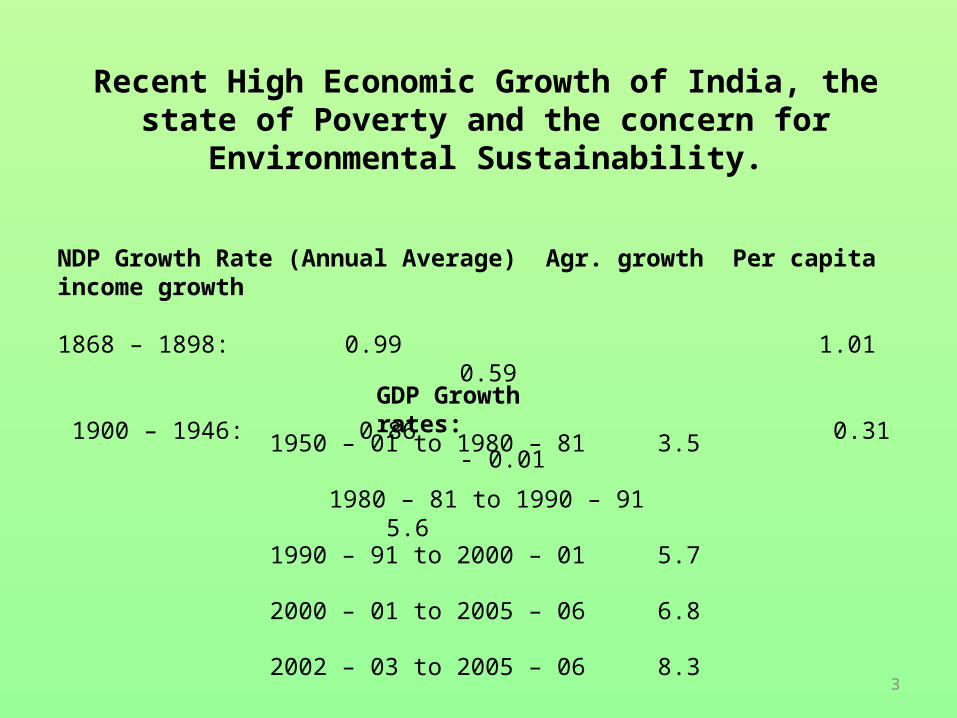
Recent High Economic Growth of India, the state of Poverty and the concern for Environmental Sustainability.
NDP Growth Rate (Annual Average) Agr. growth Per capita income growth
1868 – 1898: 0.99 1.01 0.59
1900 – 1946: 0.86 0.31 - 0.01
GDP Growth rates:
1950 – 01 to 1980 – 81 3.5
1980 – 81 to 1990 – 91 5.6
1990 – 91 to 2000 – 01 5.7
2002 – 03 to 2005 – 06 8.3
2000 – 01 to 2005 – 06 6.8
3
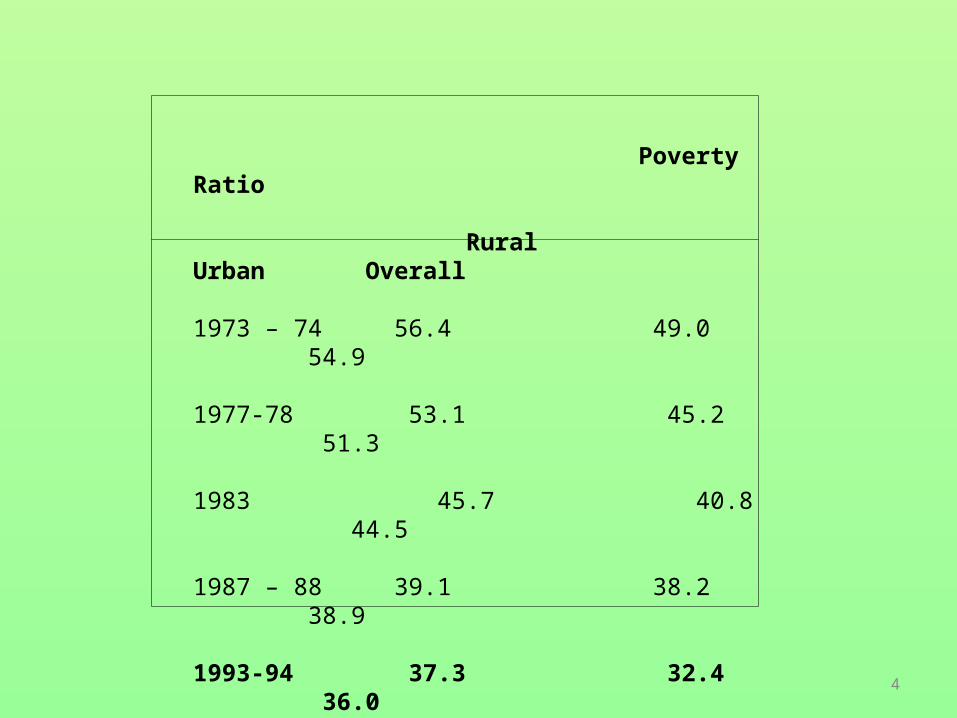
Poverty Ratio
Rural Urban Overall
1973 – 74 56.4 49.0 54.9
1977-78 53.1 45.2 51.3
1983 45.7 40.8 44.5
1987 – 88 39.1 38.2 38.9
1993-94 37.3 32.4 36.0 2004 - 05 28.3 25.7 27.5
4
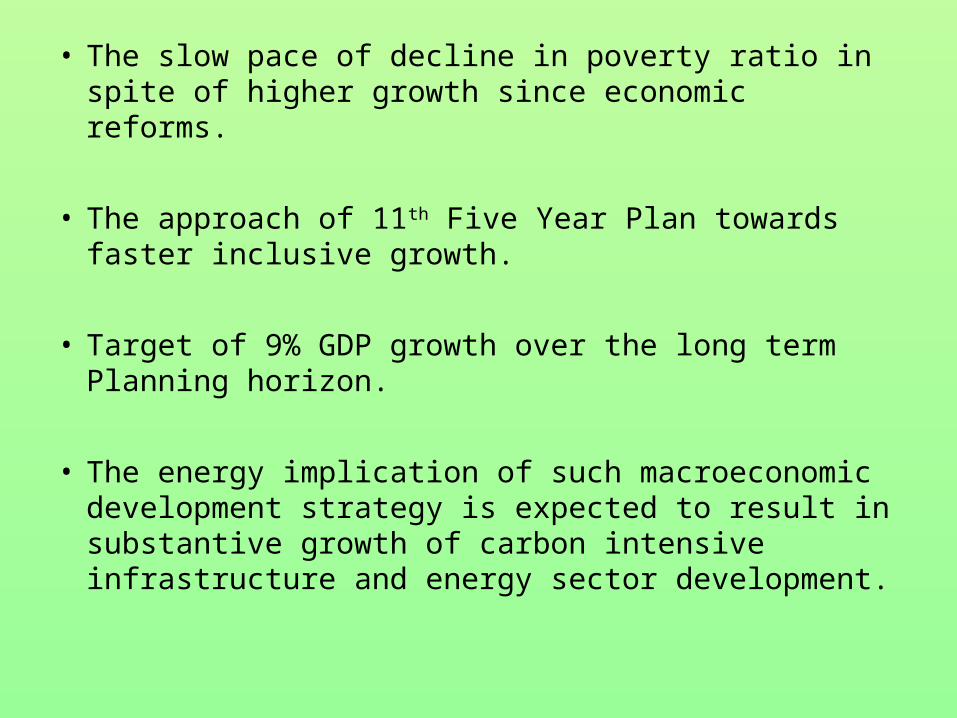
• The slow pace of decline in poverty ratio in spite of higher growth since economic reforms.
• The approach of 11th Five Year Plan towards faster inclusive growth.
• Target of 9% GDP growth over the long term Planning horizon.
• The energy implication of such macroeconomic development strategy is expected to result in substantive growth of carbon intensive infrastructure and energy sector development.
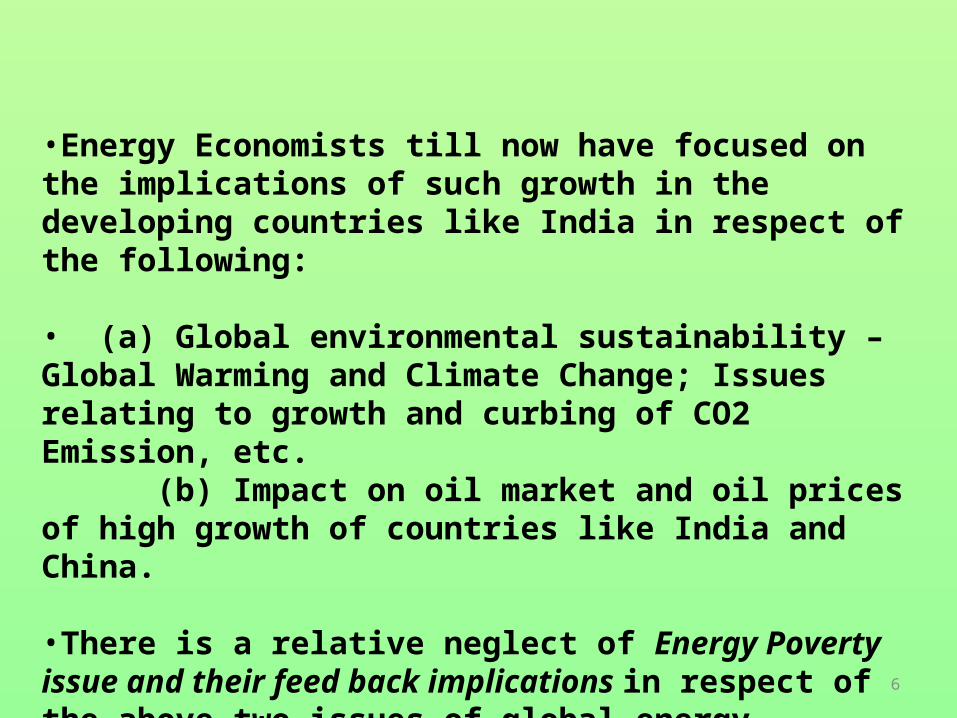
•Energy Economists till now have focused on the implications of such growth in the developing countries like India in respect of the following:
• (a) Global environmental sustainability – Global Warming and Climate Change; Issues relating to growth and curbing of CO2 Emission, etc. (b) Impact on oil market and oil prices of high growth of countries like India and China. •There is a relative neglect of Energy Poverty issue and their feed back implications in respect of the above two issues of global energy security and environmental sustainability.
6
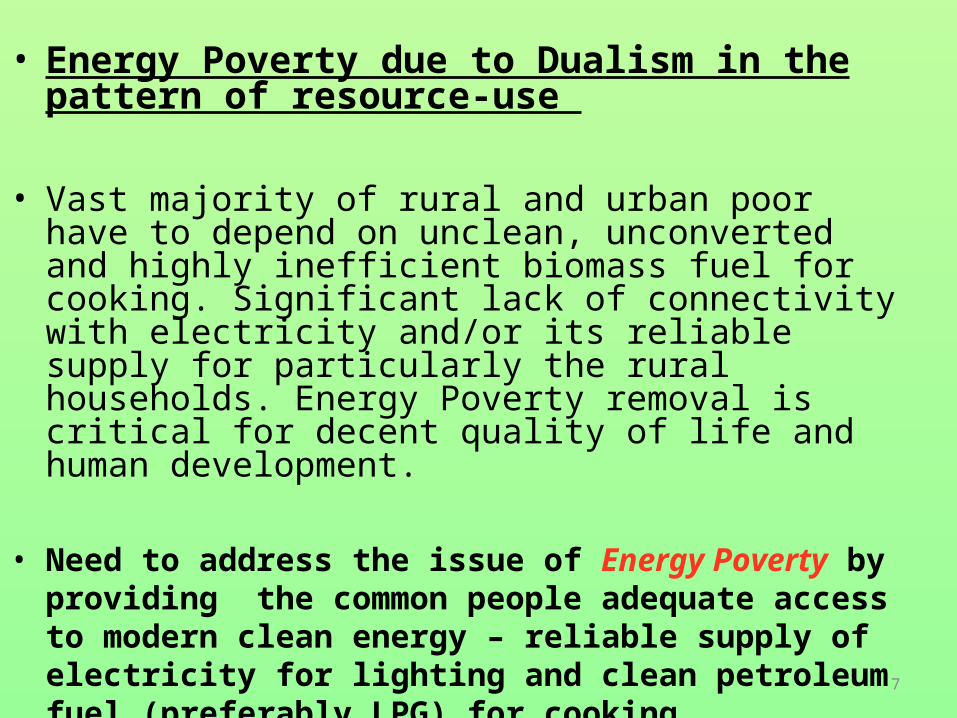
• Energy Poverty due to Dualism in the pattern of resource-use
• Vast majority of rural and urban poor have to depend on unclean, unconverted and highly inefficient biomass fuel for cooking. Significant lack of connectivity with electricity and/or its reliable supply for particularly the rural households. Energy Poverty removal is critical for decent quality of life and human development.
• Need to address the issue of Energy Poverty by providing the common people adequate access to modern clean energy – reliable supply of electricity for lighting and clean petroleum fuel (preferably LPG) for cooking.
7

• This would cause substitution of carbon neutral bio mass by fossil fuel unless we can find opportunities of wide application of modern renewables at affordable cost. This may in the net, cause upward pressure on the environment so far as carbon emissions are concerned. However, one needs to work out the comparative balances for not only CO2 but of other GHG gases for alternative uses of biomass and kerosene / LPG and between kerosene lighting with shorter days and and between spread of electricity.
•Issue of OIL Security :
Policy of use of bio fuels - particulary bio diesel and ethanol have their serious implications in respect of land use pattern as these would be affected by oil price movement. And this would have their serious implications in respect of food security which may conflict with the objective of oil security.
8
TREND AND PATTERN OF ENERGY CONSUMPTION IN
INDIA
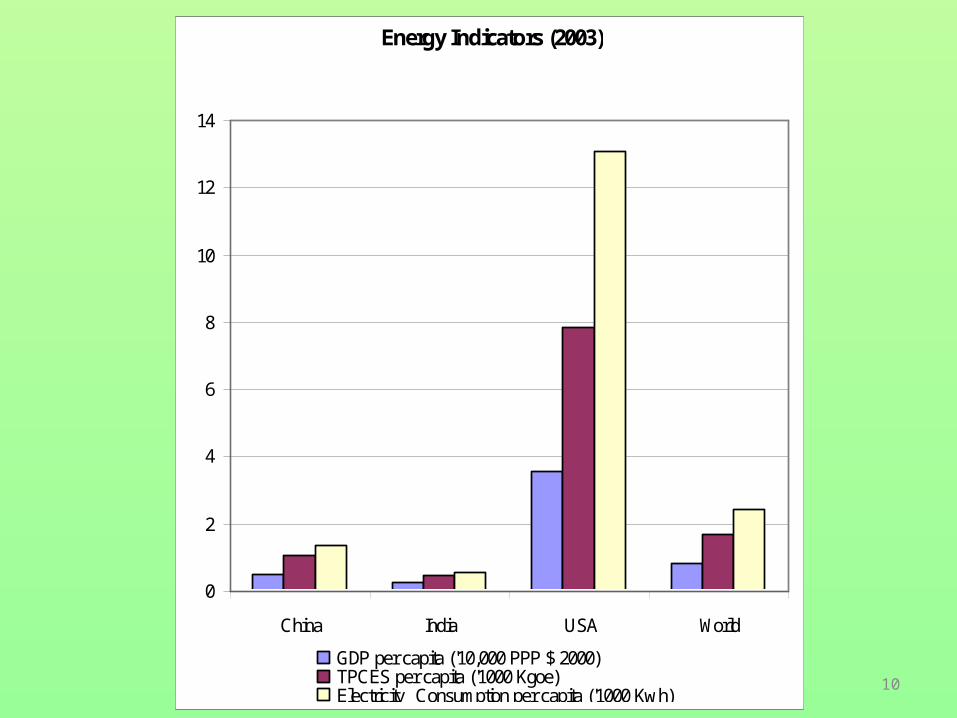
Energy Indicators (2003)
0
2
4
6
8
10
12
14
China India USA World
GDP per capita ('10,000 PPP $ 2000)TPCES per capita ('1000 Kgoe)Electricity Consumption per capita ('1000 Kw h) 10


& wastes (2004)
Comparative share of Biomass and CO2 emission per capita.

% Sectoral Share
Residential Households
34%
Agriculture8%
T ransport8%
Industry31%
Commercial & Public Services
7%
Non-Energy Use12%
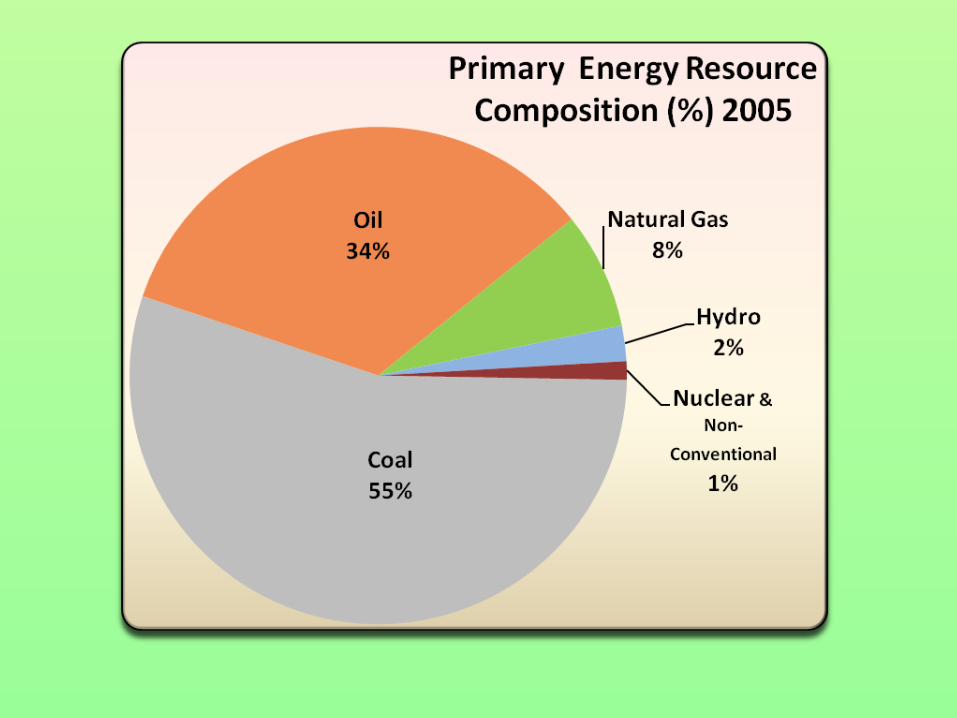
Of Primary Energy 2005Of Primary Energy 2005
14

Fuelwise Sectoral Distribution of Final Commercial Energy Use.
Unit: % Sectoral share
% Sectoral share in Final Commercial Energy Use2005
Transport22%
Agriculture9%
Residential Households
20%
Commercial & Public Services
7%
Industry42%
15
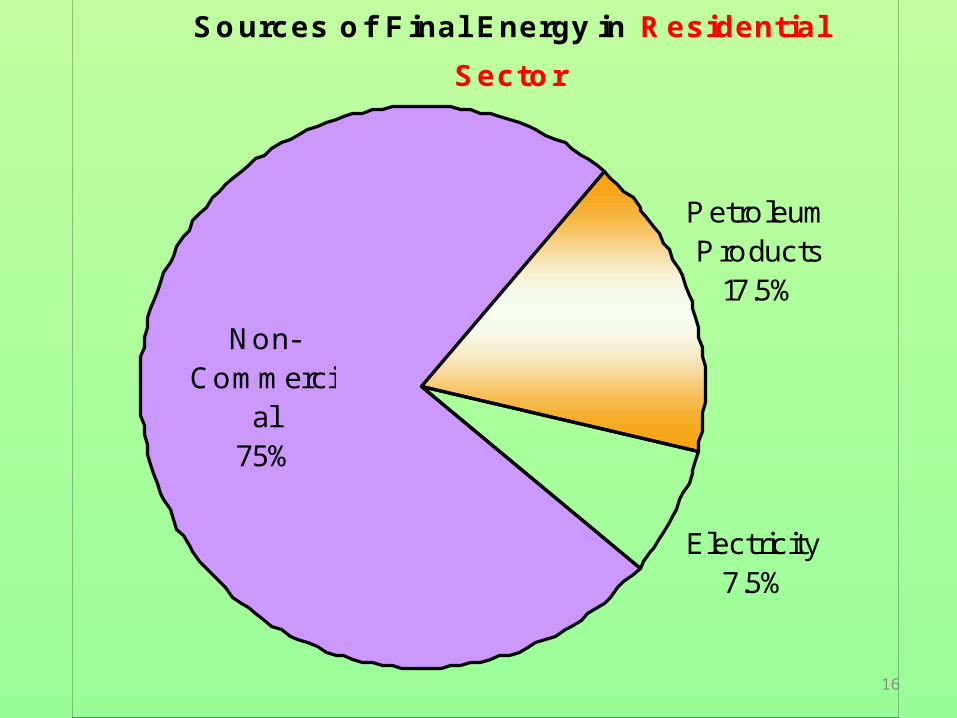
Sources of Final Energy in Residential
Sector
Non-Commerci
al75%
Electricity7.5%
P etroleum P roducts
17.5%
16
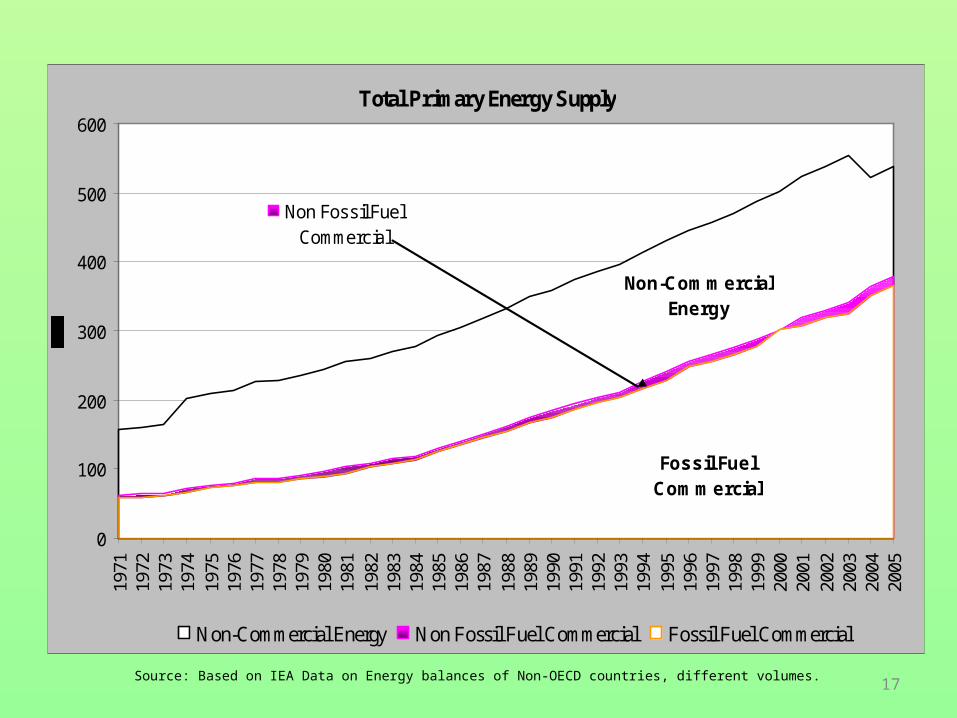
Total Primary Energy Supply
Non-Commercial Energy
Non Fossil Fuel Commercial
Fossil Fuel Commercial
0
100
200
300
400
500
60019
7119
7219
7319
7419
7519
7619
7719
7819
7919
8019
8119
8219
8319
8419
8519
8619
8719
8819
8919
9019
9119
9219
9319
9419
9519
9619
9719
9819
9920
0020
0120
0220
0320
0420
05
Non-Commercial Energy Non Fossil Fuel Commercial Fossil Fuel Commercial
Source: Based on IEA Data on Energy balances of Non-OECD countries, different volumes.17
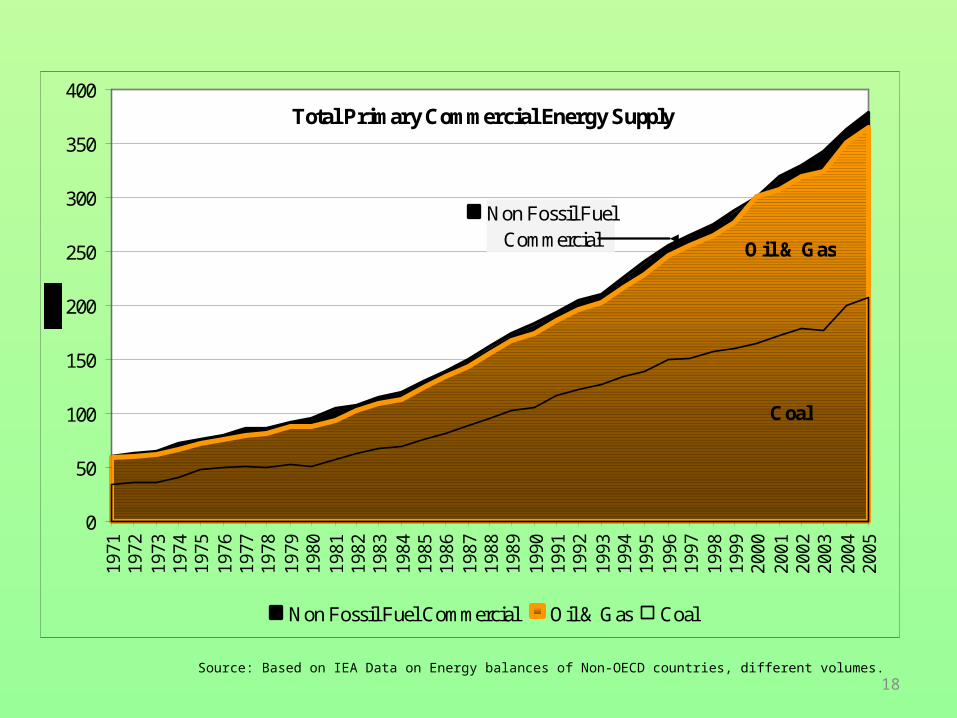
Total Primary Commercial Energy Supply
Non Fossil Fuel Commercial Oil & Gas
Coal
0
50
100
150
200
250
300
350
4001
97
11
97
21
97
31
97
41
97
51
97
61
97
71
97
81
97
91
98
01
98
11
98
21
98
31
98
41
98
51
98
61
98
71
98
81
98
91
99
01
99
11
99
21
99
31
99
41
99
51
99
61
99
71
99
81
99
92
00
02
00
12
00
22
00
32
00
42
00
5
Non Fossil Fuel Commercial Oil & Gas Coal
Source: Based on IEA Data on Energy balances of Non-OECD countries, different volumes.18

Final Commercial Energy Supplied
Elctricity
Gas
Oil
Coal
0
50
100
150
200
2501
97
11
97
21
97
31
97
41
97
51
97
61
97
71
97
81
97
91
98
01
98
11
98
21
98
31
98
41
98
51
98
61
98
71
98
81
98
91
99
01
99
11
99
21
99
31
99
41
99
51
99
61
99
71
99
81
99
92
00
02
00
12
00
22
00
32
00
42
00
5
Electricity Gas Oil Coal
Source: Based on IEA Data on Energy balances of Non-OECD countries, different volumes.19

Total Energy Input, Losses and Final Use of Electricity.
Conversion loss
Aux. and T&D loss
Final Use of Electricity
0
50
100
150
200
2501
97
1
19
73
19
75
19
77
19
79
19
81
19
83
19
85
19
87
19
89
19
91
19
93
19
95
19
97
19
99
20
01
20
03
20
05
MT
OE
Conversion loss Aux. and T&D loss Final Use of Electricity
Source: Based on IEA Data on Energy balances of Non-OECD countries, different volumes 20
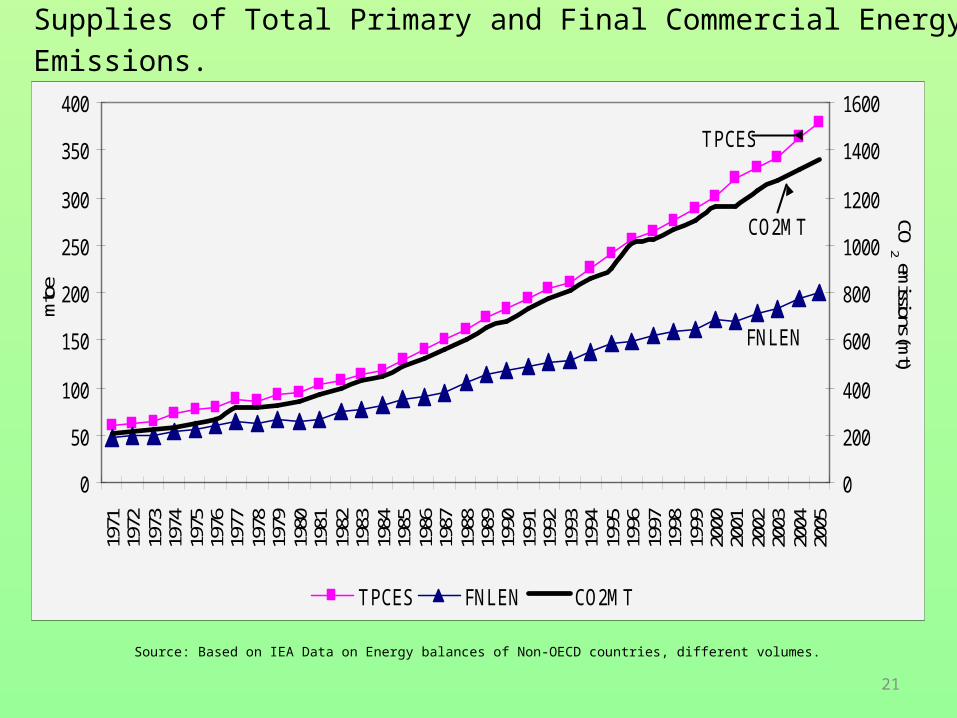
Supplies of Total Primary and Final Commercial Energy and CO2 Emissions.
TPCES
FNLEN
CO2MT
0
50
100
150
200
250
300
350
40019
7119
7219
7319
7419
7519
7619
7719
7819
7919
8019
8119
8219
8319
8419
8519
8619
8719
8819
8919
9019
9119
9219
9319
9419
9519
9619
9719
9819
9920
0020
0120
0220
0320
0420
05
mto
e
0
200
400
600
800
1000
1200
1400
1600
CO2 em
issions (mt)
TPCES FNLEN CO2MT
Source: Based on IEA Data on Energy balances of Non-OECD countries, different volumes.
21

0.000
0.020
0.040
0.060
0.080
0.100
0.120
1971
1973
1975
1977
1979
1981
1983
1985
1987
1989
1991
1993
1995
1997
1999
2001
2003
2005
TPESCMINT CO2KGINT
Primary Commercial Energy and CO2 intensity over time
22
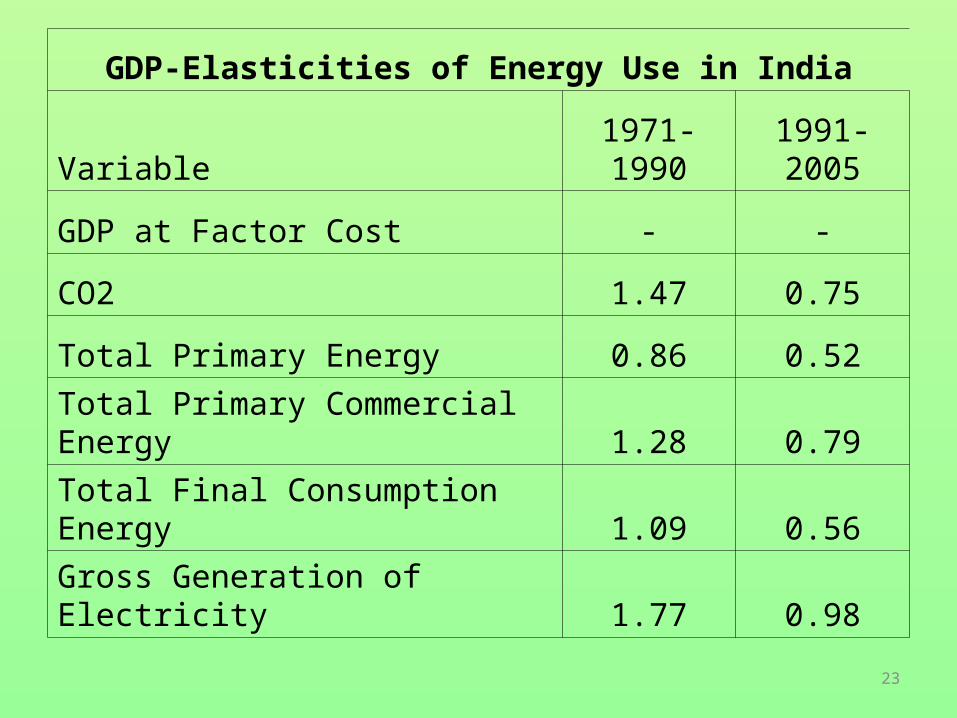
GDP-Elasticities of Energy Use in India
Variable 1971-1990 1991-2005
GDP at Factor Cost - -
CO2 1.47 0.75
Total Primary Energy 0.86 0.52
Total Primary Commercial Energy 1.28 0.79
Total Final Consumption Energy 1.09 0.56
Gross Generation of Electricity 1.77 0.98
23
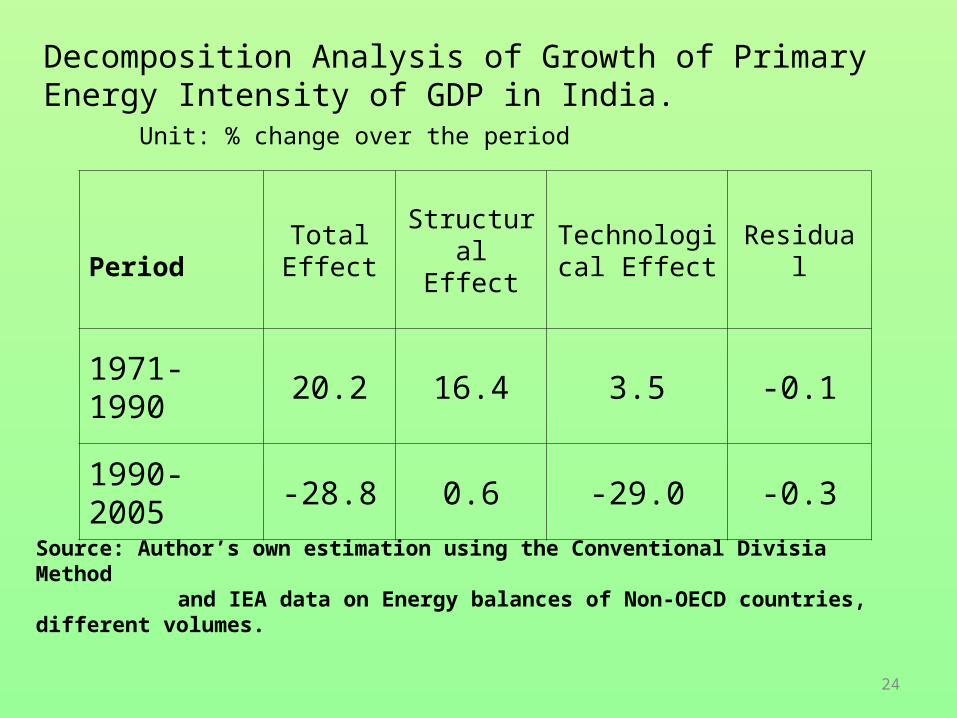
Decomposition Analysis of Growth of Primary Energy Intensity of GDP in India. Unit: % change over the period
PeriodTotal Effect
Structural Effect
Technological Effect
Residual
1971-1990 20.2 16.4 3.5 -0.1
1990-2005 -28.8 0.6 -29.0 -0.3
Source: Author’s own estimation using the Conventional Divisia Method and IEA data on Energy balances of Non-OECD countries, different volumes.
24

Decomposition Analysis of Growth of Final Energy & Fuel-wise Intensity of GDP in India.
Unit: % change over the period.
FuelPeriod
Total Effect
Structural Effect
Technological Effect
Residual Effect
Final Energy
1971-1990 11.57 18.52 -5.87 negligible
1990-2005 -32.57 4.83 -35.10 -0.89
Electricity
1971-1990 64.88 11.12 49.67 -0.86
1990-2005 -12.77 -5.64 -7.54 -0.03
Source: Author’s own estimation using the Conventional Divisia Method and IEA data on Energy balances of Non-OECD countries, different volumes.
25

Share of final compositional effect in the total change in Carbon Intensity of Energy in India. Unit: % increase over the period
Period Sector Total EffectCompositional
Effect
1971-1990Aggregate Economy
11.38 -0.26
1990-2005Aggregate Economy
-1.05 -1.34
1971-1990 Electricity 58.68 40.07
1990-2005 Electricity 5.00 1.52
Source: Author’s own estimation using the Conventional Divisia Method and IEA data on Energy balances of Non-OECD countries, different volumes.
26
Economic Reforms and Delinking of Energy & Growth
In the post reform period, the sectoral structural adjustment caused little change in primary energy intensity contributing only an annual increase of 0.04% per annum on this account.
On the other hand, the technological changes brought about by the increased industrial competitiveness and the inflow of foreign investment and technology due to liberalisation contributed to the decline of energy intensity at the rate of 2.3% per annum.
27

ENERGY RESOURCE ENDOWMENT AND FUTURE PROJECTIONS OF INDIA’S ENERGY DEVELOPMENT

Energy Resources for Planning
Table 5: Fossil Fuel Reserves of India as on 2005(Unit: Million tonnes of Oil equivalent)
ResourcesProved
Production(2004-05)
Net Imports(2004-05)
Proved Reserve to Production
Extracted Coal 13489 157 16 86
Extractable Lignite
1220 9 136
Oil 786* 34 87 23
Natural Gas 1101* 29 3(LNG) 38
Coal Bed Methane
765
* indicates Balance of recoverable ReservesSource: Planning Commission, 2006a.
29

Table 6: Renewable Energy Resources of India(Unit: mtoe per year)
Resources Present Potential
1 Hydro Power Capacity (in MW) 32, 000 1,50,000
2 Biomass
(a) Fuelwood 140 620
(b) Biogas* 0.1 15
3 Bio-Fuels @
(a) Biodiesel - 20
(b) Ethanol <1 10
4 Solar @
(a) Photovoltaic 1200
(b) Thermal 1200
5 Wind Energy <1 10
6 Small Hydro-power <1 5
Based on the assumption of Community Plants.@ Based on assumptions regarding land availability (for details see the source)Source: Planning Commission, 2006a. 30

Table 7: Potential Availability of Nuclear Energy of India
Resource Base
Metal resource(tonnes)
Electricity Energy
(GWe-Yr)
Electricity Capacity(MWe)
1 Uranium Metal 61,000
(a) In PWHR- 330 10,000
(b) in Breeder - 42,200 5,00,000
2 Thorium Metal 2,25,000
In Breeder- 1,50,000 Very large
Source: Planning Commission, 2006a.
PresentInstalledCapacityMwe3400
31
Indian Planning Commission’s Projections for the future:(Integrated Energy Policy Committee Report, 2006)
•Use of Linear Programming Optimisation model to find out the least cost option to meet the 9% GDP growth requirement along with Sector Restructuring which would ensure faster removal of poverty and inclusiveness of growth.
•Unconstrained cost minimisation giving coal-dominating scenario.
32

Table 30: Energy Resource Mix for 8% GDP Growth in 2031-32, India.
Items
Coal Dominant
Case
Max. Use of Potential of
Hydro, Nuclear & Gas
Simultaneous Use of all Optima for
Sustainable Energy Development
Total Energy requirement (mtoe)
1702 1652 1351
Shares of
(a) Coal 54.1 45.5 41.1
(b) Crude Oil 25.7 26.4 22.8
(c.) Natural Gas 5.5 10.7 9.8
(d) Hydro 0.7 1.9 2.2
(e) Nuclear 4.0 5.3 6.4
(f) Renewables 0.1 0.1 5.6
(g) Non-Commercial 9.8 10.1 12.0
Source: Planning Commission 2006a. 33

Energy Resource Mix for 8% GDP Growth in 2031-32.
Percentage Share in Energy Resource Mix (2031-32)
25.7 26.4 22.8
5.510.7 9.8
0.7 1.9 2.24 5.3 6.40.1 0.1
5.69.8 10.1 12
54.145.5
41.1
0
10
20
30
40
50
60
Coal Dominant Case Max. Use of Potential of Hydro,Nuclear & Gas
Simultaneous Use of all Optima forSustainable Energy Development
Coal Crude Oil Natural Gas Hydro Nuclear Renewables Non-Commercial
34

Future Projections and Policy Issues
It is important to notice that the dependence of India on coal in 2031-32 will remain 51% in electricity generation and have a share of over 41% in the total primary energy mix even as per the best environmental scenario among the options.
The gas resource is to be used only for peaking power even when it is forced as an option.
The capacity utilisation of hydro power is found to be low because of the low availability of water resources.
35
CO2 ImplicationThe CO2 emission to grow from the current level of 1 billion tonne per year to 5.5 billion tonne as per the high coal development scenario and 3.9 billion tonne as per the most environmentally conserving scenario. Even with all these energy sector developments, India’s per capita carbon emission would be in the range of 2.6 to 3.6 tonnes of CO2 while the same for the US and the World on the average has been 20 tonnes and 4.5 tonnes respectively in 2004.
Non-conventional Energy ResourcesHowever, even at the best the non conventional renewables cannot provide more than 5.6% of total energy requirements. Any failure of other options to provide the designated supply, the economy of India has to fall back upon coal to meet any deficiency.
36
ENERGY POVERTY ANALYSIS
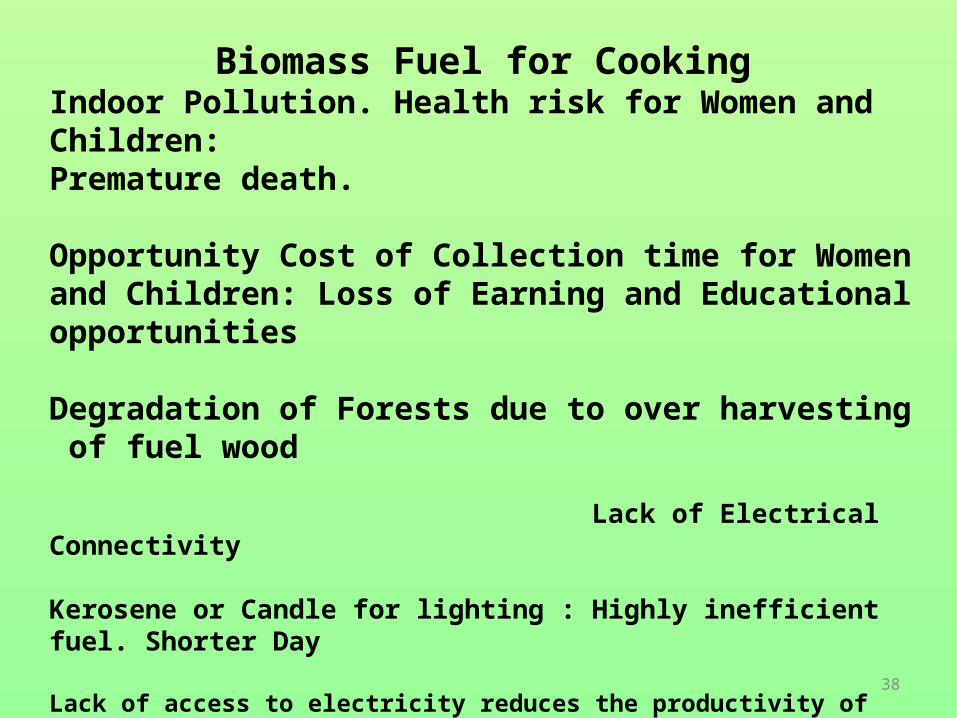
Biomass Fuel for CookingIndoor Pollution. Health risk for Women and Children: Premature death.
Opportunity Cost of Collection time for Women and Children: Loss of Earning and Educational opportunities
Degradation of Forests due to over harvesting of fuel wood
Lack of Electrical Connectivity
Kerosene or Candle for lighting : Highly inefficient fuel. Shorter Day
Lack of access to electricity reduces the productivity of educational efforts, denies the opportunity of use of a whole variety of equipment
Dynamic externalities of modern energy services - higher human capabilities and long run earning .
38
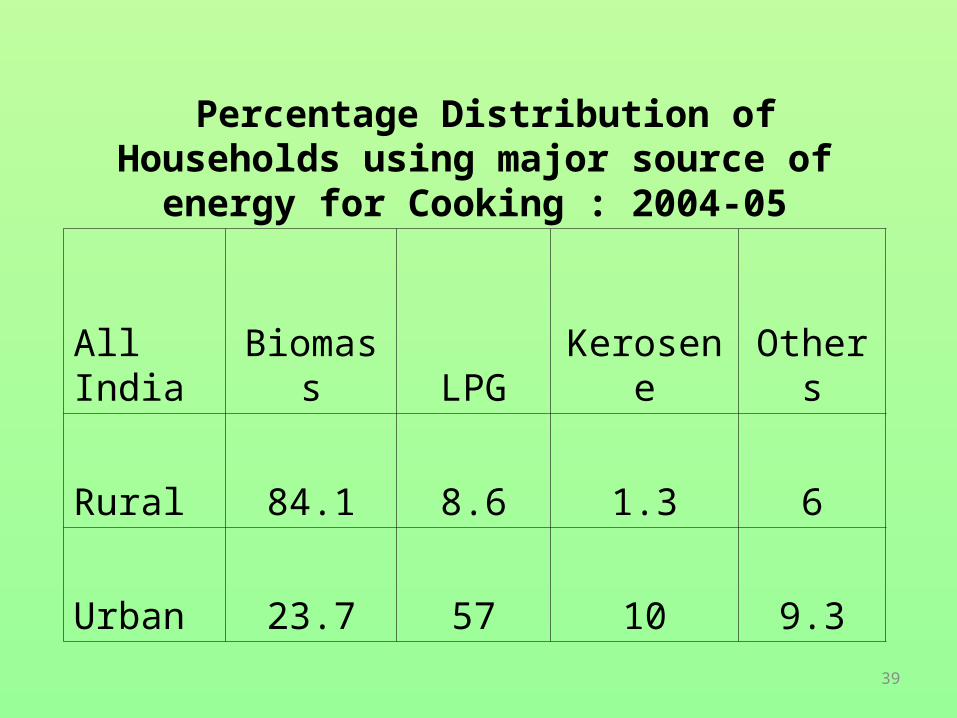
Percentage Distribution of Households using major source of energy for Cooking : 2004-05
All India Biomass LPG Kerosene Others
Rural 84.1 8.6 1.3 6
Urban 23.7 57 10 9.3
39

Percentage Distribution of Households using major source of energy for Lighting: 2004-05
All India Electricity Kerosene Others
Rural 54.9 44.4 0.7
Urban 92.3 7.1 0.6
40
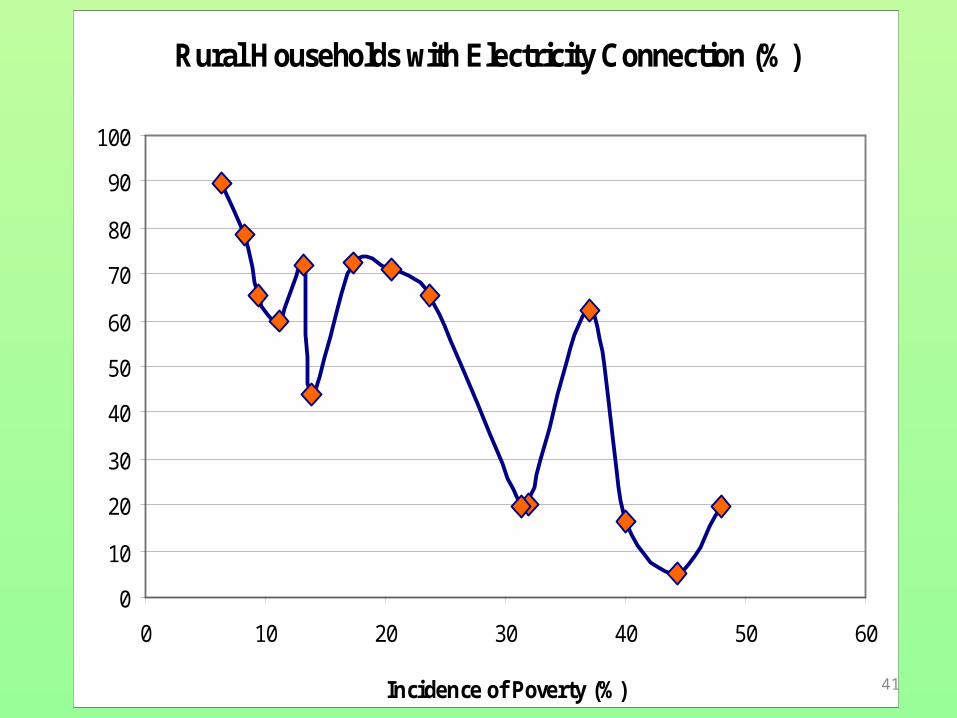
Rural Households with Electricity Connection (%)
0
10
20
30
40
50
60
70
80
90
100
0 10 20 30 40 50 60
Incidence of Poverty (%) 41

Urban Households with Electricity Connection (%)
0
20
40
60
80
100
120
0 10 20 30 40 50
Incidence of Poverty (%)42

43
44
INCOME POVERTY AND ENERGY POVERTY
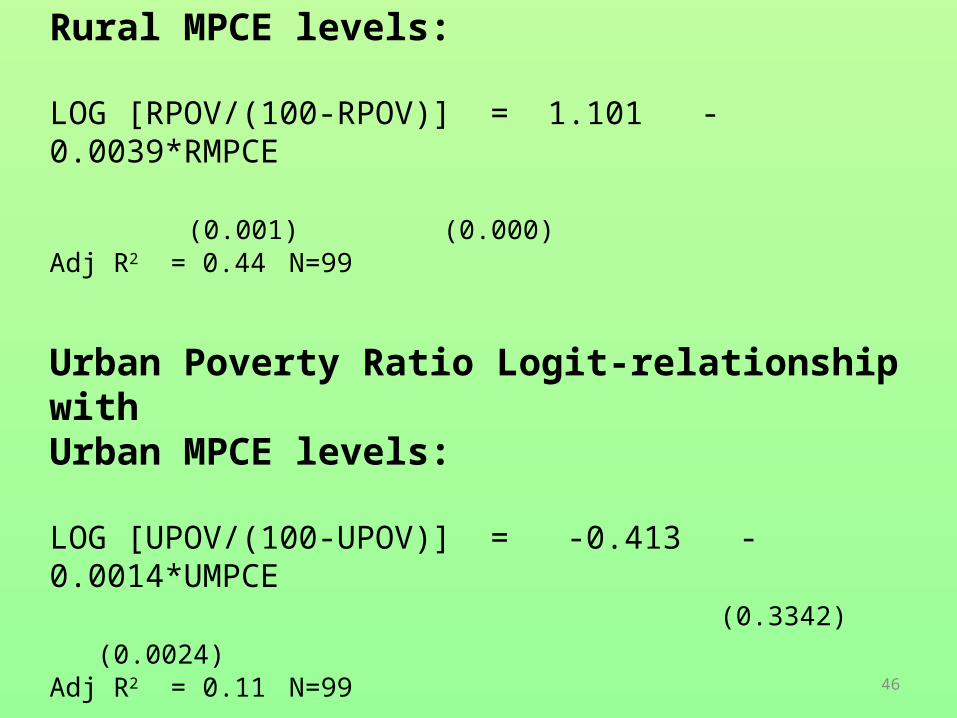
Rural Poverty Ratio Logit-relationship with Rural MPCE levels:
LOG [RPOV/(100-RPOV)] = 1.101 - 0.0039*RMPCE (0.001) (0.000)Adj R2 = 0.44 N=99
Urban Poverty Ratio Logit-relationship with Urban MPCE levels:
LOG [UPOV/(100-UPOV)] = -0.413 - 0.0014*UMPCE (0.3342) (0.0024)Adj R2 = 0.11 N=99
Source: Based on National Sample Survey Organisation Reports, NSS 1993/94 (50th Round), 1999/00 (55th Round) and 2004/05 (61st Round); Govt. of India.
46
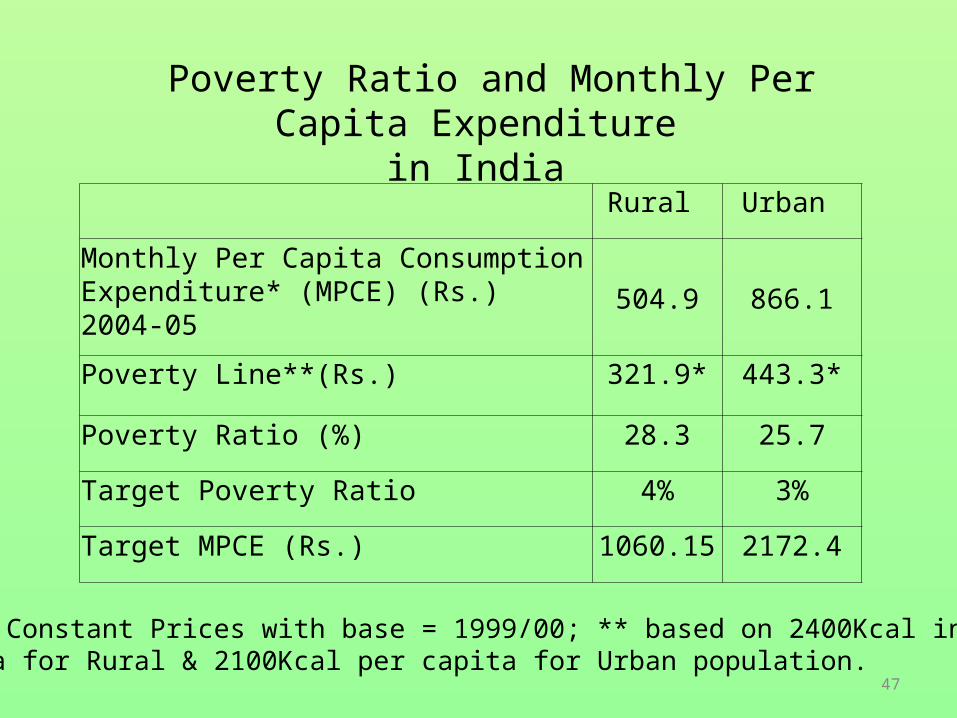
Poverty Ratio and Monthly Per Capita Expenditure in India
*: In Constant Prices with base = 1999/00; ** based on 2400Kcal intake per capita for Rural & 2100Kcal per capita for Urban population.
47
Rural Urban
Monthly Per Capita Consumption Expenditure* (MPCE) (Rs.) 2004-05 504.9 866.1
Poverty Line**(Rs.) 321.9* 443.3*
Poverty Ratio (%) 28.3 25.7
Target Poverty Ratio 4% 3%
Target MPCE (Rs.) 1060.15 2172.4

Relationship between Primary Source of Energy and MPCERegression Results
Source of Energy Dependent Variable
Constant MPCE Adjusted R2
Rural
Electricity for Lighting
Proportion of HHs* using Electricity
-1.268 0.002 0.765
Biomass for Cooking
Proportion of HHs using Biomass
2.913 -0.002 0.808
Kerosene for Cooking
Proportion of HHs using Kerosene
-5.712 0.002 0.644
Kerosene & LPG for Cooking
Proportion of HHs using
Kerosene & LPG
-5.599 0.004 0.756
*: HHs: Households48
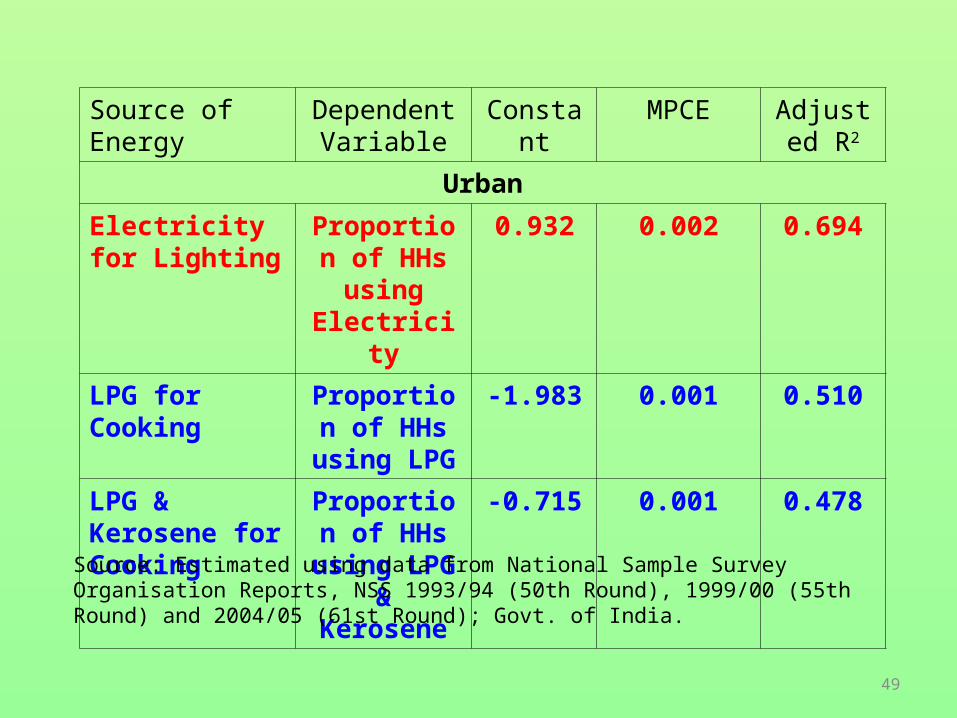
Source of Energy Dependent Variable
Constant MPCE Adjusted R2
Urban
Electricity for Lighting
Proportion of HHs using Electricity
0.932 0.002 0.694
LPG for Cooking
Proportion of HHs using
LPG
-1.983 0.001 0.510
LPG & Kerosene for Cooking
Proportion of HHs using
LPG & Kerosene
-0.715 0.001 0.478
Source: Estimated using data from National Sample Survey Organisation Reports, NSS 1993/94 (50th Round), 1999/00 (55th Round) and 2004/05 (61st Round); Govt. of India.
49

The estimated accessibility of modern energy for lighting
Income - Poverty RatioRural Sector poverty ratio 28.3% 4%
Proportion of household With access to electricity% 44 84
Urban Sector poverty ratio 25.7 3
Proportion of household With access to electricity% 88 96

The estimated accessibility of modern energy for cooking Income - Poverty RatioRural Sector poverty ratio 28.3% 4%
Proportion of household With access to biomass % 80 - 84 44 - 48
Proportion of household With access to kerosene % 5 35
Proportion of household With access to LPG % 8 19
Urban Sector poverty ratio 25.7 3
Proportion of household With access to LPG 59 79
Proportion of household With access to kerosene % 3 7
Residual proportion of households With access to other fuels, incl. 38 14 biomass, soft coke,etc.

The Demand for Various Energy Items by Households. (in mtoe)Year Fire Wood Dung Cake Kerosene LPG Electricity Total
2000 79.62 29.61 10.07 6.42 8.43 134.15
2006 88.78 37.33 12.77 16.87 19.26 175.01
2011 88 31.16 13.16 27.36 33.63 193.31
2021 96.67 30.28 13.71 44.72 59.35 244.73
52

Projected Total Primary Energy Requirement with GDP Growth Rate of 9%.
72%
28%
76%
24%85%
15%91%
9%
0
500
1000
1500
2000
2500
2006-07 2011-12 2021-22 2031-32
Share of Primary Commercial Energy Share of Non-Commercial Energy
53

ENERGY SECURITY: CASE OF OIL
54
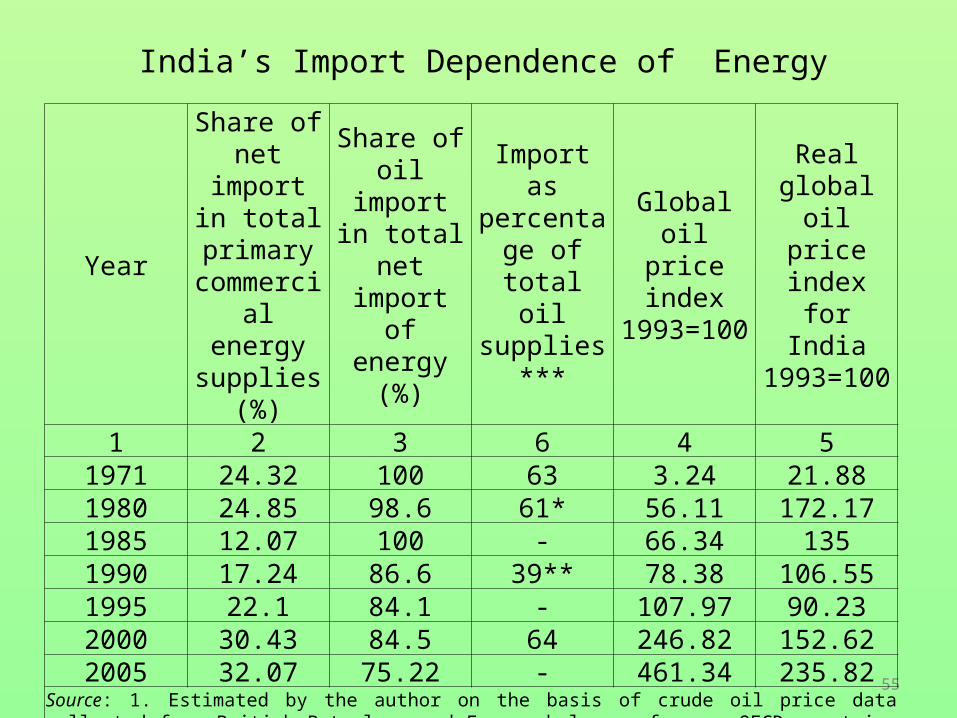
India’s Import Dependence of Energy
55
Year
Share of net import in
total primary commercial
energy supplies (%)
Share of oil import in total net
import of energy (%)
Import as percentage of total oil
supplies***
Global oil price index 1993=100
Real global oil price index for
India 1993=100
1 2 3 6 4 51971 24.32 100 63 3.24 21.881980 24.85 98.6 61* 56.11 172.171985 12.07 100 - 66.34 1351990 17.24 86.6 39** 78.38 106.551995 22.1 84.1 - 107.97 90.232000 30.43 84.5 64 246.82 152.622005 32.07 75.22 - 461.34 235.82
Source: 1. Estimated by the author on the basis of crude oil price data collected from British Petroleum and Energy balances for non-OECD countries of the International Energy published by OECD 2. Column 6 from Ministry of Petroleum and Natural Gas, cited in Subramanian et al (2005) Note: * Figure pertains to year 1981, ** Figure pertains to year 1991, *** total oil supplies refers to sum of production and import of crude oil in India for the respective years.

World Supply and Consumption of Oil, 1980-2007
0.0
10000.0
20000.0
30000.0
40000.0
50000.0
60000.0
70000.0
80000.0
90000.0
1980
1981
1982
1983
1984
1985
1986
1987
1988
1989
1990
1991
1992
1993
1994
1995
1996
1997
1998
1999
2000
2001
2002
2003
2004
2005
2006
2007
(in
1000
bar
rels
per
day
)
World Supplies World Consumption India consumption
China consumption Asia and Oceanic consumption56
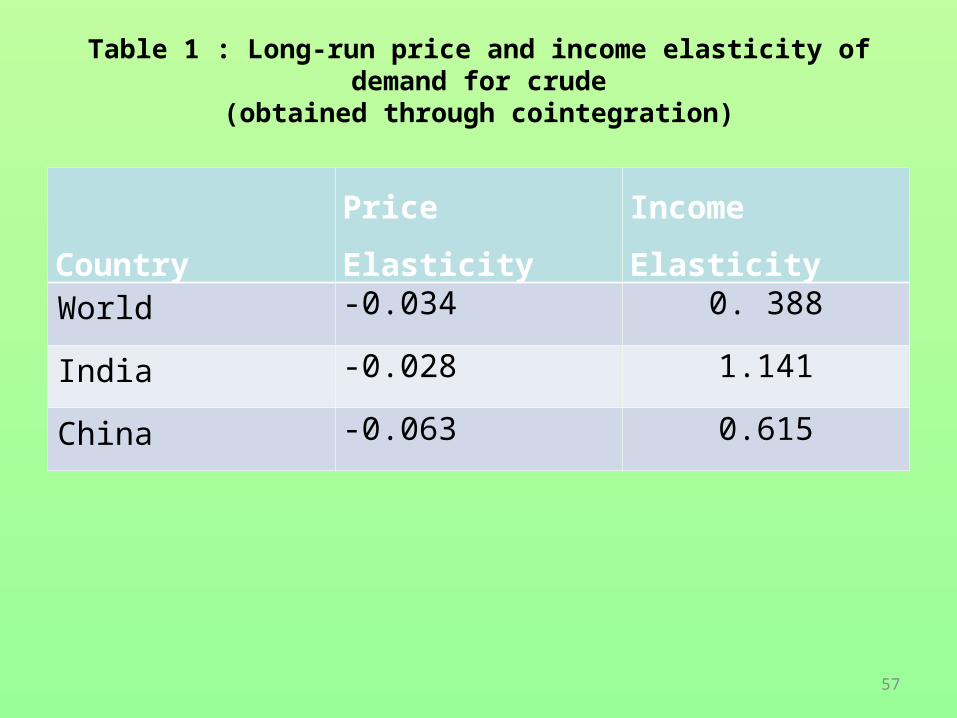
Table 1 : Long-run price and income elasticity of demand for crude
(obtained through cointegration)
Country
Price Elasticity Income Elasticity
World -0.034 0. 388
India -0.028 1.141
China -0.063 0.615
57

Model properties (World Crude Demand)
58

Simulation (World Crude Demand)
59
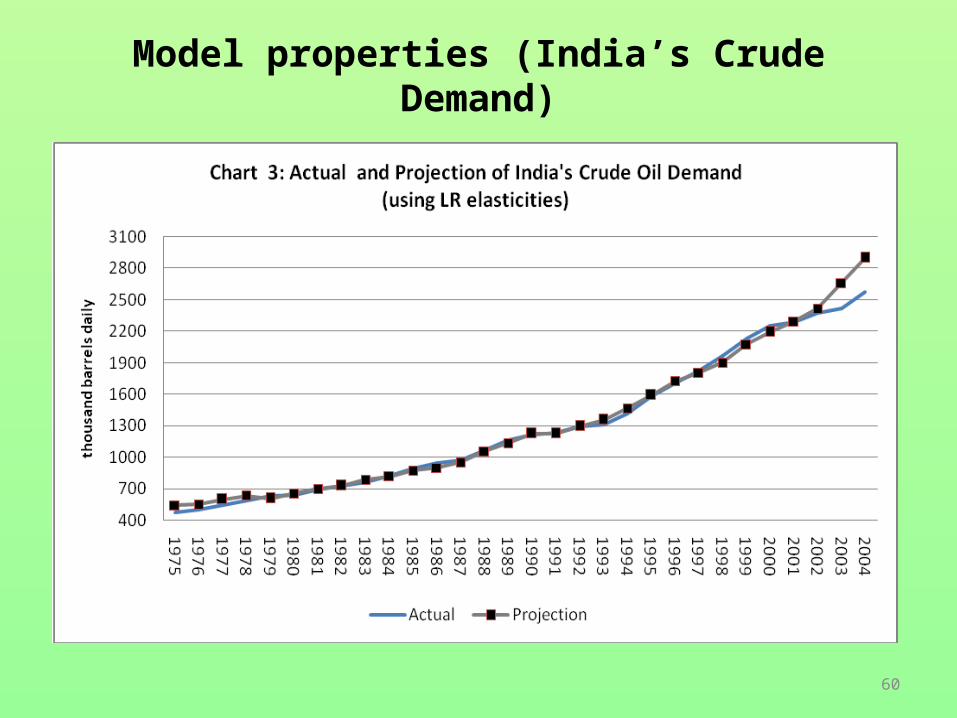
Model properties (India’s Crude Demand)
60
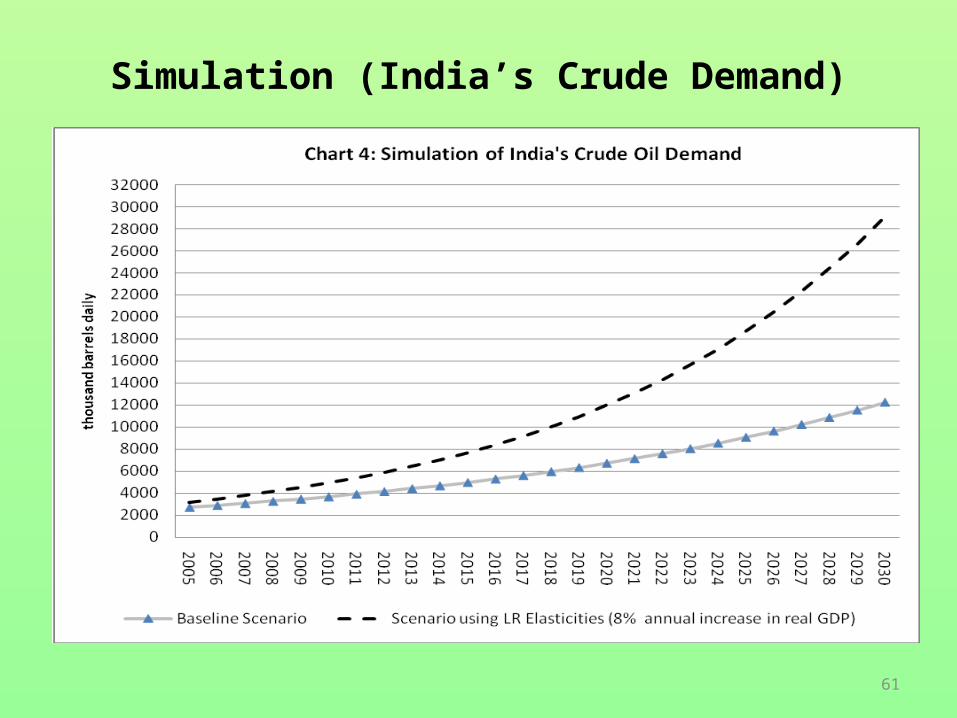
Simulation (India’s Crude Demand)
61
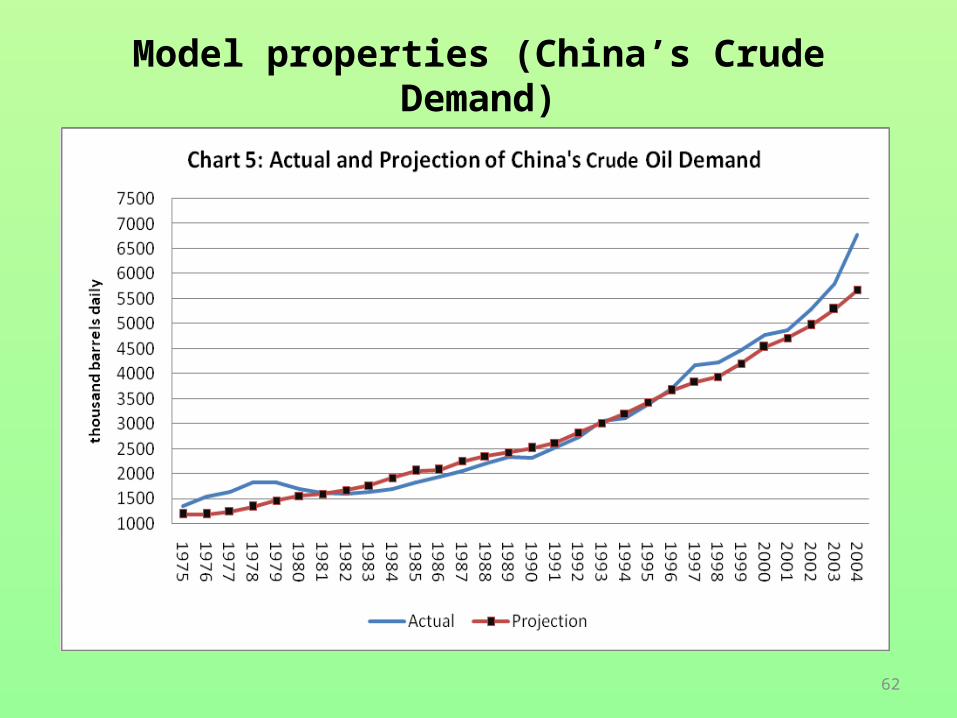
Model properties (China’s Crude Demand)
62
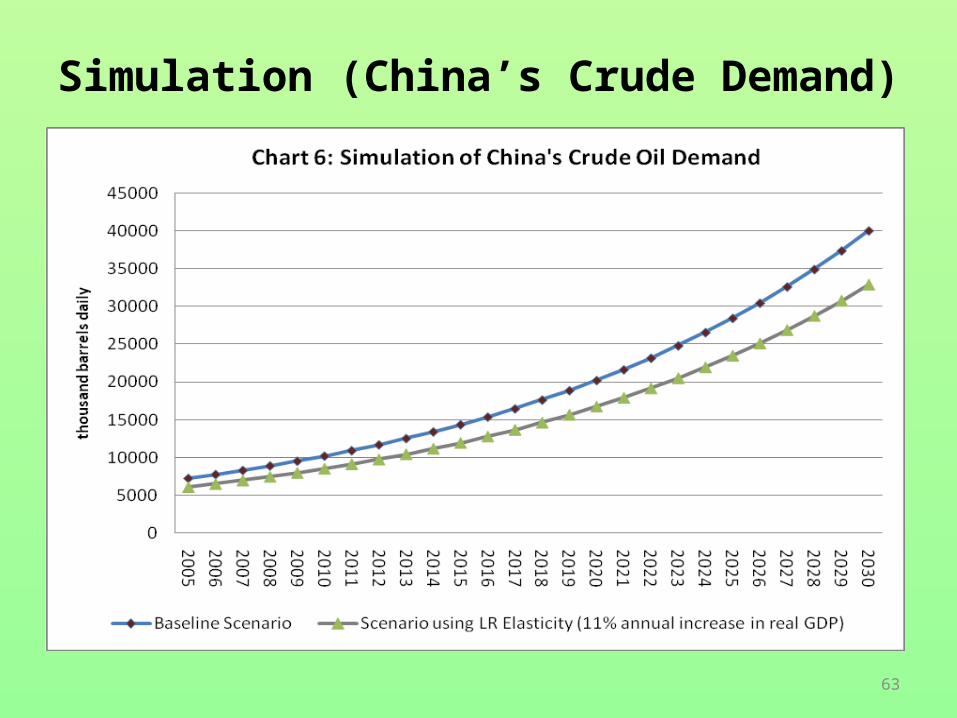
Simulation (China’s Crude Demand)
63
For Oil Security Policy for Jatropha Cultivation in Wasteland
In a market economy, the profitability and the ground rent from land use for alternative crops decide the pattern of land use in agriculture.
In a regime of high oil price, the high Gross value of Output to Cost ratio and high ground rent for jatropha plantation crop may induce diversion of land use from food crops to such energy plantation.
Hence, the concern for food security in a scenario of sustained oil price rise in real terms, decline in per capita domestic foodgrains availability and existence of substantive amount of poverty.
64
The setting up of bio refinery would further encourage diversion of land in any State where it is located.
Pricing of jatropha seed on the basis of its energy potential parity with high speed petroleum diesel price, would ensure high return.
Small cultivators with limited credit availability, may again be restrained from switch to such land use for jatropha if the credit requirement be substantive due to relative high cost of cultivation per acre.
65
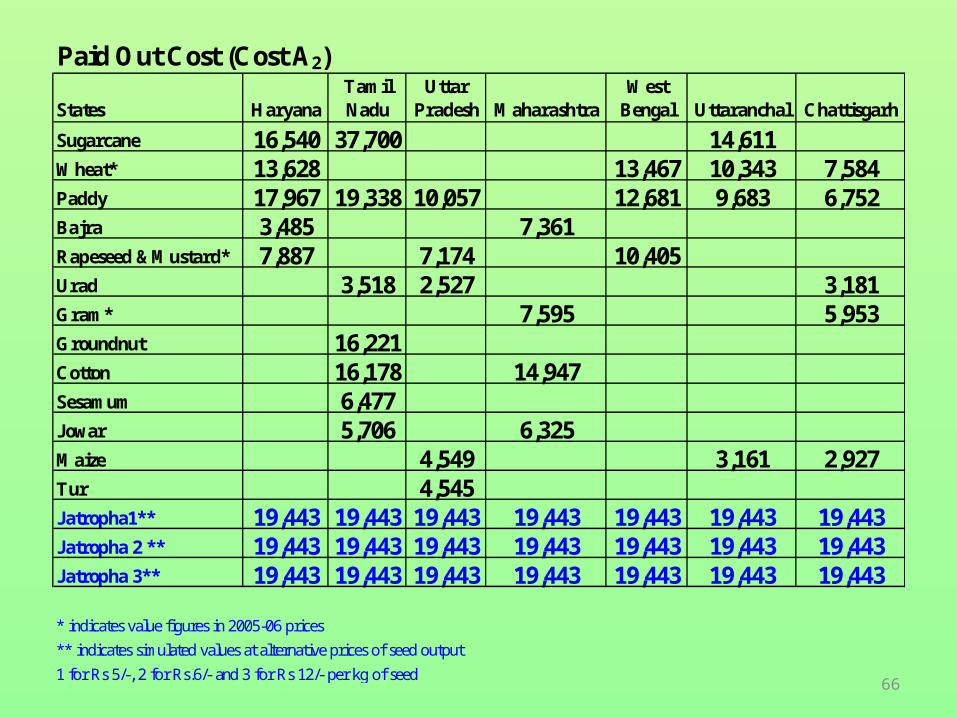
Paid Out Cost (Cost A2)
States HaryanaTamil Nadu
Uttar Pradesh Maharashtra
West Bengal Uttaranchal Chattisgarh
Sugarcane 16,540 37,700 14,611Wheat* 13,628 13,467 10,343 7,584Paddy 17,967 19,338 10,057 12,681 9,683 6,752Bajra 3,485 7,361Rapeseed &Mustard* 7,887 7,174 10,405Urad 3,518 2,527 3,181Gram* 7,595 5,953Groundnut 16,221Cotton 16,178 14,947Sesamum 6,477Jowar 5,706 6,325Maize 4,549 3,161 2,927Tur 4,545Jatropha1** 19,443 19,443 19,443 19,443 19,443 19,443 19,443Jatropha 2 ** 19,443 19,443 19,443 19,443 19,443 19,443 19,443Jatropha 3** 19,443 19,443 19,443 19,443 19,443 19,443 19,443
* indicates value figures in 2005-06 prices
** indicates simulated values at alternative prices of seed output
1 for Rs 5/-, 2 for Rs.6/- and 3 for Rs 12/- per kg of seed66

HaryanaTamil Nadu
Uttar Pradesh Maharashtra
West Bengal Uttaranchal Chattisgarh
Sugarcane 4.40 2.06 3.87 2.18 3.62Wheat* 1.97 1.64 1.14 1.54 1.26Bajra 1.66 1.74 1.09Paddy 2.01 1.28 1.72 1.50 1.80 2.10Rapeseed &Mustard* 2.96 2.76 1.64Urad 2.14 2.18 2.42Gram* 3.77 1.96 4.29Groundnut 1.70 1.14Jowar 1.04 1.10Cotton 1.29 1.25Sesamum 1.78 4.46Maize 1.94 1.94 2.06Soyabean 1.26 1.52Jatropha1 ** 2.57 2.57 2.57 2.57 2.57 2.57 2.57Jatropha 2 ** 3.09 3.09 3.09 3.09 3.09 3.09 3.09Jatropha 3 ** 6.19 6.19 6.19 6.19 6.19 6.19 6.19
* indicates value figures in 2005-06 prices
** jndicates simulated values at alternative prices of seed output 1 for Rs 5/-, 2 for Rs.6/- and 3 for Rs 12/- per kg of seed
GVO to Cost A2 Ratio
67
Gross Value of Output to Cost A2 ratio

Ground Rent
HaryanaTamil Nadu
Uttar Pradesh Maharashtra
West Bengal Uttaranchal Chattisgarh
Sugarcane 49,061 30,732 30,489 44,797 35,148Wheat* 8,926 4,152 -2,376 131 138Bajra -1,309 -327 -1,230Paddy 14,044 1,244 2,498 245 2,054 3,917Rapeseed &Mustard* 9,969 8,801 3,302Urad 2,211 1,199 2,190Gram* 13,830 4,822 18,037Groundnut 6,368 -3,289Jowar -2,552 -1,517Cotton -729 682Sesamum 3,226 4,947Tur 9,449 5,504Maize -1,134 -3,125 114Soyabean 1,093 2,007Jatropha1 ** 30,557 30,557 30,557 30,557 30,557 30,557 30,557Jatropha 2 ** 40,557 40,557 40,557 40,557 40,557 40,557 40,557Jatropha 3 ** 100,557 100,557 100,557 100,557 100,557 100,557 100,557
* indicates value figures in 2005-06 prices
** jndicates simulated values at alternative prices of seed output
1 for Rs 5/-, 2 for Rs.6/- and 3 for Rs 12/- per kg of seed 68

HaryanaTamil Nadu
Uttar Pradesh Maharashtra
West Bengal Uttaranchal Chattisgarh
Sugarcane 75 61 61 72 64Wheat* 44 40 35 37 37Bajra 36 37 36Paddy 48 38 39 37 39 40Rapeseed &Mustard* 45 44 40Urad 39 38 39Gram* 48 41 51Groundnut 42 35Jowar 35 36Cotton 37 38Sesamum 40 41Tur 44 41Maize 36 35 37Soyabean 38 39
Critical HSD price $ per barrel for Jatropha to be competitive with other crops in land use
69

CONCLUDING POINTS
• Technology and Supply side initiatives for ensuring adequacy of modern energy for removing energy poverty of the households.
• The initial high cost of connectivity with modern fuels being a constraint for the poor. Innovative policy initiatives like credit for such purpose is required without distorting the energy prices which is often counter-productive.
• Reliable supply of electricity in rural India is an imperative. The so-called rural indicators of electrification of GOI is misleading.
• Importance of development of non-conventional carbon free energy for decentralised generation of electricity and for local supply of clean fuels to households.
• Necessity of reducing the cost of new energy sources like solar, thermal, photo-voltaic, wind and others by raising the pace of investment in R&D and taking initiative in wider deployment of the technology.
• Importance of North-South co-operation in R&D and Technology deployment which can only lead to decline in costs and dynamic externalities.
• Speed is Important. Cost-Benefit Analysis of delayed implementation of new technologies is unfavourable for postponement.

COST
TIME
RENTAL PATH OF EXISTING FOSIL FUEL RESOURCES
PRICE OF ALTERNATIVE RESOURCE & ITS BACKSTOP TECHNOLOGY
A
B
A
B
TATB
CB
CA

• Policy Intervention for balancing the concerns of food security and oil security in respect of land-use change induced by bio liquids development for transport.
• Necessity of new technology in transport which would substitute oil by electricity or by substantive energy conservation.
• Importance of assessment of available wasteland for bio-ethanol or bio-diesel development.
• Institutional Reforms and rationalisation of energy prices are important for raising efficiency of energy use and energy supply. There is substantive scope for efficiency improvement in India in spite of rebound effect of such improvement in efficiency due to the inome effect ultimately resulting
from such improvement.

• Clean energy is a fundamental requirement for both the abatement of global warming and human development as it directly contributes both to lowering of carbon emissions as well as to higher educational and health attainment of the households of the developing countries.
• Global technological co-operation for clean coal development, nuclear fuel supply and development of technology for biomass conversion into cleaner energy form can help to resolve the challenge of sustainable energy and human development.

THANK YOU