Embed Size (px)
Citation preview

High-Efficiency AC Power Distribution for Data Centers
Revision 2
by Neil Rasmussen
0Introduction 2
1The case for 240 volt distribution
2
2A practical example of 240 volt distribution
5
3Common concerns 6
4DC and other alternatives 8
5Conclusion 9
6Resources 10
7Appendix 11
Click on a section to jump to it Contents
White Paper 128
The use of 240 volt power distribution for data centers saves floor space, simplifies power cabling, saves capital cost, reduces weight, and increases electrical efficiency. This paper describes the various con-figurations for this distribution architecture and quantifies the benefits for the optimal configuration. Note: The methods in this paper only apply in North America and are for problems that are unique to North America.
Executive summary>
white papers are now part of the Schneider Electric white paper libraryproduced by Schneider Electric’s Data Center Science Center [email protected]
High-Efficiency AC Power Distribution for Data Centers
Schneider Electric – Data Center Science Center White Paper 128 Rev 2 2
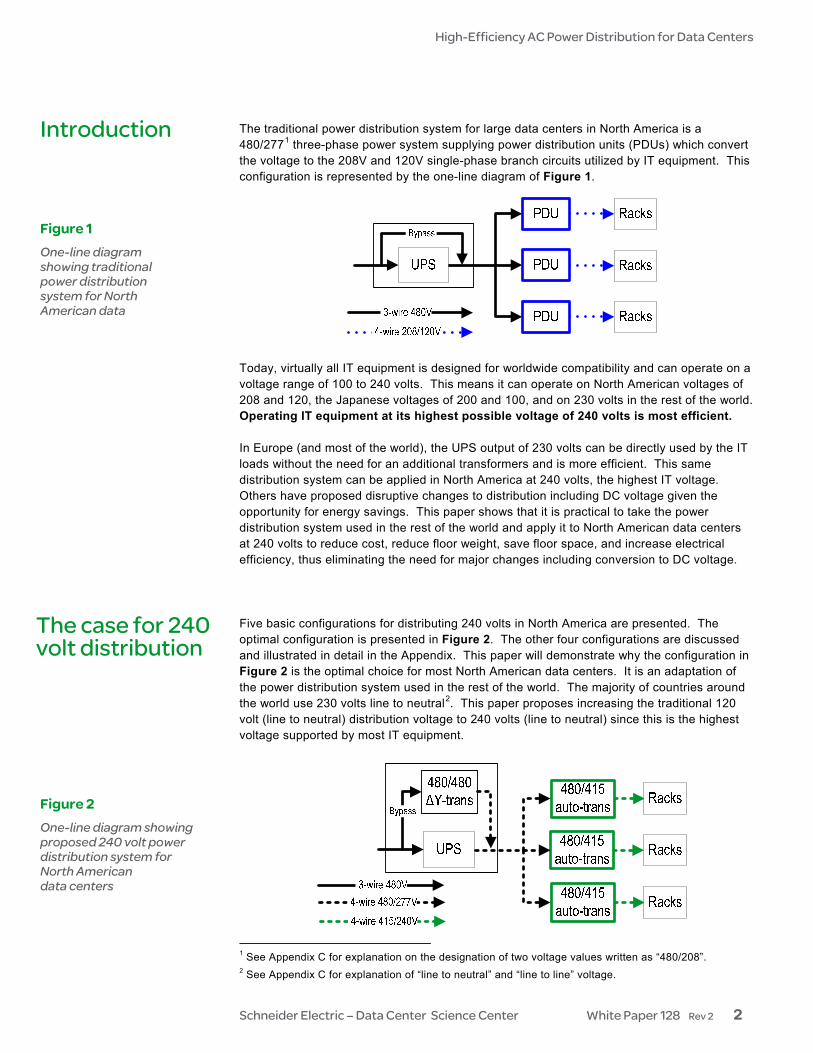
The traditional power distribution system for large data centers in North America is a 480/2771 three-phase power system supplying power distribution units (PDUs) which convert the voltage to the 208V and 120V single-phase branch circuits utilized by IT equipment. This configuration is represented by the one-line diagram of Figure 1. Today, virtually all IT equipment is designed for worldwide compatibility and can operate on a voltage range of 100 to 240 volts. This means it can operate on North American voltages of 208 and 120, the Japanese voltages of 200 and 100, and on 230 volts in the rest of the world. Operating IT equipment at its highest possible voltage of 240 volts is most efficient. In Europe (and most of the world), the UPS output of 230 volts can be directly used by the IT loads without the need for an additional transformers and is more efficient. This same distribution system can be applied in North America at 240 volts, the highest IT voltage. Others have proposed disruptive changes to distribution including DC voltage given the opportunity for energy savings. This paper shows that it is practical to take the power distribution system used in the rest of the world and apply it to North American data centers at 240 volts to reduce cost, reduce floor weight, save floor space, and increase electrical efficiency, thus eliminating the need for major changes including conversion to DC voltage. Five basic configurations for distributing 240 volts in North America are presented. The optimal configuration is presented in Figure 2. The other four configurations are discussed and illustrated in detail in the Appendix. This paper will demonstrate why the configuration in Figure 2 is the optimal choice for most North American data centers. It is an adaptation of the power distribution system used in the rest of the world. The majority of countries around the world use 230 volts line to neutral2. This paper proposes increasing the traditional 120 volt (line to neutral) distribution voltage to 240 volts (line to neutral) since this is the highest voltage supported by most IT equipment.
1 See Appendix C for explanation on the designation of two voltage values written as “480/208”. 2 See Appendix C for explanation of “line to neutral” and “line to line” voltage.
Introduction
Figure 1 One-line diagram showing traditional power distribution system for North American data
The case for 240 volt distribution
Figure 2 One-line diagram showing proposed 240 volt power distribution system for North American data centers
High-Efficiency AC Power Distribution for Data Centers
Schneider Electric – Data Center Science Center White Paper 128 Rev 2 3
The deficiencies of traditional 120 volt distribution The traditional North American distribution system has the following deficiencies: • Low distribution voltage (120 volts) that increases energy cost – it is a law of physics
that for the same amount of power, as voltage decreases, current increases. The more current that runs through a wire, the higher the electrical losses and energy cost.
• Low distribution voltage (120 volts) that increases copper cost – the lower the voltage, the thicker the wire required to carry the higher current.
• Oversized traditional PDUs that consume floor space and increase floor weight – the increased floor space consumption and floor weight is mainly due to the heavy isolation transformers inside the PDUs and the large cabinets that enclose them.
• Oversized PDU isolation transformers that increase energy costs – The collective PDU capacity in many data centers are 1.5 to 3 times the data center capacity which in-creases electrical transformer losses and energy costs.
• Multiple branch circuits per rack, with corresponding breakers and cabling – at a lower voltage more branch circuits are required for a given rack density which increases cable clutter, complexity, and cost.
The deficiencies explained above increase in magnitude as rack power densities increase. High density server installations where racks can draw from 10 kW to 30 kW per rack place significant strains on the traditional power distribution system. General benefits to increasing distribution voltage from 120 to 240 Regardless of how it is implemented, increasing the distribution voltage from 120 to 240 (line to neutral) provides the following benefits over the traditional configuration. • More power capacity given the same branch circuit current
• Less current required given the same branch circuit power capacity
• Higher power distribution efficiency / lower energy cost
• Higher IT equipment power supply efficiency / lower energy cost
• Lower copper material cost (less copper required)
The following sections describe these benefits in more detail. More power capacity given the same branch circuit current An increase in circuit voltage while holding current constant increases the capacity of that circuit. The power capacity for a three-phase branch circuit is calculated by using the following formula:
Power = Volts x Amps x 3 The “volts” in this formula refers to the line to neutral voltage. Therefore, when comparing the line to neutral voltages of both distribution methods, the comparison should be between 120 V and 240 V and NOT between 208 V and 240 V. For example, assume 20 amp circuits are provided to the load in either case. The power capacity for the 120 V “line to neutral” distribution method is calculated as:
120V branch circuit power capacity = 20 amps x 120 V x 3 = 7.2 kW However, the capacity for the 240 V “line to neutral” distribution method is calculated as:
> Why does PDU transformer over-sizing occur? There are multiple PDUs in a data center that serve individual groups of IT racks. Furthermore, PDUs are installed long before any IT load is placed on them. If you don’t know the long-term power consumption for each group of racks, then how will you be certain that the PDU transfor-mer will support the eventual peak load for that group? The answer is to over-size the PDU transformers due to the long-term uncertainty of the peak power draw among a group of IT racks that they will supply. This same over-sizing practice is even more pronounced with branch circuit breakers, conductors, and outlets. The closer you get to the IT load, the greater the over-sizing of the individual device. IT rack power uncertainty has less impact on over-sizing as devices move upstream on the electrical path to the point where when they get to the UPS there is no impact. Moving the PDU transformer upstream to the UPS allows the transformer to be right-sized to the UPS.

High-Efficiency AC Power Distribution for Data Centers
Schneider Electric – Data Center Science Center White Paper 128 Rev 2 4
240V branch circuit power capacity = 20 amps x 240 V x 3 = 14.4 kW
Given the same circuit current rating, the 240 V distribution method provides 100% more power than the 120 V distribution method. Less current required given the same branch circuit power capacity Consider now the same comparison except this time assuming a fixed branch circuit power capacity. For example, assume 10 kW is available to the load in either case. The power capacity for the 120 V “line to neutral” distribution method is calculated as:
120V branch circuit current requirement = (120V x 3) / 10kW = 27.7 amps However, the capacity for the 240 V “line to neutral” distribution method is calculated as:
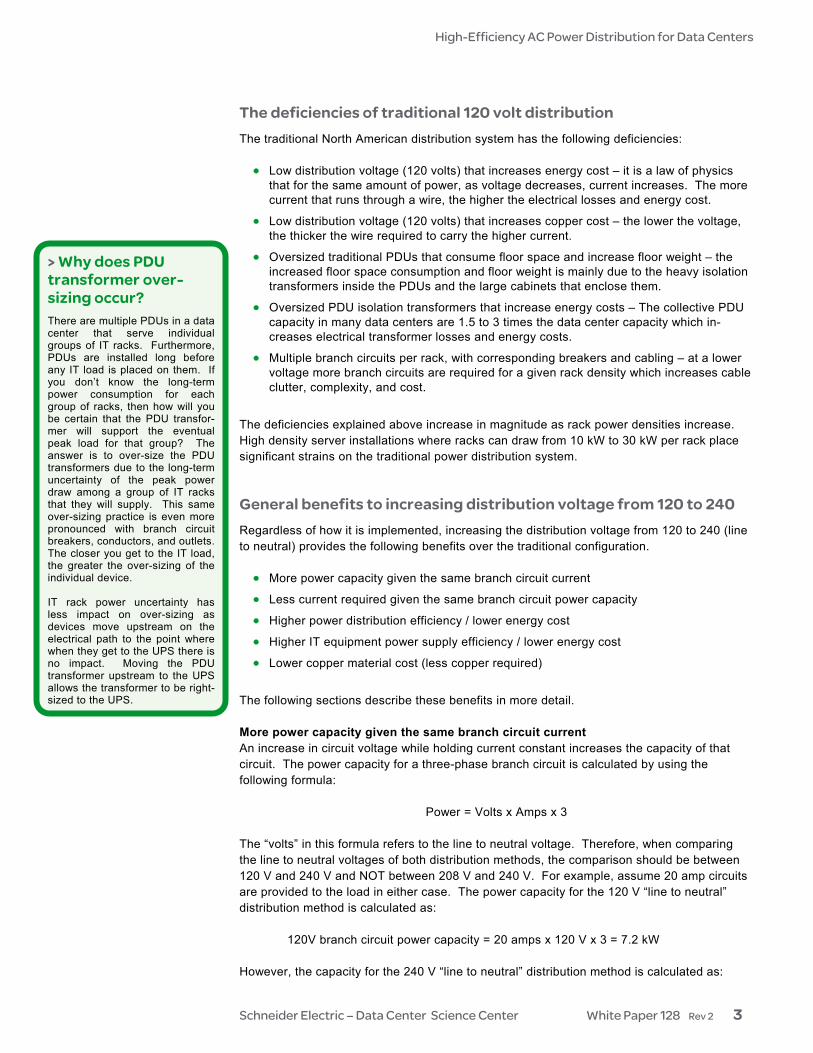
240V branch circuit current requirement = (240V x 3) / 10 kW = 13.9 amps Given the same power, the 240V distribution method provides the same power capacity with nearly half the current required by the 120 V distribution method. This significant difference in current requires the branch circuit wires in the traditional North American system to be 300% larger in terms of their size and weight. In addition, the higher current will require the rack power strips to have circuit breakers which increases breaker count and decreases reliability. Higher power distribution efficiency / lower energy cost For a given circuit size, running less current through wires results in lower losses in the form of heat. These electrical savings are further increased as a result of lower air conditioning operating costs required to remove the heat. Higher IT equipment power supply efficiency / lower energy cost Running IT power supplies at a higher voltage reduces the current and the associated losses in the power supply. Figure 3 illustrates a 1-3 percentage point improvement in power supply efficiency with increased voltage. This represents a savings of $4 to $31 per year per server in electrical cost by increasing the voltage from 120 to 240. In addition, approximately $2 to $16 per year per server is saved on air conditioning operating costs. Lower copper material cost (less copper required) Increasing voltage from 120 to 240 reduces the current requirement for a given power capacity which reduces the wire gauge requirement. Using thinner wires reduces the amount
Running IT power supplies at a higher voltage reduces the current and the associated losses in the power supply.
“ ”
Power Supply Efficiency vs. Input Voltage
86%
87%
88%
89%
90%
91%
92%
20% 30% 40% 50% 60% 70% 80% 90% 100%
Load
Effic
ienc
y
240V208V120V
Figure 3 Power supply efficiency (source: HP)
High-Efficiency AC Power Distribution for Data Centers
Schneider Electric – Data Center Science Center White Paper 128 Rev 2 5
of copper for a given branch circuit and reduces the material cost by over 50%. In some cases labor cost decreases because installation is easier with thinner wires. Benefits to implementing optimal configuration (Figure 2) In addition to the common benefits above, implementing the configuration in Figure 2 provides the following benefits over the traditional configuration: • Reduced isolation transformer over-sizing
• Reduced floor weight and increased floor space
• Fewer breakers
The following sections describe these benefits in more detail. Reduced isolation transformer over-sizing Increasing the voltage to 240 in the proposed North American configuration (Figure 2) makes it practical to consolidate the power distribution unit (PDU) isolation transformers into a single transformer that supplies the IT loads with a neutral wire. Sizing a single transformer to the UPS capacity reduces PDU transformer over-sizing which, as a group, is typically sized at 1.5 to 3 times the UPS capacity. In addition, this transformer can be located outside of the data center server space, such as in a back room, which further conserves valuable data center space. While it’s possible to do same transformer consolidation with the traditional configura-tion, the cooper and energy costs at the branch circuit level are still higher than the optimal configuration.
Reduced floor weight and increased floor space Reducing the multiple PDU isolation transformers into a single isolation transformer removes a significant amount of weight from the data center and increases available floor space. Both of which allow for the placement of more IT equipment. Weight reduction is important not only for raised floor data centers but also those with a slab floor with structural weight limits.
Fewer breakers
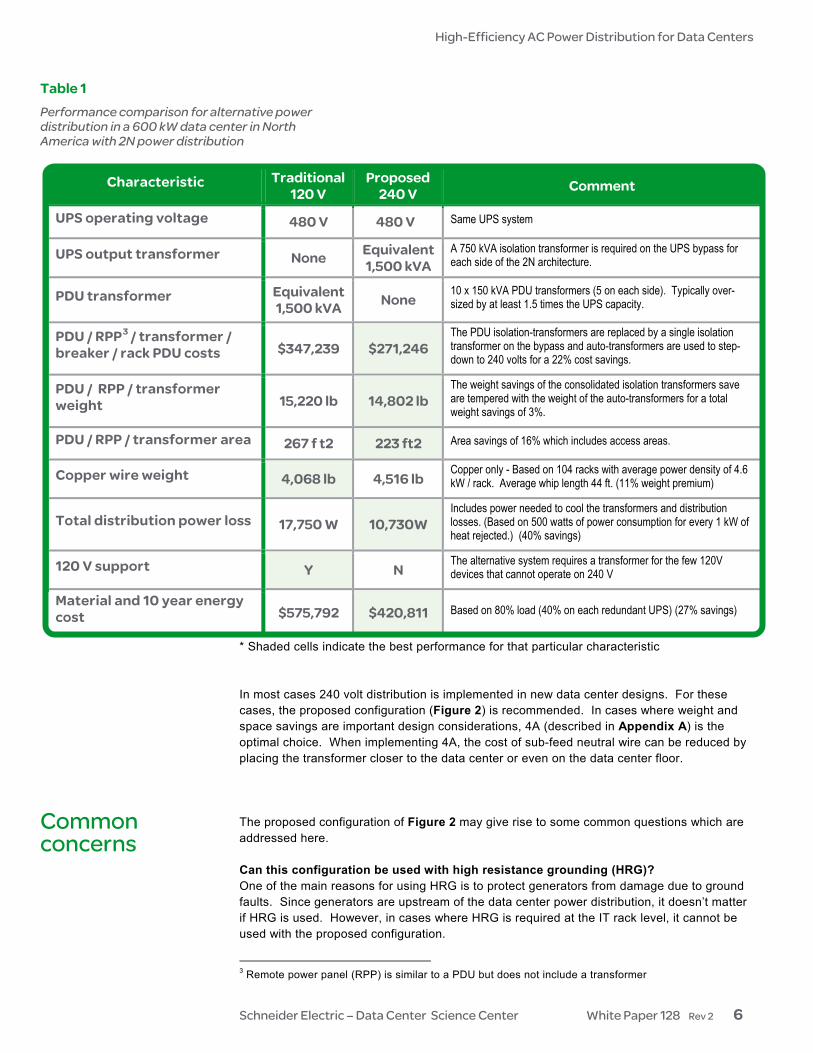
This increases the power density capability per rack without adding extra circuit breakers as would be the case with the 120/208 volt distribution. The additional breakers, both upstream of the rack and within high-density rack power strips, present additional points of failure resulting in decreased data center reliability. Table 1 compares the traditional configuration (Figure 1) and the proposed configuration (Figure 2) and quantifies the benefits discussed above. The comparison is based on a 2N, 600 kW data center analysis that quantifies the material cost, energy cost, weight, footprint, fault current, and quantity of breakers for various power distribution configurations including the traditional configuration. The analysis, diagrams, and assumptions used for this analysis are provided in Appendix A and B of this white paper.
A practical example of 240 volt distribution
High-Efficiency AC Power Distribution for Data Centers
Schneider Electric – Data Center Science Center White Paper 128 Rev 2 6
Characteristic Traditional120 V
Proposed 240 V Comment
UPS operating voltage 480 V 480 V Same UPS system
UPS output transformer None Equivalent 1,500 kVA
A 750 kVA isolation transformer is required on the UPS bypass for each side of the 2N architecture.
PDU transformer Equivalent 1,500 kVA None
10 x 150 kVA PDU transformers (5 on each side). Typically over-sized by at least 1.5 times the UPS capacity.
PDU / RPP3 / transformer / breaker / rack PDU costs $347,239 $271,246
The PDU isolation-transformers are replaced by a single isolation transformer on the bypass and auto-transformers are used to step-down to 240 volts for a 22% cost savings.
PDU / RPP / transformer weight 15,220 lb 14,802 lb
The weight savings of the consolidated isolation transformers save are tempered with the weight of the auto-transformers for a total weight savings of 3%.
PDU / RPP / transformer area 267 f t2 223 ft2 Area savings of 16% which includes access areas.
Copper wire weight 4,068 lb 4,516 lb Copper only - Based on 104 racks with average power density of 4.6 kW / rack. Average whip length 44 ft. (11% weight premium)
Total distribution power loss 17,750 W 10,730W Includes power needed to cool the transformers and distribution losses. (Based on 500 watts of power consumption for every 1 kW of heat rejected.) (40% savings)
120 V support Y N The alternative system requires a transformer for the few 120V devices that cannot operate on 240 V
Material and 10 year energy cost $575,792 $420,811 Based on 80% load (40% on each redundant UPS) (27% savings)
* Shaded cells indicate the best performance for that particular characteristic In most cases 240 volt distribution is implemented in new data center designs. For these cases, the proposed configuration (Figure 2) is recommended. In cases where weight and space savings are important design considerations, 4A (described in Appendix A) is the optimal choice. When implementing 4A, the cost of sub-feed neutral wire can be reduced by placing the transformer closer to the data center or even on the data center floor. The proposed configuration of Figure 2 may give rise to some common questions which are addressed here. Can this configuration be used with high resistance grounding (HRG)? One of the main reasons for using HRG is to protect generators from damage due to ground faults. Since generators are upstream of the data center power distribution, it doesn’t matter if HRG is used. However, in cases where HRG is required at the IT rack level, it cannot be used with the proposed configuration.
3 Remote power panel (RPP) is similar to a PDU but does not include a transformer
Table 1 Performance comparison for alternative power distribution in a 600 kW data center in North America with 2N power distribution
Common concerns

High-Efficiency AC Power Distribution for Data Centers
Schneider Electric – Data Center Science Center White Paper 128 Rev 2 7
Are over-sized neutrals wires required? Neutral over-sizing is a function of the load and the resulting harmonics. The more harmon-ics produced, the greater the neutral size. For more information on harmonics see White Paper 26, Hazards of Harmonics and Neutral Overloads. Are special connectors required in order to use 240V distribution? The appropriate connectors for use with 240V circuits are IEC C13 and C19 types. This is the power cord connector provided by most OEM server manufacturers with rack-mount servers and storage devices. Therefore, most high density servers are already provided with the appropriate connector for use with a 240V system. Occasionally, a device may be provided with a power cord that uses a North American NEMA style twist lock connector. These are dealt with as follows: • If the power cord is the detachable type with an IEC C13 or C19 connector on the chas-
sis, then the cord should be replaced with a cord with IEC connectors at both ends. These are available from virtually all IT OEMs, and they are available from suppliers such as Schneider Electric. Note that when substituting power cords it may be advisa-ble to purchase a cord of shorter than standard length in order to simplify power cabling in the rack.
• In the case where the cord is permanently attached to the IT device, if the plug is 20A or less an adapter cable can be used.
• In the case where the connector is a three-phase connector, see the following section
• No special connectors are required. In most cases, IT equipment can plug into a C13 or C19 connector. These are IEC international standard business equipment connectors. In cases where more than 16 amps is required from a single receptacle, an alternate receptacle is required and may be the same type for 240 volts as it is for 120 volts.
How do I deal with three-phase IT loads? A very few IT loads are equipped with three-phase connectors. These include some Compaq blade servers, large EMC storage units, and mainframe-style servers. The key thing to understand here is that none of these devices actually require three-phase power. In fact all such devices actually use multiple power supplies drawing single phase power. Furthermore, all of these devices have versions that are sold outside North American and therefore are compatible with the alternative power distribution system. These devices are dealt with as follows: • For large deployments of devices with three-phase connectors, specify to the supplier
that the power input is to be wired for European voltage. This is often a simple internal jumper setting.
• Determine if the device is can be re-wired in the field for European voltage operation. Many large devices are.
• If it is impractical to change the device or convert it, then consider using traditional distribution to this device, or install a dedicated PDU to convert the voltage for this de-vice.
Can I use any branch circuit breaker? The branch circuit breakers used in the system described in this paper operate at higher voltage than normal branch circuits in North American data centers. Most circuit breakers that are currently used in North American data centers are not rated for this voltage and cannot be used. Conversely, most European circuit breakers panels are not certified by UL for use in North America. Recently, manufacturers have introduced compact worldwide circuit breakers and circuit breaker panel boards that are rated and certified for high voltage use in North America. Companies like Schneider Electric offer complete data-center PDUs, remote power panels, and rack power panels that are appropriately rated and certified for 240 volt distribution in North America.
Hazards of Harmonics and Neutral Overloads
Related resource White Paper 26
High-Efficiency AC Power Distribution for Data Centers
Schneider Electric – Data Center Science Center White Paper 128 Rev 2 8
How are 120 volt IT loads supported? 120 volt loads are supported through the use of a small transformer that steps down the 240 volts to 120 volts. In most cases of implementing 240 volt distribution, no modifications of are needed to the IT equipment, the power cords, or the rack power distribution devices. Devices which are known to work seamlessly with this power distribution system include: IBM blade servers, 1U servers, virtually all enterprise rack mount servers, and many rack mount SAN and NAS storage devices. DC voltage distribution – In many published articles, expected improvements of 10% to 30% in efficiency have been claimed for DC over AC distribution. Using the best data available, Schneider Electric has analyzed current and future alternatives against 240 volt distribution and has found that a reduction of data center power consumption of only 0.94% can be attained from a hypothetical 380 V DC architecture4. Therefore, the 240 volt distribu-tion system is the preferred strategy to improve data center efficiency. This subject is discussed in more detail in White Paper 127, A Quantitative Comparison of High Efficiency AC vs. DC Power Distribution for Data Centers. 277 voltage distribution – After understanding the benefits of increasing distribution voltage to 240V, a common question people ask is, “why not increase the voltage to 277 for IT equipment?” The logic being that if IT equipment accepted 277V, no step down voltage is required and the IT power supplies would be more efficient. Unfortunately, this is unlikely to happen for the following reasons: • IT equipment power supplies would need to be designed to accommodate 277 volts.
• While 277V does reduce input current to the power supply, which should improve effi-ciency, the resultant higher rectified voltage (~430Vdc vs. ~375Vdc) requires higher vol-tage components which have lower electrical performance resulting in a net decrease in power supply efficiency.
• These same higher voltage rated components cost more thereby raising the cost of the power supply. Since server vendors want a single power supply worldwide, they would be forced to increase the cost of all power supplies.
• IEC C14 and C20 connectors are only rated to 250V. Therefore, new and potentially larger connectors would be required for 277V.
• Regulatory panel clearances are larger at 277V which can adversely affect width of data center rows.
• Clearance distances are larger at 277V which negatively impacts the size of IT power supplies.
• The power electronics component supply base is optimized around 240V and therefore, massive economies of scale exist. This is not true for 277V.
4 White Paper 127, A Quantitative Comparison of High Efficiency AC vs. DC Power Distribution for Data
Centers
DC and other alternatives
A Quantitative Comparison of High Efficiency AC vs. DC Power Distribution for Data Centers
Related resource White Paper 127

High-Efficiency AC Power Distribution for Data Centers
Schneider Electric – Data Center Science Center White Paper 128 Rev 2 9
There are significant advantages to using a higher voltage power distribution system in high density data centers in North America. Use of the proposed 240 volt distribution system instead of the traditional 120 volt system can save 25% in material cost and 10 year energy cost, and save floor space and weight loading. The benefits are most apparent for high density installations. Furthermore, the alternative design can operate alongside conventional power distribution designs in existing data centers. New data centers should use 240 VAC power systems, combined with high efficiency UPS and server power supplies. This is already the default approach outside of North America so no change is required there. In North America this requires new thinking and new designs. Some vendors have already introduced equipment to support 240 VAC power distribution in North America.
Conclusion
Neil Rasmussen is a Senior VP of Innovation for Schneider Electric. He establishes the technology direction for the world’s largest R&D budget devoted to power, cooling, and rack infrastructure for critical networks. Neil holds 19 patents related to high-efficiency and high-density data center power and cooling infrastructure, and has published over 50 white papers related to power and cooling systems, many published in more than 10 languages, most recently with a focus on the improvement of energy efficiency. He is an internationally recognized keynote speaker on the subject of high-efficiency data centers. Neil is currently working to advance the science of high-efficiency, high-density, scalable data center infrastructure solutions and is a principal architect of the APC InfraStruXure system. Prior to founding APC in 1981, Neil received his bachelors and masters degrees from MIT in electrical engineering, where he did his thesis on the analysis of a 200MW power supply for a tokamak fusion reactor. From 1979 to 1981 he worked at MIT Lincoln Laboratories on flywheel energy storage systems and solar electric power systems.
About the author

High-Efficiency AC Power Distribution for Data Centers
Schneider Electric – Data Center Science Center White Paper 128 Rev 2 10
Hazards of Harmonics and Neutral Overloads White Paper 26
A Quantitative Comparison of High Efficiency AC vs. DC Power Distribution for Data Centers White Paper 127
Resources Click on icon to link to resource
Browse all white papers
tools.apc.com
Browse all TradeOff Tools™
For feedback and comments about the content of this white paper: Data Center Science Center [email protected] If you are a customer and have questions specific to your data center project: Contact your Schneider Electric representative
Contact us
High-Efficiency AC Power Distribution for Data Centers
Schneider Electric – Data Center Science Center White Paper 128 Rev 2 11
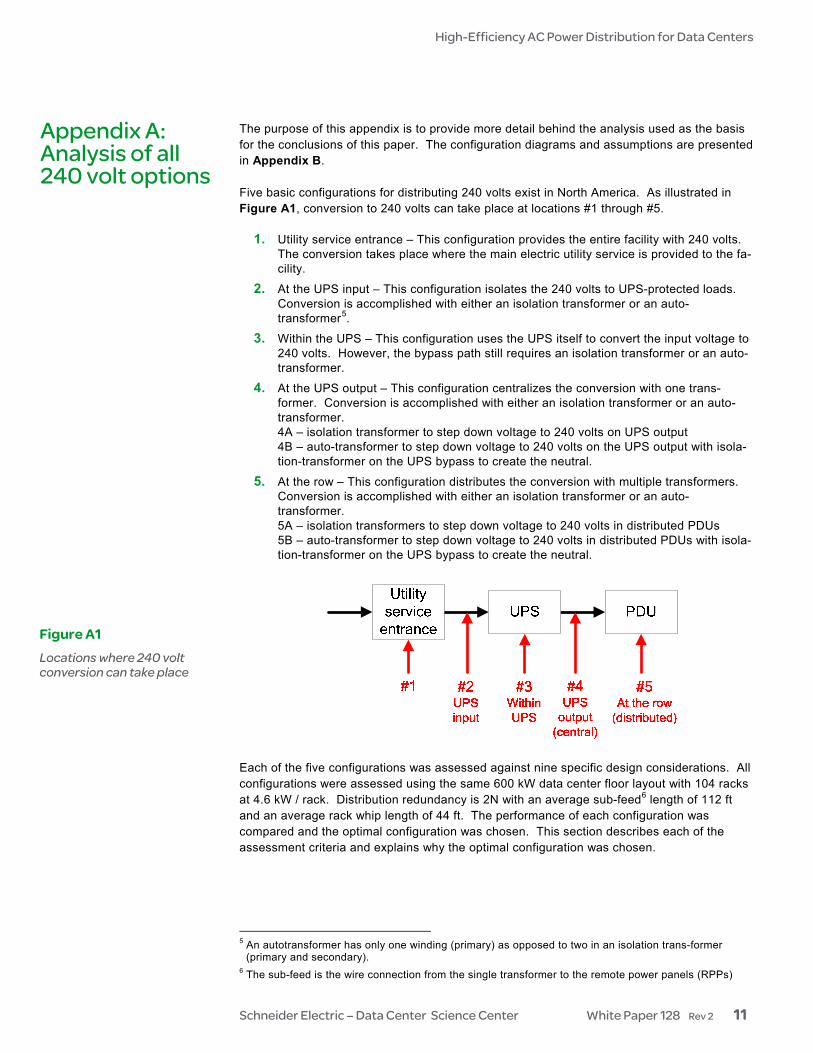
The purpose of this appendix is to provide more detail behind the analysis used as the basis for the conclusions of this paper. The configuration diagrams and assumptions are presented in Appendix B. Five basic configurations for distributing 240 volts exist in North America. As illustrated in Figure A1, conversion to 240 volts can take place at locations #1 through #5.
1. Utility service entrance – This configuration provides the entire facility with 240 volts. The conversion takes place where the main electric utility service is provided to the fa-cility.
2. At the UPS input – This configuration isolates the 240 volts to UPS-protected loads. Conversion is accomplished with either an isolation transformer or an auto-transformer5.
3. Within the UPS – This configuration uses the UPS itself to convert the input voltage to 240 volts. However, the bypass path still requires an isolation transformer or an auto-transformer.
4. At the UPS output – This configuration centralizes the conversion with one trans-former. Conversion is accomplished with either an isolation transformer or an auto-transformer. 4A – isolation transformer to step down voltage to 240 volts on UPS output 4B – auto-transformer to step down voltage to 240 volts on the UPS output with isola-tion-transformer on the UPS bypass to create the neutral.
5. At the row – This configuration distributes the conversion with multiple transformers. Conversion is accomplished with either an isolation transformer or an auto-transformer. 5A – isolation transformers to step down voltage to 240 volts in distributed PDUs 5B – auto-transformer to step down voltage to 240 volts in distributed PDUs with isola-tion-transformer on the UPS bypass to create the neutral.
Each of the five configurations was assessed against nine specific design considerations. All configurations were assessed using the same 600 kW data center floor layout with 104 racks at 4.6 kW / rack. Distribution redundancy is 2N with an average sub-feed6 length of 112 ft and an average rack whip length of 44 ft. The performance of each configuration was compared and the optimal configuration was chosen. This section describes each of the assessment criteria and explains why the optimal configuration was chosen. 5 An autotransformer has only one winding (primary) as opposed to two in an isolation trans-former
(primary and secondary). 6 The sub-feed is the wire connection from the single transformer to the remote power panels (RPPs)
Figure A1 Locations where 240 volt conversion can take place
Appendix A: Analysis of all 240 volt options
High-Efficiency AC Power Distribution for Data Centers
Schneider Electric – Data Center Science Center White Paper 128 Rev 2 12
Design considerations The following design considerations were used to assess each configuration: Are there multiple neutral to ground bounds? – Electrical architectures with multiple sources (i.e. standby generators, on site generation, utility) may require multiple neutral to ground bonds in upstream switchgear. This may require a system to distinguish between circulating ground currents on shared neutrals from actual ground fault currents which increases complexity and cost. Are there any requirements for 4-pole breakers? – In cases where a neutral conductor is supplied from upstream switchgear, a 4-pole breaker may be required. This in turn may require some type of control mechanism to prevent parallel operation between two sources. Is there a narrow range for circuit breaker fault coordination? – The ground fault protection (GFP) system may require extra levels of protection if the protection zone extends downstream toward the IT equipment. This results in a narrower range of coordination between devices. What is the available fault current? – Fault current is the maximum amount of current available at a certain point in an electrical architecture. Reduction of available fault current reduces arc flash energy which improves human safety and therefore reduces the required personnel protection equipment. Depending on the architecture, the available fault current at a specific point may require the use of a more expensive circuit breaker that can handle the given fault current. Does the configuration support non-IT loads on UPS? – Placing pumps and or fans on a UPS is a design practice to used increase data center availability. Most infrastructure devices in North America operate at 480 / 277 volts. Does the configuration support 120 V IT loads on UPS? – A very small fraction of IT equipment in an existing data center may require 120 volts. A common solution for this is to use a small transformer to step down 240 volts to 120 volts. What is the upfront material cost and ten year energy cost? – The energy cost includes the cost of electricity consumed by device losses in the form of heat, and the air conditioning energy used to remove that heat. The material and energy costs are an important design consideration since the energy cost savings could justify a higher upfront cost for a particular architecture. Does the configuration require non-standard devices? – As complexity increases the need for customized devices also likely increases which increase overall cost. Findings The following conclusions about the five basic configurations can be made from a study of the design considerations above. Conversion to 240V at the utility service entrance (#1) – This configuration requires that a neutral is supplied from the service entrance to the PDUs. This requirement is impractical since it increases copper costs and creates the need for complex ground fault protection schemes due to multiple neutral to ground bonds and 4-pole breakers. Fault coordination also becomes more difficult. All of these factors add a significant cost to the overall design. This configuration also makes it difficult to find infrastructure equipment such as chillers that
High-Efficiency AC Power Distribution for Data Centers
Schneider Electric – Data Center Science Center White Paper 128 Rev 2 13
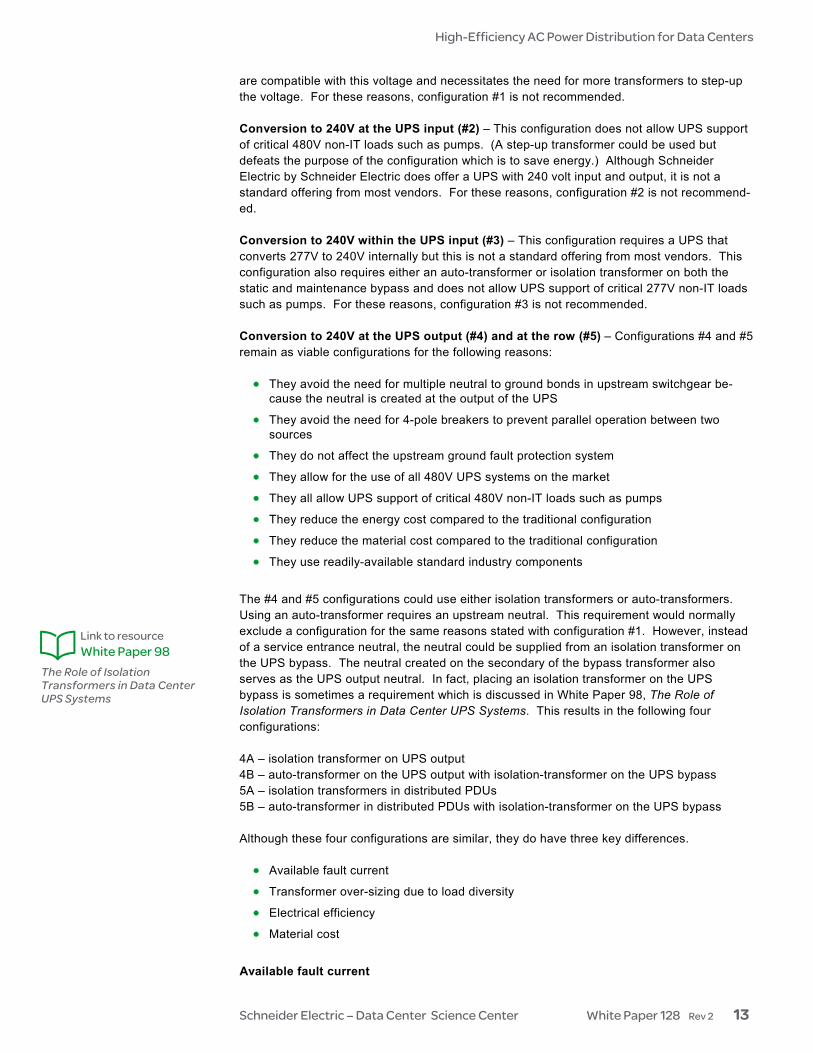
are compatible with this voltage and necessitates the need for more transformers to step-up the voltage. For these reasons, configuration #1 is not recommended. Conversion to 240V at the UPS input (#2) – This configuration does not allow UPS support of critical 480V non-IT loads such as pumps. (A step-up transformer could be used but defeats the purpose of the configuration which is to save energy.) Although Schneider Electric by Schneider Electric does offer a UPS with 240 volt input and output, it is not a standard offering from most vendors. For these reasons, configuration #2 is not recommend-ed. Conversion to 240V within the UPS input (#3) – This configuration requires a UPS that converts 277V to 240V internally but this is not a standard offering from most vendors. This configuration also requires either an auto-transformer or isolation transformer on both the static and maintenance bypass and does not allow UPS support of critical 277V non-IT loads such as pumps. For these reasons, configuration #3 is not recommended. Conversion to 240V at the UPS output (#4) and at the row (#5) – Configurations #4 and #5 remain as viable configurations for the following reasons: • They avoid the need for multiple neutral to ground bonds in upstream switchgear be-
cause the neutral is created at the output of the UPS
• They avoid the need for 4-pole breakers to prevent parallel operation between two sources
• They do not affect the upstream ground fault protection system
• They allow for the use of all 480V UPS systems on the market
• They all allow UPS support of critical 480V non-IT loads such as pumps
• They reduce the energy cost compared to the traditional configuration
• They reduce the material cost compared to the traditional configuration
• They use readily-available standard industry components
The #4 and #5 configurations could use either isolation transformers or auto-transformers. Using an auto-transformer requires an upstream neutral. This requirement would normally exclude a configuration for the same reasons stated with configuration #1. However, instead of a service entrance neutral, the neutral could be supplied from an isolation transformer on the UPS bypass. The neutral created on the secondary of the bypass transformer also serves as the UPS output neutral. In fact, placing an isolation transformer on the UPS bypass is sometimes a requirement which is discussed in White Paper 98, The Role of Isolation Transformers in Data Center UPS Systems. This results in the following four configurations: 4A – isolation transformer on UPS output 4B – auto-transformer on the UPS output with isolation-transformer on the UPS bypass 5A – isolation transformers in distributed PDUs 5B – auto-transformer in distributed PDUs with isolation-transformer on the UPS bypass Although these four configurations are similar, they do have three key differences. • Available fault current
• Transformer over-sizing due to load diversity
• Electrical efficiency
• Material cost
Available fault current
Link to resource White Paper 98
The Role of Isolation Transformers in Data Center UPS Systems

High-Efficiency AC Power Distribution for Data Centers
Schneider Electric – Data Center Science Center White Paper 128 Rev 2 14
Configurations 4A, 4B, and 5B all have identical available fault currents at the PDU / RPP input, branch breaker input, and at the rack. Since configuration 5A is most similar to traditional distribution, the fault current values are similar. Table A1 shows the fault currents in kilo amperes (kA). The fault current for configurations 4A, 4B, and 5B are above 10 kA which may require more expensive branch breakers with higher interrupting current ratings. Alternatively, the fault current could be addressed at the PDU/RPP input using a current-limiting breaker. These breakers are more expensive but there are fewer of these compared to branch breakers.
Configuration At PDU / RPP input
At branch breaker input At the rack
Traditional 26.0 kA 3.8 kA 3.2 kA
4A 14 kA 14 kA 6.3 kA
4B 14 kA 14 kA 6.3 kA
5A 26 kA 8.2 kA 5.6 kA
5B 14 kA 14 kA 6.3 kA
Transformer over-sizing due to load diversity Transformer over-sizing mainly affects the traditional configuration as well as 5A and 5B due to the use of distributed transformers at the row level. This effect is not as prominent in 5B due to the use of higher-efficiency auto-transformers. The fact that 5A uses distributed isolation-transformers provides no transformer-efficiency gains over the traditional configura-tion. All of the efficiency gains in 5A are a result of decreased distribution wire losses. For these reasons, 5A is not a recommended configuration. It’s important to note that configurations 4A and 4B are also subject to over-sizing due to load diversity but this does not result in additional losses. This is because the RPPs do not include transformers which add significant losses. RPPs can be oversized to provide additional circuit breaker positions and or power capacity. Electrical efficiency Configurations 4A, 4B, 5A, and 5B all provide efficiency gains over traditional 208/120 volt distribution. 5B provides the most efficiency gain over traditional mainly due to the consolida-tion of PDU isolation transformer into a single isolation transformer on the UPS bypass. Under normal operation, this transformer experiences no copper losses (i.e. proportional losses) and can even be specified to minimize core / fixed losses. 4A efficiency is nearly identical to 5B but experiences increased sub-feed wire losses due to the neutral conductor required. Whereas 4A requires 4 wires at the sub-feed level, configuration 5B requires only three wires at the sub-feed level. Material cost Configuration 4A and 5A provide nearly identical material cost (less than 2% difference) and represent the largest reduction in material cost compared to traditional distribution. With 4A, most of the savings are a result of reduced transformer costs. With 5A, most of the savings are a result of reduced circuit breaker costs. 4A, 4B, and 5B all incur a 25% increase in sub-feed wire cost due to the neutral wire required at the sub-feed level. As rack density increas-es, the cost of copper wire increases faster for the traditional compared to 240V configura-tions.
Table A1 Available fault current in kA
High-Efficiency AC Power Distribution for Data Centers
Schneider Electric – Data Center Science Center White Paper 128 Rev 2 15
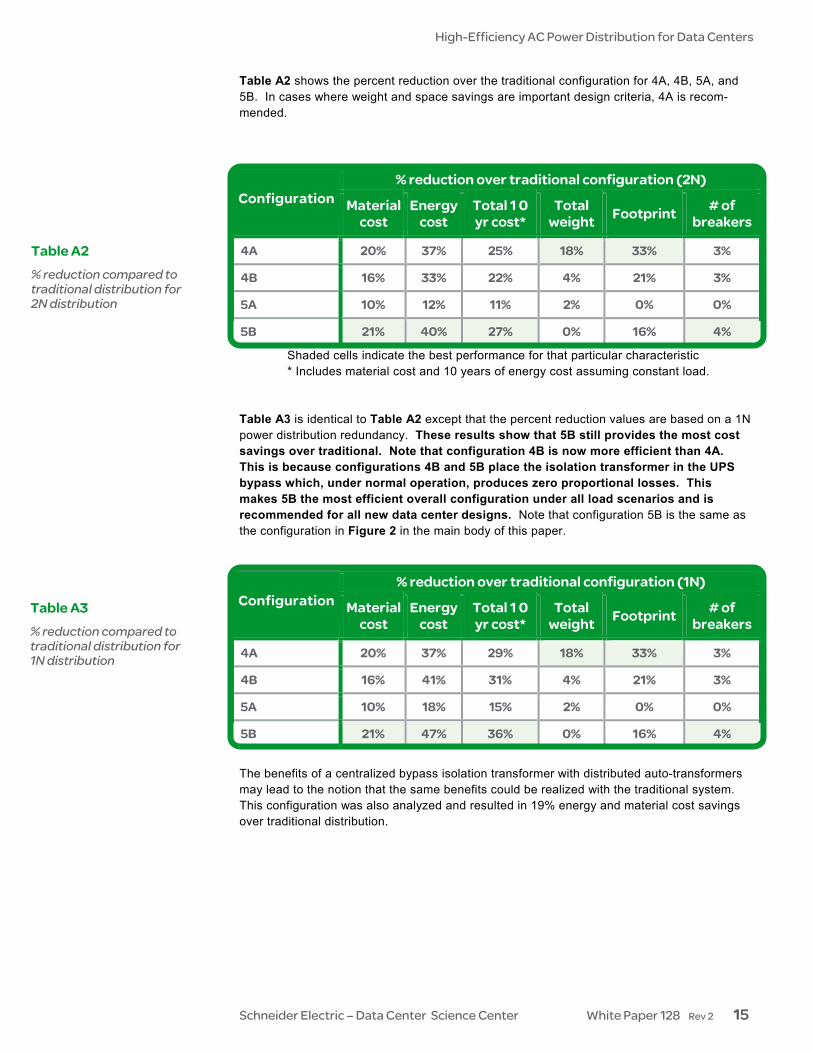
Table A2 shows the percent reduction over the traditional configuration for 4A, 4B, 5A, and 5B. In cases where weight and space savings are important design criteria, 4A is recom-mended.
Configuration% reduction over traditional configuration (2N)
Material cost
Energy cost
Total 1 0 yr cost*
Total weight Footprint # of
breakers
4A 20% 37% 25% 18% 33% 3%
4B 16% 33% 22% 4% 21% 3%
5A 10% 12% 11% 2% 0% 0%
5B 21% 40% 27% 0% 16% 4%
Shaded cells indicate the best performance for that particular characteristic * Includes material cost and 10 years of energy cost assuming constant load.
Table A3 is identical to Table A2 except that the percent reduction values are based on a 1N power distribution redundancy. These results show that 5B still provides the most cost savings over traditional. Note that configuration 4B is now more efficient than 4A. This is because configurations 4B and 5B place the isolation transformer in the UPS bypass which, under normal operation, produces zero proportional losses. This makes 5B the most efficient overall configuration under all load scenarios and is recommended for all new data center designs. Note that configuration 5B is the same as the configuration in Figure 2 in the main body of this paper.
Configuration% reduction over traditional configuration (1N)
Material cost
Energy cost
Total 1 0 yr cost*
Total weight Footprint # of
breakers
4A 20% 37% 29% 18% 33% 3%
4B 16% 41% 31% 4% 21% 3%
5A 10% 18% 15% 2% 0% 0%
5B 21% 47% 36% 0% 16% 4%
The benefits of a centralized bypass isolation transformer with distributed auto-transformers may lead to the notion that the same benefits could be realized with the traditional system. This configuration was also analyzed and resulted in 19% energy and material cost savings over traditional distribution.
Table A2 % reduction compared to traditional distribution for 2N distribution
Table A3 % reduction compared to traditional distribution for 1N distribution
High-Efficiency AC Power Distribution for Data Centers
Schneider Electric – Data Center Science Center White Paper 128 Rev 2 16
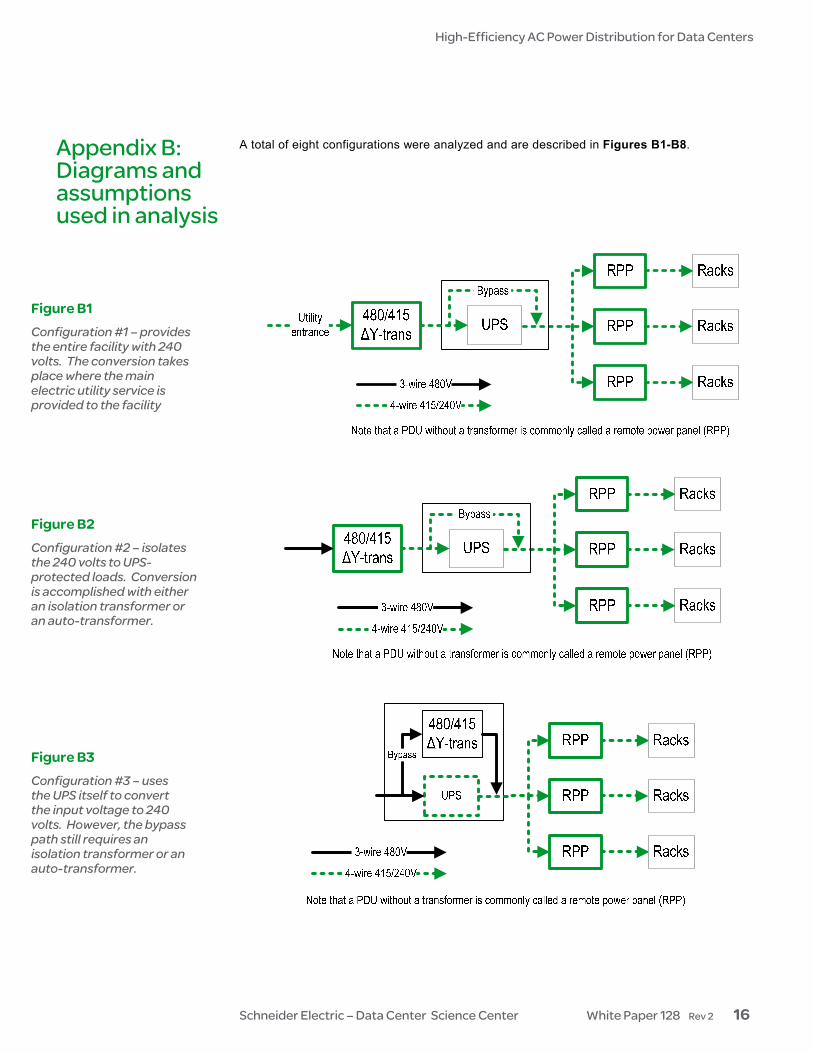
A total of eight configurations were analyzed and are described in Figures B1-B8.
Appendix B: Diagrams and assumptions used in analysis
Figure B1 Configuration #1 – provides the entire facility with 240 volts. The conversion takes place where the main electric utility service is provided to the facility
Figure B2 Configuration #2 – isolates the 240 volts to UPS-protected loads. Conversion is accomplished with either an isolation transformer or an auto-transformer.
Figure B3 Configuration #3 – uses the UPS itself to convert the input voltage to 240 volts. However, the bypass path still requires an isolation transformer or an auto-transformer.

High-Efficiency AC Power Distribution for Data Centers
Schneider Electric – Data Center Science Center White Paper 128 Rev 2 17
Figure B4 Configuration #4A – centralizes the conversion with one trans-former. Conversion is accomplished with an isolation transfor-mer on the UPS output.
Figure B5 Configuration #4B – centralizes the conversion with one trans-former. Conversion is accomplished with an auto-transformer on the UPS output.
Figure B6 Configuration #5A – distributes the conversion with multiple transformers. Conversion is accomplished with isolation transformers at the row level.
Figure B7 Configuration #5B – distributes the conversion with multiple transformers. Conversion is accomplished with auto- transformers at the row level.
High-Efficiency AC Power Distribution for Data Centers
Schneider Electric – Data Center Science Center White Paper 128 Rev 2 18
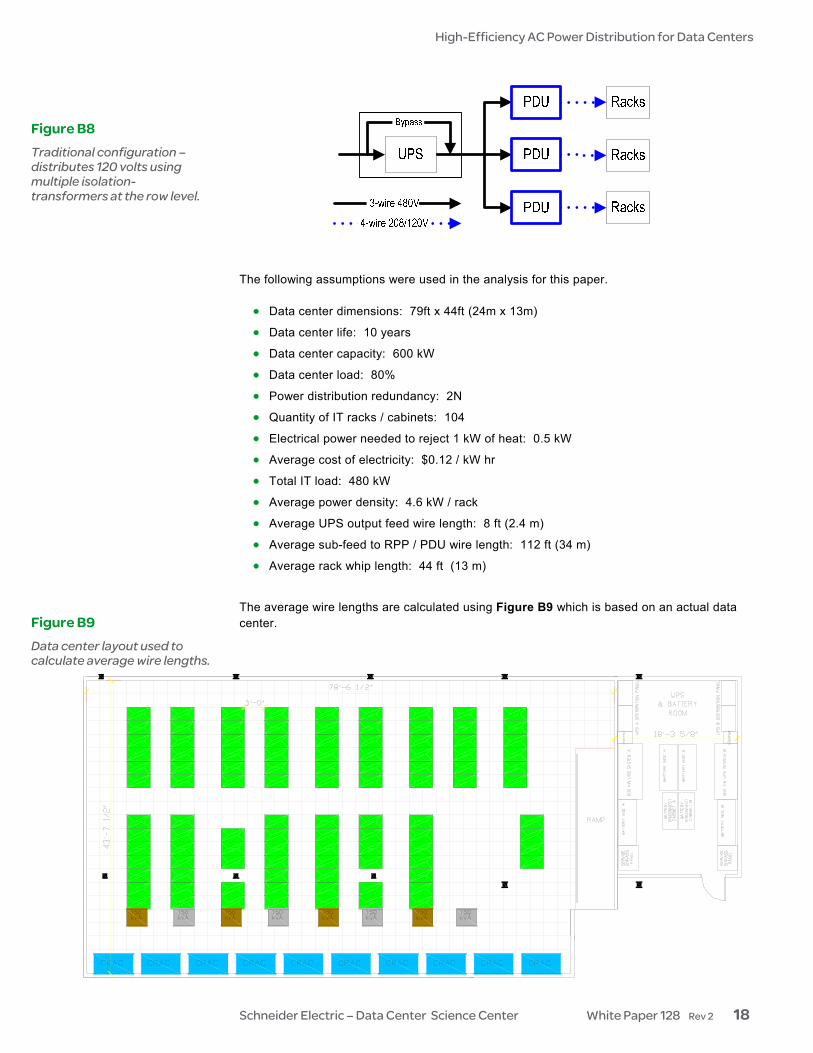
The following assumptions were used in the analysis for this paper. • Data center dimensions: 79ft x 44ft (24m x 13m)
• Data center life: 10 years
• Data center capacity: 600 kW
• Data center load: 80%
• Power distribution redundancy: 2N
• Quantity of IT racks / cabinets: 104
• Electrical power needed to reject 1 kW of heat: 0.5 kW
• Average cost of electricity: $0.12 / kW hr
• Total IT load: 480 kW
• Average power density: 4.6 kW / rack
• Average UPS output feed wire length: 8 ft (2.4 m)
• Average sub-feed to RPP / PDU wire length: 112 ft (34 m)
• Average rack whip length: 44 ft (13 m)
The average wire lengths are calculated using Figure B9 which is based on an actual data center.
Figure B8 Traditional configuration – distributes 120 volts using multiple isolation-transformers at the row level.
Figure B9 Data center layout used to calculate average wire lengths.
High-Efficiency AC Power Distribution for Data Centers
Schneider Electric – Data Center Science Center White Paper 128 Rev 2 19
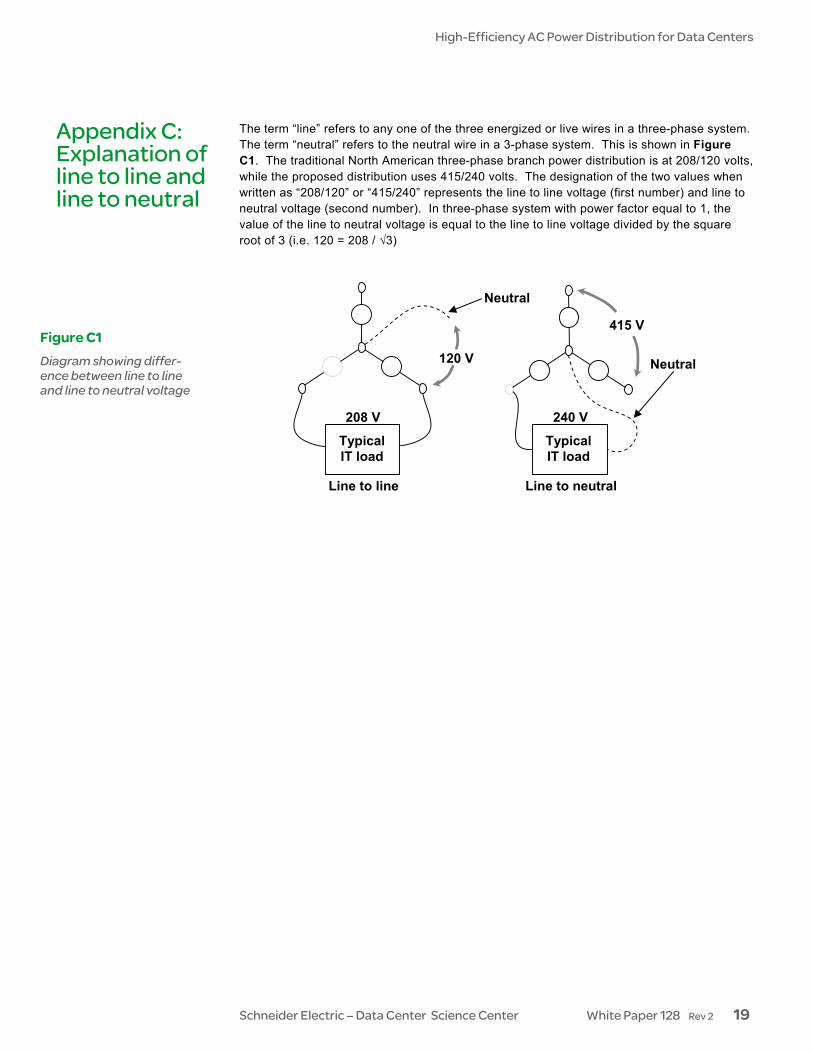
The term “line” refers to any one of the three energized or live wires in a three-phase system. The term “neutral” refers to the neutral wire in a 3-phase system. This is shown in Figure C1. The traditional North American three-phase branch power distribution is at 208/120 volts, while the proposed distribution uses 415/240 volts. The designation of the two values when written as “208/120” or “415/240” represents the line to line voltage (first number) and line to neutral voltage (second number). In three-phase system with power factor equal to 1, the value of the line to neutral voltage is equal to the line to line voltage divided by the square root of 3 (i.e. 120 = 208 / √3)
Figure C1 Diagram showing differ-ence between line to line and line to neutral voltage
Typical IT load
Neutral
Neutral
240 V
Line to neutral Line to line
Typical IT load
208 V
120 V
415 V
Appendix C: Explanation of line to line and line to neutral