Embed Size (px)
Citation preview
www.impactjournals.com/oncotarget/ Oncotarget, Supplementary Materials 2017
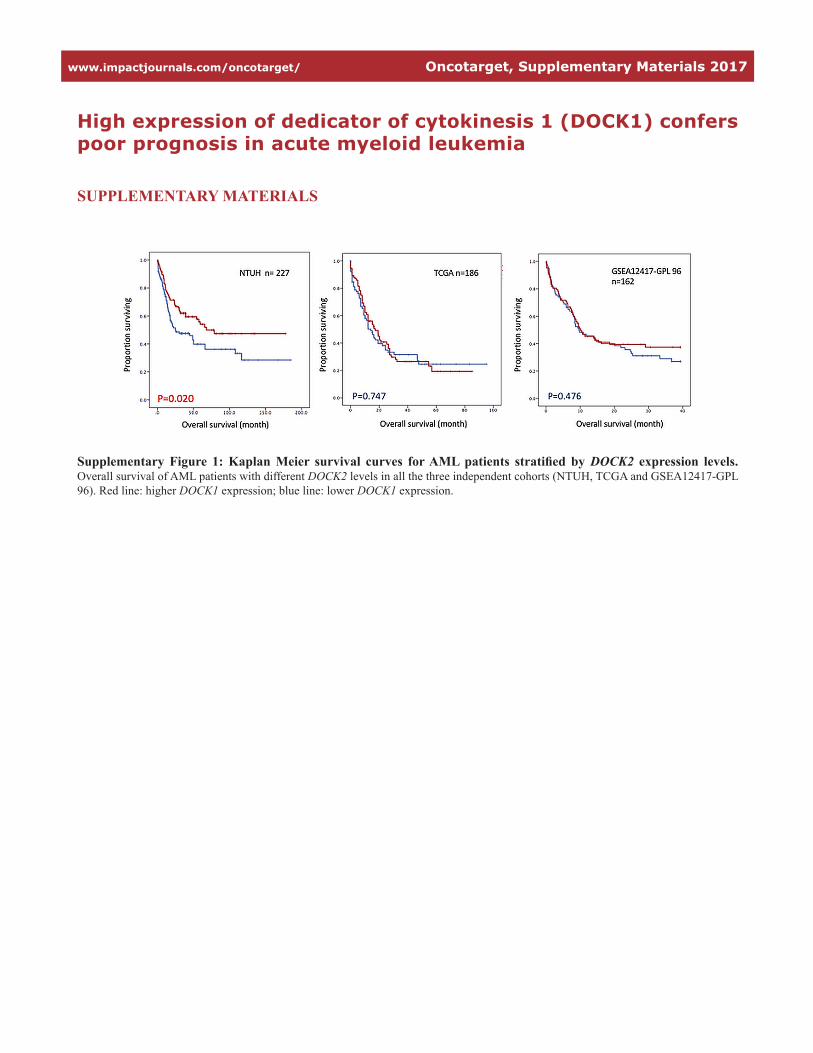
High expression of dedicator of cytokinesis 1 (DOCK1) confers poor prognosis in acute myeloid leukemia
SUPPLEMENTARY MATERIALS
Supplementary Figure 1: Kaplan Meier survival curves for AML patients stratified by DOCK2 expression levels. Overall survival of AML patients with different DOCK2 levels in all the three independent cohorts (NTUH, TCGA and GSEA12417-GPL 96). Red line: higher DOCK1 expression; blue line: lower DOCK1 expression.
www.impactjournals.com/oncotarget/ Oncotarget, Supplementary Materials 2017
Supplementary Table 1: Univariate analysis on the overall survival in the AML patients
See Supplememtary File 1
Supplementary Table 2: Univariate analysis on the disease free survival in the AML patients
See Supplememtary File 1
www.impactjournals.com/oncotarget/ Oncotarget, Supplementary Materials 2017
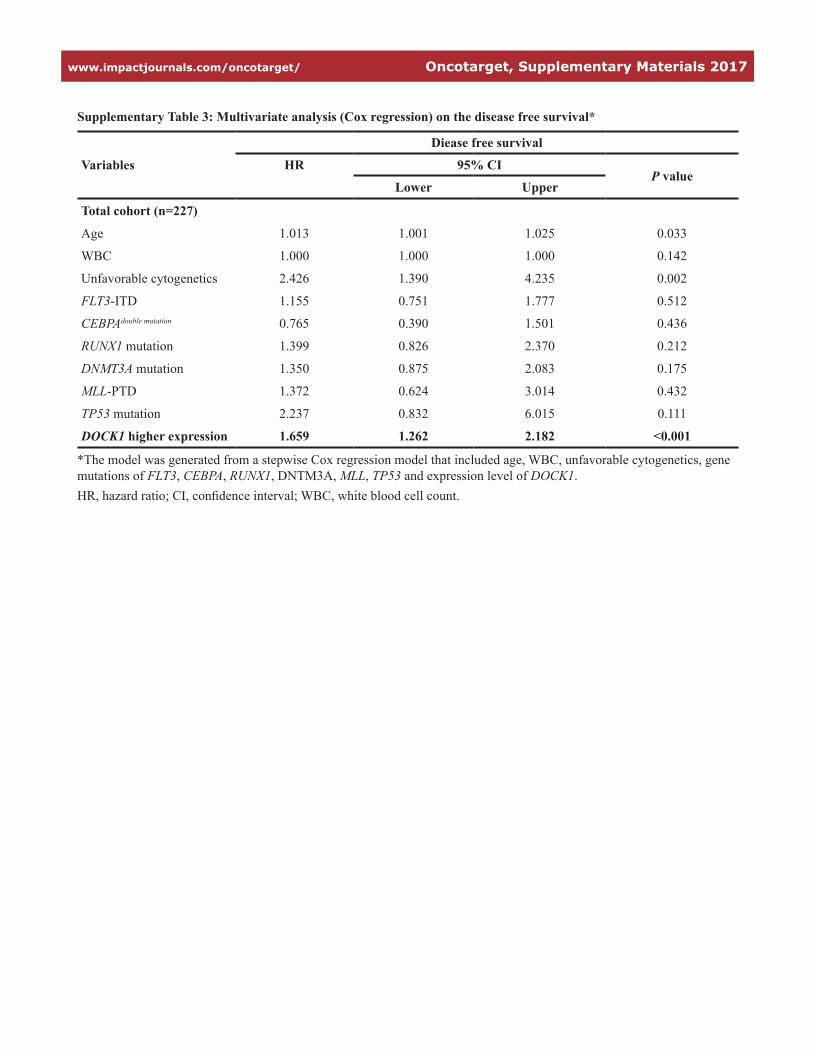
Supplementary Table 3: Multivariate analysis (Cox regression) on the disease free survival*
Variables
Diease free survival
HR 95% CIP value
Lower Upper
Total cohort (n=227)
Age 1.013 1.001 1.025 0.033
WBC 1.000 1.000 1.000 0.142
Unfavorable cytogenetics 2.426 1.390 4.235 0.002
FLT3-ITD 1.155 0.751 1.777 0.512
CEBPAdouble mutation 0.765 0.390 1.501 0.436
RUNX1 mutation 1.399 0.826 2.370 0.212
DNMT3A mutation 1.350 0.875 2.083 0.175
MLL-PTD 1.372 0.624 3.014 0.432
TP53 mutation 2.237 0.832 6.015 0.111
DOCK1 higher expression 1.659 1.262 2.182 <0.001
*The model was generated from a stepwise Cox regression model that included age, WBC, unfavorable cytogenetics, gene mutations of FLT3, CEBPA, RUNX1, DNTM3A, MLL, TP53 and expression level of DOCK1.HR, hazard ratio; CI, confidence interval; WBC, white blood cell count.
www.impactjournals.com/oncotarget/ Oncotarget, Supplementary Materials 2017
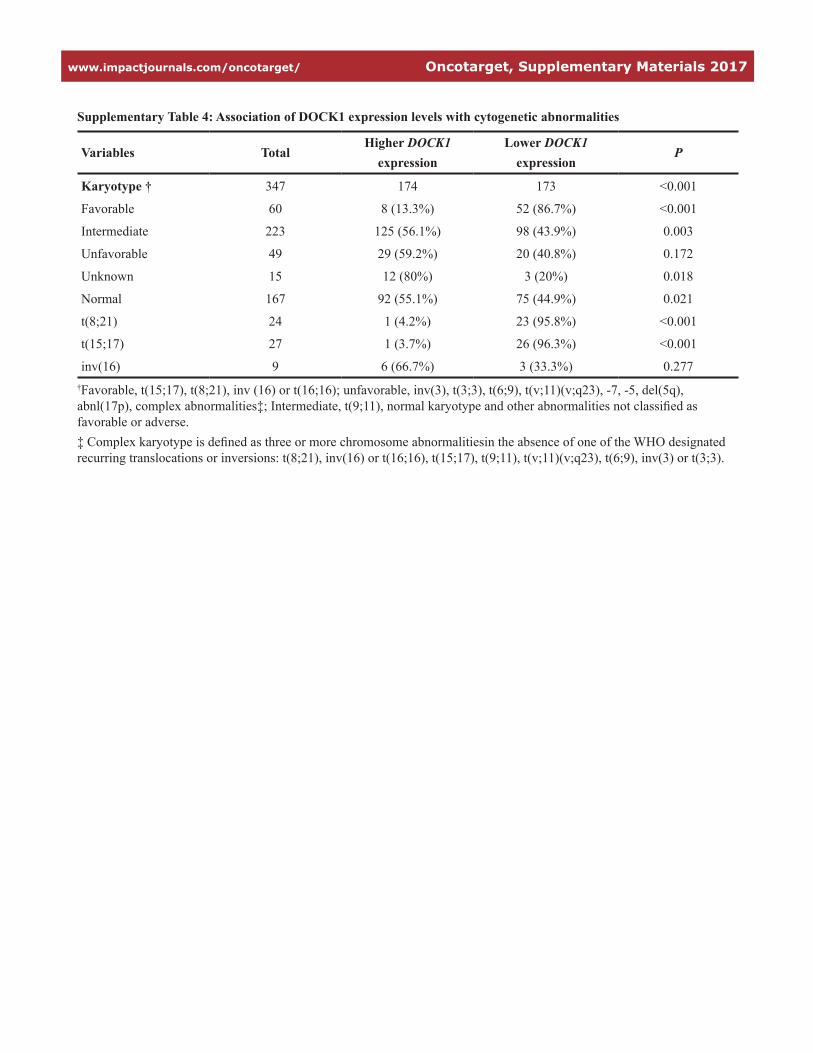
Supplementary Table 4: Association of DOCK1 expression levels with cytogenetic abnormalities
Variables TotalHigher DOCK1
expressionLower DOCK1
expressionP
Karyotype † 347 174 173 <0.001
Favorable 60 8 (13.3%) 52 (86.7%) <0.001
Intermediate 223 125 (56.1%) 98 (43.9%) 0.003
Unfavorable 49 29 (59.2%) 20 (40.8%) 0.172
Unknown 15 12 (80%) 3 (20%) 0.018
Normal 167 92 (55.1%) 75 (44.9%) 0.021
t(8;21) 24 1 (4.2%) 23 (95.8%) <0.001
t(15;17) 27 1 (3.7%) 26 (96.3%) <0.001
inv(16) 9 6 (66.7%) 3 (33.3%) 0.277†Favorable, t(15;17), t(8;21), inv (16) or t(16;16); unfavorable, inv(3), t(3;3), t(6;9), t(v;11)(v;q23), -7, -5, del(5q), abnl(17p), complex abnormalities‡; Intermediate, t(9;11), normal karyotype and other abnormalities not classified as favorable or adverse.‡ Complex karyotype is defined as three or more chromosome abnormalitiesin the absence of one of the WHO designated recurring translocations or inversions: t(8;21), inv(16) or t(16;16), t(15;17), t(9;11), t(v;11)(v;q23), t(6;9), inv(3) or t(3;3).
www.impactjournals.com/oncotarget/ Oncotarget, Supplementary Materials 2017
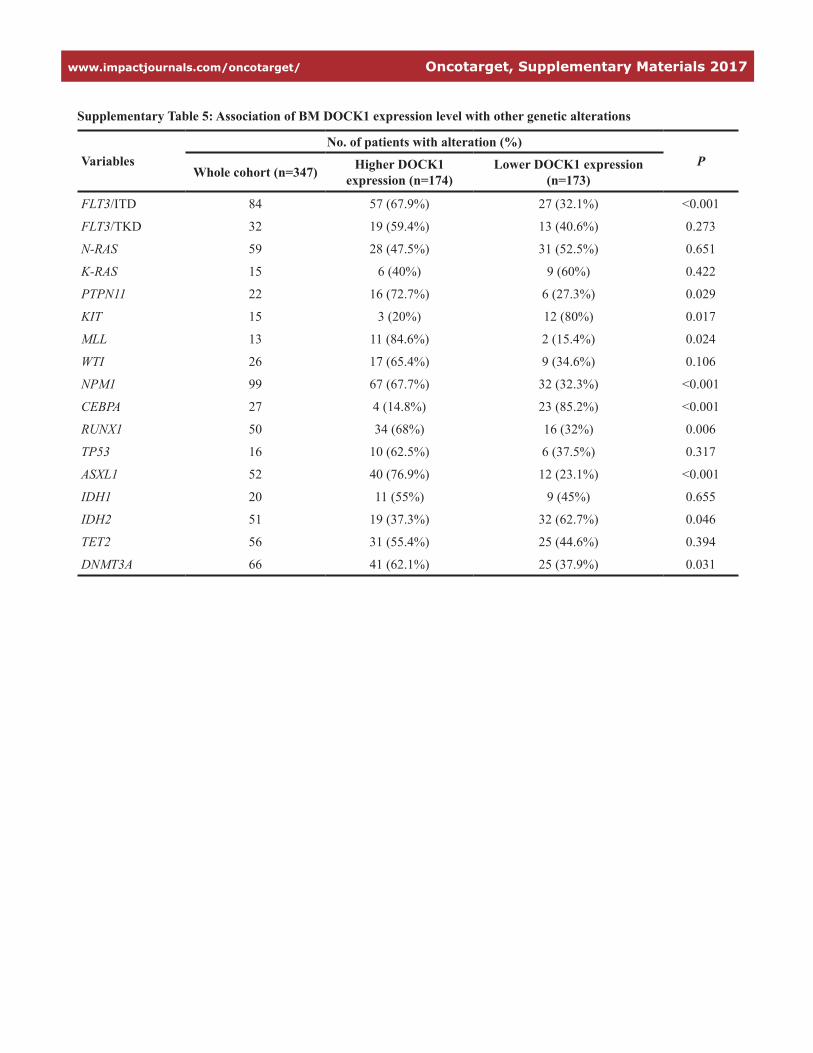
Supplementary Table 5: Association of BM DOCK1 expression level with other genetic alterations
VariablesNo. of patients with alteration (%)
PWhole cohort (n=347) Higher DOCK1
expression (n=174)Lower DOCK1 expression
(n=173)
FLT3/ITD 84 57 (67.9%) 27 (32.1%) <0.001
FLT3/TKD 32 19 (59.4%) 13 (40.6%) 0.273
N-RAS 59 28 (47.5%) 31 (52.5%) 0.651
K-RAS 15 6 (40%) 9 (60%) 0.422
PTPN11 22 16 (72.7%) 6 (27.3%) 0.029
KIT 15 3 (20%) 12 (80%) 0.017
MLL 13 11 (84.6%) 2 (15.4%) 0.024
WTI 26 17 (65.4%) 9 (34.6%) 0.106
NPM1 99 67 (67.7%) 32 (32.3%) <0.001
CEBPA 27 4 (14.8%) 23 (85.2%) <0.001
RUNX1 50 34 (68%) 16 (32%) 0.006
TP53 16 10 (62.5%) 6 (37.5%) 0.317
ASXL1 52 40 (76.9%) 12 (23.1%) <0.001
IDH1 20 11 (55%) 9 (45%) 0.655
IDH2 51 19 (37.3%) 32 (62.7%) 0.046
TET2 56 31 (55.4%) 25 (44.6%) 0.394
DNMT3A 66 41 (62.1%) 25 (37.9%) 0.031
www.impactjournals.com/oncotarget/ Oncotarget, Supplementary Materials 2017
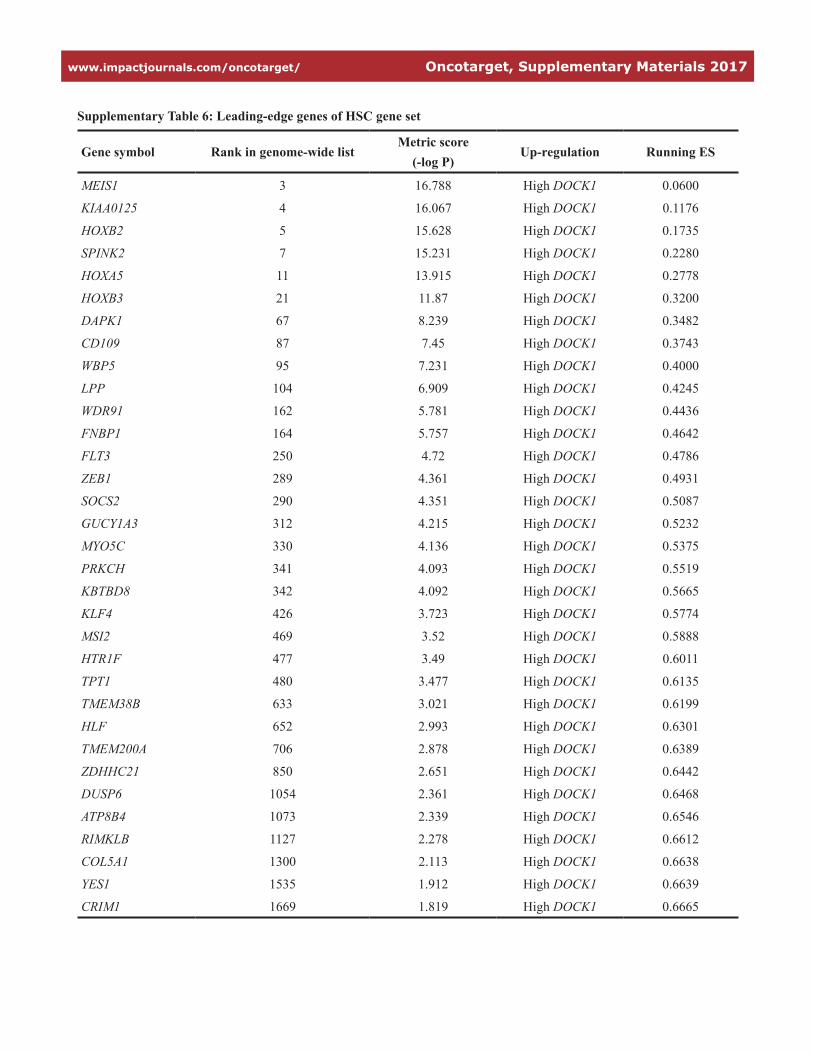
Supplementary Table 6: Leading-edge genes of HSC gene set
Gene symbol Rank in genome-wide listMetric score
(-log P)Up-regulation Running ES
MEIS1 3 16.788 High DOCK1 0.0600
KIAA0125 4 16.067 High DOCK1 0.1176
HOXB2 5 15.628 High DOCK1 0.1735
SPINK2 7 15.231 High DOCK1 0.2280
HOXA5 11 13.915 High DOCK1 0.2778
HOXB3 21 11.87 High DOCK1 0.3200
DAPK1 67 8.239 High DOCK1 0.3482
CD109 87 7.45 High DOCK1 0.3743
WBP5 95 7.231 High DOCK1 0.4000
LPP 104 6.909 High DOCK1 0.4245
WDR91 162 5.781 High DOCK1 0.4436
FNBP1 164 5.757 High DOCK1 0.4642
FLT3 250 4.72 High DOCK1 0.4786
ZEB1 289 4.361 High DOCK1 0.4931
SOCS2 290 4.351 High DOCK1 0.5087
GUCY1A3 312 4.215 High DOCK1 0.5232
MYO5C 330 4.136 High DOCK1 0.5375
PRKCH 341 4.093 High DOCK1 0.5519
KBTBD8 342 4.092 High DOCK1 0.5665
KLF4 426 3.723 High DOCK1 0.5774
MSI2 469 3.52 High DOCK1 0.5888
HTR1F 477 3.49 High DOCK1 0.6011
TPT1 480 3.477 High DOCK1 0.6135
TMEM38B 633 3.021 High DOCK1 0.6199
HLF 652 2.993 High DOCK1 0.6301
TMEM200A 706 2.878 High DOCK1 0.6389
ZDHHC21 850 2.651 High DOCK1 0.6442
DUSP6 1054 2.361 High DOCK1 0.6468
ATP8B4 1073 2.339 High DOCK1 0.6546
RIMKLB 1127 2.278 High DOCK1 0.6612
COL5A1 1300 2.113 High DOCK1 0.6638
YES1 1535 1.912 High DOCK1 0.6639
CRIM1 1669 1.819 High DOCK1 0.6665
www.impactjournals.com/oncotarget/ Oncotarget, Supplementary Materials 2017
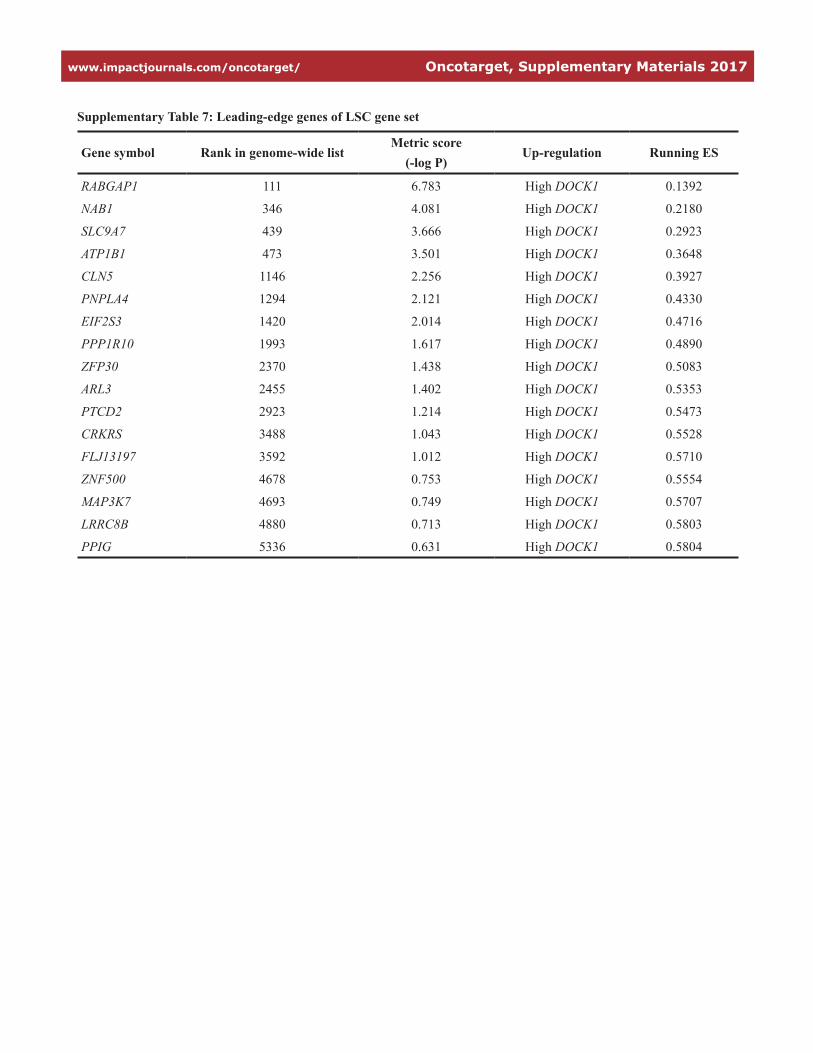
Supplementary Table 7: Leading-edge genes of LSC gene set
Gene symbol Rank in genome-wide listMetric score
(-log P)Up-regulation Running ES
RABGAP1 111 6.783 High DOCK1 0.1392
NAB1 346 4.081 High DOCK1 0.2180
SLC9A7 439 3.666 High DOCK1 0.2923
ATP1B1 473 3.501 High DOCK1 0.3648
CLN5 1146 2.256 High DOCK1 0.3927
PNPLA4 1294 2.121 High DOCK1 0.4330
EIF2S3 1420 2.014 High DOCK1 0.4716
PPP1R10 1993 1.617 High DOCK1 0.4890
ZFP30 2370 1.438 High DOCK1 0.5083
ARL3 2455 1.402 High DOCK1 0.5353
PTCD2 2923 1.214 High DOCK1 0.5473
CRKRS 3488 1.043 High DOCK1 0.5528
FLJ13197 3592 1.012 High DOCK1 0.5710
ZNF500 4678 0.753 High DOCK1 0.5554
MAP3K7 4693 0.749 High DOCK1 0.5707
LRRC8B 4880 0.713 High DOCK1 0.5803
PPIG 5336 0.631 High DOCK1 0.5804
www.impactjournals.com/oncotarget/ Oncotarget, Supplementary Materials 2017
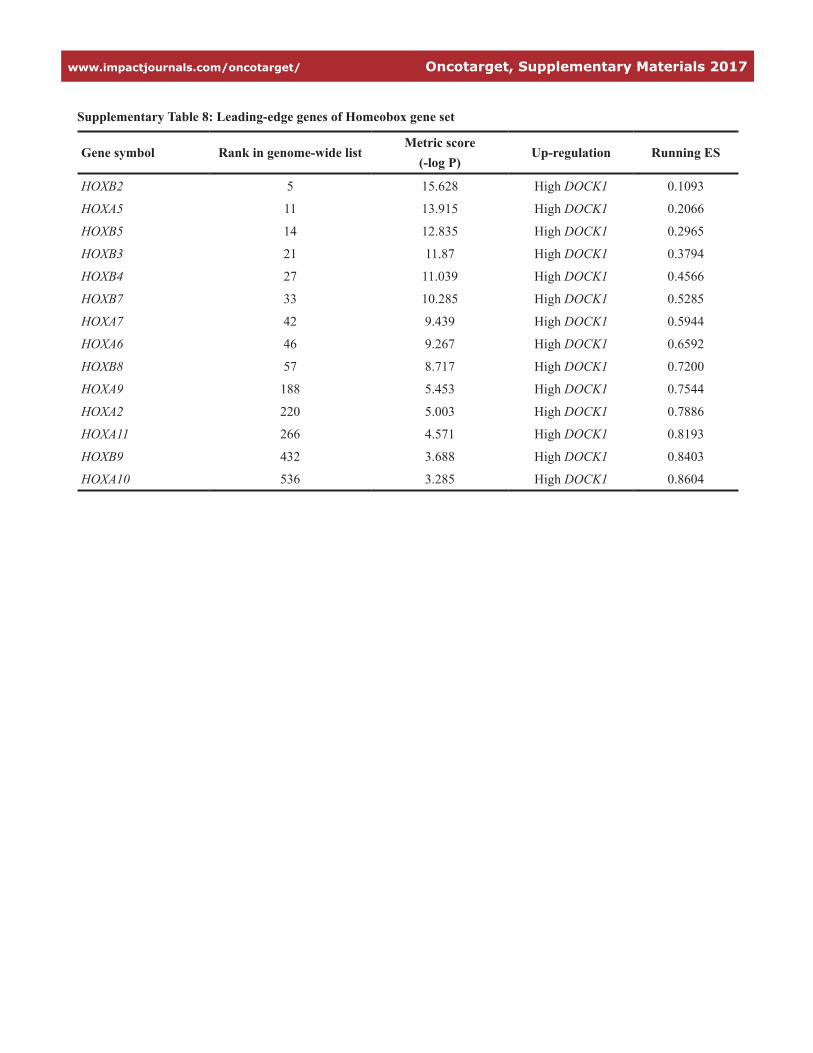
Supplementary Table 8: Leading-edge genes of Homeobox gene set
Gene symbol Rank in genome-wide listMetric score
(-log P)Up-regulation Running ES
HOXB2 5 15.628 High DOCK1 0.1093
HOXA5 11 13.915 High DOCK1 0.2066
HOXB5 14 12.835 High DOCK1 0.2965
HOXB3 21 11.87 High DOCK1 0.3794
HOXB4 27 11.039 High DOCK1 0.4566
HOXB7 33 10.285 High DOCK1 0.5285
HOXA7 42 9.439 High DOCK1 0.5944
HOXA6 46 9.267 High DOCK1 0.6592
HOXB8 57 8.717 High DOCK1 0.7200
HOXA9 188 5.453 High DOCK1 0.7544
HOXA2 220 5.003 High DOCK1 0.7886
HOXA11 266 4.571 High DOCK1 0.8193
HOXB9 432 3.688 High DOCK1 0.8403
HOXA10 536 3.285 High DOCK1 0.8604
www.impactjournals.com/oncotarget/ Oncotarget, Supplementary Materials 2017
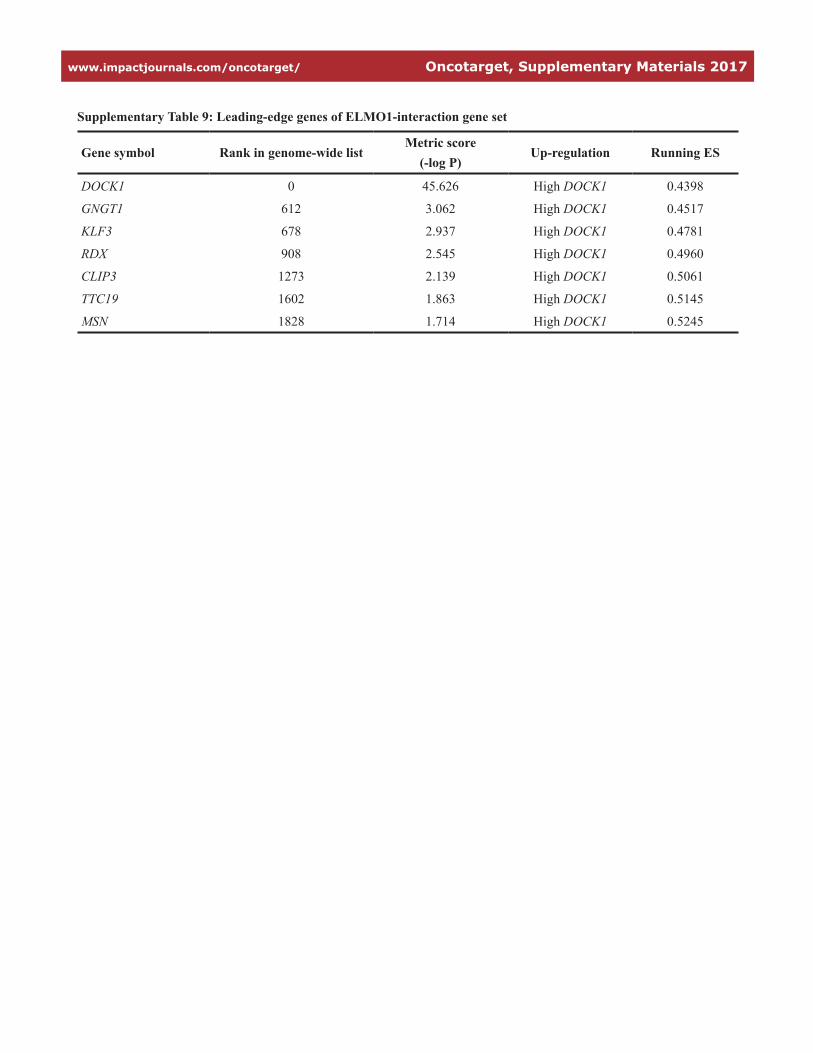
Supplementary Table 9: Leading-edge genes of ELMO1-interaction gene set
Gene symbol Rank in genome-wide listMetric score
(-log P)Up-regulation Running ES
DOCK1 0 45.626 High DOCK1 0.4398
GNGT1 612 3.062 High DOCK1 0.4517
KLF3 678 2.937 High DOCK1 0.4781
RDX 908 2.545 High DOCK1 0.4960
CLIP3 1273 2.139 High DOCK1 0.5061
TTC19 1602 1.863 High DOCK1 0.5145
MSN 1828 1.714 High DOCK1 0.5245

www.impactjournals.com/oncotarget/ Oncotarget, Supplementary Materials 2017
Supplementary Table 10: Differentially-expressed probes between DOCK1-high and DOCK1-low patients
See Supplememtary File 1