Embed Size (px)
Citation preview

High Fidelity Moment of Inertia Testing of Unmanned Aircraft
Or D. Dantsker∗, Moiz Vahora†, Saym Imtiaz‡, and Marco Caccamo§
University of Illinois at Urbana–Champaign, Urbana, IL 61801
Knowledge of moment of inertia data for an aircraft is critical for both aircraft analysis as well as model development
for control. There have been a variety of different methods employed to measure moment of inertia including: physical
pendulums, bifilar pendulums, compound pendulums, torsional pendulums, and torque. The accuracy of the moments
of inertia determined using these methods depend upon a variety of factors, such as friction, drag, and vibrations. These
contributions can be significant, as errors due to drag can increase quadratically with velocity and errors due to friction
can increase as mass is added to the system. This paper seeks to build upon previous moment of inertia measurement
techniques by considering the effects of drag on experimental measurements. A torque-based moment of inertia testing
rig was fabricated in house, made up of a 4 x 6 x 6 ft steel framework and a pulley torque system. The testing rig allows
for quick and reliable measurement with minimal error. Validation was performed using a series of bars to quantify how
much error is expected and then using a flat plate to demonstrate that drag is negligible. Finally, the testing rig was used
to measure the moment of inertia of two unmanned aircraft.
Nomenclature
CAD = computer-aided design
CG = center of gravity (center of mass)
UAV = unmanned aerial vehicle
AR = aspect ratio
b = wingspan
I = moment of inertia
I′ = moment of inertia about a new axis
Ixx, Iyy, Izz = roll, pitch, and yaw moment of inertia
L = total length
m = aircraft mass
r = radius
S = wing area
W = weight
W/S = wing loading
ω = angular velocity
ω = angular acceleration
τ = torque
∗Ph.D. Student, Department of Aerospace Engineering, AIAA Student Member. [email protected]†M.S. Student, Department of Aerospace Engineering, AIAA Student Member. [email protected]‡Undergraduate Student, Department of Aerospace Engineering. [email protected]§Professor, Department of Computer Science. [email protected]
1 of 16
American Institute of Aeronautics and Astronautics

I. Introduction
Knowledge of moment of inertia data for an aircraft is critical for both aerodynamic analysis as well as model
development for control. There have been a variety of different methods employed to measure the moment of inertia
including: physical pendulums, bifilar pendulums, compound pendulums, torsional pendulums, and torque.1–9 The
accuracy of the inertias determined using these methods depend upon a variety of factors, such as friction, drag, and
vibrations. These contributions can be significant, as errors due to drag can increase quadratically depending upon how
fast the inertias are being measured and friction can increase as mass is added to the system.
In the early work of the National Advisory Committee for Aeronautics (NACA), mass moment of inertia properties
of small aircraft were measured using a bifilar pendulum. This system improved upon previous bifilar pendulums, as it
was designed to eliminate secondary oscillations during operation. Though an improvement upon previous inertia rigs,
factors such as damping were not considered and the pendulum was assumed to be a harmonic undamped oscillator,
which can result in significant errors.1, 2 Other efforts undertaken by NACA including the use of compound pendulums
and torsional pendulums with varying success.3, 4
Jardin and Mueller developed a bifilar pendulum that accounts for both damping and air resistance, by incorporating
non-linear terms into the equations of motion. These results were accurate for small inertia values, though errors of
12% occurred from the measurements as the mass and area of the measured object increased, requiring additional mass
corrections.6 A knife-edge pendulum was used in conjunction with the parallel-axis theorem to calculate the inertias of
multiple UAVs, yielding low errors for small aircraft. This method takes into account dampening from friction, which
allowed the researchers to calculate the natural period of the their UAV. As the size of the aircraft increased though,
errors as high as 40% resulted, meaning that this technique is not practical for estimating the moment of inertia of larger
UAVs.7
Lehmkuhler et. al examined moment of inertia testing in detail and developed two types of physical pendulum
testing methods: single degree-of-freedom and three degree-of-freedom.9 As expected, the single degree-of-freedom
testing method yield the moment of inertia value for a single axis while the three degree-of-freedom testing method is
able to yields the entire inertia tensor from a single swing test. The testing methods take into account geometric-based
corrections for drag to increase accuracy. These corrections, which can account for up to 25% of the values, were based
on results from testing an aircraft-shaped flat plate and a foam-simulation aircraft. Using the corrections, the testing
methods yielded errors between 0 and 3.3% for the single degree-of-freedom tests and errors between 0 and 13.6% for
the three degree-of-freedom tests.
The methods in the literature provide a range of testing options, but are, for the most part, rather time-intensive in
their implementation and troublesome in terms of minimizing error. This provided the motivation to develop a moment
of inertia testing method that would be both quick and easy to use as well as insensitive to external factors, thereby
minimizing potential sources for error. Taking inspiration from motor-driven, torque-based moment of inertia testing
rigs used to measure micro- and cube-satellites, a known-mass and pulley, torque-based moment of inertia testing rig
was developed.
This paper describes a torque-based moment of inertia testing rig intended for small to medium sized unmanned
aircraft as well as for the testing and validation techniques employed. The rig, which was fabricated in house, is made
up of a 4 x 6 x 6 ft steel framework and a pulley torque system. The moments of inertia are determined by applying a
known torque using a known-mass to the pulley system, which will cause the system to accelerate.
This paper will first examine the theory behind the moment of inertia measurement method used. Then the inertia
rig design, construction, and instrumentation will be presented. This will be followed byvalidation testing and error
quantification. After that, the testing of two aircraft will presented, which includes the mounting methods used. The
paper will conclude with a summary and statement of future work.
2 of 16
American Institute of Aeronautics and Astronautics

II. Theory
The moment of inertia of a system can be determined by applying a known torque to the system, which will cause
the system to angularly accelerate. The motion of the torque system is governed by:
τ = Iω (1)
where torque is a linear function of the moment of inertia and of angular acceleration. This expression can be rearranged
as such:
I =τω
(2)
To calculate the moment of inertia, the torque applied and angular acceleration must be known. Assuming that
the torque is constant and known, the angular acceleration must be found. As instruments, i.e. gyroscopes, typically
measure angular velocity and not acceleration, the angular velocity values measured can be differentiated with respect
to time to yield acceleration.
In order to minimize motion effects, the pulley system should be perturbed with an initial velocity in the direction
opposite of the torque and released. This would allow the system to accelerate in the direction of the torque passing
through zero velocity. By only utilizing measurements around zero velocity, as illustrated in Figure 1, the angular velocity
will be minimized and in doing so the drag will be reduced quadratically with velocity, making drag contributions
negligible.
���� ���0 0.5 1 1.5 2 2.5 3 3.5
���
����
�
-2
-1
0
1
2
(a)
���� ���0 0.5 1 1.5 2 2.5 3 3.5
���
����
�
-2
-1
0
1
2
(b)
Figure 1. A example moment of inertia test where data is collected about zero angular velocity, starting at the green line and ending at thered line with: (a) a constant angular acceleration of -1 rad/s and (b) a perturbed initial velocity of 1.5 rad/s.
However, it may be infeasible to mount an entire aircraft on the pulley about its center of gravity (center of mass)
due to geometric and structural constraints. One option is to break the aircraft into smaller components and to add up
all of the individual moments of inertia. However, the locations where each of these components are mounted on the
aircraft with respect to the center of gravity must be accounted for. This can be done through the use of the parallel axis
theorem:
I′ = I+m r2 (3)
where the adjusted moment of inertia is equal to the measured moment of inertia plus the mass of the component
multiplied by the radius (offset from desired location) squared. The moments of inertia of all the components can
therefore be accounted for and properly summed. Additionally, this equation can be inverted to find the moment of
inertia of a component if it must be offset from its center of mass during measurement.
3 of 16
American Institute of Aeronautics and Astronautics

III. Design and Development
The design of the moment of inertia testing rig is split up into the three functional elements: the framework,
the rotation assembly, and the instrumentation. First, the framework must be very sturdy while providing sufficient
clearance for the aircraft to fit and rotate through. Next, the rotation assembly must be able to both support the aircraft
while allowing it to rotate freely with minimal friction. Finally, the instrumentation must record the angular velocity of
the rotational assembly with high fidelity and at high frequency. The combination of these functional elements are vital
such that proper measurements can be taken.
The framework was built from steel angles and bars, as can be seen in Figure 2. The steel angle sides provide
high rigidity and strength resisting twisting and bending along their length while the steel bars steady the framework,
maintaining squareness and inhibiting corner movement. All of the steel pieces are fastened using 1/4-20 bolts and
locknuts. The framework was sized to a 4 x 6 x 6 ft such that the rig could accommodate the testing of most aircraft in
the small to medium size category. The only major restriction in size is aircraft length during roll testing, where the
aircraft is mounted vertically; however, this can easily be overcome by lifting the rig off the ground and securing it to
concrete blocks. It was discovered in previous testing that a structure that was any larger would require significantly
thicker and wider steel angles and bars because the 1.5 in wide, 1/8 in thick steel angle and bars used would become
very flexible at those lengths.
Figure 2. Moment of inertia measurement rig
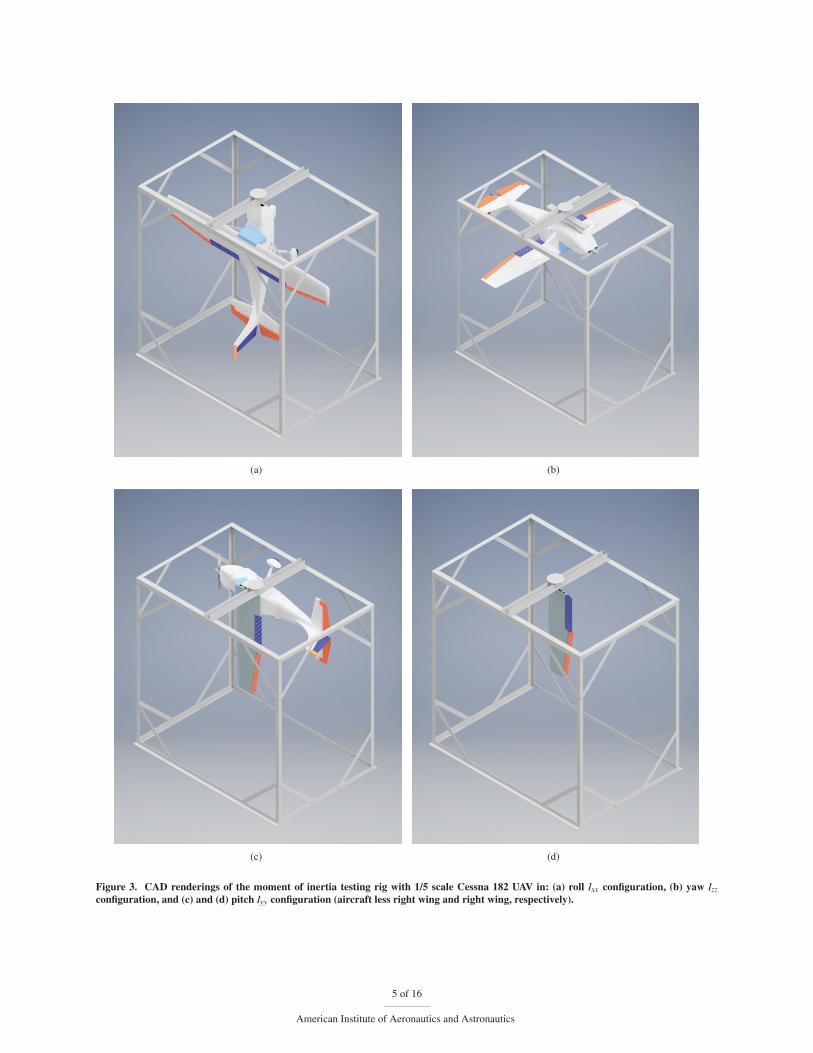
As part of the design process and to ensure that the moment of inertia testing rig could accommodate aircraft for
testing, an example aircraft was mounted within the CAD platform. A 1/5 scale Cessna, which was modeled as part of
other research,10 was mounted to the rotation assembly in roll, pitch, and yaw testing configurations, as can be seen in
Figure 3. For pitch testing, a wing panel would be removed, tested separately, and then the moments of inertia would be
added using the parallel axis theorem as outlined in Section II.
The rotation assembly consists of an aluminum block holding a pair of ball bearing that support a shaft connecting
the pulley to the aircraft mount; a cross section view of the rotation assembly can be seen in Figure 5. The aluminum
block was mounted through a pair of steel angles into the framework, which can be seen in Figure 4, such that there is
no movement. The bearings were pressed into the aluminum block and then the shaft was pressed into the bearings.
The pulley and aircraft mount were connected to the shaft using clamping hubs. A countersink bolt was also added to
provide extra security to inhibit the aircraft mount from slipping down and off the shaft.
4 of 16
American Institute of Aeronautics and Astronautics
(a) (b)
(c) (d)
Figure 3. CAD renderings of the moment of inertia testing rig with 1/5 scale Cessna 182 UAV in: (a) roll Ixx configuration, (b) yaw Izzconfiguration, and (c) and (d) pitch Iyy configuration (aircraft less right wing and right wing, respectively).
5 of 16
American Institute of Aeronautics and Astronautics

The instrumentation utilized in the moment of inertia testing rig was an Al Volo FDAQ 100 Hz data acquisition
system11 as shown in Figure 6. The FDAQ has an integrated inertial measurement unit integrated, which incorporates
a 3-axis gyroscope. The yaw-axis gyroscope was used to measure angular velocity required for moment of inertia
measurements. The system was packaged for this application in a low-weight nylon enclosure and the mass of the entire
enclosed system is approximately 100 gr. The FDAQ was semi-permanently attached onto the top of the pulley using a
high-strength adhesive double-sided tape. The FDAQ is powered by a small 2-cell, 7.4V 500mAh lithium polymer
battery, which has a mass of 30 gr and was attached to the top of the system using hook and loop such that it could be
removed for charging.
Figure 4. CAD drawing of the moment of inertia testing rig. Figure 5. Cross section of rotation assembly.
Figure 6. Moment of inertia measurement rig instrumentation.
6 of 16
American Institute of Aeronautics and Astronautics

IV. Validation Testing
Validation was performed on the moment of inertia testing rig using two methods. The first type of validation testing
involved measuring the moments of inertia of plastic and steel calibration bars, which could be combined in different
quantities to allow for the validation of a range of moments of inertia; the bars also have relatively high moment of
inertia values and thus are minimally effected by drag. The second type of validation testing involves measuring the
moment of inertia of a flat plat made out of MDF, which has relatively low mass and high area and thus demonstrates
the drag insensitivity of this moment of inertia testing rig.
A. Calibration Bars
Initial testing on the pulley torque system was performed using calibration pieces which consisted of 24 x 1.5 x 0.125 in
plastic and steel bars. The bars were tested on the rig in different quantities allowing for a range of moments of inertia
to be validated, from 0.0072 to 0.0389 kg m2. These bars have moments of inertia which can be calculated as follows:
I =m
12(L2 +W2) (4)
A 100 gram calibration mass was attached to the pulley string of the system to apply a constant torque. Figure 7
shows how the bars were attached to the pulley system and how the calibration mass was attached to the pulley string.
Figure 7. Moment of inertia validation testing of steel bars.
The angular velocity was measured by the Al Volo FDAQ system’s internal IMU gyroscope at an acquisition rate of
100Hz. After each measurement, an additional bar was mounted to the inertia rig to observe any discrepancies as the
weight and inertia increased. The results from these calculations are shown in Table 1. Based on the results, the rig is
able to very accurately measure the moment of inertia of an object, i.e. within 5%, as can be seen for 3 to 7 plastic bars
or 1 steel bar. The validation test with 2 steel bars exhibits 7.20% error; however, it is believed that insufficient torque,
generated by the 100 gr calibration mass relative to the inertia of the 2 bars, and the resulting friction effects are the
causes for this error.
Table 1. Summary of Bar Validation Testing
Bar Type Bar Qty Mass [kg] τ [N m] ω[rad/s2] Itheory[kg m2] Iexper[kg m2] Error [%]
Plastic 3 0.2325 0.08567 12.023 0.0072 0.0071 1.42
Plastic 4 0.3100 0.08567 8.9403 0.0096 0.0096 0.57
Plastic 5 0.3875 0.08567 7.1020 0.0120 0.0121 -.13
Plastic 6 0.4650 0.08567 6.2183 0.0145 0.0138 4.70
Plastic 7 0.5425 0.08567 5.3087 0.0169 0.0161 4.32
Steel 1 0.625 0.08567 -4.3612 0.0194 0.0196 -1.09
Steel 2 1.250 0.08567 -2.3755 0.0389 0.0361 7.20
7 of 16
American Institute of Aeronautics and Astronautics

B. Flat Plate
Additional validation testing was performed to study the contribution of drag to measurement error with the moment of
inertia rig. As such, a 48.75 x 6 x 0.75 in flat plate was cut from MDF, mounted to a steel bar from Section IV.A, and
mounted as shown in Figure 8. The flat plate has a wetted area close to that of the aircraft tested in Section V, and thus
is expected to produce a similar amount of drag. The MDF flat plate was tested using a 500 gr calibration mass.
Figure 8. Moment of inertia validation testing of MDF flat plate.
The angular velocity data generated was also used to calculate the total drag acting upon it, assuming a sectional
drag coefficient of 1.98 for a flat plate.12 The torque acting on the plate from drag was integrated along the span of the
plate. The total torque generated by drag was plotted with respect to time in Figure 9(b). The time average valued of
torque due to drag is 0.0009701 N m, which is 0.257% of the torque applied by the calibration mass applied to the
pulley (0.373 N m). As the torque due to drag is significantly smaller than the torque applied by the calibration mass
applied to the pulley, it was determined that by using this moment of inertia measurement technique, the effects of drag
are negligible and can be disregarded.
Table 2. Summary of Flat Plate Validation Testing
Mass [kg] ω[rad/s2] Itheory[kg m2] Iexper[kg m2] Error [%] τapplied [N m] τdrag [N m]
3.036 -0.9533 0.388 0.373 -3.87 0.373 9.701E-4
������� � � � � �
��������
����
��
���
��
�
���
�
(a)
������� � � � � �
����������������������
���
��
�
���
�
���
��
�
���
(b)
Figure 9. MDF flat plate moment of inertia testing: (a) angular velocity, (b) torque due to drag.
8 of 16
American Institute of Aeronautics and Astronautics

V. Aircraft Testing
Two aircraft were tested using the inertia rig. The first aircraft, the Avistar UAV, is based on a typical trainer-type
RC model and is used for avionics development. The second aircraft, the Cirrus SR-22T, is based on an approximately
1/5 scale model and is used for baseline testbed development. Both of these aircraft were mounted into the rig using
various methods described below. The first aircraft was tested in pitch while the second aircraft was tested in all 3 axes.
A. Avistar UAV
The Avistar UAV is a 62.5 in wingspan fixed-wing aircraft developed from the Great Planes Avistar Elite.13 This aircraft
has previously been used to test a sensor data acquisition system14, 15 as well as verify power estimation methods.16
The completed flight-ready aircraft is shown in Fig. 10 and its physical specifications are given in Table 3.
Figure 10. Avistar UAV aircraft.
Table 3. Avistar UAV physical specifications.
Geometric Properties
Overall Length 55.0 in (1395 mm)
Wing Span 62.5 in (1590 mm)
Wing Area 672 in2 (43.3 dm2)
Aspect Ratio 6.62
Inertial Properties
Weight 8.70 lb (3.945 kg)
Wing Loading 29.8 oz/ft2 (90.9 gr/dm2)
The Avistar UAV was tested only in the pitch axis per current research project needs. In order to do so, the aircraft
was disassembled into several pieces, as would be done so for transporting the aircraft; i.e. the fuselage, wing halves,
and wing tube. Each of these aircraft pieces was tested separately.
The fuselage pitch moment of inertia testing was performed using a 200 gr calibration mass as can be seen in
Figure 11(a).The fuselage was tested in a flight-ready state with the instrumentation and flight batteries installed. The
only change made to the aircraft was that the left main landing gear was removed and taped onto the right landing gear
such that the aircraft could freely rotate; care was taken to keep the same longitudinal placement. The mount used
to secure the fuselage was also tested on the inertia rig and the value measured was removed from that measured for
fuselage; see Figure 11(b).
The wings were tested one at a time using a plastic bar from Section IV.A as a mount and with a plastic cup and
coins, which had been weighed, to provide torque, as seen in Figure 12. Similar to the fuselage testing, the inertia of the
plastic bar was removed from the value measured for the wings. The inertia of the wing tube was estimated given that it
is a tight-tolerance aluminum tube with a length, diameter, thickness, and weight that could easily be measured.
9 of 16
American Institute of Aeronautics and Astronautics

The pitch moments of inertia of each of the components were added up using the parallel axis theorem, following
the description in Section II. The final value produced for the pitch moment is Iyy = 0.3423kg m2. It should be noted
that the Avistar UAV, specifically the fuselage, is not expected no produce significantly more drag than the flat plate used
in validation testing, as seen in the area comparison Figure 13. Therefore, based on the results from in Section IV.B, the
minimal drag produced can be neglected using this testing method without sacrificing results.
(a) (b)
Figure 11. Pitch moment of inertia testing of: (a) the flight-ready Avistar UAV fuselage and (b) the fuselage mount.
Figure 12. Pitch moment of inertia testing of the Avistar UAV left wing.
Figure 13. Area comparison of the Avistar UAV fuselage and the MDF flat plate.
10 of 16
American Institute of Aeronautics and Astronautics
B. Cirrus SR22T Baseline Testbed
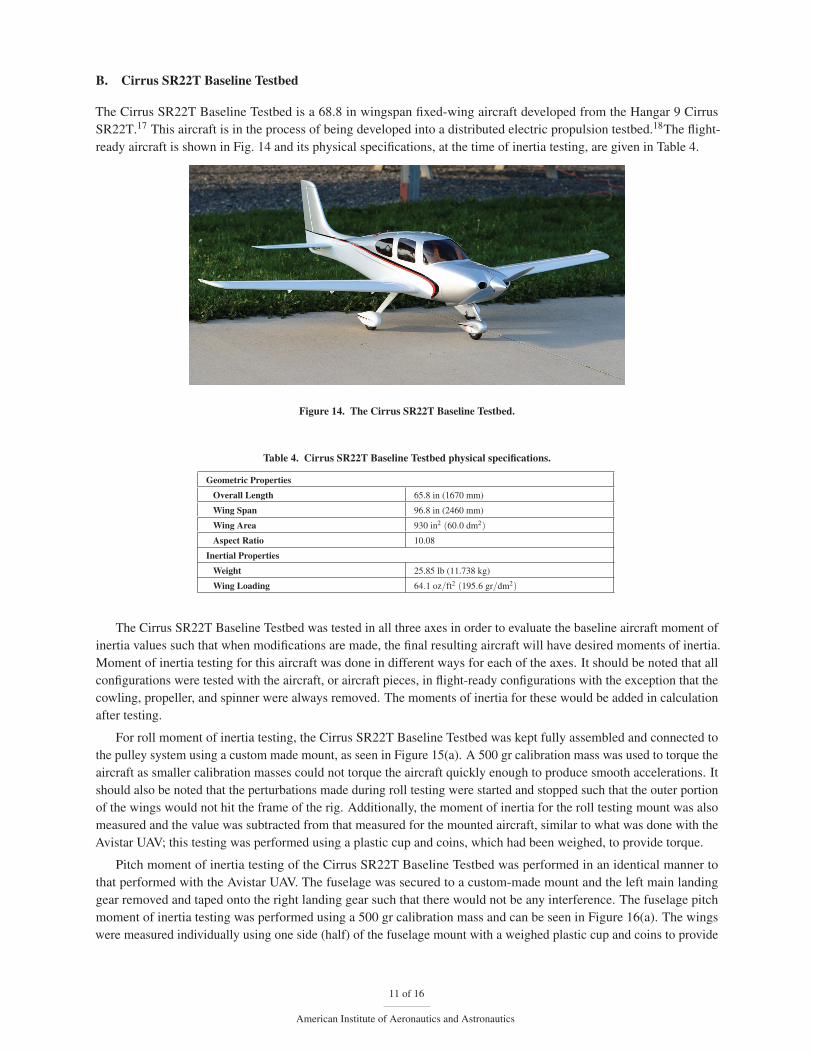
The Cirrus SR22T Baseline Testbed is a 68.8 in wingspan fixed-wing aircraft developed from the Hangar 9 Cirrus
SR22T.17 This aircraft is in the process of being developed into a distributed electric propulsion testbed.18The flight-
ready aircraft is shown in Fig. 14 and its physical specifications, at the time of inertia testing, are given in Table 4.
Figure 14. The Cirrus SR22T Baseline Testbed.
Table 4. Cirrus SR22T Baseline Testbed physical specifications.
Geometric Properties
Overall Length 65.8 in (1670 mm)
Wing Span 96.8 in (2460 mm)
Wing Area 930 in2 (60.0 dm2)
Aspect Ratio 10.08
Inertial Properties
Weight 25.85 lb (11.738 kg)
Wing Loading 64.1 oz/ft2 (195.6 gr/dm2)
The Cirrus SR22T Baseline Testbed was tested in all three axes in order to evaluate the baseline aircraft moment of
inertia values such that when modifications are made, the final resulting aircraft will have desired moments of inertia.
Moment of inertia testing for this aircraft was done in different ways for each of the axes. It should be noted that all
configurations were tested with the aircraft, or aircraft pieces, in flight-ready configurations with the exception that the
cowling, propeller, and spinner were always removed. The moments of inertia for these would be added in calculation
after testing.
For roll moment of inertia testing, the Cirrus SR22T Baseline Testbed was kept fully assembled and connected to
the pulley system using a custom made mount, as seen in Figure 15(a). A 500 gr calibration mass was used to torque the
aircraft as smaller calibration masses could not torque the aircraft quickly enough to produce smooth accelerations. It
should also be noted that the perturbations made during roll testing were started and stopped such that the outer portion
of the wings would not hit the frame of the rig. Additionally, the moment of inertia for the roll testing mount was also
measured and the value was subtracted from that measured for the mounted aircraft, similar to what was done with the
Avistar UAV; this testing was performed using a plastic cup and coins, which had been weighed, to provide torque.
Pitch moment of inertia testing of the Cirrus SR22T Baseline Testbed was performed in an identical manner to
that performed with the Avistar UAV. The fuselage was secured to a custom-made mount and the left main landing
gear removed and taped onto the right landing gear such that there would not be any interference. The fuselage pitch
moment of inertia testing was performed using a 500 gr calibration mass and can be seen in Figure 16(a). The wings
were measured individually using one side (half) of the fuselage mount with a weighed plastic cup and coins to provide
11 of 16
American Institute of Aeronautics and Astronautics

(a) (b)
Figure 15. Roll moment of inertia testing of: (a) the flight-ready Cirrus SR22T Baseline Testbed (less cowling, propeller, and spinner)and (b) the roll inertia mount.
torque, as seen in Figure 16(b). Finally, the fuselage pitch mount was also measured as can be seen in Figure 16(c). The
moment of inertia of the wing tube was estimated given its easily measurable length, diameter, thickness, and weight.
For yaw moment of inertia testing, the Cirrus SR22T Baseline Testbed was split into two pieces: the fuselage with
the empennage and the joined wingset. The fuselage and empennage were mounted using a custom-made mount, which
required the main landing gear to be disassembled and then reassembled. It should be noted that the left horizontal
stabilizer was disassembled and then taped on to the fuselage and vertical stabilizer, with care being taken to maintain
the correct longitudinal position on the aircraft, such that there would not be any interference with the rig. A testing
photo can be seen in Figure 17(a) and the mount can be seen in Figure 17(c). The wing panels and wing tube were
joined as they would be on the aircraft and mounted using a wide plastic bar for testing, as can be seen in Fig. 17(b)
and 17(d). For both the fuselage and empennage and the joined wingset, the mounts we measured seperately and their
moment of inertia values were removed from those measured for the mounted aircraft pieces.
The moments of inertia for roll and yaw of each of the components were added up using the parallel axis theorem,
following the description in Section II. The combined results for the roll, pitch, and yaw moments of inertia for the
Cirrus SR22T Baseline Testbed are summarized in Table B.
Similar to the previous testing, it should be noted that the Cirrus SR22T Baseline Testbed, specifically the fuselage
and empennage, are not expected no produce significantly more drag than the flat plate used in validation testing, as
seen in the area comparison Figure 18. Although the aircraft components have a bit more area than the flat plate because
the fuselage is highly curved, a similar effective flat plate area is expected. Therefore it is assumed that the minimal
drag produced can be neglected using this testing method without sacrificing results.
Table 5. Summary of the Moment of Inertia Results for the Cirrus SR22T Baseline Testbed
Mass [kg] Ixx[kg m2] Iyy[kg m2] Izz[kg m2]
11.738 0.8869 1.0353 1.2138
12 of 16
American Institute of Aeronautics and Astronautics

(a) (b)
(c)
Figure 16. Pitch moment of inertia testing of the flight-ready Cirrus SR22T Baseline Testbed: (a) fuselage (less cowling, propeller, andspinner) and empennage, (b) left wing, and (c) the pitch inertia mount.
13 of 16
American Institute of Aeronautics and Astronautics

(a)
(b)
(c) (d)
Figure 17. Yaw moment of inertia testing of the flight-ready Cirrus SR22T Baseline Testbed: (a) fuselage (less cowling, propeller, andspinner) and empennage, (b) wing-set, (c) the yaw inertia mount, and (d) the wing-set mounting.
14 of 16
American Institute of Aeronautics and Astronautics

Figure 18. Area comparison of the Cirrus SR22T Baseline Testbed fuselage and the MDF flat plate.
VI. Summary and Future Work
A torque-based moment of inertia testing rig intended for small to medium sized unmanned aircraft was designed,
built, validated, and used for testing. The design is made up of three functional elements: a 4 x 6 x 6 ft steel framework,
a rotation assembly, and a 100 Hz instrumentation system. The validation testing showed that the rig is able to measure
the moment of inertia of aircraft with very little error while being insensitive to drag. The moment of inertia testing rig
was then used to test two unmanned aircraft, the Avistar UAV and the Cirrus SR22T Baseline Testbed.
Further improvement, validation, and testing is planned for the torque-based moment of inertia testing rig. In terms
of rig improvement, it would be advantageous to replace the string, pulley, and calibration mass method of generating
torque with a calibrated motor; doing so would also allow the initial perturbation velocity to be automated. More
validation with test articles of various density and geometry is also of interest. Additionally, there is also interest to
better quantify the friction found in the system.
Acknowledgments
The material presented in this paper is based upon work supported by the National Science Foundation (NSF) under
grant number CNS-1646383. Any opinions, findings, and conclusions or recommendations expressed in this publication
are those of the authors and do not necessarily reflect the views of the NSF.
The authors would like to thank Al Volo LLC for their generous loan of data acquisition equipment.
The authors would like to acknowledge Ali El-Ashri, Mohammed Qadri, and Mirco Theile for their support during
the construction and initial testing.
The authors would also like to acknowledge Kyle Pieper, Aaron Perry, and the Aerodynamics and Unsteady Flows
Research Group for allowing us to test their Cirrus SR22T Baseline Testbed and fabricating the mounts; that work is
supported by a NASA STTR Phase I grant.
15 of 16
American Institute of Aeronautics and Astronautics

References
1Miller, M. P., “An Accurate Method of Measuring the Moments of Inertia of Airplanes,” Oct 1930.2Soule, H. and Miller, M. P., “The Experimental Determination of the Moments of Inertia of Airplanes,” Jan 1934.3Gracey, W., “The experimental determination of the moments of inertia of airplanes by a simplified compound -pendulum method,” Jun 1948.4Turner, H. L., “Measurement of the Moments of Inertia of an Airplane by a Simplified Method,” Oct 1950.5de Jong, R. C. and Mulder, J. A., “Accurate Estimation of Aircraft Inertia Characteristics from a Single Suspension Experiment,” Journal of
Aircraft, Vol. 24, No. 6, June 1987, pp. 362–370.6Jardin, M. and Mueller, E., “Optimized Measurements of UAV Mass Moment of Inertia with a Bifilar Pendulum,” AIAA Paper 2007-6822,
AIAA Guidance, Navigation, and Control Conference, Hilton Head, South Carolina, Aug. 2007.7Bowman, A., Barnes, G., and Keshmiri, S., “An Empirical Method for Estimating Moments of Inertia of Light Unmanned Air Vehicles,”
AIAA Paper 2012-2598, AIAA Infotech@Aerospace, Garden Grove, California, June 2012.8Mendes, A., van Kampen, E., Remes, B., and Chu, Q., “Determining moments of inertia of small UAVs: A comparative analysis of an
experimental method versus theoretical approaches,” AIAA Paper 2012-4463, AIAA Guidance, Navigation and Control Conference, Minneapolis,
Minnesota, Aug. 2012.9Lehmkuhler, K., Wong, K., and Verstraete, D., “Methods for accurate measurements of small fixed wing UAV inertial properties,” The
Aeronautical Journal, Vol. 120, No. 1233, 2016, pp. 1785–1811.10Dantsker, O. D., Ananda, G. K., and Selig, M. S., “GA-USTAR Phase 1: Development and Flight Testing of the Baseline Upset and Stall
Research Aircraft,” AIAA Paper 2017-4078, AIAA Applied Aerodynamics Conference, Denver, Colorado, June 2017.11Al Volo LLC, “Al Volo: Flight Data Acquisition Systems,” http://www.alvolo.us, Accessed Jun. 2017.12McCormick, W. B., Aerodynamics Aeronatics, and Flight Mechanics, John Wiley & Sis, Inc, 2nd ed., 1995.13Hobbico, Inc., “Great Planes Avistar Elite .46 Advanced Trainer RTF,” http://www.greatplanes.com/airplanes/gpma1605.html, Accessed Oct.
2017.14Mancuso, R., Dantsker, O. D., Caccamo, M., and Selig, M. S., “A Low-Power Architecture for High Frequency Sensor Acquisition in
Many-DOF UAVs,” Submitted to International Conference on Cyber-Physical Systems, Berlin, Germany, April 2014.15Dantsker, O. D., Mancuso, R., Selig, M. S., and Caccamo, M., “High-Frequency Sensor Data Acquisition System (SDAC) for Flight Control
and Aerodynamic Data Collection Research on Small to Mid-Sized UAVs,” AIAA Paper 2014-2565, AIAA Applied Aerodynamics Conference,
Atlanta, Georgia, June 2014.16Dantsker, O. D., Theile, M., and Caccamo, M., “A High-Fidelity, Low-Order Propulsion Power Model for Fixed-Wing Electric Unmanned
Aircraft,” AIAA/IEEE Electric Aircraft Technologies Symposium, Jul. 2018.17Horizon Hobby LLC., “Hangar-9 Cirrus SR22T 30cc ARF (HAN5020),” http://www.hangar-9.com/Products/Default.aspx?ProdID=HAN5020,
Accessed Oct. 2017.18Pieper, K., Perry, A., and Ansell, P., “Design and Development of a Dynamically Scaled Distributed Electric Propulsion Aircraft Testbed,”
AIAA/IEEE Electric Aircraft Technologies Symposium, Jul. 2018.
16 of 16
American Institute of Aeronautics and Astronautics