Embed Size (px)
Citation preview
ELSEVIER Electroencephalography and clinical Neurophysiology 98 (1996) 76-85
High-frequency cortical responses reflect lexical processing: an MEG study
Friedemann Pulvermiiller a, * Carsten Eulitz b Christo Pantev b Bettina Mohr a
Bernd Feige b, Werner Lutzenberger a, Thomas Elbert b, Niels Birbaumer a,c a Institut fiir Medizinische Psychologie und Verhaltensneurobiologie, Universitiit Tiibingen, Gartenstra fle 29, D- 72074 Tiibingen, Germany
b lnstitut flit Experimentelle Audiologie, Universitiit Miinster, Kardinal yon Galen-Ring 1 O, 48149 Miinster, Germany c Universith della Studi, Padova, Italy
Accepted for publication: 14 August 1995
Abstract
Meaningful words and matched pseudowords, such as m o o n vs. n o o m , are of equal perceptual complexity, but invoke different cognitive processes. To investigate high-frequency cortical responses to these stimuli, biomagnetic signals were recorded simultaneously over both hemispheres of right-handed individuals listening to words and pseudowords. Consistent with earlier EEG studies, evoked spectral responses recorded from the left hemisphere revealed depression of spectral power in the low gamma band (around 30 Hz) after pseudowords but not after words. Similar differences between stimulus categories were present in the beta range. These results indicate that distinct patterns of high-frequency cortical responses correspond to the different cognitive processes invoked by words and pseudowords. It is hypothesized that differential high-frequency cortical responses signal the activation or activation failure of distributed Hebbian cell assemblies representing words and other elements of cognitive processing.
Keywords: Cell assembly; Beta; Cognitive; Evoked spectral responses; Gamma; Language; Magnetoencephalography; 30 Hz
1. Introduction
Fast repetitive and coherent activity of large neuronal populations has recently become a focus of neurophysio- logical research. Single cell, multi-unit and field potential studies indicate that coherent periodic neural activity in the gamma band (20 Hz and up) plays a key role for under- standing information processing in the cortex and in other brain structures of higher vertebrates (Von der Malsburg, 1986; Eckhorn et al., 1988; Engel et al., 1992; Aertsen and Amdt, 1993; Singer, 1994). Even in man, differential gamma band activity has been demonstrated by electroen- cephalography (EEG) (Berger, 1929; Rougeul et al., 1979; Spydel et al., 1979; Madler and P/Sppel, 1987) and magne- toencephalography (MEG) (Galambos et al., 1981; Pantev et al., 1991, 1993; Kristeva-Feige et al., 1993; Llin~s and Ribary, 1993). While most researchers agree on the impor-
* Corresponding author. Tel.: xx 49-7071-29 4220; Fax: xx 49-7071-29 5956; E-mail: [email protected].
tance of high-frequency phenomena, opinions diverge re- garding their specific function. Gamma band activity has been considered an indicator of early processing of stimu- lus information (Galambos et al., 1981; Pantev et al., 1991, 1993), feature linking and formation of temporary assem- blies that represent perceived objects (Eckhorn et al., 1988; Gray et al., 1989; Engel et al., 1991a,b), focussing of attention (Spydel et al., 1979; Murthy and Fetz, 1992; Tiitinen et al., 1993), arousal and motivation (Kristeva- Feige et al., 1993), alertness (Rougeul et al., 1979) or cognition in general (Berger, 1929; Llinfis and Ribary, 1993).
Berger's early hypothesis that high-frequency oscilla- tions are an indicator of "mental processes" (Berger, 1929) has so far hardly been tested. Reduced gamma band responses observed in humans during anesthesia (Madler and P6ppel, 1987) or during delta sleep (Llin~s and Ribary, 1993) may be caused by a variety of variables (low arousal level, reduced cognitive activity, reduced general brain activity, etc.). Enhancement of cortical gamma band activity during preparation and/or execution of move-
0013-4694/96/$15.00 © 1996 Elsevier Science Ireland Ltd. All rights reserved SSDI 0 0 1 3 - 4 6 9 4 ( 9 5 ) 0 0 1 9 1 - 3 EEG 94706
F. PulvermVdler et al. / Electroencephalography and clinical Neurophysiology 98 (1996) 76-85 77
ments (Murthy and Fetz, 1992; Pfurtscheller and Neuper, 1992; Kristeva-Feige et al., 1993; Pfurtscheller et al., 1994) may be related either to cognitive processes (e.g., planning) or to the activaticm of motor programs. Investi- gations of responses to moving bars (Eckhorn et al., 1988; Gray and Singer, 1989; Gray et al., 1989; Eckhorn et al., 1990; Engel et al., 1990, 1991a,b; Kreiter and Singer, 1992; Eckhorn and Obermueller, 1993; Frien et al., 1994; Lutzenberger et al., 1995) or to clicks and tones (Galam- bos et al., 1981; Pantev et al., 1991, 1993) do not allow firm conclusions about the correspondence between neu- ronal rhythms and specific cognitive processes either. Such stimulus-elicited activity in the gamma band could result from the fact that excitation of afferent fibers leads to enhanced activity in the brain which is, as a consequence, regulated towards a target value. Such a regulation process must be assumed in order to explain why the cortical level of activity is maintained ew;n if sensory stimulation drasti- cally changes (Braitenberg, 1978; Braitenberg and Schiiz, 1991). Periodic high-frequency actix~ity could be a by- product of such a regulation process.
In a recent EEG study, Tiitinen et al. (1993) found stronger 40 Hz responses to attended tones compared to unattended ones. This suggests that gamma band responses can be indicators of selective attention. One may, however, ask whether even attended ,;timuli invoking distinct cogni- tive processes lead to different patterns of gamma band activity. The process of selective attention can be related to a thalamo-cortical gating process not specific to particular stimuli (Scheibel, 1981; Ia)pes da Silva, 1991). It could well be that the activation of the cortical network underly- ing the cognitive processing of an attended stimulus leads to additional specific changes in high-frequency responses. In this case, attended stimuli that invoke different cogni- tive processes should induce different patterns of high- frequency cortical responses.
A strict proof of the significance of high-frequency activity for cognitive processing can, therefore, be pro- vided if complex stimuli are chosen that induce certain higher cognitive processes. Possibly, complex stimuli will lead to response patterns which are absent when a simple stimulus is being perceived. This response pattern can then be taken as a correlate of cognitive processes invoked by the complex, but not by the simple stimulus. However, simple stimuli, such as bars or tones, and complex stimuli, such as images or words, do not only differ with regard to the cognitive processes they invoke, they also differ in their physical complexity. In order to avoid such confound- ing factors, stimuli of equal perceptual complexity must be chosen that nevertheless llead to distinct psychological processes. Two groups of stimuli that satisfy this criterion are meaningful words and meaningless but pronounceable phoneme combinations, that is pseudowords such as noom, thyll, or rasp. While matched pseudowords and words include the same letters or phonemes and have, therefore, equal visual and acoustic complexity, they clearly lead to
different cognitive processes. A word will be matched to a brain internal representation, while this process of lexical access cannot take place after pseudoword presentation (Coltheart, 1978; Marslen-Wilson and Welsh, 1978).
In an EEG study of spectral responses evoked by visually presented German words and pseudowords, Lutzenberger et al. (1994) found differences between gamma band responses around 30 Hz. In 15 subjects, gamma band power recorded from the left language-domi- nant hemisphere was consistently reduced after pseu- doword presentation. This result contrasts to the well- known fact that pseudowords elicit larger conventionally averaged evoked potentials (N400) compared to words (Holcomb and Neville, 1990; Pulvermiiller et al., 1995a). Thus, while causing stronger evoked potentials, pseu- dowords led to reduced power in the gamma band. The power reduction has tentatively been explained by the following hypothesis: depression of gamma band activity reflects a sudden breakdown of cognitive processing in- duced by an uncommon stimulus for which no cortical representation is available.
The purpose of this study was to confirm the results reported by Lutzenberger et at. (1994). If reduction of gamma band activity after pseudowords reflects a failure of lexical access or another aspect of word processing it should take place regardless of the stimulus modality and regardless of the task the experimental subjects are en- gaged in. It should also occur regardless of the language the stimuli are taken from. Lutzenberger et al. used Ger- man words and pseudowords visually presented to native speakers of German who made lexical decisions on these stimuli. In the present study, English words and pseu- dowords were presented acoustically to English native speakers who had to memorize them. Furthermore, a reli- able difference in spectral responses should be visible using different recording techniques. While Lutzenberger et al. used EEG recordings, this study reports on spectral responses recorded with a biomagnetometer. The MEG has the additional advantage that reference-free data can be obtained without using highly complex evaluation proce- dures, such as current source density analysis. Thus, it appears worthwhile to investigate evoked spectral MEG responses recorded from both hemispheres while subjects hear and memorize English words and pseudowords.
2. Methods
2.1. Subjects
Five right-handed monolingual native speakers of En- glish volunteered for the experiment. Handedness was accessed using the Edinburgh Handedness Inventory (Old- field, 1971). None of the subjects had left-handed family members. Their ages ranged between 26 and 38 years (mean = 31). None of the subjects had a history of neuro- logical illness or drug abuse.
78 F. Pulvermiiller et al. / Electroencephalography and clinical Neurophysiology 98 (1996) 76-85
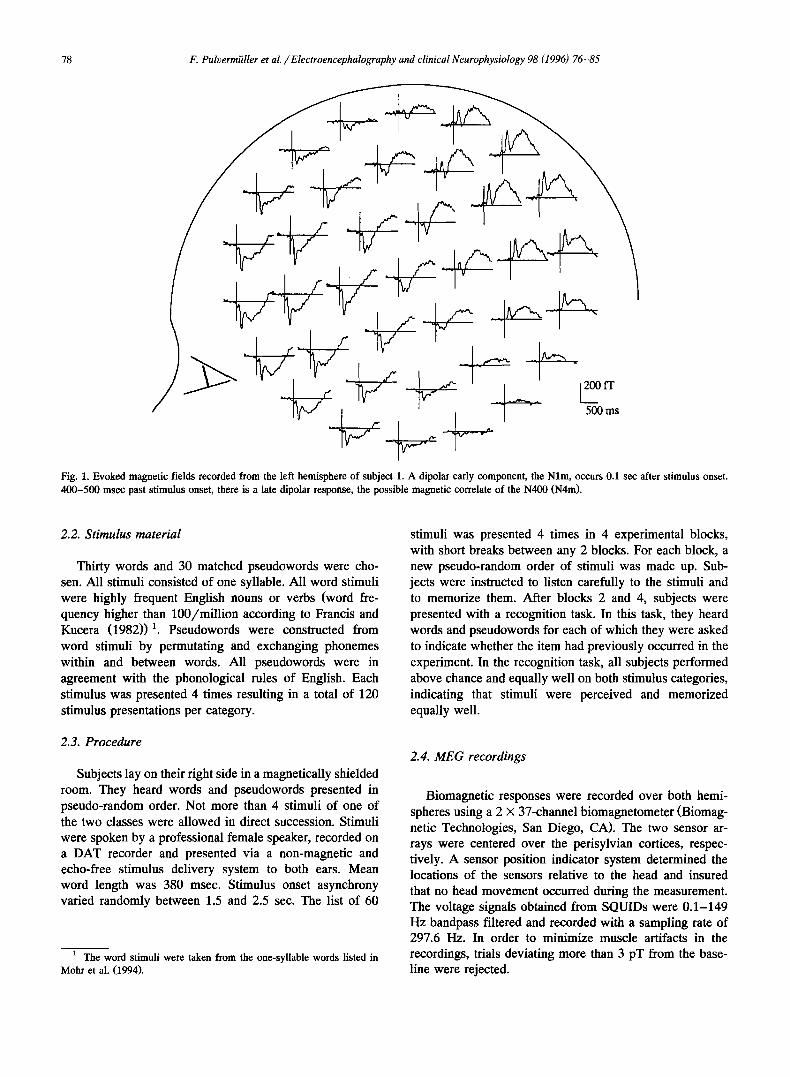
Fig. 1. Evoked magnetic fields recorded from the left hemisphere of subject 1. A dipolar early component, the Nlm, occurs 0.1 sec after stimulus onset. 400-500 msec past stimulus onset, there is a late dipolar response, the possible magnetic correlate of the N400 (N4m).
2.2. Stimulus material
Thirty words and 30 matched pseudowords were cho- sen. All stimuli consisted of one syllable. All word stimuli were highly frequent English nouns or verbs (word fre- quency higher than 100/million according to Francis and Kucera (1982))1. Pseudowords were constructed from word stimuli by permutating and exchanging phonemes within and between words. All pseudowords were in agreement with the phonological rules of English. Each stimulus was presented 4 times resulting in a total of 120 stimulus presentations per category.
2.3. Procedure
Subjects lay on their right side in a magnetically shielded room. They heard words and pseudowords presented in pseudo-random order. Not more than 4 stimuli of one of the two classes were allowed in direct succession. Stimuli were spoken by a professional female speaker, recorded on a DAT recorder and presented via a non-magnetic and echo-free stimulus delivery system to both ears. Mean word length was 380 msec. Stimulus onset asynchrony varied randomly between 1.5 and 2.5 sec. The list of 60
1 The word stimuli were taken from the one-syllable words listed in Mohr et al. (1994).
stimuli was presented 4 times in 4 experimental blocks, with short breaks between any 2 blocks. For each block, a new pseudo-random order of stimuli was made up. Sub- jects were instructed to listen carefully to the stimuli and to memorize them. After blocks 2 and 4, subjects were presented with a recognition task. In this task, they heard words and pseudowords for each of which they were asked to indicate whether the item had previously occurred in the experiment. In the recognition task, all subjects performed above chance and equally well on both stimulus categories, indicating that stimuli were perceived and memorized equally well.
2.4. M E G recordings
Biomagnetic responses were recorded over both hemi- spheres using a 2 X 37-channel biomagnetometer (Biomag- netic Technologies, San Diego, CA). The two sensor ar- rays were centered over the perisylvian cortices, respec- tively. A sensor position indicator system determined the locations of the sensors relative to the head and insured that no head movement occurred during the measurement. The voltage signals obtained from SQUIDs were 0.1-149 Hz bandpass filtered and recorded with a sampling rate of 297.6 Hz. In order to minimize muscle artifacts in the recordings, trials deviating more than 3 pT from the base- line were rejected.
2.5. Calculation of evoked spectral responses for the respective frequency band (baseline - 0 . 6 sec to stimulus onset). Preliminary comparisons of absolute base- line values between conditions failed to reveal any differ- ences. Therefore, it appeared justified to use normalized values instead of absolute values for further evaluation. Note that absolute spectral power of the MEG signal is relatively small for high-frequency bands (Pantev et al., 1991). Normalized data make it easier to compare power changes across frequencies and individuals.
In order to obtain information about the temporal dy- namics of activity in various frequency bands, spectral power values were calculated for time frequency windows. All time intervals were 0.3 sec (more exactly 310 msec) wide, the first interval starting 0.6 sec before stimulus onset and the last terminating 1.2 sec past stimulus onset. Two adjacent time interval~,~ overlapped by 0.2 sec (first interval -0 .6 to -0 .3 sec, second interval -0 .5 to -0 .2 sec, etc.). Power spectra were calculated for each of the following frequency bands: 0.1-4.7 Hz, 4.7-14.0 Hz, 14.0-23.3 Hz, 23.3-32.6 I-Iz, 32.6-41.9 Hz, 41.9-51.2 Hz (bands I-VI). So for each individual trial, one power value was calculated for each of 96 time frequency windows, respectively. For each individual, recording channel and condition, power values were averaged over trials (120 trials (minus artifact trials) per average). Note that this procedure makes it possible to calculate spectral power which is not phase-locked to the stimulus (Makeig, 1993; Makeig and Inlow, 1993). After traditional averaging, non-phase-locked activity would be cancelled. For further evaluation, these averaged spectral power values were normalized, that is, divided by the baseline power value
2.6. Statistical evaluation
left hemisphere
For each individual, data from 3 channels entered the analysis. These critical channels satisfied the following criteria: (1) they were located at anterior sites, and (2) the intensity of the late evoked magnetic field (what is called "N4m," see Fig. 1) was larger than at all other channels (largest signal-to-noise ratios). Evoked magnetic fields were calculated for each individual separately. Maximal amplitudes of evoked magnetic fields at the critical chan- nels in the time interval between 300 and 600 msec after stimulus onset were compared between subjects and hemi- spheres. Analyses of variance were used for statistical
right hemisphere
120
100
80
120
words 8O
pseudo- words
......... ' . . . . . . . . . . . . . ::: ......... ~ ........ f 4oo 20 ~ . . . . . . . "..~....- ...... ' . ....: J " 200
~o~o ~ 0 4 o . . . . . . . . . ::...~ '.,...~::::::. o
spectral (%)
power , ~
~o ~ o time (ms)
frequency (Hz)
I(X)O
F. Pu,!vermiiller et al. / E lectroencephalography and clinical Neurophysiology 98 (1996) 76-85 79
120
I00
8O
1000
data from subject # 01
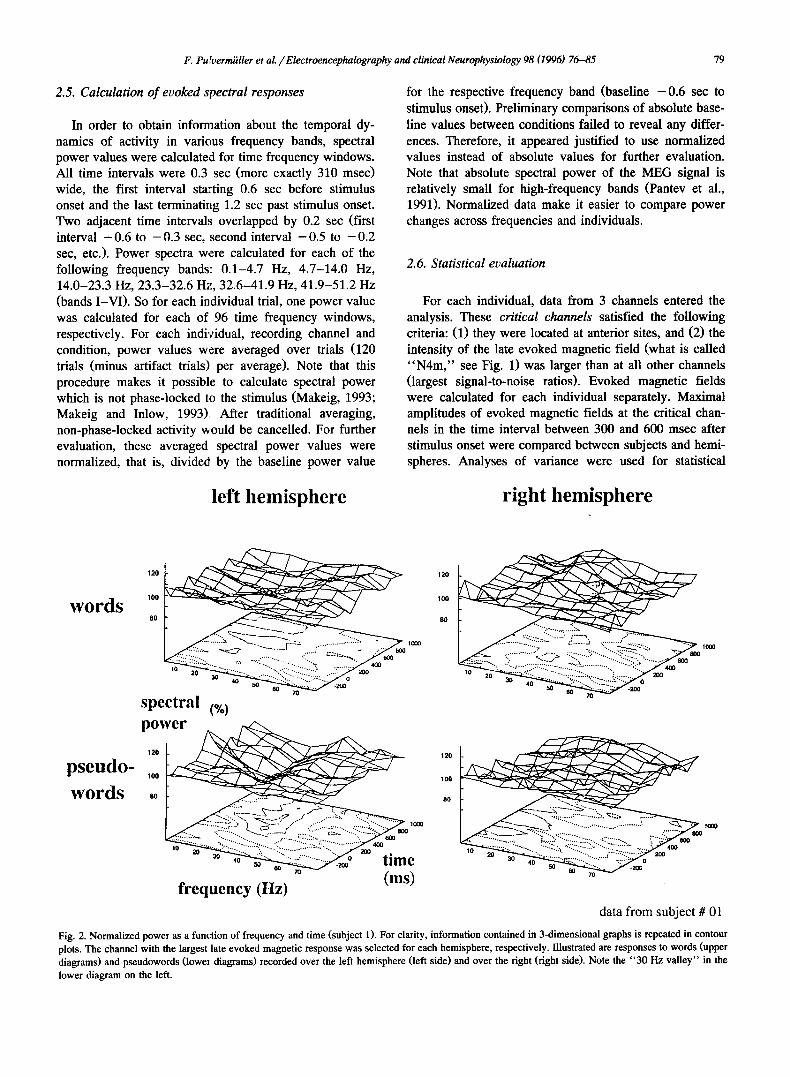
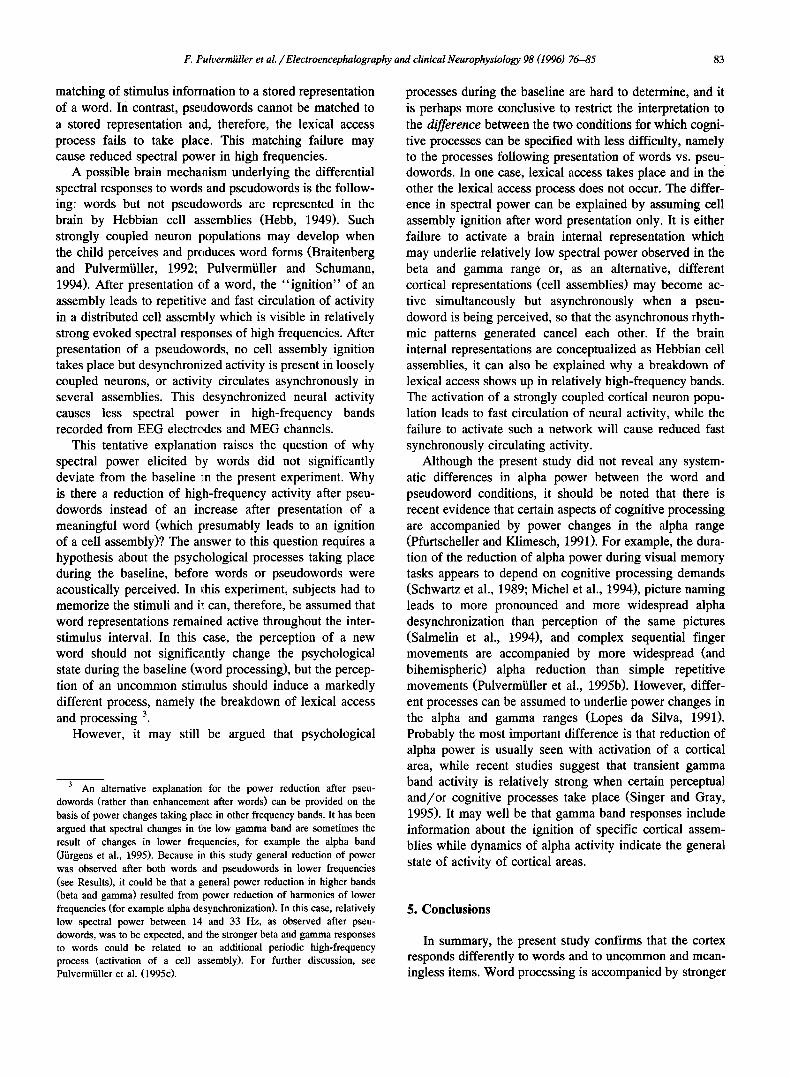
Fig. 2. Normalized power as a function of frequency and time (subject 1). For clarity, information contained in 3-dimensional graphs is repeated in contour plots. The channel with the largest late evoked magnetic response was selected for each hemisphere, respectively. Illustrated are responses to words (upper diagrams) and pseudowords (lowei diagrams) recorded over the left hemisphere (left side) and over the right (right side). Note the "30 Hz valley" in the lower diagram on the left.
80 F. Pulvermiiller et al. / Electroencephalography and clinical Neurophysiology 98 (1996) 76-85
analysis (design: Channels (3 levels) X Hemisphere (2 lev- els) X Wordness (2 levels) × Frequency (6 levels) for anal- ysis of spectral responses, and Channels (3 levels)X Hemisphere (2 levels)× Wordness (2 levels) for analysis of evoked fields). Greenhouse-Geisser correction was ap- plied to correct for degrees of freedom when appropriate (GG values), t tests were used for planned comparisons. Bonferroni correction for multiple t tests was used throughout.
3. Results
Averaged evoked magnetic fields recorded from one hemisphere of one of the individuals are shown in Fig. 1. Two dipolar components can be distinguished, an early component peaking around 100 msec after stimulus onset (Nlm) and a late evoked field which may be considered the biomagnetic equivalent of the evoked potential called the N400. We call this second wave the N4m. Recall that the 3 anterior channels with the largest amplitudes were used for analysis of spectral responses (critical channels). At the critical channels over the left hemisphere, maxima of this late biomagnetic component (N4m) evoked by pseudowords tended to be stronger compared to the N4m
evoked by words (means (S.D.s): 170 iT (28.4 IT) vs. 203 IT (21.9 IT)). Over the right, a similar tendency was less apparent (136 fl" (25.9 IT) vs. 150 IT (21.2 IT)). However, there were no statistically significant differences of evoked fields between words and pseudowords or between the hemispheres, and the interaction of the factors Wordness and Hemisphere was also not significant (F (1, 4 )= 1.5, P > 0.2).
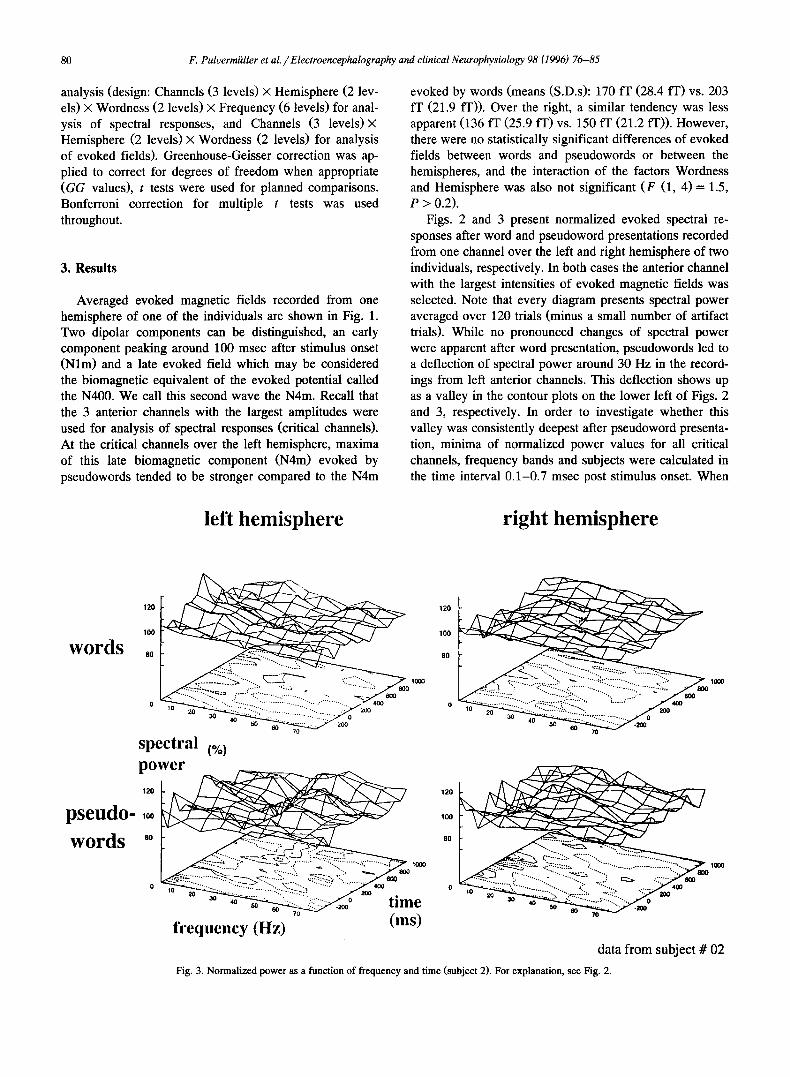
Figs. 2 and 3 present normalized evoked spectral re- sponses after word and pseudoword presentations recorded from one channel over the left and right hemisphere of two individuals, respectively. In both cases the anterior channel with the largest intensities of evoked magnetic fields was selected. Note that every diagram presents spectral power averaged over 120 trials (minus a small number of artifact trials). While no pronounced changes of spectral power were apparent after word presentation, pseudowords led to a deflection of spectral power around 30 Hz in the record- ings from left anterior channels. This deflection shows up as a valley in the contour plots on the lower left of Figs. 2 and 3, respectively. In order to investigate whether this valley was consistently deepest after pseudoword presenta- tion, minima of normalized power values for all critical channels, frequency bands and subjects were calculated in the time interval 0.1-0.7 msec post stimulus onset. When
left hemisphere right hemisphere
120
i00
words ,o
120
pseudo- ,Go
words . o
riO0 800 lOG°
0 I0 20 " " . . . . . . . . . . . . .g~ 4 0 0
spectral (%)
power
ti'equency (ltz) (ms)
120
100
80
120
100
BO
~ 0 0 800 1000
10 ~'"" "-:'- ... . 200 400
data from subject # 02
Fig. 3. Normalized power as a function of frequency and time (subject 2). For explanation, see Fig. 2.
F. P~llvermiiller et al. / Electroencephalography and clinical Neurophysiology 98 (1996) 76-85 81
m
S1 $4
\ \ \
,-...-.~
$2 $3
o 0.95-
0.9-
0.85-
0.8-
N ~ 0.75 O Z 0.7
I
i
$5
[~[ cont. word-left [ ] pseudo word-left [ ] cont. word-right [ ] pseudo word-right
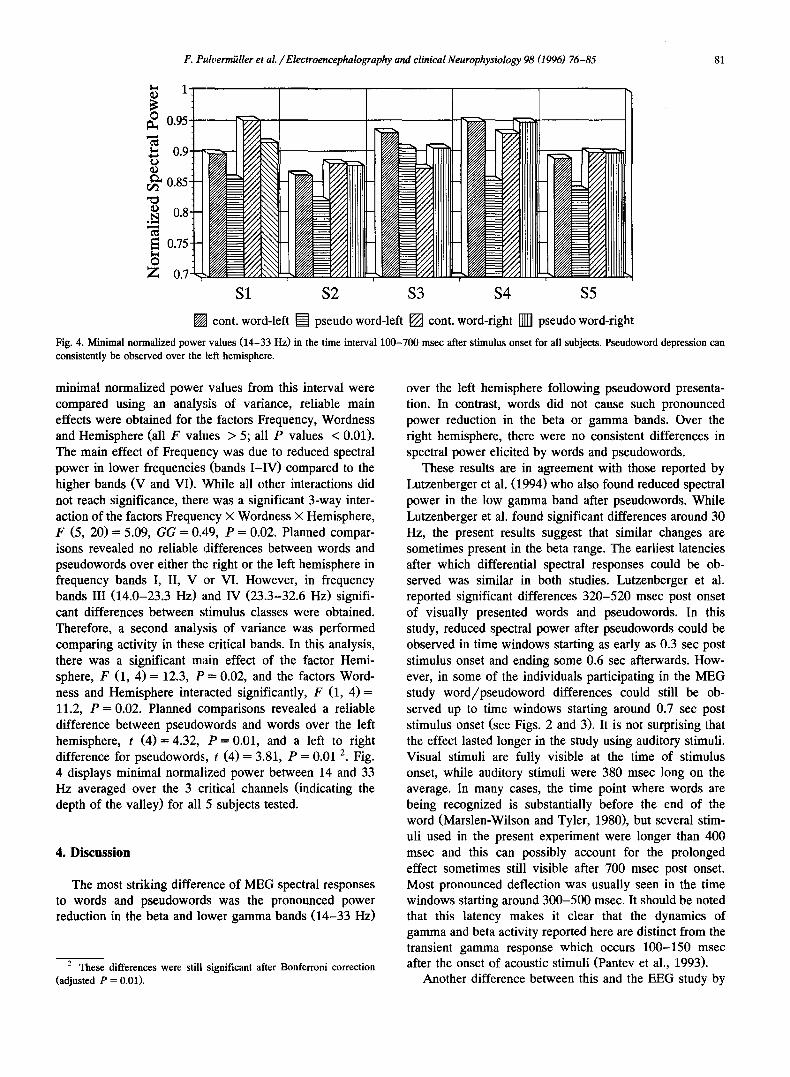
Fig. 4. Minimal normalized power values (14-33 Hz) in the time interval 100-700 msec after stimulus onset for all subjects. Pseudoword depression can consistently be observed over the left hemisphere.
minimal normalized power values from this interval were compared using an analysis of variance, reliable main effects were obtained for the factors Frequency, Wordness and Hemisphere (all F values > 5; all P values < 0.01). The main effect of Frequency was due to reduced spectral power in lower frequencies (bands I-IV) compared to the higher bands (V and VI). While all other interactions did not reach significance, there was a significant 3-way inter- action of the factors Frequency x Wordness x Hemisphere, F (5, 20) = 5.09, G G = 0.49, P = 0.02. Planned compar- isons revealed no reliable differences between words and pseudowords over either the right or the left hemisphere in frequency bands I, II, V or VI. However, in frequency bands III (14.0-23.3 Hz) and IV (23.3-32.6 Hz) signifi- cant differences between stimulus classes were obtained. Therefore, a second analysis of variance was performed comparing activity in these critical bands. In this analysis, there was a significant main effect of the factor Hemi- sphere, F (1, 4) = 12.3, P = 0.02, and the factors Word- ness and Hemisphere interacted significantly, F (1, 4 ) = 11.2, P = 0.02. Planned comparisons revealed a reliable difference between pseudowords and words over the left hemisphere, t ( 4 ) = 4.32, P = 0.01, and a left to right difference for pseudowords, t (4) = 3.81, P --- 0.01 2. Fig. 4 displays minimal normalized power between 14 and 33 Hz averaged over the 3 critical channels (indicating the depth of the valley) for all 5 subjects tested.
4. D i s c u s s i o n
The most striking difference of MEG spectral responses to words and pseudowords was the pronounced power reduction in the beta and lower gamma bands (14-33 Hz)
2 These differences were still significant after Bonferroni correction (adjusted P = 0.01).
over the left hemisphere following pseudoword presenta- tion. In contrast, words did not cause such pronounced power reduction in the beta or gamma bands. Over the right hemisphere, there were no consistent differences in spectral power elicited by words and pseudowords.
These results are in agreement with those reported by Lutzenberger et al. (1994) who also found reduced spectral power in the low gamma band after pseudowords. While Lutzenberger et al. found significant differences around 30 Hz, the present results suggest that similar changes are sometimes present in the beta range. The earliest latencies after which differential spectral responses could be ob- served was similar in both studies. Lutzenberger et al. reported significant differences 320-520 msec post onset of visually presented words and pseudowords. In this study, reduced spectral power after pseudowords could be observed in time windows starting as early as 0.3 sec post stimulus onset and ending some 0.6 sec afterwards. How- ever, in some of the individuals participating in the MEG study word/pseudoword differences could still be ob- served up to time windows starting around 0.7 sec post stimulus onset (see Figs. 2 and 3). It is not surprising that the effect lasted longer in the study using auditory stimuli. Visual stimuli are fully visible at the time of stimulus onset, while auditory stimuli were 380 msec long on the average. In many cases, the time point where words are being recognized is substantially before the end of the word (Marslen-Wilson and Tyler, 1980), but several stim- uli used in the present experiment were longer than 400 msec and this can possibly account for the prolonged effect sometimes still visible after 700 msec post onset. Most pronounced deflection was usually seen in the time windows starting around 300-500 msec. It should be noted that this latency makes it clear that the dynamics of gamma and beta activity reported here are distinct from the transient gamma response which occurs 100-150 msec after the onset of acoustic stimuli (Pantev et al., 1993).
Another difference between this and the EEG study by
82 F. Pulvermi~ller et al. / Electroencephalography and clinical Neurophysiology 98 (1996) 76-85
1 0 0 -
O
.~ ~ 9 0 -
~ ' ~
~ - "2
F----] words
l l pseudowords
II
80 left hemisphere right hemisphere
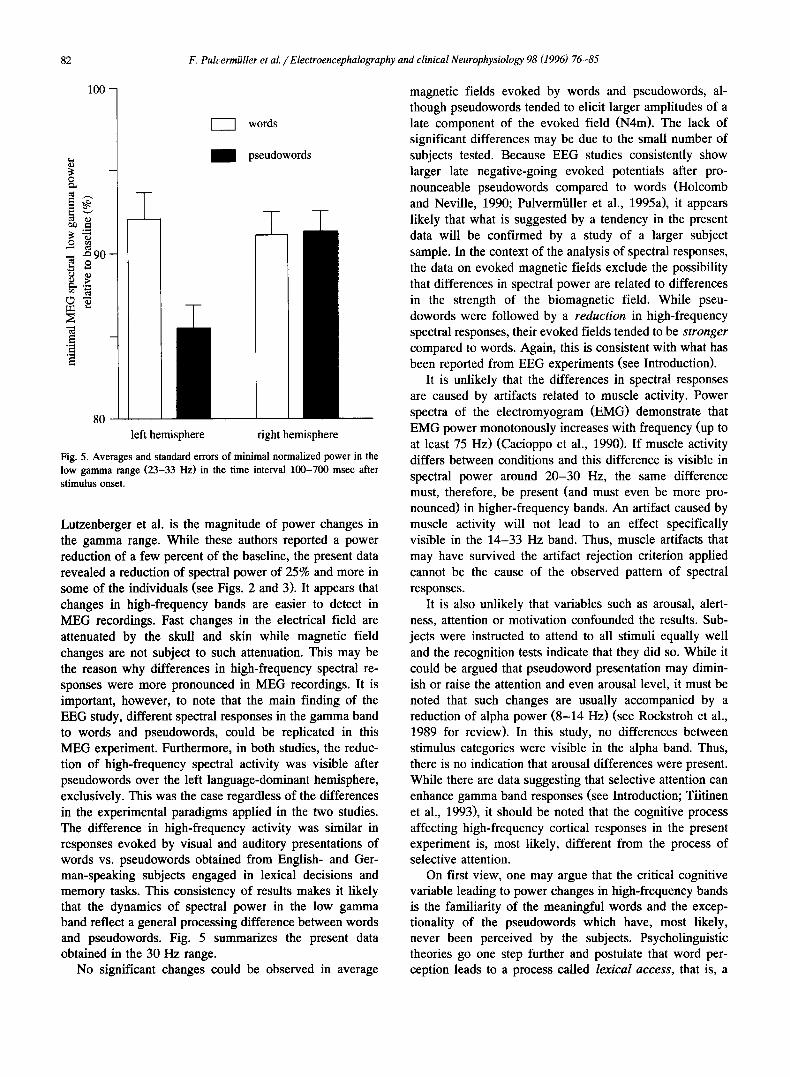
Fig. 5. Averages and standard errors of minimal normalized power in the low gamma range (23-33 Hz) in the time interval 100-700 msec after stimulus onset.
Lutzenberger et al. is the magnitude of power changes in the gamma range. While these authors reported a power reduction of a few percent of the baseline, the present data revealed a reduction of spectral power of 25% and more in some of the individuals (see Figs. 2 and 3). It appears that changes in high-frequency bands are easier to detect in MEG recordings. Fast changes in the electrical field are attenuated by the skull and skin while magnetic field changes are not subject to such attenuation. This may be the reason why differences in high-frequency spectral re- sponses were more pronounced in MEG recordings. It is important, however, to note that the main finding of the EEG study, different spectral responses in the gamma band to words and pseudowords, could be replicated in this MEG experiment. Furthermore, in both studies, the reduc- tion of high-frequency spectral activity was visible after pseudowords over the left language-dominant hemisphere, exclusively. This was the case regardless of the differences in the experimental paradigms applied in the two studies. The difference in high-frequency activity was similar in responses evoked by visual and auditory presentations of words vs. pseudowords obtained from English- and Ger- man-speaking subjects engaged in lexical decisions and memory tasks. This consistency of results makes it likely that the dynamics of spectral power in the low gamma band reflect a general processing difference between words and pseudowords. Fig. 5 summarizes the present data obtained in the 30 Hz range.
No significant changes could be observed in average
magnetic fields evoked by words and pseudowords, al- though pseudowords tended to elicit larger amplitudes of a late component of the evoked field (N4m). The lack of significant differences may be due to the small number of subjects tested. Because EEG studies consistently show larger late negative-going evoked potentials after pro- nounceable pseudowords compared to words (Holcomb and Neville, 1990; Pulvermiiller et al., 1995a), it appears likely that what is suggested by a tendency in the present data will be confirmed by a study of a larger subject sample. In the context of the analysis of spectral responses, the data on evoked magnetic fields exclude the possibility that differences in spectral power are related to differences in the strength of the biomagnetic field. While pseu- dowords were followed by a reduction in high-frequency spectral responses, their evoked fields tended to be stronger
compared to words. Again, this is consistent with what has been reported from EEG experiments (see Introduction).
It is unlikely that the differences in spectral responses are caused by artifacts related to muscle activity. Power spectra of the electromyogram (EMG) demonstrate that EMG power monotonously increases with frequency (up to at least 75 Hz) (Cacioppo et al., 1990). If muscle activity differs between conditions and this difference is visible in spectral power around 20-30 Hz, the same difference must, therefore, be present (and must even be more pro- nounced) in higher-frequency bands. An artifact caused by muscle activity will not lead to an effect specifically visible in the 14-33 Hz band. Thus, muscle artifacts that may have survived the artifact rejection criterion applied cannot be the cause of the observed pattern of spectral responses.
It is also unlikely that variables such as arousal, alert- ness, attention or motivation confounded the results. Sub- jects were instructed to attend to all stimuli equally well and the recognition tests indicate that they did so. While it could be argued that pseudoword presentation may dimin- ish or raise the attention and even arousal level, it must be noted that such changes are usually accompanied by a reduction of alpha power (8-14 Hz) (see Rockstroh et al., 1989 for review). In this study, no differences between stimulus categories were visible in the alpha band. Thus, there is no indication that arousal differences were present. While there are data suggesting that selective attention can enhance gamma band responses (see Introduction; Tiitinen et al., 1993), it should be noted that the cognitive process affecting high-frequency cortical responses in the present experiment is, most likely, different from the process of selective attention.
On first view, one may argue that the critical cognitive variable leading to power changes in high-frequency bands is the familiarity of the meaningful words and the excep- tionality of the pseudowords which have, most likely, never been perceived by the subjects. Psycholinguistic theories go one step further and postulate that word per- ception leads to a process called lexical access, that is, a
F. Pulvermiiller et al. / Electroencephalography and clinical Neurophysiology 98 (1996) 76-85 83
matching of stimulus information to a stored representation of a word. In contrast, pseudowords cannot be matched to a stored representation and, therefore, the lexical access process fails to take place. This matching failure may cause reduced spectral power in high frequencies.
A possible brain mechanism underlying the differential spectral responses to words and pseudowords is the follow- ing: words but not pseudowords are represented in the brain by Hebbian cell a,;semblies (Hebb, 1949). Such strongly coupled neuron populations may develop when the child perceives and produces word forms (Braitenberg and Pulvermiiller, 1992; Pulvermiiller and Schumann, 1994). After presentation of a word, the "ignit ion" of an assembly leads to repetitive and fast circulation of activity in a distributed cell assembly which is visible in relatively strong evoked spectral responses of high frequencies. After presentation of a pseudowords, no cell assembly ignition takes place but desynchronized activity is present in loosely coupled neurons, or activity circulates asynchronously in several assemblies. This desynchronized neural activity causes less spectral power in high-frequency bands recorded from EEG electrodes and MEG channels.
This tentative explanation raises the question of why spectral power elicited by words did not significantly deviate from the baseline in the present experiment. Why is there a reduction of high-frequency activity after pseu- dowords instead of an increase after presentation of a meaningful word (which presumably leads to an ignition of a cell assembly)? The answer to this question requires a hypothesis about the psychological processes taking place during the baseline, before words or pseudowords were acoustically perceived. In this experiment, subjects had to memorize the stimuli and it can, therefore, be assumed that word representations remained active throughout the inter- stimulus interval. In this case, the perception of a new word should not significantly change the psychological state during the baseline (word processing), but the percep- tion of an uncommon stimulus should induce a markedly different process, namely the breakdown of lexical access and processing 3.
However, it may still be argued that psychological
3 An alternative explanation for the power reduction after pseu- dowords (rather than enhancement after words) can be provided on the basis of power changes taking place in other frequency bands. It has been argued that spectral changes in the low gamma band are sometimes the result of changes in lower frequencies, for example the alpha band (Jiirgens et al., 1995). Because ill this study general reduction of power was observed after both words and pseudowords in lower frequencies (see Results), it could be that a general power reduction in higher bands (beta and gamma) resulted from power reduction of harmonics of lower frequencies (for example alpha desynchronization). In this case, relatively low spectral power between 14 and 33 Hz, as observed after pseu- dowords, was to be expected, and the stronger beta and gamma responses to words could be related to an additional periodic high-frequency process (activation of a cell assembly). For further discussion, see Pulvermiiller et al. (1995c).
processes during the baseline are hard to determine, and it is perhaps more conclusive to restrict the interpretation to the difference between the two conditions for which cogni- tive processes can be specified with less difficulty, namely to the processes following presentation of words vs. pseu- dowords. In one case, lexical access takes place and in the other the lexical access process does not occur. The differ- ence in spectral power can be explained by assuming cell assembly ignition after word presentation only. It is either failure to activate a brain internal representation which may underlie relatively low spectral power observed in the beta and gamma range or, as an alternative, different cortical representations (cell assemblies) may become ac- tive simultaneously but asynchronously when a pseu- doword is being perceived, so that the asynchronous rhyth- mic patterns generated cancel each other. If the brain internal representations are conceptualized as Hebbian cell assemblies, it can also be explained why a breakdown of lexical access shows up in relatively high-frequency bands. The activation of a strongly coupled cortical neuron popu- lation leads to fast circulation of neural activity, while the failure to activate such a network will cause reduced fast synchronously circulating activity.
Although the present study did not reveal any system- atic differences in alpha power between the word and pseudoword conditions, it should be noted that there is recent evidence that certain aspects of cognitive processing are accompanied by power changes in the alpha range (Pfurtscheller and Klimesch, 1991). For example, the dura- tion of the reduction of alpha power during visual memory tasks appears to depend on cognitive processing demands (Schwartz et al., 1989; Michel et al., 1994), picture naming leads to more pronounced and more widespread alpha desynchronization than perception of the same pictures (Salmelin et al., 1994), and complex sequential finger movements are accompanied by more widespread (and bihemispheric) alpha reduction than simple repetitive movements (Pulvermiiller et al., 1995b). However, differ- ent processes can be assumed to underlie power changes in the alpha and gamma ranges (Lopes da Silva, 1991). Probably the most important difference is that reduction of alpha power is usually seen with activation of a cortical area, while recent studies suggest that transient gamma band activity is relatively strong when certain perceptual and/or cognitive processes take place (Singer and Gray, 1995). It may well be that gamma band responses include information about the ignition of specific cortical assem- blies while dynamics of alpha activity indicate the general state of activity of cortical areas.
5. Conclusions
In summary, the present study confirms that the cortex responds differently to words and to uncommon and mean- ingless items. Word processing is accompanied by stronger
84 17. Pulvermiiller et al. / Electroencephalography and clinical Neurophysiology 98 (1996) 76-85
high-frequency MEG activity compared to the perception of pseudowords. The breakdown of beta and low gamma band power after pseudoword presentation possibly indi- cates a failure of lexical access processes. The different spectral responses are consistent with the view that igni- tion of large cell assemblies takes place after word pre- sentation, but not after pseudoword presentation. These results indicate that gamma band responses have psycho- logical "meaning"; they can be an indicator of specific cognitive processes, such as successful vs. unsuccessful lexical access.
Acknowledgements
This research was supported by a Helmholtz Fellowship for Neurobiological Research from the Bundesministerium fiir Forschung und Technologie, Germany, and by grants from the Deutsche Forschungsgemeinschaft (Pu 97/2, Pu 97/5).
References
Aertsen, A. and Arndt, M. Response synchronization in the visual cortex. Corr. Opin. Neurobiol., 1993, 3: 586-594.
Berger, H. Uber das Elektroenzephalogramm des Menschen: 1. Mit- teilung. Arch. Psychiatr. Nervenkr., 1929, 87: 527-528.
Braitenberg, V. Cell assemblies in the cerebral cortex. In: R. Heim and G. Palm (Eds.), Theoretical Approaches to Complex Systems. Lecture Notes in Biomathematics, Vol. 21. Springer, Berlin, 1978: 171-188.
Braitenberg, V. and Pulvermiiller, F. Eutwurf einer neurologischen Theo- rie der Sprache. Naturwissenschaften, 1992, 79: 103-117.
Braitenberg, V. and Schiiz, A. Anatomy of the Cortex. Statistics and Geometry. Springer, Berlin, 1991.
Cacioppo, J.T., Tassinary, L.G. and Fridlund, A.J. The skeletomotor system. In: J.T. Cacioppo and L.G. Tassinary (Eds.), Principles of Psychophysiology. Physical, Social, and Inferential Elements. Cam- bridge University Press, Cambrigde, 1990: 325-384.
Coltheart, M. Lexical access in simple reading tasks. In: G. Underwood (Ed.), Strategies of Information Processing. Academic Press, New York, 1978.
Eckhorn, R. and Obermueller, A. Single neurons are differently involved in stimulus-specific oscillations in cat visual cortex. Exp. Brain Res., 1993, 95: 177-182.
Eckhorn, R., Bauer, R., Jordan, W., Brosch, M., Kruse, W., Munk, M. and Reitboeck, H.J. Coherent oscillations: a mechanism of feature linking in the visual cortex? Multiple electrode and correlation analy- sis in the cat. Biol. Cybern., 1988, 60: 121-130.
Eckhorn, R., Reitboeck, H.J., Arndt, M. and Dicke, P. Feature linking via synchronization among distributed assemblies: simulations of results from cat visual cortex. Neural Comput., 1990, 2: 293-307.
Engel, A.K., K~inig, P., Gray, C.M. and Singer, W. Stimulus-dependent neuronal oscillations in cat visual cortex: inter-columnar interaction as determined by cross-correlation analysis. Eur. J. Neurosci., 1990, 2: 588-606.
Engel, A.K., K6nig, P., Kreiter, A.K. and Singer, W. Interhemispheric synchronization of oscillatory neuronal responses in cat visual cortex. Science, 1991a, 252: 1177-1179.
Engel, A.K., Kreiter, A.K., K6nig, P. and Singer, W. Synchronization of oscillatory neural responses between striate and extrastriate visual
cortical areas of the cat. Proc. Nat. Acad. Sci. (USA), 1991b, 88: 6048-6052.
Enget, A.K., K/Jnig, P., Kreiter, A.K., Schillen, T.B. and Singer, W. Temporal coding in the visual cortex: new vistas on integration in the nervous system. Trends Neurosci., 1992, 15: 218-226.
Francis, W.N. and Kucera, H. Computational Analysis of English Usage: Lexicon and Grammar. Houghton Mifflin, Boston, MA, 1982.
Frien, A., Eckhorn, R., Bauer, R., Woelbern, T. and Kehr, H. Stimulus- specific fast oscillations at zero phase between visual areas V1 and V2 of awake monkey. NeuroReport, 1994, 5: 2273-2277.
Galambos, R., Makeig, S. and Talmachoff, P.J. A 40-Hz auditory poten- tial recorded from the human scalp. Proc. Nat. Acad. Sci. (USA), 1981, 78: 2643-2647.
Gray, C.M. and Singer, W. Stimulus-specific neuronal oscillations in orientation columns of cat visual cortex. Proc. Nat. Acad. Sci. (USA), 1989, 86: 1698-1702.
Gray, C.M., K6nig, P., Engel, A.K. and Singer, W. Oscillatory responses in cat visual cortex exhibit inter-columnar synchronization which reflects global stimulus properties. Nature, 1989, 338: 334-337.
Hebb, D.O. The Organization of Behavior. A Neuropsychological The- ory. Wiley, New York, 1949.
Holcomb, P.J. and Neville, H.J. Auditory and visual semantic priming in lexical decision: a comparison using event-related brain potentials. Lang. Cogn. Proc., 1990, 5: 281-312.
Jiirgens, E., Rfsler, F., Henninghausen, E. and Heil, M. Stimulus induced gamma oscillations: harmonics or alpha activity? NeuroReport, 1995, 6: 813-816.
Kreiter, A.K. and Singer, W. Oscillatory neuronal responses in the visual cortex of the awake macaque monkey. Eur. J. Neurosci., 1992, 4: 369-375.
Kristeva-Feige, R., Feige, B., Makeig, S., Ross, B. and Elbert, T. Oscillatory brain activity during human sensorimotor integration. NeuroReport, 1993, 4: 1291-1294.
Llin~s, R. and Ribary, U. Coherent 40-Hz oscillation characterizes dream state in humans. Proc. Nat. Acad. Sci. (USA), 1993, 90: 2078-2081.
Lopes da Silva, F. Neural mechanisms underlying brain waves: from neural membranes to networks. Electroenceph. clin. Neurophysiol., 1991, 79: 81-93.
Lutzenberger, W., Pulvermiiller, F. and Birbaumer, N. Words and pseu- dowords elicit distinct patterns of 30-1-Iz activity in humans. Neurosci. Lett., 1994, 176: 115-118.
Lutzenberger, W., Pulvermiiller, F., Elbert, T. and Birbaumer, N. Local 40-Hz activity in human cortex induced by visual stimulation. Neu- rosci. Lett., 1995, 183: 39-42.
Madler, C. and P6ppel, E. Auditory evoked potentials indicate the loss of neuronal oscillations during general anaesthesia. Naturwissenschaften, 1987, 74: 42-43.
Makeig, S. Auditory event-related dynamics of the EEG spectrum and effects of exposure to tones. Electroenceph. din. Neurophysiol., 1993, 86: 283-293.
Makeig, S. and Inlow, M. Lapses in alertness: coherence of fluctuations in performance and EEG spectrum. Electroenceph. clin. Neurophys- iol., 1993, 86: 23-35.
Marslen-Wilson, W.D. and Tyler, L.K. The temporal structure of spoken language understanding. Cognition, 1980, 8: 1-71.
Marslen-Wilson, W.D. and Welsh, A. Processing interactions and lexical access during word recognition in continuous speech. Cogn. Psychol., 1978, 10: 29-63.
Michel, C.M., Kaufman, L. and Williamson, S.J. Duration of EEG and MEG alpha suppression increases with angle in a mental rotation task. J. Cogn..Neurosci., 1994, 6: 139-150.
Mohr, B., Pulvermiiller, F. and Zaidel, E. Lexical decision after left, right and bilateral presentation of content words, function words and non-words: evidence for interhemispheric interaction. Neuropsycholo- gia, 1994, 32: 105-124.
Murthy, V.N. and Fetz, E.E. Coherent 25 to 35 Hz oscillations in the

F. Pulvermiiller et al. / Electroencephalography and clinical Neurophysiology 98 (1996) 76-85 85
sensorimotor cortex of awake behaving monkeys. Proc. Nat. Acad. Sci. (USA), 1992, 89: 5670-5674.
Oldfield, R.C. The assessment a~d analysis of handedness: the Edinburgh Inventory. Neuropsychologia, 1971, 9: 97-113.
Pantev, C., Makeig, S., Hoke, M., Galambos, R., Hampson, S. and Gallen, C. Human auditory evoked gamma-band magnetic fields. Proc. Nat. Acad. Sci. (USA), 1991, 88: 8996-9000.
Pantev, C., Elbert, T., Makeig, S., Hampson, S., Eulitz, C. and Hoke, M. Relationship of transient and steady-state auditory evoked fields. Electroenceph. din. Neurophysiol., 1993, 88: 389-396.
PfurtscheUer, G. and Klimesch, W. Event-related desynchronization dur- ing motor behavior and vis~Jal information processing. In: C.H.M. Brunia, G. Mulder and M.I~. Verbaten (Eds.), Event-Related Brain Research. Electroenceph. cliin. Neurophysiol., Suppl. 42. Elsevier, Amsterdam, 1991: 58-65.
Pflmscheller, G. and Neuper, C. Simultaneous EEG 10 Hz desynchro- nization and 40 I-Iz synchronization during finger movements. Neu- roReport, 1992, 3: 1057-1060.
Pfurtscheiler, G., Flotzinger, D. and Neuper, C. Differentiation between finger, toe and tongue movement in man based on 40 Hz EEG. Electroenceph. din. Neurophysiol., 1994, 90: 456-460.
Pulvermiiller, F. and Schumann, J.H. Neurobiological mechanisms of language acquisition, lang. Learn., 1994, 44: 681-734.
Pulvermiiller, F., Lutzenberger, W. and Birbaumer, N. Electrocortical distinction of vocabulary types. Electroenceph. clin. Neurophysiol., 1995a, 94: 357-370.
Pulvermiiller, F., Lutzenberger, W., Preissl, H. and Birbaumer, N. Motor programming in both hemisplheres: an EEG study of the human brain. Neurosci. Lett., 1995b, 189: 5-8.
Pulvermiiller, F., Preissl, H., Lu~7.enberger, W. and Birbaumer, N. Spec- tral responses in the gammer-band: physiological signs of cognitive processes? NeuroReport, 1995c, 6: 2059-2064.
Rockstroh, B., Elbert, T., Canavan, A., Lutzenberger, W. and Birbaumer, N. Slow Cortical Potentials and Behavior. Urban and Schwarzenberg, Baltimore, MD, 1989.
Rougeul, A., Bouyer, J.J., Dedet, L. and Debray, O. Fast somato-parietal rhythms during combined focal attention and immobility in baboon and squirrel monkey. Electroenceph. din. Neurophysiol., 1979, 46: 310-319.
Salmelin, R., Hari, R., Lounasmaa, O.V. and Sams, M. Dynamics of brain activation during picture naming. Nature, 1994, 368: 463-465.
Scheibel, A.B. The problem of selective attention: a possible structural substrate. In: O. Pompeiano and C. Ajmone-Marsan (Eds.), Brain Mechanisms and Perceptual Awareness. Raven Press, New York, 1981: 319-326.
Schwartz, B.J., Salustri, C., Kaufman, L. and Williamson, S.J. Alpha suppression related to a cognitive task. In: S.J. Williamson, M. Hoke, G. Stroink and M. Kotani (Eds.), Advances in Biomagnetism. Plenum Press, New York, 1989: 237-240.
Singer, W. Putative functions of temporal correlations in neocortical processing. In: C. Koch and J.L. Davis (Eds.), Large Scale Neuronal Theories of the Brain. MIT Press, Boston, MA, 1994: 201-237.
Singer, W. and Gray, C.M. Visual feature integration and the temporal correlation hypothesis. Armu. Rev. Neurosci., 1995, 18" 555-586.
Spydel, J.D., Ford, M.R. and Sheer, D.E. Task dependent cerebral lateralization of the 40 Hz EEG rhythm. Psychophysiology, 1979, 16: 347-350.
Tiitinen, H., Sinkkonen, J., Reinikainen, K., Alho, K., Lavikainen, J. and N~t~inen, R. Selective attention enhances the auditory 40-Hz re- sponse in humans. Nature, 1993, 364: 59-60.
Von der Malsburg, C. Am I thinking assemblies? In: G. Palm and A. Aertsen (Eds.), Brain Theory. Springer, Berlin, 1986: 161-176.