Embed Size (px)
Citation preview
practitioner’s version
Khaldoun KhashanahIonut Florescu
Steve Yang
September 2014
HIGH-FREQUENCY TRADING: a white paperand an Innovative Solution to Address Key Issues
This practitioner’s summary is designed to help non-high frequency investors understand the current state of high frequency trading (HFT) mainly in the U.S. It is based on the “On The Impact and Future of HFT: White Paper,” by Khaldoun Khashanah, Ionut Florescu, and Steve Yang, all of the Stevens Institute of Technology (Financial Engineering Division), and should be read in conjunction with it.
1 Investor Responsibility Research Center Institute
HIGH-FREQUENCY TRADING: A WHITE PAPER PRACTITIONER’S VERSION
Stevens Institute of Technology Stevens Institute of Technology, The Innovation University, is a premier, private research university situated in Hoboken, N.J. overlooking the Manhattan skyline. Founded in 1870, technological innovation has been the hallmark and legacy of Stevens’ education and research programs for more than 140 years. Within the university’s three schools and one college, more than 6,100 undergraduate and graduate students collaborate with more than 350 faculty members in an interdisciplinary, student-centric, entrepreneurial environment to advance the frontiers of science and leverage technology to confront global challenges. Stevens is home to four national research centers of excellence. More information is available at www.stevens.edu.
For more information, please contact:Khaldoun Khashanah, PhDDistinguished Service ProfessorDirector, Financial Engineering DivisionSchool of Systems and EnterprisesStevens Institute of TechnologyHoboken, NJ [email protected]
The Investor Responsibility Research Center Institute is a nonprofit research organization that funds academic and practitioner research that enables investors, policymakers, and other stakeholders to make data-driven decisions. IRRCi research covers a wide range of topics of interest to investors, is objective, unbiased, and disseminated widely. More information is available at www.irrcinstitute.org.
For more information, please contact: Jon Lukomnik, Executive Director40 Wall Street28th FloorNew York, NY [email protected]
Copyright 2014 ©, Investor Responsibility Research Center Institute
*IRRCi is the copyright owner of this executive summary granting an unlimited license to Stevens Institute.
The material in this report may be reproduced and distributed without advance permission, but only if attributed. If reproduced substantially or entirely, it should include all copyright and trademark notices.
Investor Responsibility Research Center Institute
executive summary
As controversial as is HFT, the large volume of the discussion sometimes makes it hard to understand the content. What elements of HFT positively impact the trading markets? Which are problematic? What are the proposed mitigations? Therefore, the Investor Responsibility Research Center Institute (IRRC Institute) asked Khashanah, Florescu, and Yang (KF&Y) to look at HFT from various perspectives. The result includes:
• The effect of HFT on volume, price efficiency and liquidity.
• The problems and risks seen by various stakeholders from their vantage points.
While KF&Y dismiss many alleged problems as the inevitable result of disruptive technology, they do credit the criticism that HFT may create two unfair practices due to asymmetric information: one is that HFT effectively uses advance access to
“micro front run” other investors, and the other is a claim of micro-price manipulation.
Finally, KF&Y make their own innovative proposal to mitigate the problems created by HFT while maintaining the benefits it creates. Building on existing financial concepts and regulation as to who is a market maker and who is a trader, on the need for fairness in the dissemination of price quotes and trades, and on the mechanics of HFT, they introduce a concept of “information transmission zoning”. Among the advantages of their proposal – which is designed to create a fair playing field insofar as the dissemination of price information without decreasing liquidity -- is that requires minimum financial information flow re-architecting and builds on the Security and Exchange Commission’s Regulation National Market System (NMS). It does not require any major change in regulation or regulatory authority.
HIGH-FREQUENCY TRADING: A WHITE PAPER PRACTITIONER’S VERSION
financial economic researchThe primary objective of researchers examining the economic impact of HFT is to understand the impact of these algorithmic trading practices on market quality including liquidity, price discovery process, trading costs, etc. Given the amount of information provided by exchanges and data vendors, it is possible to describe patterns in order submission, order cancellation, and trading behavior. It is also possible to see whether algorithmic or HFT activities are correlated with bid-ask spreads, temporary and/or permanent volatility, trading volume, and other market activity and quality measures. Hendershott et al. (2011) conclude that the implementation of an automated quotation system at the New York Stock Exchange is associated with an increase in electronic message traffic and an improvement in market quality including narrowed effective spreads, reduced adverse selection, where undesired results occur when buyers and sellers have asymmetric information (access to different information) and increased price discovery. However, they note that these effects are concentrated in large-cap stocks, and there is little effect in small-cap stocks. Menkveld (2012) studied the July 2007 entry of a high-frequency market-maker into the trading of Dutch stocks. He argues that competition between trading venues facilitated the arrival of this high-frequency market-maker
and HFT more generally, and he shows that high-frequency market-maker entry is associated with 23% less adverse selection. Volatility is unaffected by the entry of the high-frequency market-maker. Riordan et al. (2012) examine the effect of a technological upgrade on the market quality of 98 actively traded German stocks. They conclude that the ability to update quotes faster helps liquidity providers minimize their losses, and more price discovery takes place. Boehmer et al. (2012) examine international evidence on electronic message traffic and market quality across 39 stock exchanges over the 2001-2009 period. They conclude that co-location increases algorithmic trading and HFT, and that the introduction of co-location improves liquidity and the information efficiency of prices. However, they claim volatility does not decline as much others may claim. Gai et al. (2012) study the effect of two recent 2010 NASDAQ technology upgrades and conclude that reduced time between electronic messages leads to substantial increase in the number of canceled orders without much change in overall trading volume. There is also little change in bid-ask spreads. Overall, these studies suggest that an increase in algorithmic trading positively influences market quality in general, and is particularly positive to liquidity providers, such as market makers.
financial theoretical modeling researchThe second topic focuses on the theoretical modeling of the algorithmic and HFT trading practices to understand their economic impact. Biais et al. (2012) conclude HFT can trade on new information more quickly, generating adverse selection costs for non-HFT investors. In addition, they suggest that HFT requires significant fixed investments in technology, and that only sufficiently large institutions are likely to make these fixed investments, leaving smaller firms and investors to bear the adverse selection costs from HFT. Iovanovic et al. (2010) show that HFT can update limit orders quickly based on new information. As a result, HFT can avoid some adverse selection, and HFT can provide some of that benefit to uninformed investors who need to trade. They note that some
of these trades might not have occurred otherwise, in which case HFT can improve welfare. Martinez et al. (2012) conclude from their model that HFT obtains and trades on information an instant before it is available to others, and it imposes adverse selection on market-makers. Therefore liquidity is worse and prices are no longer efficient. They focus on HFTs that demand liquidity. Foucault, Hombert, and Rosu (2012) show that HFT obtains and trades on information an instant before it is available to others. This imposes adverse selection on market-makers, so liquidity is worse, and prices are no more efficient. The common theme in these models is that HFT may increase adverse selection for non-HFT investors, and it is harmful for liquidity.
1. introduction and literature review
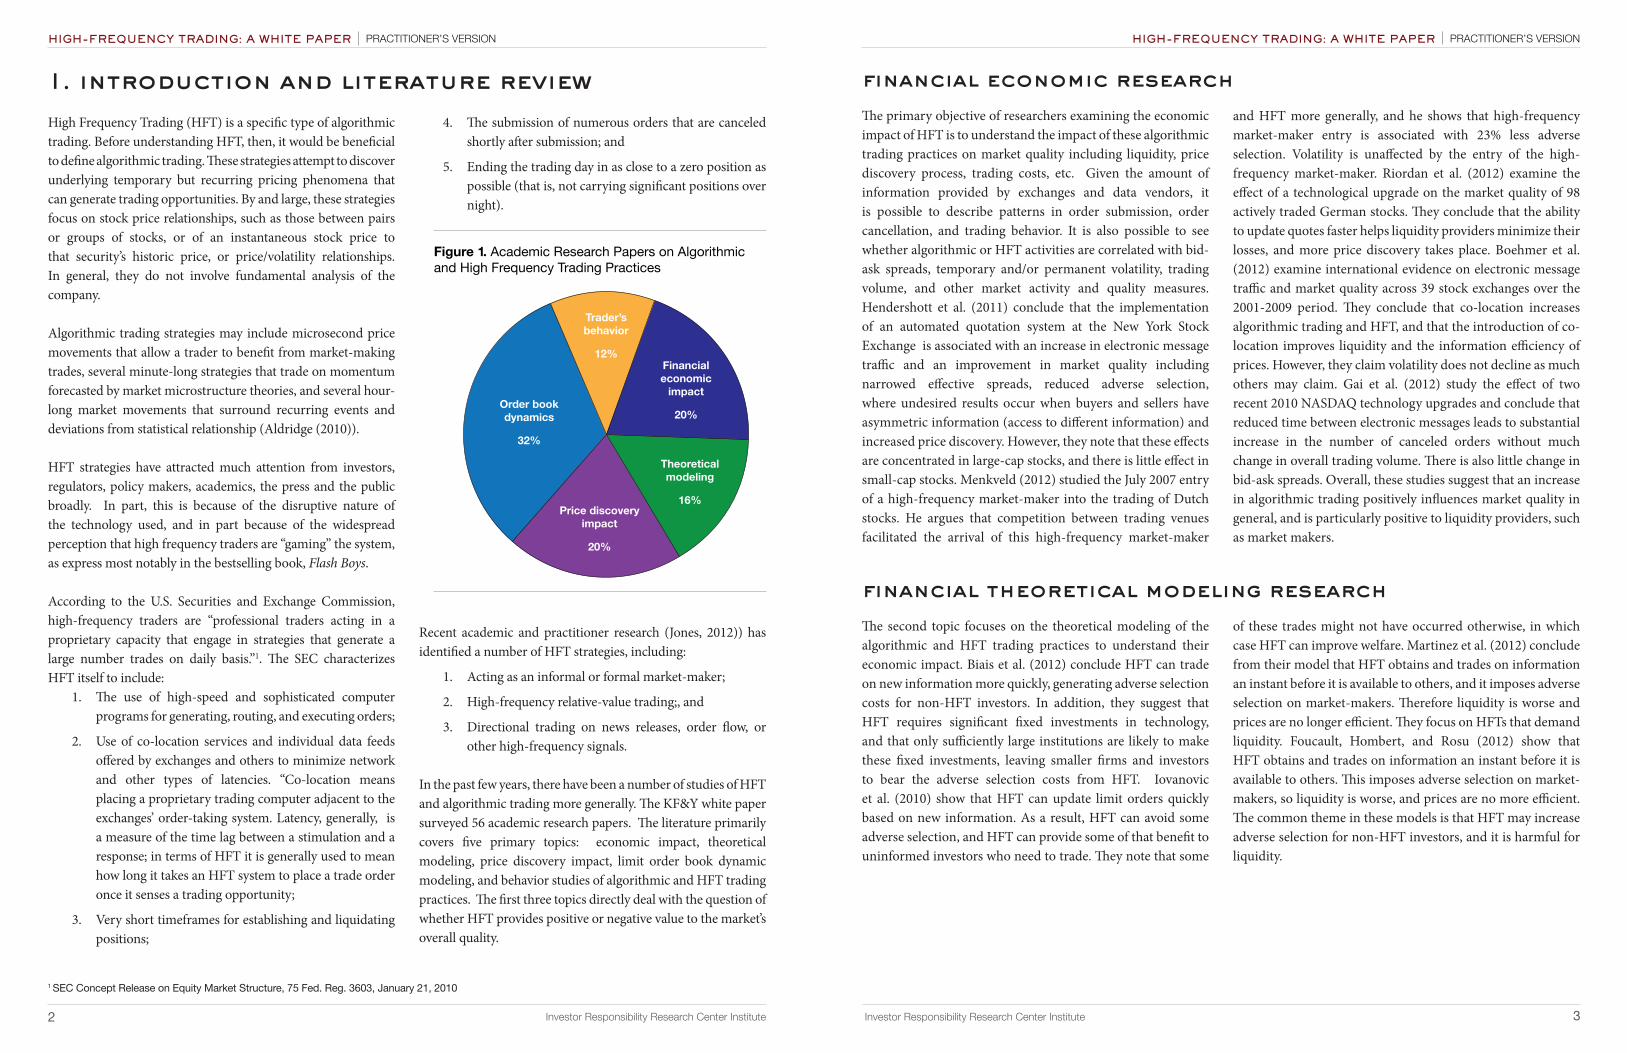
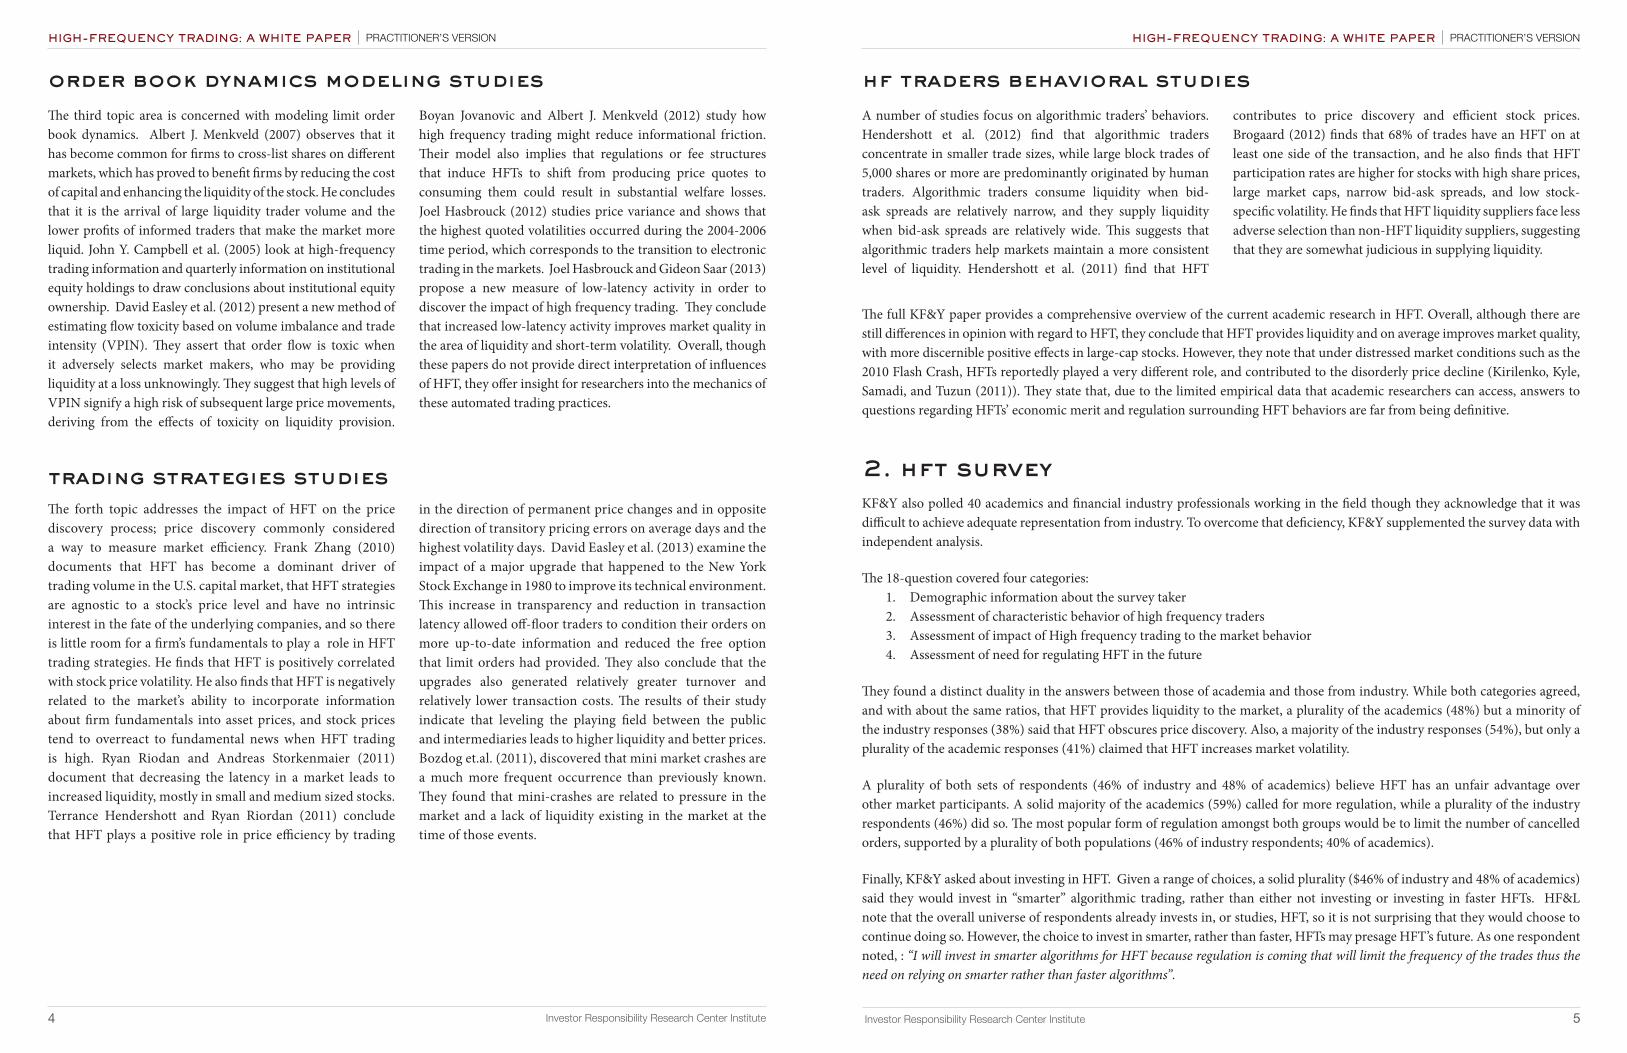
Figure 1. Academic Research Papers on Algorithmic and High Frequency Trading Practices
Trader’s behavior
12%Financial economic
impact
20%
Theoreticalmodeling
16%Price discovery
impact
20%
Order book dynamics
32%
High Frequency Trading (HFT) is a specific type of algorithmic trading. Before understanding HFT, then, it would be beneficial to define algorithmic trading. These strategies attempt to discover underlying temporary but recurring pricing phenomena that can generate trading opportunities. By and large, these strategies focus on stock price relationships, such as those between pairs or groups of stocks, or of an instantaneous stock price to that security’s historic price, or price/volatility relationships. In general, they do not involve fundamental analysis of the company.
Algorithmic trading strategies may include microsecond price movements that allow a trader to benefit from market-making trades, several minute-long strategies that trade on momentum forecasted by market microstructure theories, and several hour-long market movements that surround recurring events and deviations from statistical relationship (Aldridge (2010)).
HFT strategies have attracted much attention from investors, regulators, policy makers, academics, the press and the public broadly. In part, this is because of the disruptive nature of the technology used, and in part because of the widespread perception that high frequency traders are “gaming” the system, as express most notably in the bestselling book, Flash Boys.
According to the U.S. Securities and Exchange Commission, high-frequency traders are “professional traders acting in a proprietary capacity that engage in strategies that generate a large number trades on daily basis.”1. The SEC characterizes HFT itself to include:
1. The use of high-speed and sophisticated computer programs for generating, routing, and executing orders;
2. Use of co-location services and individual data feeds offered by exchanges and others to minimize network and other types of latencies. “Co-location means placing a proprietary trading computer adjacent to the exchanges’ order-taking system. Latency, generally, is a measure of the time lag between a stimulation and a response; in terms of HFT it is generally used to mean how long it takes an HFT system to place a trade order once it senses a trading opportunity;
3. Very short timeframes for establishing and liquidating positions;
4. The submission of numerous orders that are canceled shortly after submission; and
5. Ending the trading day in as close to a zero position as possible (that is, not carrying significant positions over night).
Recent academic and practitioner research (Jones, 2012)) has identified a number of HFT strategies, including:
1. Acting as an informal or formal market-maker;
2. High-frequency relative-value trading;, and
3. Directional trading on news releases, order flow, or other high-frequency signals.
In the past few years, there have been a number of studies of HFT and algorithmic trading more generally. The KF&Y white paper surveyed 56 academic research papers. The literature primarily covers five primary topics: economic impact, theoretical modeling, price discovery impact, limit order book dynamic modeling, and behavior studies of algorithmic and HFT trading practices. The first three topics directly deal with the question of whether HFT provides positive or negative value to the market’s overall quality.
1 SEC Concept Release on Equity Market Structure, 75 Fed. Reg. 3603, January 21, 2010
2 Investor Responsibility Research Center Institute 3 Investor Responsibility Research Center Institute
HIGH-FREQUENCY TRADING: A WHITE PAPER PRACTITIONER’S VERSIONHIGH-FREQUENCY TRADING: A WHITE PAPER PRACTITIONER’S VERSION
KF&Y also polled 40 academics and financial industry professionals working in the field though they acknowledge that it was difficult to achieve adequate representation from industry. To overcome that deficiency, KF&Y supplemented the survey data with independent analysis.
The 18-question covered four categories:1. Demographic information about the survey taker2. Assessment of characteristic behavior of high frequency traders3. Assessment of impact of High frequency trading to the market behavior4. Assessment of need for regulating HFT in the future
They found a distinct duality in the answers between those of academia and those from industry. While both categories agreed, and with about the same ratios, that HFT provides liquidity to the market, a plurality of the academics (48%) but a minority of the industry responses (38%) said that HFT obscures price discovery. Also, a majority of the industry responses (54%), but only a plurality of the academic responses (41%) claimed that HFT increases market volatility.
A plurality of both sets of respondents (46% of industry and 48% of academics) believe HFT has an unfair advantage over other market participants. A solid majority of the academics (59%) called for more regulation, while a plurality of the industry respondents (46%) did so. The most popular form of regulation amongst both groups would be to limit the number of cancelled orders, supported by a plurality of both populations (46% of industry respondents; 40% of academics).
Finally, KF&Y asked about investing in HFT. Given a range of choices, a solid plurality ($46% of industry and 48% of academics) said they would invest in “smarter” algorithmic trading, rather than either not investing or investing in faster HFTs. HF&L note that the overall universe of respondents already invests in, or studies, HFT, so it is not surprising that they would choose to continue doing so. However, the choice to invest in smarter, rather than faster, HFTs may presage HFT’s future. As one respondent noted, : “I will invest in smarter algorithms for HFT because regulation is coming that will limit the frequency of the trades thus the need on relying on smarter rather than faster algorithms”.
2. hft survey
order book dynamics modeling studiesThe third topic area is concerned with modeling limit order book dynamics. Albert J. Menkveld (2007) observes that it has become common for firms to cross-list shares on different markets, which has proved to benefit firms by reducing the cost of capital and enhancing the liquidity of the stock. He concludes that it is the arrival of large liquidity trader volume and the lower profits of informed traders that make the market more liquid. John Y. Campbell et al. (2005) look at high-frequency trading information and quarterly information on institutional equity holdings to draw conclusions about institutional equity ownership. David Easley et al. (2012) present a new method of estimating flow toxicity based on volume imbalance and trade intensity (VPIN). They assert that order flow is toxic when it adversely selects market makers, who may be providing liquidity at a loss unknowingly. They suggest that high levels of VPIN signify a high risk of subsequent large price movements, deriving from the effects of toxicity on liquidity provision.
Boyan Jovanovic and Albert J. Menkveld (2012) study how high frequency trading might reduce informational friction. Their model also implies that regulations or fee structures that induce HFTs to shift from producing price quotes to consuming them could result in substantial welfare losses. Joel Hasbrouck (2012) studies price variance and shows that the highest quoted volatilities occurred during the 2004-2006 time period, which corresponds to the transition to electronic trading in the markets. Joel Hasbrouck and Gideon Saar (2013) propose a new measure of low-latency activity in order to discover the impact of high frequency trading. They conclude that increased low-latency activity improves market quality in the area of liquidity and short-term volatility. Overall, though these papers do not provide direct interpretation of influences of HFT, they offer insight for researchers into the mechanics of these automated trading practices.
4 Investor Responsibility Research Center Institute
trading strategies studiesThe forth topic addresses the impact of HFT on the price discovery process; price discovery commonly considered a way to measure market efficiency. Frank Zhang (2010) documents that HFT has become a dominant driver of trading volume in the U.S. capital market, that HFT strategies are agnostic to a stock’s price level and have no intrinsic interest in the fate of the underlying companies, and so there is little room for a firm’s fundamentals to play a role in HFT trading strategies. He finds that HFT is positively correlated with stock price volatility. He also finds that HFT is negatively related to the market’s ability to incorporate information about firm fundamentals into asset prices, and stock prices tend to overreact to fundamental news when HFT trading is high. Ryan Riodan and Andreas Storkenmaier (2011) document that decreasing the latency in a market leads to increased liquidity, mostly in small and medium sized stocks. Terrance Hendershott and Ryan Riordan (2011) conclude that HFT plays a positive role in price efficiency by trading
in the direction of permanent price changes and in opposite direction of transitory pricing errors on average days and the highest volatility days. David Easley et al. (2013) examine the impact of a major upgrade that happened to the New York Stock Exchange in 1980 to improve its technical environment. This increase in transparency and reduction in transaction latency allowed off-floor traders to condition their orders on more up-to-date information and reduced the free option that limit orders had provided. They also conclude that the upgrades also generated relatively greater turnover and relatively lower transaction costs. The results of their study indicate that leveling the playing field between the public and intermediaries leads to higher liquidity and better prices. Bozdog et.al. (2011), discovered that mini market crashes are a much more frequent occurrence than previously known. They found that mini-crashes are related to pressure in the market and a lack of liquidity existing in the market at the time of those events.
5 Investor Responsibility Research Center Institute
hf traders behavioral studiesA number of studies focus on algorithmic traders’ behaviors. Hendershott et al. (2012) find that algorithmic traders concentrate in smaller trade sizes, while large block trades of 5,000 shares or more are predominantly originated by human traders. Algorithmic traders consume liquidity when bid-ask spreads are relatively narrow, and they supply liquidity when bid-ask spreads are relatively wide. This suggests that algorithmic traders help markets maintain a more consistent level of liquidity. Hendershott et al. (2011) find that HFT
contributes to price discovery and efficient stock prices. Brogaard (2012) finds that 68% of trades have an HFT on at least one side of the transaction, and he also finds that HFT participation rates are higher for stocks with high share prices, large market caps, narrow bid-ask spreads, and low stock-specific volatility. He finds that HFT liquidity suppliers face less adverse selection than non-HFT liquidity suppliers, suggesting that they are somewhat judicious in supplying liquidity.
The full KF&Y paper provides a comprehensive overview of the current academic research in HFT. Overall, although there are still differences in opinion with regard to HFT, they conclude that HFT provides liquidity and on average improves market quality, with more discernible positive effects in large-cap stocks. However, they note that under distressed market conditions such as the 2010 Flash Crash, HFTs reportedly played a very different role, and contributed to the disorderly price decline (Kirilenko, Kyle, Samadi, and Tuzun (2011)). They state that, due to the limited empirical data that academic researchers can access, answers to questions regarding HFTs’ economic merit and regulation surrounding HFT behaviors are far from being definitive.
HIGH-FREQUENCY TRADING: A WHITE PAPER PRACTITIONER’S VERSIONHIGH-FREQUENCY TRADING: A WHITE PAPER PRACTITIONER’S VERSION
6 Investor Responsibility Research Center Institute 7 Investor Responsibility Research Center Institute
3. hft impact
mechanical impact on marketThe NASDQQ provided a sample of HFT data to the researchers.2 The NASDAQ dataset contains trading and quoting activities of 26 HFT firms in 120 stocks, covering all of 2008, 2009 and one week in 2010. The trade reports indicate whether the trader was an HFT (coded with an “H”) or not (coded with an “N”), and who was providing liquidity. So, for example, a paired trade
labeled HN would indicate that an HFT firm took liquidity from a non-HFT firm. Table 1 shows the percentages of trades for years 2008, 2009 and two weeks in 2010 in which at least one of the traders was an HFT. These ratios confirm the number most circulated in literature of 70% of the trades having an HFT counterparty.
Table 1. HF percentage volume in the sample
Percent of trades where at least one counterparty is HFT
Year 2008 0.713452891
Year 2009 0.681901682
Year 2010 0.744922944
However, HF&L note that this number is calculated as (HH+NH+HN)/(HH+NH+HN+NN), which they say is not an accurate measure of liquidity. They note that the behavior of HFT is very different depending on the type of stock traded (for example, behavior differs on large average daily volume vs. low average daily volume stocks). HF&L introduced two new measures: an index of cross-liquidity (from an HFT unit H to a non-HFT unit N), INH, and an index of auto-liquidity, IHH. The first measure, the cross-liquidity index (calculated as ) calculates the percentage of volume exchanged between HFT and Non-HFT where HFT provided liquidity
to Non-HFT market participants. The second measure, of auto-liquidity (calculated as ) represents the percentage of volume where HFT firms exchange shares between themselves from the total volume where the same category of traders exchange shares. The numbers obtained are quite different for each stock but one interesting feature emerges.
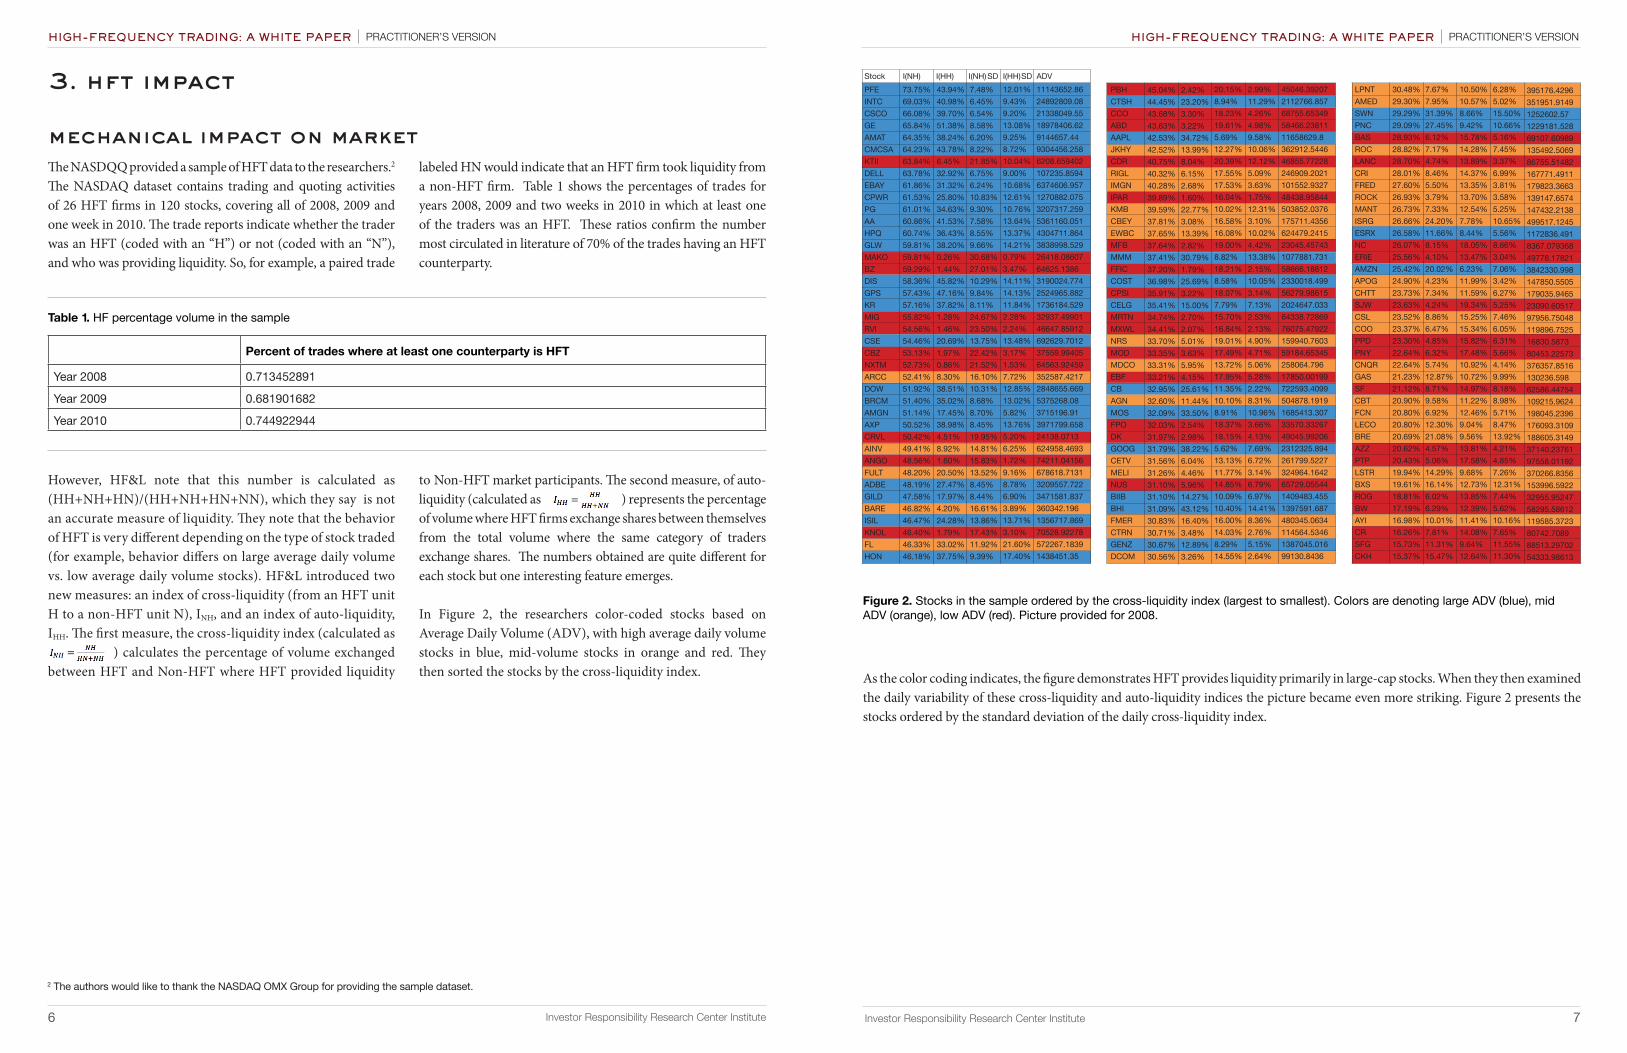
In Figure 2, the researchers color-coded stocks based on Average Daily Volume (ADV), with high average daily volume stocks in blue, mid-volume stocks in orange and red. They then sorted the stocks by the cross-liquidity index.
2 The authors would like to thank the NASDAQ OMX Group for providing the sample dataset.
Stock I(NH) I(HH) I(NH) SD I(HH) SD ADVPFEINTCCSCOGEAMATCMCSAKTIIDELLEBAYCPWRPGAAHPQGLWMAKOBZDISGPSKRMIGRVICSECBZNXTMARCCDOWBRCMAMGNAXPCRVLAINVANGOFULTADBEGILDBAREISILKNOLFLHON
73.75%69.03%66.08%65.84%64.35%64.23%63.84%63.78%61.86%61.53%61.01%60.86%60.74%59.81%59.81%59.29%58.36%57.43%57.16%55.82%54.56%54.46%53.13%52.73%52.41%51.92%51.40%51.14%50.52%50.42%49.41%48.56%48.20%48.19%47.58%46.82%46.47%46.40%46.33%46.18%
43.94%40.98%39.70%51.38%38.24%43.78%6.45%32.92%31.32%25.80%34.63%41.53%36.43%38.20%0.26%1.44%45.82%47.16%37.82%1.28%1.46%20.69%1.97%0.86%8.30%38.51%35.02%17.45%38.98%4.51%8.92%1.60%20.50%27.47%17.97%4.20%24.28%1.79%33.02%37.75%
7.48%6.45%6.54%8.58%6.20%8.22%21.85%6.75%6.24%10.83%9.30%7.58%8.55%9.66%30.68%27.01%10.29%9.84%8.11%24.67%23.50%13.75%22.42%21.52%16.10%10.31%8.68%8.70%8.45%19.95%14.81%15.83%13.52%8.45%8.44%16.61%13.86%17.43%11.92%9.39%
12.01%9.43%9.20%13.08%9.25%8.72%10.04%9.00%10.68%12.61%10.76%13.64%13.37%14.21%0.79%3.47%14.11%14.13%11.84%2.28%2.24%13.48%3.17%1.53%7.72%12.85%13.02%5.82%13.76%5.20%6.25%1.72%9.16%8.78%6.90%3.89%13.71%3.10%21.60%17.40%
11143652.8624892809.0821338049.5518978406.629144657.449304456.2586208.659402107235.85946374606.9571270882.0753207317.2595361160.0514304711.8643838998.52926418.0860764625.13863190024.7742524965.8821736184.52932937.4990146647.85912692629.701237559.9940564563.92459352587.42172848655.6695375268.083715196.913971799.65824138.0713624958.469374211.04156678618.71313209557.7223471581.837360342.1961356717.86970528.92278572267.18391438451.35
PBHCTSHCCOABDAAPLJKHYCDRRIGLIMGNIPARKMBCBEYEWBCMFBMMMFFICCOSTCPSICELGMRTNMXWLNRSMODMDCOEBFCBAGNMOSFPODKGOOGCETVMELINUSBIIBBHIFMERCTRNGENZDCOM
45.04%44.45%43.68%43.63%42.53%42.52%40.75%40.32%40.28%39.89%39.59%37.81%37.65%37.64%37.41%37.20%36.98%35.91%35.41%34.74%34.41%33.70%33.35%33.31%33.21%32.95%32.60%32.09%32.03%31.97%31.79%31.56%31.26%31.10%31.10%31.09%30.83%30.71%30.67%30.56%
2.42%23.20%3.30%3.22%34.72%13.99%8.04%6.15%2.68%1.60%22.77%3.08%13.39%2.82%30.79%1.79%25.69%3.22%15.00%2.70%2.07%5.01%3.63%5.95%4.15%25.61%11.44%33.50%2.54%2.98%38.22%6.04%4.46%5.96%14.27%43.12%16.40%3.48%12.89%3.26%
20.15%8.94%18.23%19.61%5.69%12.27%20.39%17.55%17.53%16.04%10.02%16.58%16.08%19.00%8.82%18.21%8.58%18.07%7.79%15.70%16.84%19.01%17.49%13.72%17.95%11.35%10.10%8.91%18.37%18.15%5.62%13.13%11.77%14.85%10.09%10.40%16.00%14.03%8.29%14.55%
2.99%11.29%4.26%4.98%9.58%10.06%12.12%5.09%3.63%1.75%12.31%3.10%10.02%4.42%13.38%2.15%10.05%3.14%7.13%2.53%2.13%4.90%4.71%5.06%5.28%2.22%8.31%10.96%3.66%4.13%7.69%6.72%3.14%6.79%6.97%14.41%8.36%2.76%5.15%2.64%
45046.392072112766.85768755.6534958466.2381111658629.8362912.544646855.77228246909.2021101552.932748438.95844503852.0376175711.4356624479.241523045.457431077881.73158666.188122330018.49956279.986152024647.03364338.7286976075.47922159940.760359184.65345258064.79617850.00199722593.4099504878.19191685413.30733570.3326749045.992062312325.894261799.5227324964.164265729.055441409483.4551397591.687480345.0634114564.53461387045.01699130.8436
LPNTAMEDSWNPNCBASROCLANCCRIFREDROCKMANTISRGESRXNCERIEAMZNAPOGCHTTSJWCSLCOOPPDPNYCNQRGASSFCBTFCNLECOBREAZZPTPLSTRBXSROGBWAYICRSFGCKH
30.48%29.30%29.29%29.09%28.93%28.82%28.70%28.01%27.60%26.93%26.73%26.66%26.58%26.07%25.56%25.42%24.90%23.73%23.63%23.52%23.37%23.30%22.64%22.64%21.23%21.12%20.90%20.80%20.80%20.69%20.62%20.43%19.94%19.61%18.81%17.19%16.98%16.26%15.73%15.37%
7.67%7.95%31.39%27.45%6.12%7.17%4.74%8.46%5.50%3.79%7.33%24.20%11.66%8.15%4.10%20.02%4.23%7.34%4.24%8.86%6.47%4.85%6.32%5.74%12.87%8.71%9.58%6.92%12.30%21.08%4.57%5.06%14.29%16.14%6.02%6.29%10.01%7.81%11.31%15.47%
10.50%10.57%8.66%9.42%15.78%14.28%13.89%14.37%13.35%13.70%12.54%7.78%8.44%18.05%13.47%6.23%11.99%11.59%19.34%15.25%15.34%15.82%17.48%10.92%10.72%14.97%11.22%12.46%9.04%9.56%13.81%17.58%9.68%12.73%13.85%12.39%11.41%14.08%9.64%12.64%
6.28%5.02%15.50%10.66%5.16%7.45%3.37%6.99%3.81%3.58%5.25%10.65%5.56%8.66%3.04%7.06%3.42%6.27%5.25%7.46%6.05%6.31%5.66%4.14%9.99%8.18%8.98%5.71%8.47%13.92%4.21%4.85%7.26%12.31%7.44%5.62%10.16%7.65%11.55%11.30%
395176.4296351951.91491252602.571229181.52869107.60989135492.506986755.51482167771.4911179823.3663139147.6574147432.2138499517.12451172836.4918367.07936849778.178213842330.998147850.5505179035.946523090.6051797956.75048119896.752516830.587380453.22573376357.8516130236.59862586.44754109215.9624198045.2396176093.3109188605.314937140.2376197558.01192370266.8356153996.592232955.9524758295.58612119585.372380742.708988513.2970254333.98613
Figure 2. Stocks in the sample ordered by the cross-liquidity index (largest to smallest). Colors are denoting large ADV (blue), mid ADV (orange), low ADV (red). Picture provided for 2008.
As the color coding indicates, the figure demonstrates HFT provides liquidity primarily in large-cap stocks. When they then examined the daily variability of these cross-liquidity and auto-liquidity indices the picture became even more striking. Figure 2 presents the stocks ordered by the standard deviation of the daily cross-liquidity index.
HIGH-FREQUENCY TRADING: A WHITE PAPER PRACTITIONER’S VERSION HIGH-FREQUENCY TRADING: A WHITE PAPER PRACTITIONER’S VERSION
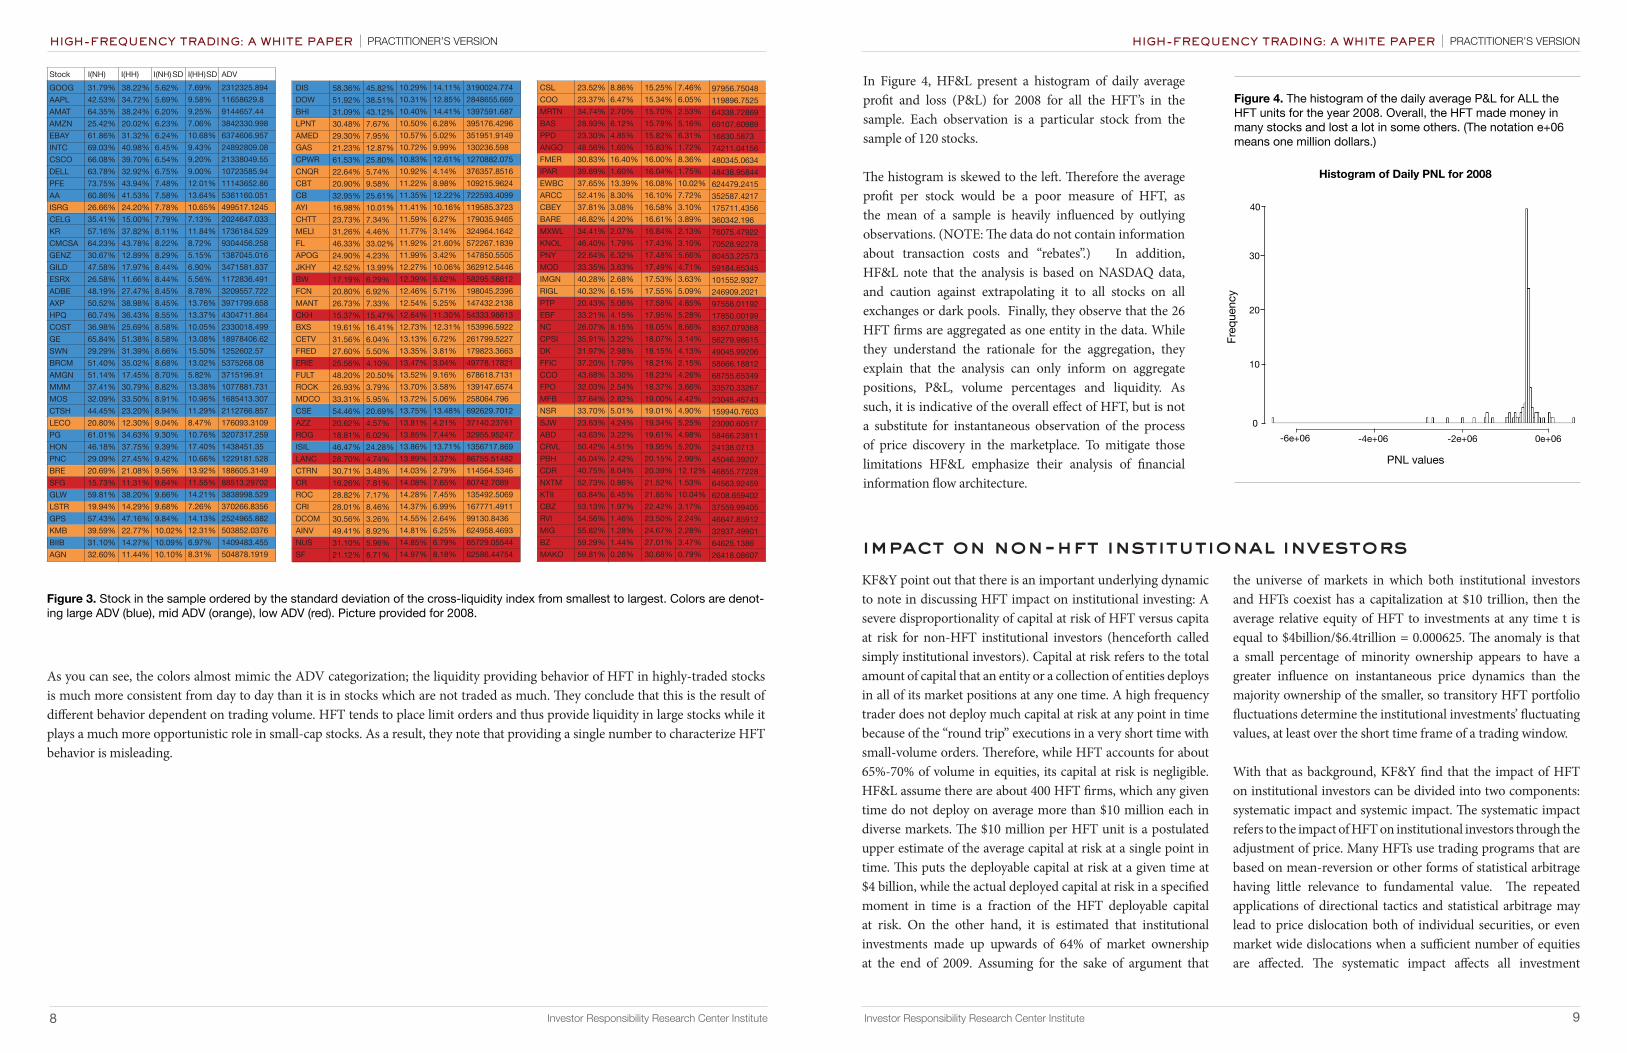
As you can see, the colors almost mimic the ADV categorization; the liquidity providing behavior of HFT in highly-traded stocks is much more consistent from day to day than it is in stocks which are not traded as much. They conclude that this is the result of different behavior dependent on trading volume. HFT tends to place limit orders and thus provide liquidity in large stocks while it plays a much more opportunistic role in small-cap stocks. As a result, they note that providing a single number to characterize HFT behavior is misleading.
Figure 3. Stock in the sample ordered by the standard deviation of the cross-liquidity index from smallest to largest. Colors are denot-ing large ADV (blue), mid ADV (orange), low ADV (red). Picture provided for 2008.
Stock I(NH) I(HH) I(NH) SD I(HH) SD ADVGOOGAAPLAMATAMZNEBAYINTCCSCODELLPFEAAISRGCELGKRCMCSAGENZGILDESRXADBEAXPHPQCOSTGESWNBRCMAMGNMMMMOSCTSHLECOPGHONPNCBRESFGGLWLSTRGPSKMBBIIBAGN
31.79%42.53%64.35%25.42%61.86%69.03%66.08%63.78%73.75%60.86%26.66%35.41%57.16%64.23%30.67%47.58%26.58%48.19%50.52%60.74%36.98%65.84%29.29%51.40%51.14%37.41%32.09%44.45%20.80%61.01%46.18%29.09%20.69%15.73%59.81%19.94%57.43%39.59%31.10%32.60%
38.22%34.72%38.24%20.02%31.32%40.98%39.70%32.92%43.94%41.53%24.20%15.00%37.82%43.78%12.89%17.97%11.66%27.47%38.98%36.43%25.69%51.38%31.39%35.02%17.45%30.79%33.50%23.20%12.30%34.63%37.75%27.45%21.08%11.31%38.20%14.29%47.16%22.77%14.27%11.44%
5.62%5.69%6.20%6.23%6.24%6.45%6.54%6.75%7.48%7.58%7.78%7.79%8.11%8.22%8.29%8.44%8.44%8.45%8.45%8.55%8.58%8.58%8.66%8.68%8.70%8.82%8.91%8.94%9.04%9.30%9.39%9.42%9.56%9.64%9.66%9.68%9.84%10.02%10.09%10.10%
7.69%9.58%9.25%7.06%10.68%9.43%9.20%9.00%12.01%13.64%10.65%7.13%11.84%8.72%5.15%6.90%5.56%8.78%13.76%13.37%10.05%13.08%15.50%13.02%5.82%13.38%10.96%11.29%8.47%10.76%17.40%10.66%13.92%11.55%14.21%7.26%14.13%12.31%6.97%8.31%
2312325.89411658629.89144657.443842330.9986374606.95724892809.0821338049.5510723585.9411143652.865361160.051499517.12452024647.0331736184.5299304456.2581387045.0163471581.8371172836.4913209557.7223971799.6584304711.8642330018.49918978406.621252602.575375268.083715196.911077881.7311685413.3072112766.857176093.31093207317.2591438451.351229181.528188605.314988513.297023838998.529370266.83562524965.882503852.03761409483.455504878.1919
DISDOWBHI LPNTAMEDGASCPWRCNQRCBTCBAYICHTTMELIFLAPOGJKHYBWFCNMANTCKHBXSCETVFREDERIE FULTROCKMDCOCSEAZZROGISILLANCCTRNCRROCCRIDCOMAINVNUSSF
58.36%51.92%31.09%30.48%29.30%21.23%61.53%22.64%20.90%32.95%16.98%23.73%31.26%46.33%24.90%42.52%17.19%20.80%26.73%15.37%19.61%31.56%27.60%25.56%48.20%26.93%33.31%54.46%20.62%18.81%46.47%28.70%30.71%16.26%28.82%28.01%30.56%49.41%31.10%21.12%
45.82%38.51%43.12%7.67%7.95%12.87%25.80%5.74%9.58%25.61%10.01%7.34%4.46%33.02%4.23%13.99%6.29%6.92%7.33%15.47%16.41%6.04%5.50%4.10%20.50%3.79%5.95%20.69%4.57%6.02%24.28%4.74%3.48%7.81%7.17%8.46%3.26%8.92%5.96%8.71%
10.29%10.31%10.40%10.50%10.57%10.72%10.83%10.92%11.22%11.35%11.41%11.59%11.77%11.92%11.99%12.27%12.39%12.46%12.54%12.64%12.73%13.13%13.35%13.47%13.52%13.70%13.72%13.75%13.81%13.85%13.86%13.89%14.03%14.08%14.28%14.37%14.55%14.81%14.85%14.97%
14.11%12.85%14.41%6.28%5.02%9.99%12.61%4.14%8.98%12.22%10.16%6.27%3.14%21.60%3.42%10.06%5.62%5.71%5.25%11.30%12.31%6.72%3.81%3.04%9.16%3.58%5.06%13.48%4.21%7.44%13.71%3.37%2.79%7.65%7.45%6.99%2.64%6.25%6.79%8.18%
3190024.7742848655.6691397591.687395176.4296351951.9149130236.5981270882.075376357.8516109215.9624722593.4099119585.3723179035.9465324964.1642572267.1839147850.5505362912.544658295.58612198045.2396147432.213854333.98613153996.5922261799.5227179823.366349778.17821678618.7131139147.6574258064.796692629.701237140.2376132955.952471356717.86986755.51482114564.534680742.7089135492.5069167771.491199130.8436624958.469365729.0554462586.44754
CSLCOOMRTNBASPPDANGOFMERIPAREWBCARCCCBEYBAREMXWLKNOLPNYMODIMGNRIGLPTPEBFNCCPSIDKFFICCCOFPOMFBNSRSJWABDCRVLPBHCDRNXTMKTIICBZRVIMIGBZMAKO
23.52%23.37%34.74%28.93%23.30%48.56%30.83%39.89%37.65%52.41%37.81%46.82%34.41%46.40%22.64%33.35%40.28%40.32%20.43%33.21%26.07%35.91%31.97%37.20%43.68%32.03%37.64%33.70%23.63%43.63%50.42%45.04%40.75%52.73%63.84%53.13%54.56%55.82%59.29%59.81%
8.86%6.47%2.70%6.12%4.85%1.60%16.40%1.60%13.39%8.30%3.08%4.20%2.07%1.79%6.32%3.63%2.68%6.15%5.06%4.15%8.15%3.22%2.98%1.79%3.30%2.54%2.82%5.01%4.24%3.22%4.51%2.42%8.04%0.86%6.45%1.97%1.46%1.28%1.44%0.26%
15.25%15.34%15.70%15.78%15.82%15.83%16.00%16.04%16.08%16.10%16.58%16.61%16.84%17.43%17.48%17.49%17.53%17.55%17.58%17.95%18.05%18.07%18.15%18.21%18.23%18.37%19.00%19.01%19.34%19.61%19.95%20.15%20.39%21.52%21.85%22.42%23.50%24.67%27.01%30.68%
7.46%6.05%2.53%5.16%6.31%1.72%8.36%1.75%10.02%7.72%3.10%3.89%2.13%3.10%5.66%4.71%3.63%5.09%4.85%5.28%8.66%3.14%4.13%2.15%4.26%3.66%4.42%4.90%5.25%4.98%5.20%2.99%12.12%1.53%10.04%3.17%2.24%2.28%3.47%0.79%
97956.75048119896.752564338.7286969107.6098916830.587374211.04156480345.063448438.95844624479.2415352587.4217175711.4356360342.19676075.4792270528.9227880453.2257359184.65345101552.9327246909.202197558.0119217850.001998367.07936856279.9861549045.9920658666.1881268755.6534933570.3326723045.45743159940.760323090.6051758466.2381124138.071345046.3920746855.7722864563.924596208.65940237559.9940546647.8591232937.4990164625.138626418.08607
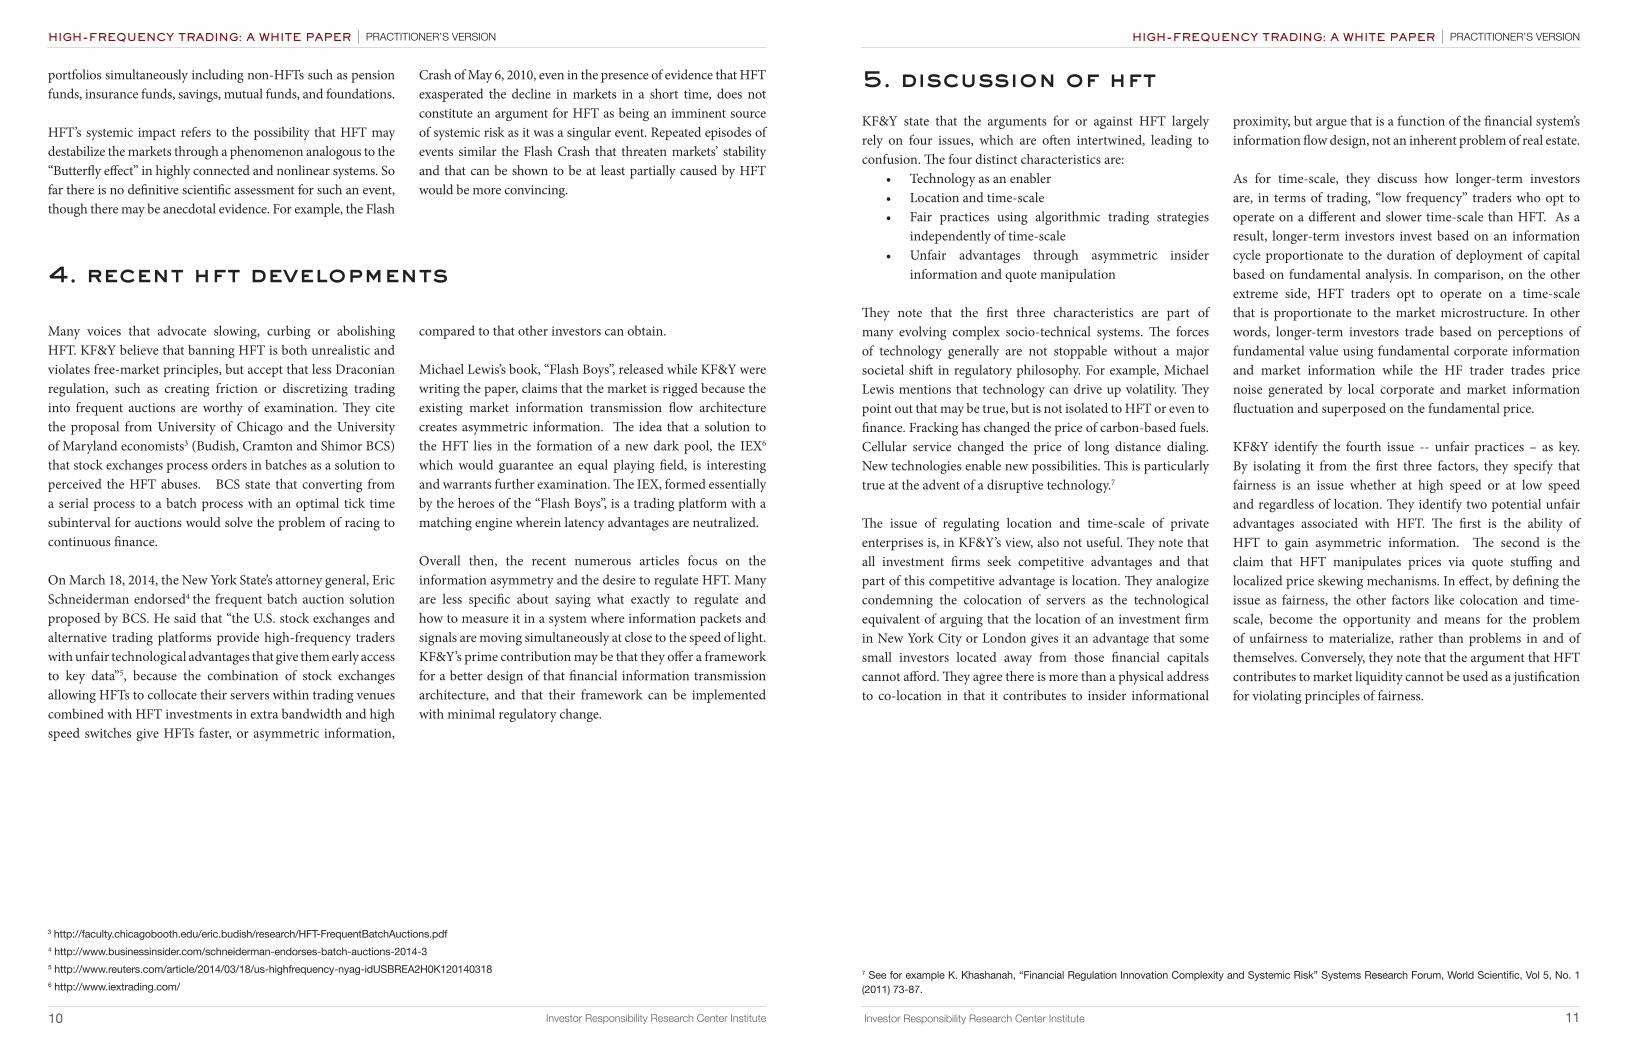
In Figure 4, HF&L present a histogram of daily average profit and loss (P&L) for 2008 for all the HFT’s in the sample. Each observation is a particular stock from the sample of 120 stocks.
The histogram is skewed to the left. Therefore the average profit per stock would be a poor measure of HFT, as the mean of a sample is heavily influenced by outlying observations. (NOTE: The data do not contain information about transaction costs and “rebates”.) In addition, HF&L note that the analysis is based on NASDAQ data, and caution against extrapolating it to all stocks on all exchanges or dark pools. Finally, they observe that the 26 HFT firms are aggregated as one entity in the data. While they understand the rationale for the aggregation, they explain that the analysis can only inform on aggregate positions, P&L, volume percentages and liquidity. As such, it is indicative of the overall effect of HFT, but is not a substitute for instantaneous observation of the process of price discovery in the marketplace. To mitigate those limitations HF&L emphasize their analysis of financial information flow architecture.
Figure 4. The histogram of the daily average P&L for ALL the HFT units for the year 2008. Overall, the HFT made money in many stocks and lost a lot in some others. (The notation e+06 means one million dollars.)
Histogram of Daily PNL for 2008
Freq
uenc
y
PNL values
-6e+06 -4e+06 -2e+06 0e+060
40
20
10
30
impact on non-hft institutional investors KF&Y point out that there is an important underlying dynamic to note in discussing HFT impact on institutional investing: A severe disproportionality of capital at risk of HFT versus capita at risk for non-HFT institutional investors (henceforth called simply institutional investors). Capital at risk refers to the total amount of capital that an entity or a collection of entities deploys in all of its market positions at any one time. A high frequency trader does not deploy much capital at risk at any point in time because of the “round trip” executions in a very short time with small-volume orders. Therefore, while HFT accounts for about 65%-70% of volume in equities, its capital at risk is negligible. HF&L assume there are about 400 HFT firms, which any given time do not deploy on average more than $10 million each in diverse markets. The $10 million per HFT unit is a postulated upper estimate of the average capital at risk at a single point in time. This puts the deployable capital at risk at a given time at $4 billion, while the actual deployed capital at risk in a specified moment in time is a fraction of the HFT deployable capital at risk. On the other hand, it is estimated that institutional investments made up upwards of 64% of market ownership at the end of 2009. Assuming for the sake of argument that
the universe of markets in which both institutional investors and HFTs coexist has a capitalization at $10 trillion, then the average relative equity of HFT to investments at any time t is equal to $4billion/$6.4trillion = 0.000625. The anomaly is that a small percentage of minority ownership appears to have a greater influence on instantaneous price dynamics than the majority ownership of the smaller, so transitory HFT portfolio fluctuations determine the institutional investments’ fluctuating values, at least over the short time frame of a trading window.
With that as background, KF&Y find that the impact of HFT on institutional investors can be divided into two components: systematic impact and systemic impact. The systematic impact refers to the impact of HFT on institutional investors through the adjustment of price. Many HFTs use trading programs that are based on mean-reversion or other forms of statistical arbitrage having little relevance to fundamental value. The repeated applications of directional tactics and statistical arbitrage may lead to price dislocation both of individual securities, or even market wide dislocations when a sufficient number of equities are affected. The systematic impact affects all investment
8 Investor Responsibility Research Center Institute 9 Investor Responsibility Research Center Institute
HIGH-FREQUENCY TRADING: A WHITE PAPER PRACTITIONER’S VERSIONHIGH-FREQUENCY TRADING: A WHITE PAPER PRACTITIONER’S VERSION
portfolios simultaneously including non-HFTs such as pension funds, insurance funds, savings, mutual funds, and foundations.
HFT’s systemic impact refers to the possibility that HFT may destabilize the markets through a phenomenon analogous to the “Butterfly effect” in highly connected and nonlinear systems. So far there is no definitive scientific assessment for such an event, though there may be anecdotal evidence. For example, the Flash
Crash of May 6, 2010, even in the presence of evidence that HFT exasperated the decline in markets in a short time, does not constitute an argument for HFT as being an imminent source of systemic risk as it was a singular event. Repeated episodes of events similar the Flash Crash that threaten markets’ stability and that can be shown to be at least partially caused by HFT would be more convincing.
Many voices that advocate slowing, curbing or abolishing HFT. KF&Y believe that banning HFT is both unrealistic and violates free-market principles, but accept that less Draconian regulation, such as creating friction or discretizing trading into frequent auctions are worthy of examination. They cite the proposal from University of Chicago and the University of Maryland economists3 (Budish, Cramton and Shimor BCS) that stock exchanges process orders in batches as a solution to perceived the HFT abuses. BCS state that converting from a serial process to a batch process with an optimal tick time subinterval for auctions would solve the problem of racing to continuous finance.
On March 18, 2014, the New York State’s attorney general, Eric Schneiderman endorsed4 the frequent batch auction solution proposed by BCS. He said that “the U.S. stock exchanges and alternative trading platforms provide high-frequency traders with unfair technological advantages that give them early access to key data”5, because the combination of stock exchanges allowing HFTs to collocate their servers within trading venues combined with HFT investments in extra bandwidth and high speed switches give HFTs faster, or asymmetric information,
compared to that other investors can obtain.
Michael Lewis’s book, “Flash Boys”, released while KF&Y were writing the paper, claims that the market is rigged because the existing market information transmission flow architecture creates asymmetric information. The idea that a solution to the HFT lies in the formation of a new dark pool, the IEX6
which would guarantee an equal playing field, is interesting and warrants further examination. The IEX, formed essentially by the heroes of the “Flash Boys”, is a trading platform with a matching engine wherein latency advantages are neutralized.
Overall then, the recent numerous articles focus on the information asymmetry and the desire to regulate HFT. Many are less specific about saying what exactly to regulate and how to measure it in a system where information packets and signals are moving simultaneously at close to the speed of light. KF&Y’s prime contribution may be that they offer a framework for a better design of that financial information transmission architecture, and that their framework can be implemented with minimal regulatory change.
4. recent hft developments
3 http://faculty.chicagobooth.edu/eric.budish/research/HFT-FrequentBatchAuctions.pdf
10 Investor Responsibility Research Center Institute 11 Investor Responsibility Research Center Institute
4 http://www.businessinsider.com/schneiderman-endorses-batch-auctions-2014-35 http://www.reuters.com/article/2014/03/18/us-highfrequency-nyag-idUSBREA2H0K1201403186 http://www.iextrading.com/
5. discussion of hft
KF&Y state that the arguments for or against HFT largely rely on four issues, which are often intertwined, leading to confusion. The four distinct characteristics are:
• Technology as an enabler• Location and time-scale• Fair practices using algorithmic trading strategies
independently of time-scale• Unfair advantages through asymmetric insider
information and quote manipulation
They note that the first three characteristics are part of many evolving complex socio-technical systems. The forces of technology generally are not stoppable without a major societal shift in regulatory philosophy. For example, Michael Lewis mentions that technology can drive up volatility. They point out that may be true, but is not isolated to HFT or even to finance. Fracking has changed the price of carbon-based fuels. Cellular service changed the price of long distance dialing. New technologies enable new possibilities. This is particularly true at the advent of a disruptive technology.7
The issue of regulating location and time-scale of private enterprises is, in KF&Y’s view, also not useful. They note that all investment firms seek competitive advantages and that part of this competitive advantage is location. They analogize condemning the colocation of servers as the technological equivalent of arguing that the location of an investment firm in New York City or London gives it an advantage that some small investors located away from those financial capitals cannot afford. They agree there is more than a physical address to co-location in that it contributes to insider informational
proximity, but argue that is a function of the financial system’s information flow design, not an inherent problem of real estate.
As for time-scale, they discuss how longer-term investors are, in terms of trading, “low frequency” traders who opt to operate on a different and slower time-scale than HFT. As a result, longer-term investors invest based on an information cycle proportionate to the duration of deployment of capital based on fundamental analysis. In comparison, on the other extreme side, HFT traders opt to operate on a time-scale that is proportionate to the market microstructure. In other words, longer-term investors trade based on perceptions of fundamental value using fundamental corporate information and market information while the HF trader trades price noise generated by local corporate and market information fluctuation and superposed on the fundamental price.
KF&Y identify the fourth issue -- unfair practices – as key. By isolating it from the first three factors, they specify that fairness is an issue whether at high speed or at low speed and regardless of location. They identify two potential unfair advantages associated with HFT. The first is the ability of HFT to gain asymmetric information. The second is the claim that HFT manipulates prices via quote stuffing and localized price skewing mechanisms. In effect, by defining the issue as fairness, the other factors like colocation and time-scale, become the opportunity and means for the problem of unfairness to materialize, rather than problems in and of themselves. Conversely, they note that the argument that HFT contributes to market liquidity cannot be used as a justification for violating principles of fairness.
7 See for example K. Khashanah, “Financial Regulation Innovation Complexity and Systemic Risk” Systems Research Forum, World Scientific, Vol 5, No. 1 (2011) 73-87.
HIGH-FREQUENCY TRADING: A WHITE PAPER PRACTITIONER’S VERSION HIGH-FREQUENCY TRADING: A WHITE PAPER PRACTITIONER’S VERSION
6. solutions: the hft issues are information transmission zoning problems
The ideas KF&Y present are new; they base their recommendations on issues of financial information flow architecture, in the context of a) the intent of the Regulation NMS and b) HFT economics. They note that some HFT firms report just one losing day in more than one thousand days of HFT trading and that such a return pattern coincides more with a broker fee structure rather than a trading strategy return.
Therefore, they argue, the question of HFT’s place in a diverse ecosystem of traders can be perhaps rephrased as: Should HFT be viewed as a trader or an electronic specialist (e-specialist) liquidity provider? Classification as trader would imply that the economic return should come from the application of competitive algorithms in fair financial information order flows with no systematic information advantage, while classification as a liquidity provider would imply that HFT firms act as an e-specialist, with returns based on fees collected for providing liquidity and making the market.
With that as background, they praise the BCS8 proposal, but note that since the proposed solution is mechanical in nature, it may only transfer the problem from one place in the system to another. (BCS proposes to replace current price dynamics with frequent batch auctions; sealed-bid, uniform-price, double auction at discrete times. By discretizing the time step size, BCS claims the race to higher speed will be rendered of little competitive value.) KF&Y have a number of concerns. The first is that it may be possible for HFT “insider” information to still have an impact. The second is that, while changing from a continuous price discovery mechanism to frequent batch auction system may work in normal market situations, they say it is unpredictable what will happen during stress periods, such as those that result from market-moving news combined with high-volume equities. Third, they note the difficulty of coordinating the options market associated with the underlying equities and ask whether the options market would also have to become a frequent batch option market, synchronized with the underlying asset market? Fourth, they note there is a material cost to re-architecting the information system to move to frequent batch auctions.
Finally, they predict that financial engineering would quickly evade the purpose of the batch auction through the creation of an option based on the price of a batch at a specific time. Those options themselves would trade continuously, at high frequency, so the result would be that HFT would be based on speculation about what sealed bids have already streamed inside the batch, rather than the existing speculation about what is streaming as exchange orders.
While they note that there may be counter-arguments by the authors for each of the concerns, they are enough to cause them to adopt a different philosophy. Consistent with their definition of the issue as one of fairness and asymmetric information, they reformulate the concept of insider information in terms of information metrics. Using such metrics means that the claims against HFT practices can be understood with the introduction of the concept of information transmission distance zoning. They define information transmission distance as the average time it takes for information packets to travel between A and B. In most cases it coincides with the familiar idea of latency (including throughput). The distance is defined in terms of “average time”-- not space -- which allows for the possibility of having two points that are farther apart in physical space distance to be closer in information transmission distance, due to faster connections due to better technology and/or transmission protocols. Therefore, information transmission distance measures a market participant’s access to actionable information as a function of both location and technology. In the HFT context, the key question is whether a specific HFT firm has a shorter information transmission distance than is available to the market at large.
Interestingly, KF&Y point out that the regulatory framework which governs the trading markets, the Securities and Exchange Commission’s Regulation NMS, is philosophically compatible with the idea, though the SEC has never defined a metric like information transmission distance to measure whether or not participants were in conformance. In Regulation NMS, the “Adopted Rule 603(a) establishes uniform standards for distribution of both quotations and
trades. The standards require an exclusive processor, or a broker or dealer with respect to information for which it is the exclusive source, that distributes quotation and transaction information in an NMS stock to a securities information processor (“SIP”) on terms that are fair and reasonable. In addition, those self-regulatory organizations, brokers, or dealers that distribute such information to a SIP, broker, dealer, or other persons are required to do so on terms that are not unreasonably discriminatory.”9
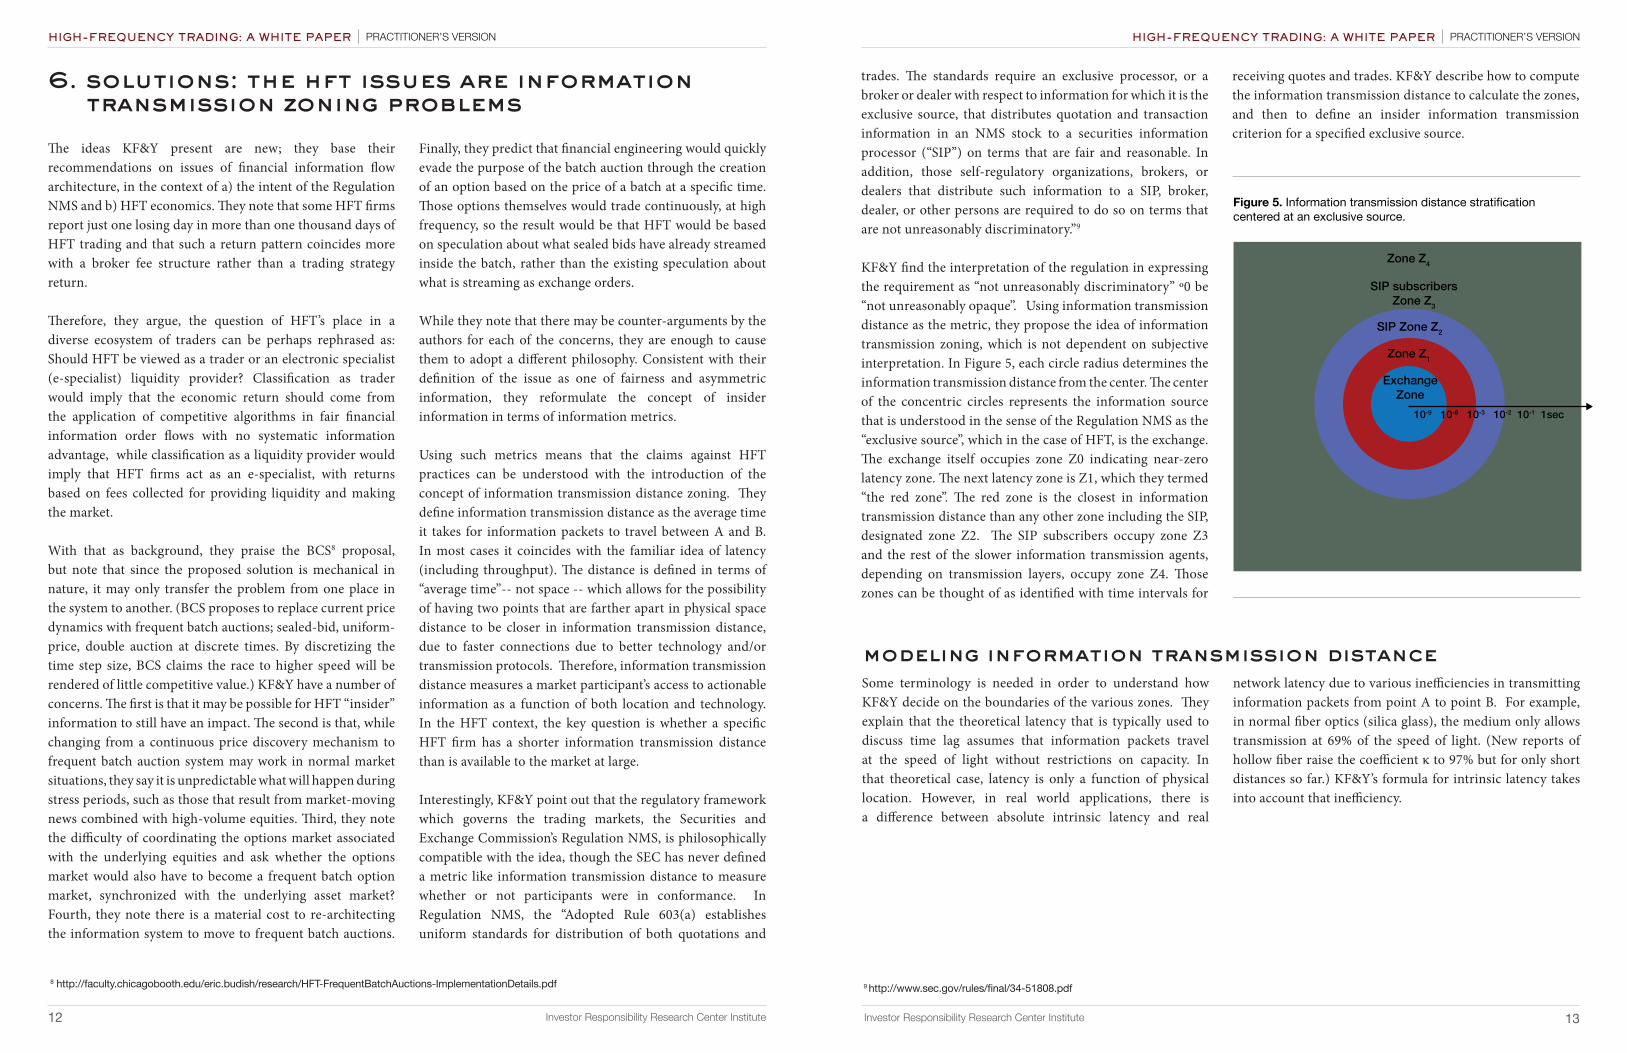
KF&Y find the interpretation of the regulation in expressing the requirement as “not unreasonably discriminatory” º0 be “not unreasonably opaque”. Using information transmission distance as the metric, they propose the idea of information transmission zoning, which is not dependent on subjective interpretation. In Figure 5, each circle radius determines the information transmission distance from the center. The center of the concentric circles represents the information source that is understood in the sense of the Regulation NMS as the “exclusive source”, which in the case of HFT, is the exchange. The exchange itself occupies zone Z0 indicating near-zero latency zone. The next latency zone is Z1, which they termed “the red zone”. The red zone is the closest in information transmission distance than any other zone including the SIP, designated zone Z2. The SIP subscribers occupy zone Z3 and the rest of the slower information transmission agents, depending on transmission layers, occupy zone Z4. Those zones can be thought of as identified with time intervals for
receiving quotes and trades. KF&Y describe how to compute the information transmission distance to calculate the zones, and then to define an insider information transmission criterion for a specified exclusive source.
8 http://faculty.chicagobooth.edu/eric.budish/research/HFT-FrequentBatchAuctions-ImplementationDetails.pdf
12 Investor Responsibility Research Center Institute Investor Responsibility Research Center Institute 13
Figure 5. Information transmission distance stratification centered at an exclusive source.
Zone Z4
SIP subscribersZone Z3
SIP Zone Z2
Zone Z1
Exchange Zone
10-9 10-6 10-3 10-2 10-1 1sec
modeling information transmission distanceSome terminology is needed in order to understand how KF&Y decide on the boundaries of the various zones. They explain that the theoretical latency that is typically used to discuss time lag assumes that information packets travel at the speed of light without restrictions on capacity. In that theoretical case, latency is only a function of physical location. However, in real world applications, there is a difference between absolute intrinsic latency and real
network latency due to various inefficiencies in transmitting information packets from point A to point B. For example, in normal fiber optics (silica glass), the medium only allows transmission at 69% of the speed of light. (New reports of hollow fiber raise the coefficient κ to 97% but for only short distances so far.) KF&Y’s formula for intrinsic latency takes into account that inefficiency.
9 http://www.sec.gov/rules/final/34-51808.pdf
HIGH-FREQUENCY TRADING: A WHITE PAPER PRACTITIONER’S VERSIONHIGH-FREQUENCY TRADING: A WHITE PAPER PRACTITIONER’S VERSION
computing information transmission distanceIn addition to intrinsic latency, KF&Y define technology latency, which accounts for delays in transmitting information due to servers, protocols and bandwidth.
Decoupling intrinsic latency and technology latency allows the authors to decompose information transmission distance into intrinsic latency and technological latency. If the technologies connecting A and B to the information source are identical, then the information transmission distance is purely a function of physical distance and it is exactly equal to the intrinsic latency . On the other hand, if two points have the same physical distance from the information source and the same fiber optics, then the information transmission distance is purely a function of technology connecting A and B to the information source, i.e., it is equal to the technology latency. In that case, if A has a superior technology, A is closer to the information source than B in information transmission distance and vice versa.
For example, if the SIP is located 50 miles away from the exchange and the HFT units are co-located at 1 mile away from the exchange and both are using the same exact technological capabilities, the same Internet Protocols, the same packet size, and the same types of servers, then the advantage is purely
physical location distance. When you calculate the information transmission distance for the SIP and the HFT, you find that the HFT has less information transmission distance than the SIP, so the HFT is in the red zone.11
Alternately, suppose that A is closer to the information source than B in physical distance. Then A has an intrinsic latency advantage. However, suppose that B possesses superior technology connecting it to the information source than A. Theoretically one can make up for intrinsic latency deficiency by having sufficient technology advantage, which is why KF&Y reject arguments of asymmetric information based solely on physical distance. On the other hand, they note that in the real world, sometimes technology cannot compensate for colocation, and, more importantly, co-location in the case of HFT is usually associated with up-to-date superior technology so that both the decreased intrinsic latency and the decreased technology latency are advantages. This generally results in the information transmission distance providing a systematic advantage to the HFT, which they term high frequency insider information. That allows the HFT units to have sufficient time advantage to react to information and to convert it dynamically, inside the micro-time frame of the market order flows, into cash flows for the HFT units.
14 Investor Responsibility Research Center Institute Investor Responsibility Research Center Institute 15
10 KF&Y calculate information transmission distance for point A in the network and information source E as: DE(A) = L0(x) + T(A), where the intrinsic latency L0(x) accounts for the universal “physics time-tax on information transmission” represented at least by the limit of the speed of light in vacuum as an upper bound for information travel—courtesy of Einstein. The excess transmission distance T(A) is a function of network technology connecting point A and source E and server transmission-receiving technology to achieve throughput.
11 The actual information transmission distance is calculated as follows: The identical protocols, say TCP, require an information handshake and validation, which doubles the distance for both the SIP and the HFT. Suppose further that the speed of light is as it is in vacuum (κ=1) given at 186,282.40 mi/second. Then the information transmission distance of the SIP from the exchange is 100/186,282.40= 0.000536819 second while the information transmission distance of the SIP from the exchange is 2/186,282.40= 0.0000107364 second. The advantage that HFT would have on a generic SIP message is the difference between the two distances, which is 0.00052 second or half a millisecond. Changing the TCP to UDP for HFT affects the latency difference approximately 1 microsecond but it allows for maximum flow, which is necessary for HFT to accommodate streaming orders and cancellations. In terms of zones, the HFTs in this example have |z1|=0.0000107364 while the SIP has |z2|=0.000536819 in their ideal cases. In this example since |z1|<|z2|, the HFT unit is in the red zone.
insider information transmission criterionThe authors explain that the SIP provides the “National Best Bid and Offer”, or best price, as described by the SEC’s Regulation NMS. When an HFT unit places itself between the exclusive source and the SIP in terms of information transmission distance, it gains systematic insider information. Having defined information transmission distance and demonstrated how to measure it, KF&Y suggest that it can be used as a metric to determine a criterion for a zone of systemic insider information transmission advantage (the red zone): “Given an exclusive source E, SIP, and HFT unit, then the HFT unit has insider information transmission access if and only if d* (HFT,SIP) > 0. The possibility of converting positively or negatively on the insider information transmission is irrelevant to the criterion or the designation. It is also irrelevant to the question of insider information whether the HFT unit provides liquidity or takes liquidity.”
In the case where there is insider information transmission, they say that the HFT unit resides in the information transmission red zone (Z1) as in Figure 5. On the other hand, if the information transmission distance to the HFT is more than that of the SIP, then the HFT or the algorithmic unit resides in a zone with no insider information transmission access.
Systemic latency defines the minimum information transmission distance separating all market participants from the exclusive source. Any access given to agents, including HFT units, not classified as an e-specialist that is part of the exclusive source, below the systemic latency constitutes a systematic arbitrage that results from HF insider information available in the red zone. The systemic latency as a lower bound on minimum information transmission induces a natural upper bound on the frequency of HF trading beyond which there is no asymmetric information, i.e., all SIP subscribers have a reasonable and fair access, which complies with the intent of
the Regulation NMS. All associated activities such as fronting trades, skewing the microstructure price discovery by order posting and cancellation or quote stuffing and other practices would be of random competitive advantage when all electronic trading units are operating at or above the systemic latency. (HF&L make it clear that the actual measure of systemic latency is dynamic: As the technology of the SIP is upgraded, the systemic latency becomes smaller.)
Finally, KF&Y suggest that existing regulation – specifically that which governs specialists – should be used to define which HFTs be allowed in the red zone so as to maintain the liquidity improvement that HFT provides to the marketplace generally. To negate any unfair informational advantage those red zone-residing HFTs would be designated e-specialists. The SEC definition of a specialist says that it is a member of the stock exchange, whose role is to facilitate trading in certain stocks and to maintain a “fair and orderly market” in the stocks they trade. The rules of the exchange prohibit specialists from trading ahead of investors who have placed orders to buy or sell a security at the same price.12 In 1935, there was a study by The Twentieth Century Fund that concluded that “specialists, as well as other exchange members, should be permitted to function either as traders or as brokers, but not both.”13 They explain that an HFT unit that functions primarily as a liquidity provider is closer in classification to being an e-specialist broker. On the other hand, an HFT unit that makes its returns from frequent trades based on directional price movements and pure algorithmic mechanisms should be classified as a trader. Providing a clear separation of the specialist and trader roles suggests that a high frequency trader can only be allowed to be in the red zone if it accepts designation as an e-specialist. Other HFT units can and should be permitted to compete outside the red zone, with all technological and algorithmic advantages they can muster.
12 https://www.sec.gov/answers/specialist.htm13 The Twentieth Century Fund, Inc., The Security Markets 685 (1935). Also see “the Stock Exchange Specialist: An Economic and Legal Analysis” by Nicholas Wolfson and Thomas A. Russo.
HIGH-FREQUENCY TRADING: A WHITE PAPER PRACTITIONER’S VERSION HIGH-FREQUENCY TRADING: A WHITE PAPER PRACTITIONER’S VERSION
7. conclusionsKhashanah, Florescu, and Yang (KF&Y) provide a useful overview of the issues high frequency traders present for the marketplace in general and non-high-frequency traders in specific. Following a literature review and then a survey of HFT participants and observers, they provide new observations about how HFT affects the marketplace. While they find that HFT provides liquidity to high-volume stocks, they note that they may contribute to a perception of unfairness by exploiting systematic information asymmetry.
Through a granular examination of the physics of how quotes and trades are transmitted, they introduce the idea of information transmission distance, and then use that to define zones of information availability. Quite logically, they suggest that market participants within the “red zone” (the zone in which market participants can obtain quotes and trades before they become generally available through a regulated NBBO
provider) should be registered as, and regulated as specialists. Conversely, they suggest that HFTs (and others) located outside the red zone should be able to compete using whatever technological, locational, or informational skills they possess.
The advantage of KF&Y’s approach is that it allows the natural adaptation of the financial system to emerging technology while creating a fair playing field and uses existing regulation. They suggest that purely mechanical solutions will create financial plumbing problems or will transfer the problem to another point in the information chain. A successful proposal allows for innovation complexity to appear and enables the system to contain it and benefit from it. They believe that their solution will build an adaptive transparent financial information flow architecture that complies with regulation, achieves markets objectives, and maintains credibility among stakeholders.
16 Investor Responsibility Research Center Institute
HIGH-FREQUENCY TRADING: A WHITE PAPER PRACTITIONER’S VERSION