Embed Size (px)
Citation preview
1
HIGH-INTEREST LOANS AND CLASS: DO PAYDAY AND TITLE LOANS REALLY SERVE THE MIDDLE
CLASS?
Nathalie Martin*
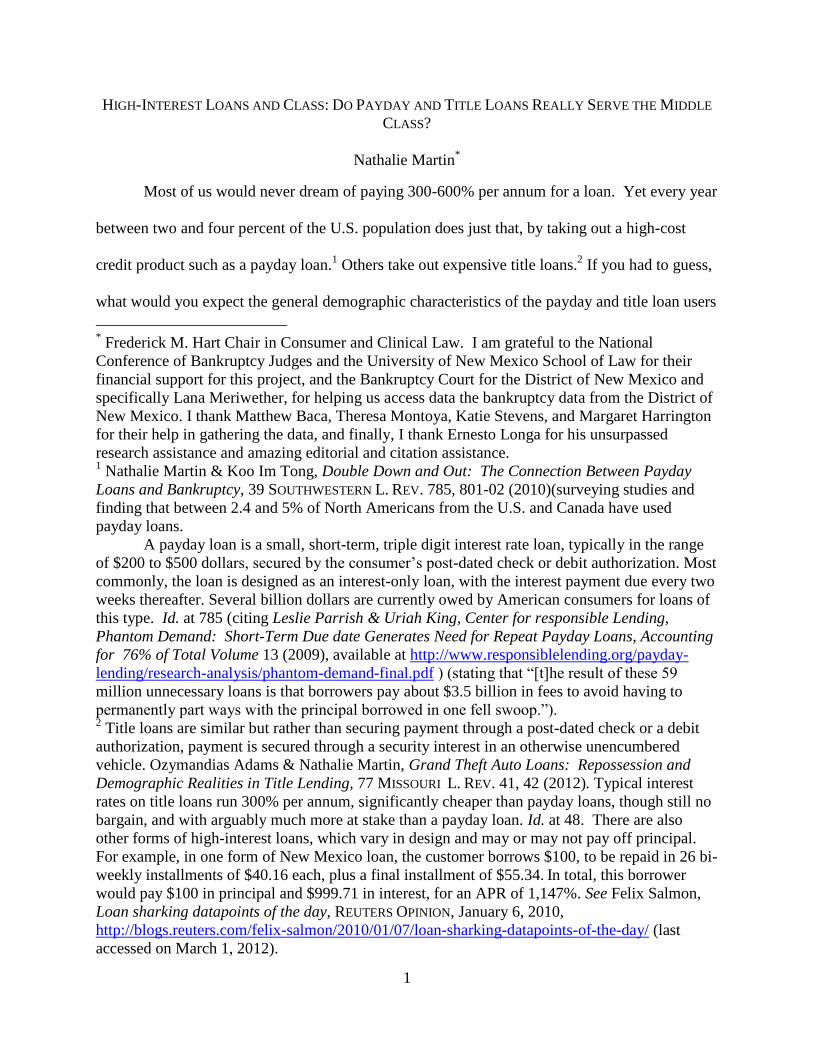
Most of us would never dream of paying 300-600% per annum for a loan. Yet every year
between two and four percent of the U.S. population does just that, by taking out a high-cost
credit product such as a payday loan.1 Others take out expensive title loans.
2 If you had to guess,
what would you expect the general demographic characteristics of the payday and title loan users
* Frederick M. Hart Chair in Consumer and Clinical Law. I am grateful to the National
Conference of Bankruptcy Judges and the University of New Mexico School of Law for their
financial support for this project, and the Bankruptcy Court for the District of New Mexico and
specifically Lana Meriwether, for helping us access data the bankruptcy data from the District of
New Mexico. I thank Matthew Baca, Theresa Montoya, Katie Stevens, and Margaret Harrington
for their help in gathering the data, and finally, I thank Ernesto Longa for his unsurpassed
research assistance and amazing editorial and citation assistance. 1 Nathalie Martin & Koo Im Tong, Double Down and Out: The Connection Between Payday
Loans and Bankruptcy, 39 SOUTHWESTERN L. REV. 785, 801-02 (2010)(surveying studies and
finding that between 2.4 and 5% of North Americans from the U.S. and Canada have used
payday loans.
A payday loan is a small, short-term, triple digit interest rate loan, typically in the range
of $200 to $500 dollars, secured by the consumer‘s post-dated check or debit authorization. Most
commonly, the loan is designed as an interest-only loan, with the interest payment due every two
weeks thereafter. Several billion dollars are currently owed by American consumers for loans of
this type. Id. at 785 (citing Leslie Parrish & Uriah King, Center for responsible Lending,
Phantom Demand: Short-Term Due date Generates Need for Repeat Payday Loans, Accounting
for 76% of Total Volume 13 (2009), available at http://www.responsiblelending.org/payday-
lending/research-analysis/phantom-demand-final.pdf ) (stating that ―[t]he result of these 59
million unnecessary loans is that borrowers pay about $3.5 billion in fees to avoid having to
permanently part ways with the principal borrowed in one fell swoop.‖). 2 Title loans are similar but rather than securing payment through a post-dated check or a debit
authorization, payment is secured through a security interest in an otherwise unencumbered
vehicle. Ozymandias Adams & Nathalie Martin, Grand Theft Auto Loans: Repossession and
Demographic Realities in Title Lending, 77 MISSOURI L. REV. 41, 42 (2012). Typical interest
rates on title loans run 300% per annum, significantly cheaper than payday loans, though still no
bargain, and with arguably much more at stake than a payday loan. Id. at 48. There are also
other forms of high-interest loans, which vary in design and may or may not pay off principal.
For example, in one form of New Mexico loan, the customer borrows $100, to be repaid in 26 bi-
weekly installments of $40.16 each, plus a final installment of $55.34. In total, this borrower
would pay $100 in principal and $999.71 in interest, for an APR of 1,147%. See Felix Salmon,
Loan sharking datapoints of the day, REUTERS OPINION, January 6, 2010,
http://blogs.reuters.com/felix-salmon/2010/01/07/loan-sharking-datapoints-of-the-day/ (last
accessed on March 1, 2012).
2
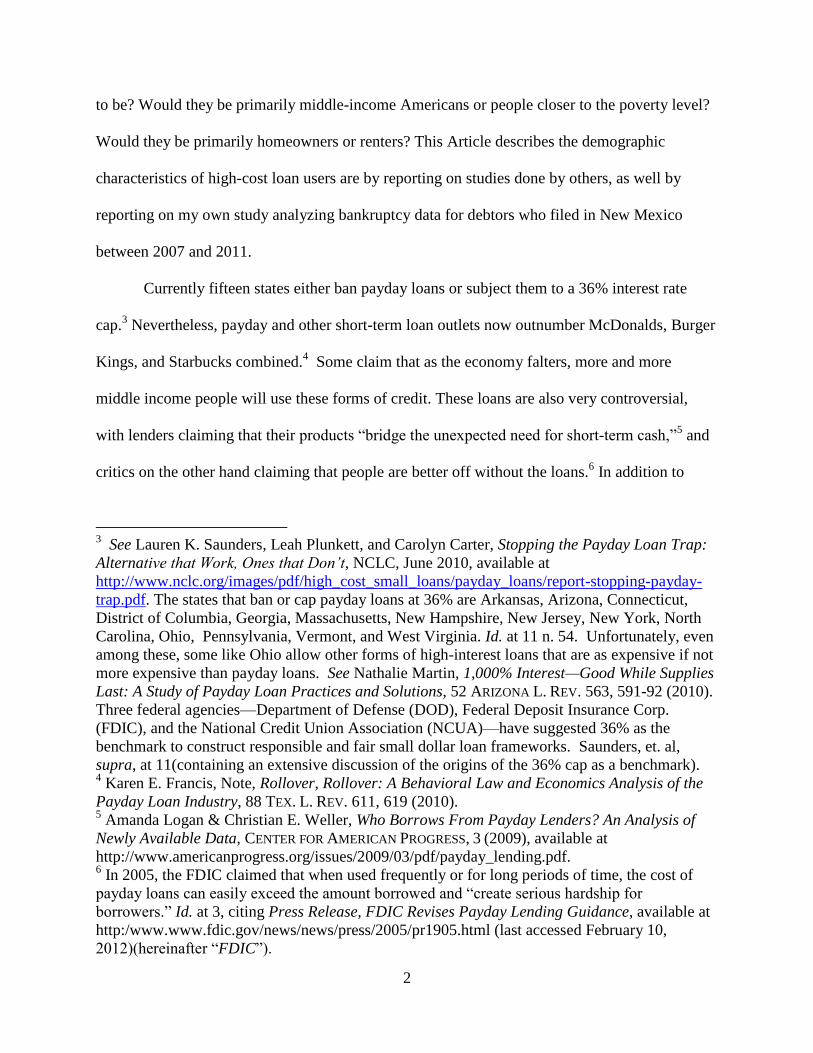
to be? Would they be primarily middle-income Americans or people closer to the poverty level?
Would they be primarily homeowners or renters? This Article describes the demographic
characteristics of high-cost loan users are by reporting on studies done by others, as well by
reporting on my own study analyzing bankruptcy data for debtors who filed in New Mexico
between 2007 and 2011.
Currently fifteen states either ban payday loans or subject them to a 36% interest rate
cap.3 Nevertheless, payday and other short-term loan outlets now outnumber McDonalds, Burger
Kings, and Starbucks combined.4 Some claim that as the economy falters, more and more
middle income people will use these forms of credit. These loans are also very controversial,
with lenders claiming that their products ―bridge the unexpected need for short-term cash,‖5 and
critics on the other hand claiming that people are better off without the loans.6 In addition to
3 See Lauren K. Saunders, Leah Plunkett, and Carolyn Carter, Stopping the Payday Loan Trap:
Alternative that Work, Ones that Don’t, NCLC, June 2010, available at
http://www.nclc.org/images/pdf/high_cost_small_loans/payday_loans/report-stopping-payday-
trap.pdf. The states that ban or cap payday loans at 36% are Arkansas, Arizona, Connecticut,
District of Columbia, Georgia, Massachusetts, New Hampshire, New Jersey, New York, North
Carolina, Ohio, Pennsylvania, Vermont, and West Virginia. Id. at 11 n. 54. Unfortunately, even
among these, some like Ohio allow other forms of high-interest loans that are as expensive if not
more expensive than payday loans. See Nathalie Martin, 1,000% Interest—Good While Supplies
Last: A Study of Payday Loan Practices and Solutions, 52 ARIZONA L. REV. 563, 591-92 (2010).
Three federal agencies—Department of Defense (DOD), Federal Deposit Insurance Corp.
(FDIC), and the National Credit Union Association (NCUA)—have suggested 36% as the
benchmark to construct responsible and fair small dollar loan frameworks. Saunders, et. al,
supra, at 11(containing an extensive discussion of the origins of the 36% cap as a benchmark). 4 Karen E. Francis, Note, Rollover, Rollover: A Behavioral Law and Economics Analysis of the
Payday Loan Industry, 88 TEX. L. REV. 611, 619 (2010). 5 Amanda Logan & Christian E. Weller, Who Borrows From Payday Lenders? An Analysis of
Newly Available Data, CENTER FOR AMERICAN PROGRESS, 3 (2009), available at
http://www.americanprogress.org/issues/2009/03/pdf/payday_lending.pdf. 6 In 2005, the FDIC claimed that when used frequently or for long periods of time, the cost of
payday loans can easily exceed the amount borrowed and ―create serious hardship for
borrowers.‖ Id. at 3, citing Press Release, FDIC Revises Payday Lending Guidance, available at
http:/www.www.fdic.gov/news/news/press/2005/pr1905.html (last accessed February 10,
2012)(hereinafter ―FDIC‖).
3
charging high interest rates, payday lenders have been criticized for questionable collection7
tactics and for targeting minorities.8 Lenders have also been criticized for targeting the poor who
are not in a position to absorb the tremendous cost of these loans, or to pay off a lump-sum, non-
amortizing, interest-only, loans.9 As the FDIC has noted, ―providing high-cost, short term credit
on a recurring basis to customers with long-term credit needs is not responsible lending.‖10
The
most troubling aspect of payday and title loans is the rollover, meaning the tendency for
customers to keep the loan for very long periods, rather than using them for short-term needs.11
7 See Chris Mahon, Borrowing Against the Future, THE BROWNSVILLE HERALD, September 18,
2005 http://old.brownsvilleherald.com/ts_comments.php?id=67143_0_10_0_C (last accessed on
March 1, 2012 (reporting on an intimidation sheet,‖ used to collect more fees and mislead
customers. As the site claims, ―you may be surprised at the number of persons unable to manage
their finances,‖ the plan's overview says. Among other tactics, the plan offers the following
advice to prospective payday lenders:
— ―Help them visualize a uniformed, gun toting U.S. Marshal arriving at their place of
employment (to collect money). Emphasize to them that this U.S. Marshal will first ask for
(their) immediate supervisor!‖ 8 Alice Gallmeyer & Wade T. Roberts, Payday lenders and economically distressed
communities: A Spatial analysis of financial predation, 46 SOCIAL SCIENCE J. 521, 529 (2008)
(discussing lending to racial minorities; Uriah King, Wei Li, Delvin Davis, and Keith Ernst, Race
Matters: The Concentration of Payday Lenders in African American Neighborhoods in North
Carolina, CENTER FOR RESPONSIBLE LENDING, March 22, 2005, at 16, available at
http://www.responsiblelending.org/north-carolina/nc-payday/research-
analysis/racematters/rr006-Race_Matters_Payday_in_NC-0305.pdf. See also Martin and Tong,
supra note 1, at 786 n.9 (reporting on In Valued Services of Kentucky v. Watkins,
Commonwealth of Kentucky, Court of Appeals, NO. 2008-CA-001204-MR, in which a customer
was trapped in a payday lender‘s store by a store employee, that proceeded to called her manager
and say ―I have a black guy over here that refuses to pay his bill and he‘s not going to leave until
he does.‖ Watkins later sued for false imprisonment. Id. But see Donald P. Morgan and Kevin J.
Pan, Do Payday Lender Target Minorities, Federal Reserve Bank of New York (Feb. 8, 2012),
http://libertystreeteconomics.newyorkfed.org/2012/02/do-payday-lenders-target-
minorities.html.(claimingthat payday lenders do not target minorities by demonstrating that the
income and other demographics for all payday loan users are the same, regardless of race). 9 Michael A. Stegman & Robert Ferris, Payday Lending: A Business Model that Encourages
Chronic Borrowing, 17 ECON. DEV. JOUR.8, 19-21 (2003). 10
FDIC, supra note 6. 11
Consumer groups and lenders alike acknowledge that the loans are frequently rolled over and
that many people use the loans continuously. A 2007-2008 study commissioned by the State of
California collected data from lenders who reported that 80% of their business is attributable to
4
This symposium Article attempts to answer the question of whether payday and title
lenders serve primarily the working poor, as some critics claim, or the middle class, as the
industries claim. The payday lending industry has long relied on a 2001 study to assert that its
clients are primarily middle income, and by implication, middle class.12
This middle class claim
has been repeated endlessly in various incarnations,13
even though most other study data to date
contradicts this claim.14
Title lenders and the scholars that support them also claim that title loan
customers are primarily middle class, which claim is also inconsistent with data collected by
states in the lending process itself.15
This Article attempts to collect all available data on payday loan and title loan customer
demographics from prior studies. It then reports on a study of bankruptcy filers in the state of
New Mexico from 2007-2011, which compares bankruptcy debtors with payday loans to those
without payday loans on income, home ownership, and home values. It then separates out all
homeowners in the sample and measures whether the homeowners‘ use of payday loans
increases after the 2008 recession.
repeat customers. 2007 Department of Corporations: Payday Loan Study, iv (December 2007,
updated June 2008), available at
http://www.corp.ca.gov/Laws/Payday_Lenders/Archives/pdfs/PDLStudy07.pdf. 12
Gregory Elliehausen & Edward C. Lawrence, Credit Research Ctr., Payday Advance Credit in
America: An Analysis of Consumer Demand 28 (2001), 29, available at
http://sbpm.gwu.edu/research/centers/fsrp/pdf/Mono35.pdf. (claiming that 51% of payday
borrowers made $25,000 - $50,000 a year and that an alarming 77% of the payday loan users
made over $25,000). Less than 72% of the general population made an income this high three
years later, according to Census data. See Household Income in the United States, WIKIPEDIA,
http://en.wikipedia.org/wiki/Household_income_in_the_United_States (showing by chart that
28.22% of the general population made $25,000 or less in 2003, meaning that only 71.88% made
more that $25,000 in 2003, three years after these gentlemen gathered their data. Could the
payday loan users actually be better off financially than the population as a whole? This makes
little sense. 13
See supra note -____ -___and accompanying text. 14
See supra note -____ -___and accompanying text. 15
See supra note -____ -___and accompanying text.
5
This Article starts by discussing how and why lenders have claimed to serve the middle
class. It then describes how scholars define the middle class and the typical indicia of middle
class America. The paper then summarizes the demographic data gathered to date on payday and
title loan customers, focusing on income and home ownership rates. Next, this Article describes
the methodology and results of my own study of payday demographics, which analyses data
from the Bankruptcy Court for the District of New Mexico from 2007-2011.16
In this study, I separate out debtors who list one or more payday loans on their
bankruptcy schedules and compares them to all bankruptcy debtors in the same period, based
upon some of the indicia of the middle class identified in Part II below. I then separate out
homeowners and compare their rate of payday loan usage year by year to see if there is an
increase post-recession. This Article ends with the results of this modest study, which conclude
that bankruptcy debtors who list payday loans are far less likely to own their own homes and
overall, have lower incomes than bankruptcy debtors who do not list payday loans. It also
concludes that the bankruptcy debtors in the sample who also own homes did not turn to payday
loans in higher numbers after the 2008 crisis.
I. Dancing Demographics: The Genesis of the Middle Class Myth
The payday loan and title loan industries have long insisted that their products are used
primarily by middle class. For example, according to the Community Financial Services
Association of America (―CFSA‖) a payday industry trade association representing over half of
16
Since bankruptcy debtors are known to come primarily from the middle class rather than the
poor, a study of the debts and assets of bankruptcy debtors is uniquely suited to challenging the
middle class myth. TERESA A. SULLIVAN, ELIZABETH WARREN AND JAY LAWRENCE
WESTBROOK, THE FRAGILE MIDDLE CLASS: AMERICANS IN DEBT 6 (2000) (noting that
―bankruptcy is a largely middle-class phenomenon).‖

6
the nearly 24 thousand payday advance locations nationally,17
―payday advance customers
represent the heart of America‘s middle class.‖18
The reason for this insistence appears to be that
if indeed these are primarily middle class products, those who provide these loans do not - as is
sometimes claimed - take advantage of the poor.19
Thus, there is apparently no greater need to
regulate these credit products than any other middle class credit product.20
It may seem obvious that few middle class people would choose to pay 300% interest or
more for a short-term credit product. Nevertheless, payday and title lenders, and scholars who
have received research funds from these industries, repeatedly claim that their clientele are
drawn primarily from the middle class.21
If an attempt is made to substantiate these claims about
17
See Colleen Kelley, The Payday Loan Industry and CFSA, SUITE101.COM (July 21, 2011),
http://colleenkelley.suite101.com/the-payday-loan-industry-and-the-cfsa-a380854. 18
CFSA claims on its web page that the majority of payday advance customers earn between
$25,000 and $50,000 annually and that 2% of their customers own their own homes. Customer
Demographics, COMMUNITY FINANCIAL SERVICES ASSOCIATION OF AMERICA,
http://cfsaa.com/about-the-payday-advance-industry/customer-demographics.aspx (last visited
March 2, 2012) (citing Gregory Elliehausen and Edward C. Lawrence, supra note 12). 19
Michael Kenneth, Payday Lending: Can ―Reputable Banks End the Cycle?, 42 U.S.F. L. REV.
659, 664 (2008). As Professor Kenneth states:
The question of who payday lending customers are, primarily regarding their income
levels and borrowing characteristics, is in dispute between consumer advocates and the
payday lending industry. An industry under constant scrutiny does not want to appear to
be taking advantage of a vulnerable customer base. Instead, the industry describes its
customers as middle-income consumers who need short-term credit for a temporary
problem. As one participant in a forum on payday lending described the industry's view:
―They say their customers are solidly middle class and don't need ‗protection.‘ In short,
leave them alone.‖ (citations omitted).
Id. 20
Recent credit card legislation really turns this argument on its head, because credit cards are
now heavily regulated and these products are not. 21
For a few of the many statements made on payday lending websites, see Payday Loan Myths,
USPAYDAYCENTER, http://uspaydaycenter.com/payday-loan-myths (last visited Mar. 2, 2012)
(stating that ―most people receiving such loans make between $25,000 and $50,000 a year‖);
Your On Line Payday Center, PCA PERSONAL CASH ADVANCE,
http://www.personalcashadvance.com/payday-loans.html (last visited on Mar. 2, 2012) (stating
that it is ―debunking‖ payday loan myths and that myths and that ―[m]ost cash advance
7
middle class clientele, most sources refer back to an industry- sponsored, and heavily industry-
sited, study published in 2001.22
This study, completed through phone calls to payday customers
up to one year after they took out a payday loan, asked customers to self-report their income and
then recorded this data.23
The study, now eleven years old, found that over half of payday loan consumers have
incomes ranging from $25,000 to $49,999.24
The study further reported that two-thirds of payday
loan consumers are under the age of forty-five, that the majority are either married or living with
a significant other,25
that most have high-school diplomas, and that 36% have attended some
college.26
Based on these and similar statistics, the industry claims that its consumers are middle
class Americans who just need occasional help to cover emergency expenses.27
This claim is
critical to the payday lending industry‘s assertion that it does not take advantage of the poor.
borrowers earn $25,000-$50,000 annually‖); see also Dick Hughes, Advance America Banks on
Surprise, JOURNAL WATCHDOG, (Oct. 30, 2011, 8:18
PM),http://www.journalwatchdog.com/business/ 1290-advance-america-banks-on-surprise
(quoting an industry study as saying that ―[t]he Community Financial Services Association
(CFSA), which represents payday lenders, cites research showing that two-thirds of payday
customers are under 45, 41% earn $25,000-$50,000 and 39% more than $40,000‖); Larry
Meyers, Payday Loans v. Installment Loans, PAYDAYLOAN FACTS BLOG (Jan. 1, 2011),
http://www.paydayloanfacts.com/blog/credit-options/payday-loans-vs-installment-loans/ (stating
that 63% of payday loan borrowers ―have annual household incomes of more than $25,000, with
46% earning $25,000 to $50,000 a year‖). 22
Gregory Elliehausen & Edward C. Lawrence, supra note 12, at 28, available at
http://faculty.msb.edu/prog/CRC/pdf/Mono35.PDF. Only two-fifths of the general adult
population lies within this income range. Id. Only 427 payday loan consumers, out of a sample
size of 5,364 consumers, completed the survey. Id. at 21. 23
Id. at 20-21. 24
Id. at 28-29. 25
Id at 29. 26
Id. at 33, tbl.5-6. The study also concluded that 75% of borrowers thought the government
should regulate these loans by capping interest and fees, Id. at 35, and large numbers
misunderstood the terms of the loan. Id. at 49. 27
See, e.g., Charles A. Bruch, Taking the Pay Out of Payday Loans: Putting an End to the
Usurious and Unconscionable Interest Rates Charged by Payday Lenders, 69 U. CIN. L. REV.
1257, 1271 (2001).
8
Various critiques have been made of the methodologies and results of the oft-cited
Elliehausen study. Naturally, telephone surveys such as the one used in the Elliehausen study do
not reach all customers. In this study, half those reached denied ever taking out a payday loan.28
Another 30% of those reached refused to be interviewed.29
Twice as many people denied taking
out a payday loan than took the survey.30
In all, only 427 interviews were taken from an original
sample of 5,400 people, creating a response rate of just 7.9%.31
This data is also less reliable
than data that coming directly from lenders or regulators because it is not corroborated with
documentary evidence.32
Focusing exclusively on the data on income, Ellieihausen‘s income data showing that
half the customers make between $25,000 to $50,000 are far higher than almost all other income
data collected from payday loan customers. Professor John Caskey, one of the first to study
payday lending extensively, notes that the customers who answered Elliehausen‘s phone survey
may have higher incomes than the average payday customers for a number of reasons. First,
these could be the customers with the most stable residential patterns or living conditions, given
that they were reachable by phone long after taking out the loans.33
Additionally, the customers
surveyed all got loans from large National lenders that only make payday loans. Customers who
get payday loans from check cashers and outlets that provide a broader range of services are
28
Elliehausen, supra note 12, at 21. 29
Id. 30
Id. 31
Id. 32
John P. Caskey, Payday Lending: New Research and the Big Question, (Research Dep't Fed.
Reserve Bank of Phila., Working Paper No. 10-32, 2010), to be produced in Oxford Handbook
of the Economics Poverty, available at http://ssrn.com/abstract=1696019 (generally
summarizing the debate on whether these loans are on balance, good or bad). 33
John P. Caskey, The Economics of Payday Lending 23 n.27 (Filene Research Institute 2002).
9
thought to be lower income individuals.34
As Dollar Financial explained in its 10-K, our
customers prefer to get loans in an office –like environment, compared to a check casher, which
typically involves getting the loan through bullet-proof glass.35
Switching to the middle class claims made by the title loan industry, while title lenders
have been far less vocal on this subject, this industry also relies on questionable data to conclude
that its customers are middle class. Professor Todd Zywicki claimed in one of the few scholarly
papers on title lending that based upon one New Mexico ―study,‖ title loan borrowers make on
average $50,000 a year.36
As Part II.B below shows, however, these claims are even more
dubious in the context of title loan customers, who overall appear to be even worse off
financially than payday loan customers.37
Finally, whether payday loan and title loan customers have always been predominantly
middle class or not, commentators and scholars have recently predicted that the financial crisis in
which we are currently embroiled has caused many more middle class people to use payday
loans.38
Most of the claims that payday loans are used by the middle class have been made by
34
Id. 35
Id. (citing Dollar Financial 2001 10-K, at 7). 36
In the context of title lending, see Todd Zywicki, See Todd Zywicki, Consumer Use and
Government Regulation of Title Pledge Lending, 22 LOY. CONS. L. REV. 425, 442
(2010)(―Consumer Use). A shorter version of this article appears in Todd Zywicki, Money to
Go, 33 REGULATION 32, 37 (2010), available at
http;//www.cato.org/pubs/regulation/regv33n2/regv33n2-7.pdf [hereinafter Money to Go], which
makes the same claim. See also Todd Zywicki & Gabriel Okolski, Potential Restrictions on
Title Lending, 62 MERCATUS ON POL‘Y 1, 1-2 (2009); WILLIAM J. VERANT, CONSUMER LENDING
STUDY COMMITTEE REPORT FOR THE FORTY FOURTH SESSION OF THE NEW MEXICO STATE
LEGISLATURE 36, submitted by the Financial Institutions division Director, as requested by
House Memorial (2000)(on file with author). 37
See supra notes __- -__ and accompanying text. 38
See e.g., Kim Christensen, Payday Loans Mushroom Among Middle Class, PITTSBURGH TRIB.
REV., January 11, 2009, available at
http://www.pittsburghlive.com/x/pittsburghtrib/business/s_606566.html#. This article claims that
―In years past, a worker might have asked his employer for an advance on his paycheck. Now,
10
industry itself, in an attempt to dispute claims that the industry takes advantage of the vulnerable
working class and poor.39
As one industry web site explains:
The perception of cash advance payday loans is that they are mainly used by low-income
persons. Recent news shows that fast cash loans are becoming more popular with the
middle class. Payday lenders report increased loan requests from middle class and
working families…. 40
A new study also debunks the mainstream perception that paydays
target low-income consumers.41
Another industry web site claims that ―a common myth is that payday loan consumers are
mostly poor, uneducated and African American. This stereotype is often used by politicians
with a driver's license, a pay stub and a checking account, he can walk into a typical payday loan
store, postdate a check for $300 and stroll out with $255 in cash after a $45 fee…No muss, no
fuss, no credit check.‖ The same article quotes Harvard Professor Elizabeth Warren as stating
that ―as the economy has worsened, payday loans have increasingly become crutches for those
higher up the economic scale.‖ ―More middle-class families use the loans "to put off the day of
reckoning," she said. "Too many families live with no cushion, so when something goes wrong,
they turn to payday lenders." See also Payday Loans Rush to Rescue the Middle Class,
PAYDAYLOANS (Jan. 9, 2010), http://www.paydayloans.org/payday-loans-rush-to-rescue-middle-
class, stating that ―as the economy has gotten worse, payday loans work their way up the
economic scale. Middle class families with little or no cushion left turn to payday loans to hold
off other creditors or to deal with emergency issues.‖ 39
Gaurav Bhola, Cash Advance Loans Attract Middle Class Crowd, MY PAYDAY CASH
ADVANCE LOANS.COM,
http://www.mypaydaycashadvanceloans.com/cash-advance-loans-attract-middle-class-
crowd.aspx (last visited Mar. 2, 2012). 40
Id. stating that ―as demand for these short-term personal loans expands, so does the consumer
demographic for the loans. In recent years, the annual fast cash loan volume has reached about
$40 billion. This can be explained by the growing popularity of payday loans and their use
beyond emergency funds. Many payday lenders such as Advance America have been opening
financial centers in middle class and upper class neighborhoods.‖ The article also claims that
―helped by financial deregulation, the payday industry has had an almost exponential expansion
in the past years. Additionally, due to the current economic atmosphere, more people have been
turning to personal loans to sustain themselves.‖ 41
Id., citing Donald P. Morgan & Michael R. Strain, Payday Holiday: How Households Fare
after Payday Credit Bans, Federal Reserve Bank of New York (Nov. 2007),
http://www.newyorkfed.org/research/staff_reports/sr309.html (revised Feb. 2008); Donald P.
Morgan, Michael R. Strain, and Ihab Seblani, Payday Credit Access, Overdrafts, and Other
Outcomes, copy on file with author, forthcoming in the JOURNAL OF MONEY, CREDIT, AND
BANKING (2012).
11
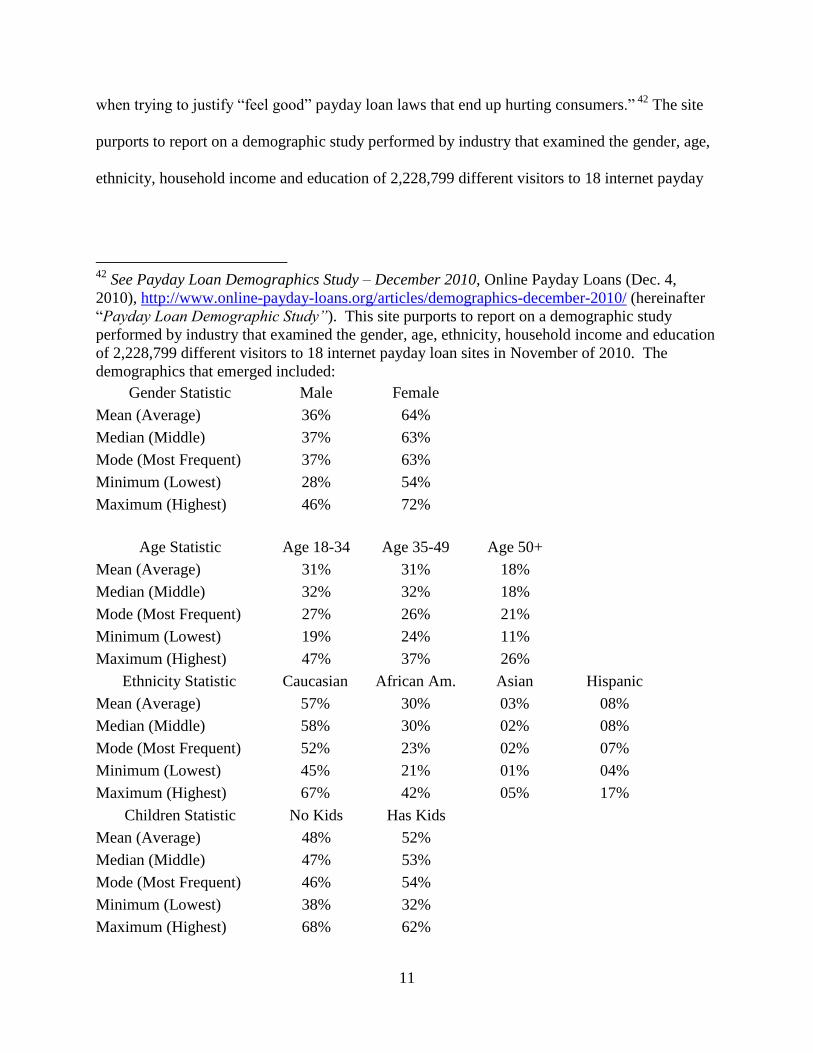
when trying to justify ―feel good‖ payday loan laws that end up hurting consumers.‖ 42
The site
purports to report on a demographic study performed by industry that examined the gender, age,
ethnicity, household income and education of 2,228,799 different visitors to 18 internet payday
42
See Payday Loan Demographics Study – December 2010, Online Payday Loans (Dec. 4,
2010), http://www.online-payday-loans.org/articles/demographics-december-2010/ (hereinafter
―Payday Loan Demographic Study‖). This site purports to report on a demographic study
performed by industry that examined the gender, age, ethnicity, household income and education
of 2,228,799 different visitors to 18 internet payday loan sites in November of 2010. The
demographics that emerged included:
Gender Statistic Male Female
Mean (Average) 36% 64%
Median (Middle) 37% 63%
Mode (Most Frequent) 37% 63%
Minimum (Lowest) 28% 54%
Maximum (Highest) 46% 72%
Age Statistic Age 18-34 Age 35-49 Age 50+
Mean (Average) 31% 31% 18%
Median (Middle) 32% 32% 18%
Mode (Most Frequent) 27% 26% 21%
Minimum (Lowest) 19% 24% 11%
Maximum (Highest) 47% 37% 26%
Ethnicity Statistic Caucasian African Am. Asian Hispanic
Mean (Average) 57% 30% 03% 08%
Median (Middle) 58% 30% 02% 08%
Mode (Most Frequent) 52% 23% 02% 07%
Minimum (Lowest) 45% 21% 01% 04%
Maximum (Highest) 67% 42% 05% 17%
Children Statistic No Kids Has Kids
Mean (Average) 48% 52%
Median (Middle) 47% 53%
Mode (Most Frequent) 46% 54%
Minimum (Lowest) 38% 32%
Maximum (Highest) 68% 62%
12
loan sites in November of 2010.43
Reporting on this industry ―study,‖ the site notes that ―a little
over half of all payday loan consumers have children 17 years of age or younger in their
household‖ and wonders aloud whether, taking into consideration that women outnumber men
two to one, how many payday loan consumers are single moms? 44
As Part II of this Article shows, these additional industry data on gender, age, children in
the household, and ethnicity show what non-industry studies show, that generally users tend to
be younger than average, disproportionately women with children, and also disproportionately
from minorities.45
On the question of income, however, which seems most pertinent to the
question of whether payday customers are primarily middle class, this web-based industry study
also appears to be an outlier. It claims that ―most payday loan consumers have an annual
household income of $30,000 to $60,000 and that ―about 22% earn over $60,000 and about 15%
over $100,000.‖ It further claims that ―only about 1 in 4 earn less than $30,000 and adds that
43
Id 44
Id. 45
On this last point, the site claims that ―most online payday loan consumers are Caucasian,
noting that on average, Caucasians outnumber African Americans by almost two to one.‖ Id.
This observation is made without pointing out that Caucasians outnumber minorities in the
general population. See Overview of Race and Hispanic Origin: 2010, 2010 CENSUS BRIEFS,
March 2011, at 4, Tbl. 1, available at http://www.census.gov/prod/cen2010/briefs/c2010br-
02.pdf (last accessed on March 4, 2010) (showing that as of 2010, 75.1% of the population was
white).
Another recent analysis of minority use of payday loans was done by Donald Morgan and
Kevin J. Pan of the Federal Reserve Bank of New York. See Morgan & Pan, supra note 8. In a
recent web article, these two Federal Reserve employees use the most recent Federal Reserve‘s
Survey of Consumer Finances (SCF), a triennial, nationally representative survey of about 4,400
households to study whether payday lending is actually more common among minority groups,
once one controls for non-racial demographics and for general overall financial condition. They
conclude that once we control for demographic and financial characteristics, the link between
payday credit usage and race is statistically insignificant. They use this data to attempt to
disprove the idea that payday lenders target minorities, by showing that people of lesser financial
means use these loans to the same extent regardless of their race. They acknowledge, however,
that minorities use these loans to a far greater extent than white people, as a percentage of the
population, something these web sites do not acknowledge.
13
―clearly, payday loans are not just for the poor.‖46
These income data are far different than that
collected by states and non-industry scholars, indicating that either these numbers are outliers or
that web based internet lending serves a different demographic.47
II. Indicia of the Middle Class
This section attempts to use the work of social scientists to define what is meant by the
phrase ―middle class,‖ in order to see if typical payday loan customers fit this definition. As a
starting point, social scientists sometimes break U.S. classes into four categories, upper class,
middle class, working class, and poor.48
When looking at self-reported data, only about 1% of the
population typically self-identifies as upper class, 67% report themselves as middle class or
upper-middle class, 35% self-report as working class, and just 7% self-report as poor.49
This is
true even though in 2007, 12.5% of Americans lived at or below the official poverty level.50
This
over reporting into the middle class suggests that the phrase may also be used by those who aspire
to middle class status, even if they have not reached that point in reality. It also suggests that self-
reporting may not be the most accurate way to measure middle class income.
As a recent Congressional Research Service (―CRS‖) study shows, there is no clear
consensus on what it means to be middle class, either as a government definition or a matter of
public opinion.51
Moreover, while it is not clear that middle class means middle income, most
studies of who comprises the middle class use income as the primary indicator of middle class
46
Payday Loan Demographics Study, supra, note 42. 47
The site claims at the end that ―this study is not definitive. It was never intended to be. We
simply wanted more data, less demagoguery.‖ Id. 48
See BRIAN W. CASHELL, CONG. RESEARCH SERV., RS 22627, WHO ARE THE MIDDLE CLASS?
(Updated 2008), 3, available at http://digitalcommons.ilr.cornell.edu/key_workplace/554/. 49
Id. (citing Class Matters: An Overview, New York Times May 15, 2005, available at
http//:www.nytimes.com/indexes/2005/05/15/national/class/index.html (last accessed on January
23, 2012) (hereinafter ―Class Matters‖). 50
CASHELL, supra note 48, at 3. 51
Id. at 1.
14
status. For example, the CRS study referenced above uses the median income as a starting point
for its analysis of the middle class.52
It notes that in 2007, just a few years after the Elliehausen
payday industry study, the median income for U.S. households was $50,233. It notes that it is
unclear how far below this income level would still be considered middle class.53
The report notes
that the U.S. Census Bureau has published figures for 2007 breaking down U.S. household
income into quintiles or fifths. Under the narrowest view of middle class, the middle class would
have an income of between $39,100 and $62, 000 which would consist of just the middle
quadrant.54
A more broad view of middle class would encompass all three of the middle quintiles
and range from $20,291 to $100,000.55
A 2007 New York Times study of self-reporting households concluded that comparing
survey responses with income data placed the lower end of the middle class at just over $40,000
in 2007.56
Taking this data and adding its own analysis, the CRS report concluded that:
No attempt to identify the middle class in the income distribution can be expected to
yield a precise answer. But the term is used so often that it is worth the effort to attach
some numbers to it. If the middle class is taken to be those who have more than enough
to afford basic necessities, it can be presumed to exclude those at or near the poverty
thresholds. Surveys indicate many people felt an income near $40,000 was the minimum
to be considered middle class. On the other end, surveys suggested that those with
income approaching $200,000 might still be considered middle class.57
This author thus finds income near $40,000 to be a minimum to be middle class in 2007. While
self-reported status has its issues, one‘s own opinion on which class they fall into is an important
indicator of a person‘s perception of their class.
52
Id. at 1-2. 53
Id. at 2. 54
Id. at 3. 55
Id. 56
Class Matters, supra note 49. 57
CASHELL, supra note 48, at 6 (citing Class Matters).
15
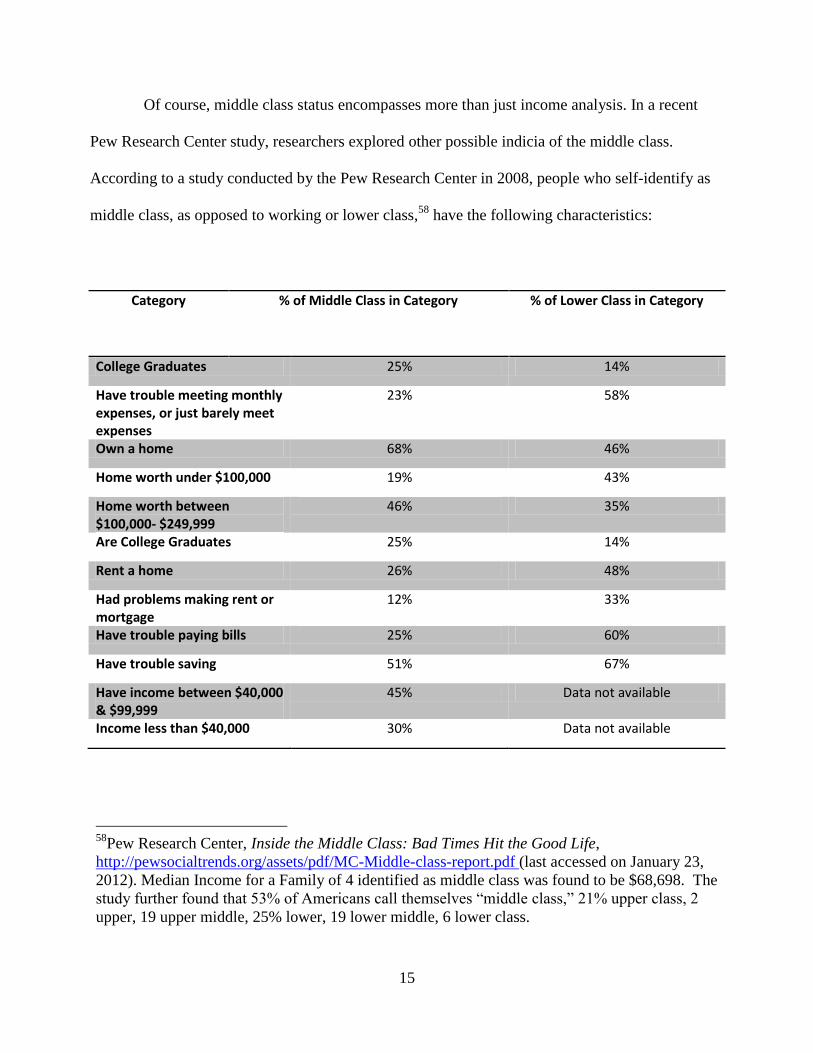
Of course, middle class status encompasses more than just income analysis. In a recent
Pew Research Center study, researchers explored other possible indicia of the middle class.
According to a study conducted by the Pew Research Center in 2008, people who self-identify as
middle class, as opposed to working or lower class,58
have the following characteristics:
Category % of Middle Class in Category % of Lower Class in Category
College Graduates 25% 14%
Have trouble meeting monthly expenses, or just barely meet expenses
23% 58%
Own a home 68% 46%
Home worth under $100,000 19% 43%
Home worth between $100,000- $249,999
46% 35%
Are College Graduates 25% 14%
Rent a home 26% 48%
Had problems making rent or mortgage
12% 33%
Have trouble paying bills 25% 60%
Have trouble saving 51% 67%
Have income between $40,000 & $99,999
45% Data not available
Income less than $40,000 30% Data not available
58
Pew Research Center, Inside the Middle Class: Bad Times Hit the Good Life,
http://pewsocialtrends.org/assets/pdf/MC-Middle-class-report.pdf (last accessed on January 23,
2012). Median Income for a Family of 4 identified as middle class was found to be $68,698. The
study further found that 53% of Americans call themselves ―middle class,‖ 21% upper class, 2
upper, 19 upper middle, 25% lower, 19 lower middle, 6 lower class.
16
Thus, in addition to income, other factors also lead one to conclude that he or she is middle class.
Home ownerships seems to be the second most common indicator of middle class status,
followed by education, and ability to meet one‘s expenses without difficulty.
According to a U.S. Department of Commerce Study, middle class Americans or those
aspiring to middle class status seek economic security, a home, and a secure retirement.59
They
want to protect their children‘s health and send them to college. They also would like to own a
car for very adult and be able to afford family vacations.60
This study claims that home
ownership is the most common aspiration of the middle class,61
but notes that income levels
alone are the most common defining measure of middle class status.62
A more nuanced view of the middle class can be found in a 2008 Pew Research Center
study in which researchers identified four middle classes, the Top of the Class, the Satisfied
Middle Class, the Anxious Middle Class, and the Struggling Middle Class.63
The researchers
asked groups of consumers which class they felt they belonged to, then did a cluster analysis of
how consumers answered a series of questions, looking for patterns in how self-identified middle
class Americans answered key survey questions.64
Based upon their findings in the cluster
59
See Middle Class in America, U.S. DEPARTMENT OF COMMERCE, ECONOMICS AND STATISTICS,
ADMINISTRATION- OFFICE OF THE VICE PRESIDENT OF THE UNITED STATES-MIDDLE CLASS TASK
FORCE (2010), 4-5 available at
http://www.esa.doc.gov/sites/default/files/reports/documents/middleclassreport.pdf (last accessed
on January 23, 2012). 60
Id. 61
Id. at 4. 62
Id. at 2. 63
Richard Morin, America’s Four Middle Classes, 1 (2008),
http://pewresearch.org/pubs/911/americas-four-middle-classes (last accessed on January 23,
2012). 64
These four groups are all part of the 53% majority of Americans who identified themselves as
―middle class‖ in a Pew telephone survey taken from Jan 24 through Feb. 19, 2008, of a
nationally representative sample of 2,413 adults. Id. at 2. The groups were revealed by a
17
analysis, the authors formed the four groups, which broke down statistically as follows: 53% in
Top of the Class, 25% in the Satisfied Middle Class, 23% in the Anxious Middle Class, and 17%
in the Struggling Middle Class.65
They found that one group in the middle class was doing quite well, typical in some ways
of the upper class.66
This group, the Top of the Class, was predominantly male,
disproportionately well-educated and financially secure. They were more likely to have
investments and retirement funds and to claim to be living ―comfortably.‖ This was also the
largest of the four groups. The Satisfied Middle had comparatively modest incomes but was
optimistic about their futures. They did not make a lot of money, with over half earning between
$20,000 and $40,000 and many on social security and 8 in 10 earned between $20,000 and
$50,000. They were mostly younger people or retired people. Eighty-eight percent reported
living comfortable despite their low incomes.67
The Anxious Middle Class had the most average income and education levels of any
group in the study. They fell right in the middle of the spectrum on most factors and were better
off in terms of income that the Satisfied Middle Class group. Thus, by the conventional
yardsticks of income, education, age, employment and family status, the fourth middle class
group was the most middle class of all—and the most dissatisfied and downbeat of the four
groups. While they enjoyed some of the economic advantages of the Top of the Class, they
expressed many of the same bleak judgments about their lives as those in the Struggling Middle,
described below. They made up slightly less than a quarter of all middle class Americans. They
statistical technique known as cluster analysis that searched for patterns in the way these self-
identified middle class Americans answered key survey questions. Id. 65
Id. 66
Id. 67
Id. at 14-15.
18
tended to work in fields in which their futures were uncertain and reported feeling financially
vulnerable despite high incomes. Half said they had trouble paying their bills.
The Struggling Middle Class was the worst off of the groups.68
Composed mostly of
women and minorities, this group made up 17% of the study participants. In many ways,
members of the Struggling Middle Class had more in common with the lower class than they did
with those in the other three groups and actually had a lower median family income than
Americans who put themselves on the lowest rungs of the social ladder. About one-in-six self-
identified middle class Americans fell into the Struggling Middle. On virtually every measure of
social status, including income, education, home ownership, and health, the Struggling Middle
Class fell behind the other groups. They were the only group in which the majority did not own
its own homes. They had trouble paying the rent or mortgage, and 30% had incomes of less than
$10,000. Six in ten had total family income of just $20,000 a year.69
Women dominated this group with 63% of the Struggling Middle Class being female, the
largest proportion of any of the four groups.70
The Struggling Middle contained the largest
proportion of minorities with 20% being black, 19% Hispanics, and just 56% are white.71
The
Struggling Middle also included the largest proportion of non-citizens (14%), as well as adults
born in another country (21%). 72
The Struggling Middle was also disproportionately young. And
just 8% were college graduates, while more than three-in-ten (31%) did not graduate from high
school and another 45% did not go on to college after they graduated from high school.
68
Id. at 11. 69
Id., 70
Id. at 12. 71
Id. 72
Id.
19
In many ways, this group looks typical of those who take out payday loans. Thus, if it is
indeed true that payday and title loans serve the middle class, it is more likely that they serve this
portion of the middle class, those struggling to pay bills, who are often single women with
children with relative low incomes compared to the rest of the middle class.
III. Payday and Title Loan Customer Demographics: Evidence Refuting the Middle
Class Myth
As stated above, the 2001 Elliehausen study reported that the majority of payday borrowers had
incomes between $25,000 and $49,999.73
The same statistic is quoted by the Community
Financial Services Association of America, the national payday loan trade association.74
Additionally, Financial Service Centers of America, Inc., another national trade association for
payday lenders, reports that borrowers from their members ―have an average annual household
income of more than $40,000 or more.‖75
Additionally, Advance America‘s Form 10-K for 2005
reports that the median income of one of its borrowers is $40,557, which compares to a national
median income of $45,018 in 2005-2006 according to the U.S. Census.76
73
Elliehausen, supra note 12, at 27. 74
Who We Serve, available at http://www.cfsa.net/who_we_serve.html, (last accessed February
10, 2012). This source says customer incomes average $25,000 to $50,000; see also Payday
Advance Customer Satisfaction Survey, conducted by the Cypress Research Group, 2004
http://www.checkintocash.com/docs/media_center/Cypress_Research.pdf. (last accessed on
February 16, 2012). 75
Fact Sheet: Payday Advances, available at http://www.fisca.org/Content/NavigationMenu/
AboutFISCA/FiSCAFactSheet/FiSCAFactSheetPDA52008.pdf (last
accessed February 10, 2012). The Financial Service Centers of America is a ―national trade
association that represents more than 7,000 neighborhood financial service outlets across the
United States. See also Chairman’s Message: A Letter from Joe Coleman, Chairman of the
Financial Service Centers of America‖ available at http://www.fisca.org/AM/Template.
cfm?Section=Chairman_s_Message&Template=/CM/HTMLDisplay.
cfm&ContentID=2163 (last accessed March 16, 2009), cited in Logan and Weller supra note 5,
at 5. 76
Household Income in the United States, WIKIPEDIA,
http://en.wikipedia.org/wiki/Household_income_in_the_United_States (stating that ―The 2003
Median Income of US households was $45,018 per annum‖).

20
The income data reported by Elliehausen and the industry is inconsistent with virtually all
other data on the same subject. The home ownership data from industry sources is also far
higher than that collected in any other way.77
Below we attempt to summarize all data that has
been made public from federal and state databases regarding the income of payday and title loan
customers. Starting with payday loans, we report on a study analyzing Federal Reserve Board
data, as well as data collected by states from lenders as part of the licensing and regulation
process, which include California, Colorado, Illinois, Wisconsin, and Indiana. We then discuss
what little demographic data is available for title loan customers.
A. Demographics of Payday Loan Borrowers
1. Federal Reserve Data from 2007
The most extensive evidence of payday customer demographics to date comes from a very
comprehensive 2009 study funded by the Center for American Progress, a progressive public
policy think tank.78
This paper used 2007 data from the Federal Reserve Board to examine the
77
Moreover, most other studies gather data from more reliable sources, namely directly from the
loan documentation itself rather than from customer self-reporting over the phone, long after the
loan was incurred. 78
Logan &Weller, supra note 5, at 4. The SCF is conducted every three years and is sponsored
by the Federal Reserve Board in cooperation with the Department of Treasury. The survey
gathers information about financial characteristics of American families, including their income,
net worth, financial and nonfinancial assets, debt, use of financial institutions, and recent and
planned expenditures. It also looks at their attitudes on financial and economic conditions and
demographic characteristics, such as age, race, and educational attainment of heads of
households. Id. Data from the SCF are unique in that no other national survey gathers
comparable information on families‘ assets and debt. 2007 was the first year that the SCF asked
respondents whether they had taken out a payday loan in the past year. Overall, just 2.4 percent
of families surveyed reported having withdrawn a payday loan within the last year. That may
seem like a small percentage of overall borrowers, but the demographic and financial
characteristics of these two groups—payday loan
borrowers and nonpayday loan borrowers—were quite different. Id.

21
financial and demographic characteristics of the U.S.‘s payday loan borrowers.79
Prior to this
study, government survey data on payday loan sue had never been publicly available. This was
the first time the Federal Reserve‘s data set, the Survey of Consumer Finances (―SCF‖), included
questions on payday loan use. Thus, this paper offers a far more detailed look at the
characteristics of payday loan borrowers from a large sample of reliable data. Generally speaking
this study reported that:
Families who had taken out a payday loan within the past year tend to have less income,
lower wealth, fewer assets, and less debt than families without payday loans.
Families who borrowed from a payday lender in the past year were more likely to be
minorities and single women than their counterparts. They also tended to be younger and
had less educational attainment.
Approximately 4 out of 10 families who borrowed from a payday lender within the past
year owned their own home, while nearly 7 out of 10 families who had not taken out a
payday loan were homeowners.
Only 14 percent of families who withdrew a payday loan within the past year had ever
been delinquent on a payment for any type of loan. This was nearly three times as large
as the share of families without a payday loan who had also not been delinquent on
payment.
Roughly one-quarter of families who had borrowed from a payday lender within the past
year identified themselves as savers, compared to nearly half of families who did not
withdraw a payday loan.
Payday loans are taken out primarily for convenience, to cover an emergency, and to pay
for basic consumption needs, such as gas and food.80
The authors note that some of these findings ―largely echo figures available on payday lending
industry websites and studies published by private researchers concerning data collected during
79
Id. The authors of the study note that anecdotal evidence has suggested that payday lenders
tend to service those least able to afford their 400% or more interest rates. Id. at 1. 80
Id.
22
the first half of this decade, but that their analysis provides a far more comprehensive
comparison between payday loan borrowers and non-borrowers.‖81
More specifically on the subject of income, the authors reported that the median income
of the payday loan borrower was $30,892, whereas the median income non-payday users was
$48,397, a $17, 505 or 56% difference.82
The mean income was $32,573 for payday borrowers
and $85,401 for non-payday users, a $52,828 or 162% difference. Net worth rates were also
astoundingly different among payday loan users and general survey participants, with payday
users having a mean net worth of $38,205 and non-payday users having a mean net worth of
$569,451, a $531,246 difference.83
On home ownership rates, the authors reported that 40.74%
of payday loan users owned their own homes, whereas 69.32% of non-payday users owned their
own homes, a 28.58% difference.
In sum then, based upon the 2007 SCF data from the Federal Reserve, families who took
out a payday loan within the year prior to the study had lower income, net worth, asset level, and
debt level than families who had not withdrawn a payday loan.84
The families that used payday
loans were also less likely to be homeowners and less likely to have savings.85
The heads of
households of families who borrow from a payday lender also tended to be younger, were more
likely to be single women, and overall had less education than non-payday loan users. They were
also more likely to be minorities than the non-users.86
In concluding the study, the authors noted
that:
81
Id. at 1. For a more detailed discussion of the other studies to which the authors refer, see id.
at 5-6. 82
Id. at 8. 83
Id. 84
Id. at 12. 85
Id. 86
Id.
23
because payday loans are accompanied by high fees to some extent, which on an
annualized basis amount to around 400 percent, the use of these types of loans may
impede the wealth creation for many borrowers who already have less wealth to begin
with. Given the explosive growth in payday lending transactions, payday lending
practices and regulations deserve the close scrutiny of policymakers.87
These study findings confirm earlier research and regulator data which demonstrate that
minorities, lower-income, and otherwise vulnerable families are the typcail cusotmerson of
payday lenders.
2. Data Gathered by States from Lender Reporting
Information from state regulators suggests even lower household income rates and lower
home ownership rates, though admittedly these data report only on individual incomes not
household incomes.
a. Data Collected by the State of Colorado
Colorado has a new payday loan law as of 2010,88
which caps interest at 45% per annum.89
Even before 2010, however, Colorado collected extensive data on payday customers and their
87
Id. 88
See Colorado HB10 1351.
http://www.leg.state.co.us/CLICS/CLICS2010A/csl.nsf/fsbillcont3/041577DBD253C4C987257
6D20063325F?Open&file=1351_01.pdf. The rule change governing HB1361 sets limits on the
fees payday lenders may impose on customers, caps the annual interest rate of said loans at 45%,
and the term of the loans was extended from one pay period to six months. Colorado Attorney
General Approves Payday Loan Rules, CashAdvance.com,
http://www.cashadvance.com/news/colorado-attorney-general-approves-payday-loan-rules, last
visited on December 28, 2010. The bill originally required that cash advance companies no
longer collect an origination fee. However Colorado Attorney General John Suthers ruled that
lenders could continue to collect such fees, but set a limit on such fees at $75 per $500 loaned.
He also required payday loan companies to return a prorated amount if the loan is paid off early.
Id. 89
See Colorado HB10 1351. The Colorado legislation page summarizes the new Colorado law
as follows:
Summary
Under current law, a lender may impose a finance charge for each deferred deposit loan
(payday loan) up to 20 percent of the first $300 lent plus 7.5 percent of any amount lent
in excess of $300. HB10-1351 limits the finance charge to a maximum annual
24
loans.90
Pursuant to a 2000 law, the Colorado Attorney General‘s office also maintains very
detailed data about the demographics of payday loan customers.91
Since 2000, examiners from
the Office of the Colorado Attorney General have gathered information in conjunction with
percentage rate of 45 percent. A minimum loan term of six months is required with no
prepayment penalty. The bill provides that a lender may charge a monthly maintenance
fee for each outstanding loan, not to exceed $7.50 per $100 loaned, up to a maximum of
$30 per month. Although multiple loans may be made to the same consumer, the total
amount financed cannot exceed $500 at any one time. A 30-day waiting period between
loans is required. The Governor signed the bill into law on May 25, 2010, and unless a
referendum petition is filed, the bill will take effect August 11, 2010. The bill applies to
loans made or renewed on or after that date.
Background
Payday loans are limited by law to $500 or less, and are due to the lender on the
consumer's next payday, typically in two weeks. The typical annual percentage rate on a
two-week $500 payday loan, at the maximum $75 finance charge, is 391 percent. In
1998, 303,462 Colorado residents obtained 1,534,976 payday loans from the state's 610
licensed lenders. Over $566 million in loans were made during 2008. The average
payday loan was $369, with a 317 percent average annual percentage rate.
Assessment
Limiting the maximum annual percentage rate on payday loans to 45 percent plus $7.50
per $100 loaned with a $30 monthly cap is assessed at having no state or local fiscal
impact. Currently, the Department of Law licenses payday lenders and conducts
compliance examinations of their loans. Examinations will be modified to reflect the
new rates established by statute. The department currently investigates and litigates
cases involving payday lenders. Existing resources are sufficient to continue to litigate
these types of cases in the future. Therefore, no further state expenditures are required.
http://www.leg.state.co.us/clics/clics2010a/csl.nsf/fsbillcont3/041577DBD253C4C9872576D200
63325F?Open&file=HB1351_f1.pdf, last visited on December 28, 2010. 90
In Colorado, the Attorneys General‘s office regulates and enforces payday loan laws. This is a
significant departure from most states, where the separate regulatory body, frequently
understaffed or with higher priorities, is in charge of enforcement. 91
Payday Lending Demographic and Statistical Information, July 2000 through December 2009,
John W. Suthers, Colorado Attorney General‘s Office Web Site, Annual report Composites,
available at
http://www.paydayloaninfo.org/elements/www.paydayloaninfo.org/File/DDLASummary(2009).
pdf.

25
supervised lender compliance examinations as part of an ongoing study of payday lenders and
their customers.92
Regarding income of customers in Colorado, the mean gross income of all borrowers was
$2,458 per month, or $29, 496 annually.93
The monthly average is $2,691 ($32,292 annualized)
for men and $2,266 ($27,192 annualized) for women. Borrowers with gross monthly income of
$2,500 or less accounted for 60-88%94
of all borrowers and the median income for all borrowers
was $2,199.95
This can be compared to averaged median income from 2000 to 2009 for all
persons living in Colorado of $36,032.96
The payday loan users‘ income is far below the overall
median.97
b. Data Collected from the State of California
The California Department of Corporations recently hired an outside service, Applied
Management Services, to study payday borrowers and lenders August and December of 2007.98
92
These loans are also called deferred deposit loans in the law. Id. at 1. As further background,
of the 487 licensed payday lenders in Colorado as of December 31, 2009, the ten largest
companies accounted for 64% of all locations in the state. Id. at 2. The data was gathered from
31,762 loans made by licensed lenders from 2000 to 2009, and showed an average age of
borrowers of 37 years. Id. at 3. Payday borrowers are predominantly between the ages of twenty
and thirty-nine, with almost 60% of borrowers falling into this demographic. Consumers over 55
made up 9.35% of all borrowers with 2.32% of all payday loan customers 65 or older. Id. Most
of the borrowers are women (in 2008 and 2009, women accounted for more than 60% of all
borrowers, and in the entire eight years, much more than 50%). Id. at 4. Single borrowers vastly
outnumber married borrowers, with 65% being single. The average payday loan customer has
been at his or her job for 3.46 years, and about 25% of all borrowers had been at their jobs for six
months or less. Id. 93
Id. at 4. 94
Id. at 5. 95
Id. at 4. 96
Per Capita Personal Income by State, http://www.infoplease.com/ipa/A0104652.html. 97
This average uses data from years 2000, 2001, 2002, 2003, 2005, 2006, and 2009 only,
skipping 2004, 2007 and 2008. This means the actual median income for a Coloradans for this
period would likely be a bit higher, given that the skipped years are more recent. 98
2007 Department of Corporations: Payday Loan Study (December 2007, updated June 2008),
available at http://www.corp.ca.gov/Laws/Payday_Lenders/Archives/pdfs/PDLStudy07.pdf .
26
The study consisted of an on-line survey of lenders, a download of all customer demographic
information from 93% of active payday lenders in the state, a phone survey of 1,494 borrowers,
and five customer focus groups.99
Income data from customer files was collected in ranges. The
largest percentage of customers reported gross income between $30,000 and $39,000,100
compared to a median income per person in the state of $44,499.101
c. Data Collected from the State of Wisconsin
In 2000, the Wisconsin Department of Financial Institutions studied the income of 450
customers at 17 lenders in Wisconsin.102
The department found that 54% of borrowers were
women and that of the customers who disclosed their income in terms of gross income, the
average annualized income was $24,673,103
compared to an average per capital income in the
99
Id. at vi-vii. 100
Id. at 63. . The other income range data is as follows:
Under $10,000 6.4%
$10,000-$19,999 11.6%
$20,000-$29,999 14.7%
$30,000-$39,999 15.6%
$40,000-$49,999 11.8%
$50,000-$59,999 7.9%
$60,000-$69,999 4.6%
$70,000-$79,999 3.4%
Another 5.2% reported making $80,000 or more, and 18.9% refused to answer the question. Id.
at 63. 101
Census Bureau, IRS Data and Administrative Expenses Multipliers, U.S. Dep‘t. Just.,
http://www.justice. gov/ust/eo/bapcpa/meanstesting.htm (use dropdown for Data Required for
Completing Form 22A and Form 22C by date) (last visited Nov. 6, 2011) for Cases Filed
between February 1 and October 14, 2007, available at
http://www.justice.gov/ust/eo/bapcpa/20070201/bci_data/median_income_table.htm (containing
census Data for California for most of 2007). 102
Review of Payday Lending in Wisconsin 2001, State of Wisconsin Department of financial
Institutions, 4, available at http://legistar.milwaukee.gov/attachments/22854.pdf. 103
Id.
27
state for the same period of $29,196. 104
On home ownership, Wisconsin found that 74 percent
of the people surveyed rented their homes.105
d. Data Collected from the State of Illinois
In 1999, Illinois collected data from customers of payday loan stores through payday
customer surveys.106
The average age of the payday loan customer was 36.9, 60% of users were
women, and the average annualized income was $25, 131, compare to an average per capita
income in the state of $31,856 around the same time period.107
Seventy-five percent claimed to
be renters, and 15% said they owned their homes. The other 10% had other living arrangements.
More specifically, analyzing this data provided by the Illinois Department of Financial
Institutions, the Woodstock Institute (2000) found that 19% of customers earn less than $15,000,
38% earn from $15,000 to $24,999, 31% earn from $25,000 to 39,999, and over 12% earn
$40,000 or more.108
B. Demographics of Title Loan Borrowers
Industry claims of middle class patronage are even more dubious when dealing with title
loans. Professor Todd Zywicki has produced three articles based upon interviews with title
lenders, all claiming with little substantiation that the typical title loan customer makes about
104
Wisconsin-Income, http://www.city-data.com/states/Wisconsin-Income.html. 105
Id. 106
Illinois Department of Financial Institutions, Short Term Lending: Final Report, Undated
report downloaded from www.il.us./dfi/ (last accessed on February 12, 2102), at 23-25. 107
http://www.infoplease.com/ipa/A0104652.html, at 26. 108
Caskey, supra note 33, at 24 (citing Woodstock Inst., Unregulated Payday Lending Pulls
Vulnerable Consumers Into Spiraling Debt, Reinvestment Alert (Mar. 2000). In addition,
according to Michael E. Stegman and Robert Faris, Indiana regulators report that borrowers in
Indiana tend to be primarily in the $25,000 to $30,000 income range. Stegman & Ferris, supra
note 9, at 15.
28
$50,000 annually.109
The American Association of Responsible Auto Lenders (AARAL)—a title
lending trade association—claims that the average title loan borrower has a household income of
―over $50,000‖ and the President of a large title lender in Texas testified that the average
borrower earns between $50,000-$65,000 nationally.110
Professor Zywicki also concludes,
without much substantiation, that car title borrowers generally fall into three main categories: (1)
the unbanked who lack access to both mainstream credit and subprime credit such as payday
loans which require a bank account; (2) relatively higher-income borrowers with poor credit; and
(3) owners of very small businesses or sole proprietorships (such as landscapers or handymen)
who use these loans to make payroll or purchase items for a job.111
Data reported on by Martin and Adams, using New Mexico data reported directly by
lenders to the State of New Mexico Financial Institutions Division tell a different and far less
prosperous picture. These data show that the average title loan borrowers in New Mexico makes
between $20,116 and $27,719.112
This data was collected in a state where the median income for
109
Zywicki‘s three scholarly articles on the subject, all similar in content and all published in
2009 and 2010, all argue that title lending is useful to many consumers and should not be
regulated. See Consumer Use, supra note 36, at 441-42; Money to Go, supra note 36, at 37;
Zywicki & Okolski, supra note 36, at 3. Zywicki and his co-authors rely almost exclusively on
industry interviews to support their numbers. See, e.g., Consumer Use, supra note 36, at 434
n.27, 442 n.59; Money to Go, supra note 36, at 1 n.5; Zywicki & Okolski, supra note 36, at 2
n.10. These interviews were turned into a report and used to influence the New Mexico
legislature. Most of the information in this report came from industry insider Robert Reich, the
current president of Texas Car Title Loan Services and Community Loans of America. See
VERANT, supra note 36, at 36. 110
See http://staging.responsibleautolenders.org/about/what_is_title_lending; Robert Reich,
President of Community Loans of America and Texas Car Title Loans Services, Testimony
before the Texas Senate Committee on Business and Commerce (February 22, 2011). 111
Zywicki notes that borrowers most commonly fall into the first ―unbanked‖ category,
members of which make up about half of all title loan borrowers. See Zywicki, Money to Go,
supra note 36, at 33-35. 112
Adams & Martin, supra note 2, at 76-77, Tables 12-12.1 (2012). The average is between
$20,116 and $27,719 even when you include in the data one borrower with an alleged income of
over two million dollars.
29
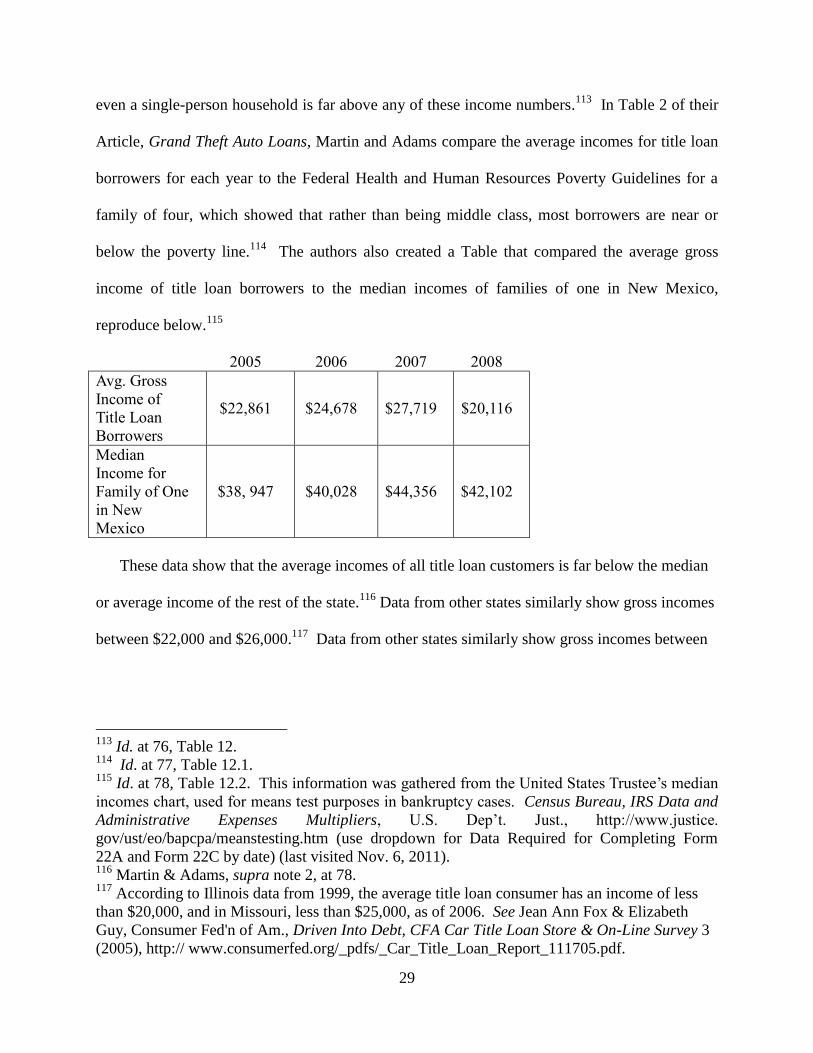
even a single-person household is far above any of these income numbers.113
In Table 2 of their
Article, Grand Theft Auto Loans, Martin and Adams compare the average incomes for title loan
borrowers for each year to the Federal Health and Human Resources Poverty Guidelines for a
family of four, which showed that rather than being middle class, most borrowers are near or
below the poverty line.114
The authors also created a Table that compared the average gross
income of title loan borrowers to the median incomes of families of one in New Mexico,
reproduce below.115
2005 2006 2007 2008
Avg. Gross
Income of
Title Loan
Borrowers
$22,861 $24,678 $27,719 $20,116
Median
Income for
Family of One
in New
Mexico
$38, 947 $40,028 $44,356 $42,102
These data show that the average incomes of all title loan customers is far below the median
or average income of the rest of the state.116
Data from other states similarly show gross incomes
between $22,000 and $26,000.117
Data from other states similarly show gross incomes between
113
Id. at 76, Table 12. 114
Id. at 77, Table 12.1. 115
Id. at 78, Table 12.2. This information was gathered from the United States Trustee‘s median
incomes chart, used for means test purposes in bankruptcy cases. Census Bureau, IRS Data and
Administrative Expenses Multipliers, U.S. Dep‘t. Just., http://www.justice.
gov/ust/eo/bapcpa/meanstesting.htm (use dropdown for Data Required for Completing Form
22A and Form 22C by date) (last visited Nov. 6, 2011). 116
Martin & Adams, supra note 2, at 78. 117
According to Illinois data from 1999, the average title loan consumer has an income of less
than $20,000, and in Missouri, less than $25,000, as of 2006. See Jean Ann Fox & Elizabeth
Guy, Consumer Fed'n of Am., Driven Into Debt, CFA Car Title Loan Store & On-Line Survey 3
(2005), http:// www.consumerfed.org/_pdfs/_Car_Title_Loan_Report_111705.pdf.
30
$22,000 and $26,000.118
Illinois regulators report that title loan customers in Illinois earn an
average of $19,808,119
which is far lower than the per capita average income, which ranged from
$33,404 in 2003 to $43,159 in 2010.120
These data show that in Illinois, title loan customers
have even lower incomes than payday loan customers.
The Illinois data also show that homeownership rates for title loan borrowers are far below
the National average, with 80% of title loan borrowers reporting that they rent their homes.121
Additionally, the typical title loan borrower is a non-homeowner whose income is well below the
median and who is unbanked.122
As King notes, a recent FDIC study reports that the unbanked,
which make up approximately 8 percent of the total U.S. population, are more likely to earn less
than $30,000 a year, be a person of color, unmarried, have less than a high school degree, and be
a foreign-born Spanish speaker.123
In summary then, title loan customers appear to be far from
middle income and are perhaps even less well off financially than payday loan borrowers.
IV. Demographics Study of Payday Loan Use Among Bankruptcy Filers in New Mexico
118
According to Illinois data from 1999, the average title loan consumer has an income of less
than $20,000. In Missouri, the average title loan customer made less than $25,000, as of 2006.
Id. 119
Illinois Department of Financial Institutions, Short Term Lending: Final Report, supra note
106, at 26. 120
See id; see also http://www.infoplease.com/ipa/A0104652.html (last accessed on March 2,
2012)(providing the median income in each state for various years between 1980 and 2010).
Illinois regulators reported an average income of title loan borrowers of $24,000, compared to a
median household income of $56,230, as provided by the 2008 Census. Illinois Department of
Financial Institutions, Short-Term Lending 1999 Final Report, 26, available at
http://www.idfpr.com/dfi/ccd/pdfs/Shorterm.pdf. 121
Id. 122
Id. 123
The FDIC‘s National Survey of Unbanked and Underbanked Households found that 8 percent
of U.S. households are unbanked. However, 21.7% of African Americans, 19.3% of Latinos, and
15.6% of American Indians are unbanked. In addition, the unbanked are more likely to be
unmarried, have incomes of less than $30,000, less than a high school education, and a foreign
born Spanish speaker than the U.S. population as a whole. See
http://www.fdic.gov/householdsurvey/.
31
To add something new to the data on high-cost loans and customer demographics, I
applied for a grant to study high-cost loan borrowers who ultimately file for bankruptcy.124
The
idea was to compare the income and homeownership data for high-cost loan users who filed for
bankruptcy in a given period, to those of the general population of bankruptcy debtors for the
same period. My working hypothesis was that even among credit-challenged bankruptcy
debtors, people who list high-costs loans like payday loans, title loans, and installment loans in
their bankruptcy petitions would be worst off financially than those who did not list these loans.
A. Assumptions
One might question whether studying bankruptcy debtors is an appropriate way to study
the income and homeownership demographics of payday loan borrowers as compared to the
general population, but it makes a certain degree of sense. Scholars have long claimed that
bankruptcy debtors themselves come primarily from the middle classes.125
Moreover, middle
income people have become far more cash-constrained since the financial crisis of 2008.
Thus, the rationale for studying bankruptcy debtors and their debts, income, and
homeownership rate was that the sample of bankruptcy debtors would reflect a mostly middle
class population that was also cash-constrained. What could be a better sample upon which to
test the theory that payday borrowers are cash-constrained, but mostly middle class, people?
Moreover, studying bankruptcy debtors seemed to be one way in which to test the theory that
124
The study was funded by the National Conference of Bankruptcy Judges and took place in
New Mexico, where there are more payday and installment lenders per person that any other
state. CITE. 125
SULLIVAN, WARREN, AND WESTBROOK, supra note 16, at 6 (noting that ―bankruptcy is a
largely middle-class phenomenon).‖ Poorer people often have less access to an attorney, and also
may be judgment proof and thus find less need for bankruptcy than people with more income and
more assets. Poorer people also have historically had less access to credit, though that is
obviously less true today than in the past.
32
more middle class people are using payday loans since the crisis loan usage increased post-crisis.
Finally, if one isolates homeowners who file for bankruptcy from those who are not
homeowners, we might be able to tell, albeit through a somewhat unique sample, whether more
homeowners who are cash constrained are using payday loans since the recession.
The study originally contemplated gathering data in 2007, 2008, and 2009 only. After
the crisis, the study was expanded to include data from 2010 and 2011, so we could be sure we
were capturing any changes that may have occurred as a result of the crisis. Ultimately,
calculated the data two different ways, first by separating out the payday loan users from the
whole and comparing their income and home ownership to the general bankruptcy filer
population, and second by culling out the homeowners and comparing their use of payday loans
year by year, to see if there was an increase in use of such loans after the crisis. I took the first
step to test the theory that payday loan users were generally as middle class as the rest of the
bankruptcy filers, using income and homeownership as the indicia of middle class. I took the
second step in order to see if cash-constrained homeowners in this sample resorted to payday
loans more often after the recession, assuming that if payday loan users were indeed middle
class, and if homeowners were generally middle class as the 2008 financial crisis hit, more
homeowners would use payday loans to bridge the gap.
As set out below, I found that payday loan users had lower income and home ownership
rates than bankruptcy debtors as a whole, as well as less valuable homes if they were
homeowners. I also found that bankrupt homeowners did not resort to payday loans more often
33
after the crisis. I concluded that based upon the results of this one modest study, there was little
support for the notion that middle class people use these loans more following the crisis. 126
B. Methodology
To get started, we needed to figure out how to identify the loans we wanted to study
when breaking out the group using high-cost credit. In New Mexico, where we gathered our
data, a new law was passed in 2007 that heavily regulated payday loans.127
The new law defined
a payday loan as a loan with a duration of 14-35 days, involving a post-dated check or an
automatic debit.128
After the new law, the majority of New Mexico payday lenders reconfigured
their loans to get outside this definition, and thus outside the regulation.129
While most of the payday loan market left traditional payday lending after the new law,
some smaller lenders in the local market continued to offer non-amortizing payday loans due on
a borrower‘s next payday. Moreover, compared to 2007-2009, many more New Mexico
consumers began using internet payday loans in 2010 and 2011. Based on these facts, we knew
we needed to count both payday loans and installment loans.130
For simplicity, we refer to all of
these loans as payday loans throughout this paper, but we measured the usage rate for both.
126
The sample was taken in one state over a period of five years, in part to capture changes that
were captured over time, that also might be the result of the financial crisis of 2008. The study
by no means purports to predict anything on a national level, and only attempts to make small
predictions on a more regional level. At most it makes predictions and conclusions about
whether payday borrowers in a poor state who file for bankruptcy are less likely to be middle
class than bankruptcy debtors who do not use payday loans. The study can easily be replicated in
states that are not as poor in order to see if the results are the same. 127
Martin, supra note 3, at 577-84. 128
Id. at 579. 129
Id. at 585-86. The new product of choice is called an ―installment loan,‖ which carries a
typical interest rate of between 500 and 600% per annum. Id. at 586-87. 130
We were unsure whether to count title loans, but ultimately decided not to include them.
Initially we looked for title loans but found very few. Including them required us to check an
additional bankruptcy schedule, Schedule D, which did not seem worthwhile given the number
of petitions we reviewed. We also did not count installment loans by traditional consumer
34
Some of the data for this study was gathered in connection with a previous study. In the
prior study, the author and Koo Im Tong set out to measure the incidence of payday and
installment loan usage among consumer bankruptcy debtors, both in Chapter 7 and Chapter 13,
in New Mexico.131
We measured whether the usage of these loans was constant over a 2007-
2009 period, in relation to the number of overall bankruptcy debtors. 132
Our data show that from
2007 to 2009, an average of 18.9% of bankruptcy debtors in New Mexico reported using payday
or high-cost installment loans, but also that as bankruptcy rates unquestionably inched upward
year by year from 2007 through 2010, 133
the percentage of bankruptcy debtors using payday
loans went down steadily in 2009 and 2010, but jumped back to pre-crisis levels in 2011.134
Finally, we found that the use of high-cost loans among bankruptcy debtors was far higher than
among the general population.135
lenders like Beneficial and Household Finance, but rather only lenders who offer loans at 100%
per annum or more. As set out above, most charged much more to most if not all customers. 131
See Nathalie Martin & Koo Im Tong, Double Down and Out: The Connection Between
Payday Loans and Bankruptcy, 39 SOUTHWESTERN L. REV. 785 (2010). The files were
downloaded by myself and my researcher assistant Ozymandias Adams. 132
Overall, we gathered and studied data from 1,179 petitions, 269 in 2007, 377 in 2008, and 506
in 2009. For June of 2009, we found that 14% of bankruptcy debtors listed at least one payday
loan in their schedules, and 56.1% of those who had loans had more than one listed. For 2008,
23% of bankruptcy debtors listed at least one payday loan in their schedules, and 76.8% of those
who had loans had more than one listed. For June of 2007, we found that 23% of bankruptcy
debtors listed at least one payday loan in their schedules, and 76.1% of those had more than one
listed. Under any measure, the data show that bankruptcy filers in New Mexico used a
tremendous number of payday loans, and unquestionably far more than in the general population. 133
Abi web site 134
In the prior study, we found that for the 1,036 debtors who filed in June of 2007, 2008, and
2009, 2010, 23%, 23%, 14%, respectively, listed payday or high-cost installment loans on their
bankruptcy schedules. These numbers included both chapter 7 and chapter 13 debtors. For 2010
and 2011, we only looked at Chapter 7 cases. For 2010, the percentage of debtors using payday
loans dipped to was 10.4% but it was back up to 21.4% by 2011. 135
Previous studies showed that payday loan use among the general population ranges between
2.4% and 6% of the population. See id. at 801-02 (citations omitted). Payday loan usage rates as
found in Martin and Tong‘s study reveal a rate of usage for bankruptcy debtors at four to five
times that of the general population. Id. at 803-05.
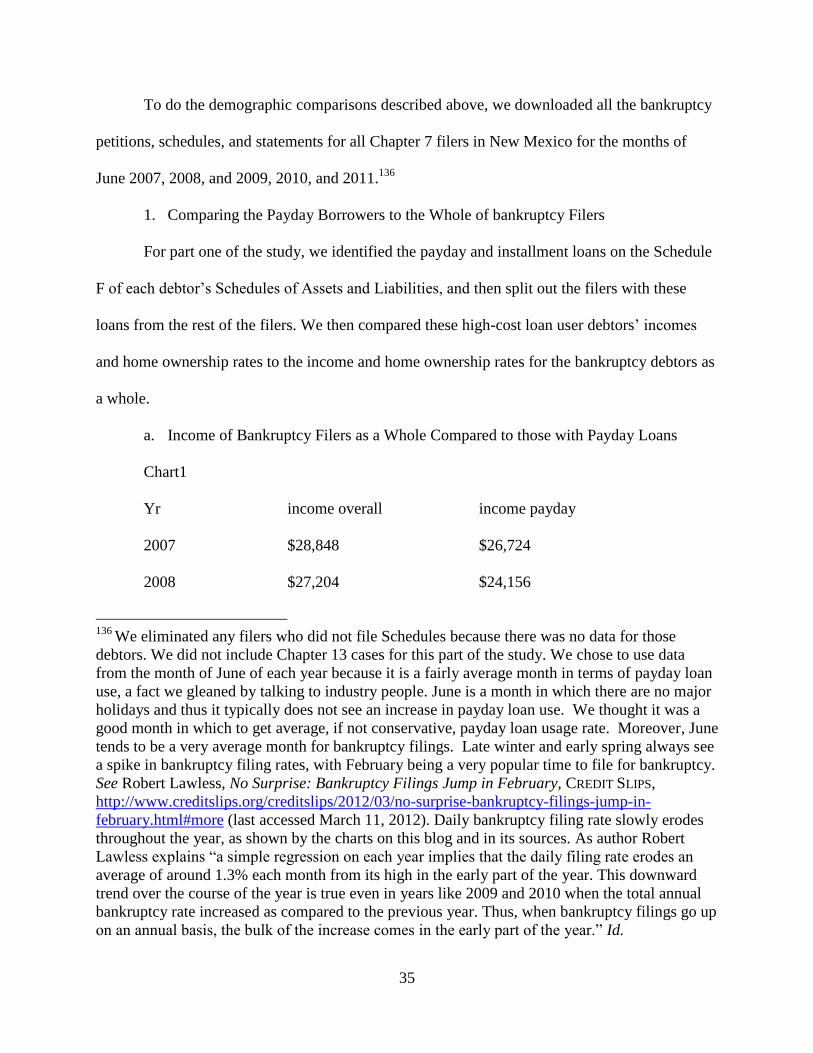
35
To do the demographic comparisons described above, we downloaded all the bankruptcy
petitions, schedules, and statements for all Chapter 7 filers in New Mexico for the months of
June 2007, 2008, and 2009, 2010, and 2011.136
1. Comparing the Payday Borrowers to the Whole of bankruptcy Filers
For part one of the study, we identified the payday and installment loans on the Schedule
F of each debtor‘s Schedules of Assets and Liabilities, and then split out the filers with these
loans from the rest of the filers. We then compared these high-cost loan user debtors‘ incomes
and home ownership rates to the income and home ownership rates for the bankruptcy debtors as
a whole.
a. Income of Bankruptcy Filers as a Whole Compared to those with Payday Loans
Chart1
Yr income overall income payday
2007 $28,848 $26,724
2008 $27,204 $24,156
136
We eliminated any filers who did not file Schedules because there was no data for those
debtors. We did not include Chapter 13 cases for this part of the study. We chose to use data
from the month of June of each year because it is a fairly average month in terms of payday loan
use, a fact we gleaned by talking to industry people. June is a month in which there are no major
holidays and thus it typically does not see an increase in payday loan use. We thought it was a
good month in which to get average, if not conservative, payday loan usage rate. Moreover, June
tends to be a very average month for bankruptcy filings. Late winter and early spring always see
a spike in bankruptcy filing rates, with February being a very popular time to file for bankruptcy.
See Robert Lawless, No Surprise: Bankruptcy Filings Jump in February, CREDIT SLIPS,
http://www.creditslips.org/creditslips/2012/03/no-surprise-bankruptcy-filings-jump-in-
february.html#more (last accessed March 11, 2012). Daily bankruptcy filing rate slowly erodes
throughout the year, as shown by the charts on this blog and in its sources. As author Robert
Lawless explains ―a simple regression on each year implies that the daily filing rate erodes an
average of around 1.3% each month from its high in the early part of the year. This downward
trend over the course of the year is true even in years like 2009 and 2010 when the total annual
bankruptcy rate increased as compared to the previous year. Thus, when bankruptcy filings go up
on an annual basis, the bulk of the increase comes in the early part of the year.‖ Id.
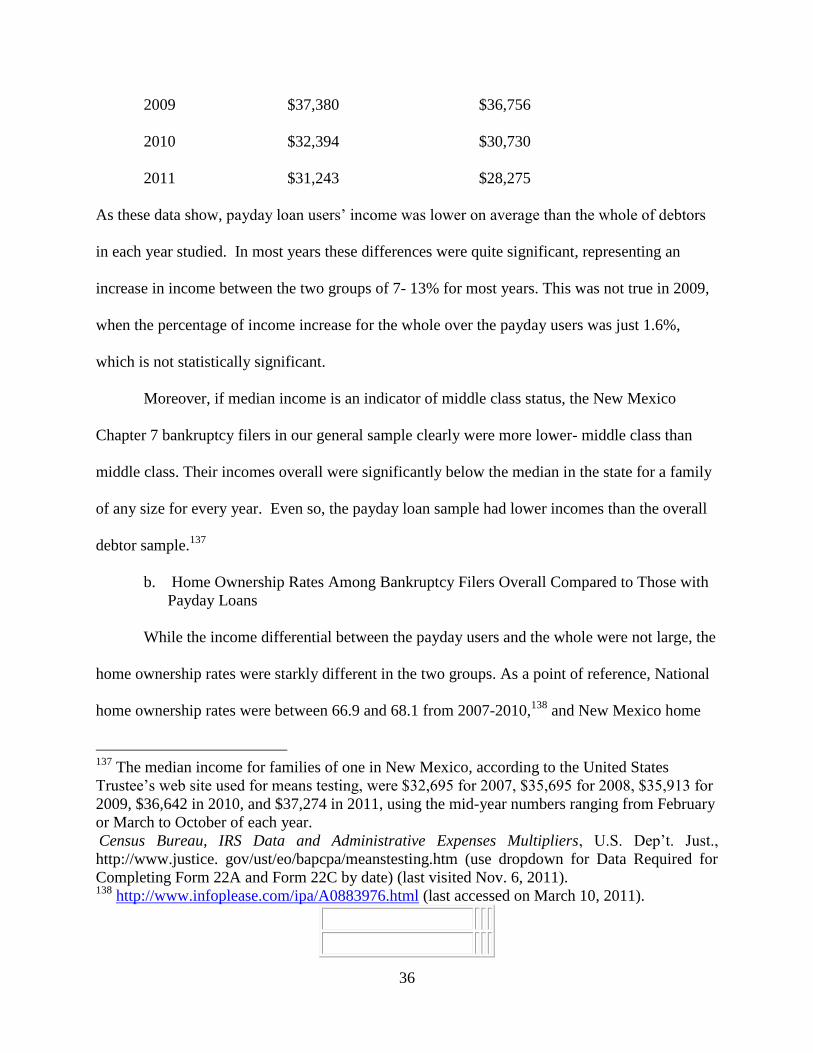
36
2009 $37,380 $36,756
2010 $32,394 $30,730
2011 $31,243 $28,275
As these data show, payday loan users‘ income was lower on average than the whole of debtors
in each year studied. In most years these differences were quite significant, representing an
increase in income between the two groups of 7- 13% for most years. This was not true in 2009,
when the percentage of income increase for the whole over the payday users was just 1.6%,
which is not statistically significant.
Moreover, if median income is an indicator of middle class status, the New Mexico
Chapter 7 bankruptcy filers in our general sample clearly were more lower- middle class than
middle class. Their incomes overall were significantly below the median in the state for a family
of any size for every year. Even so, the payday loan sample had lower incomes than the overall
debtor sample.137
b. Home Ownership Rates Among Bankruptcy Filers Overall Compared to Those with
Payday Loans
While the income differential between the payday users and the whole were not large, the
home ownership rates were starkly different in the two groups. As a point of reference, National
home ownership rates were between 66.9 and 68.1 from 2007-2010,138
and New Mexico home
137
The median income for families of one in New Mexico, according to the United States
Trustee‘s web site used for means testing, were $32,695 for 2007, $35,695 for 2008, $35,913 for
2009, $36,642 in 2010, and $37,274 in 2011, using the mid-year numbers ranging from February
or March to October of each year.
Census Bureau, IRS Data and Administrative Expenses Multipliers, U.S. Dep‘t. Just.,
http://www.justice. gov/ust/eo/bapcpa/meanstesting.htm (use dropdown for Data Required for
Completing Form 22A and Form 22C by date) (last visited Nov. 6, 2011). 138
http://www.infoplease.com/ipa/A0883976.html (last accessed on March 10, 2011).
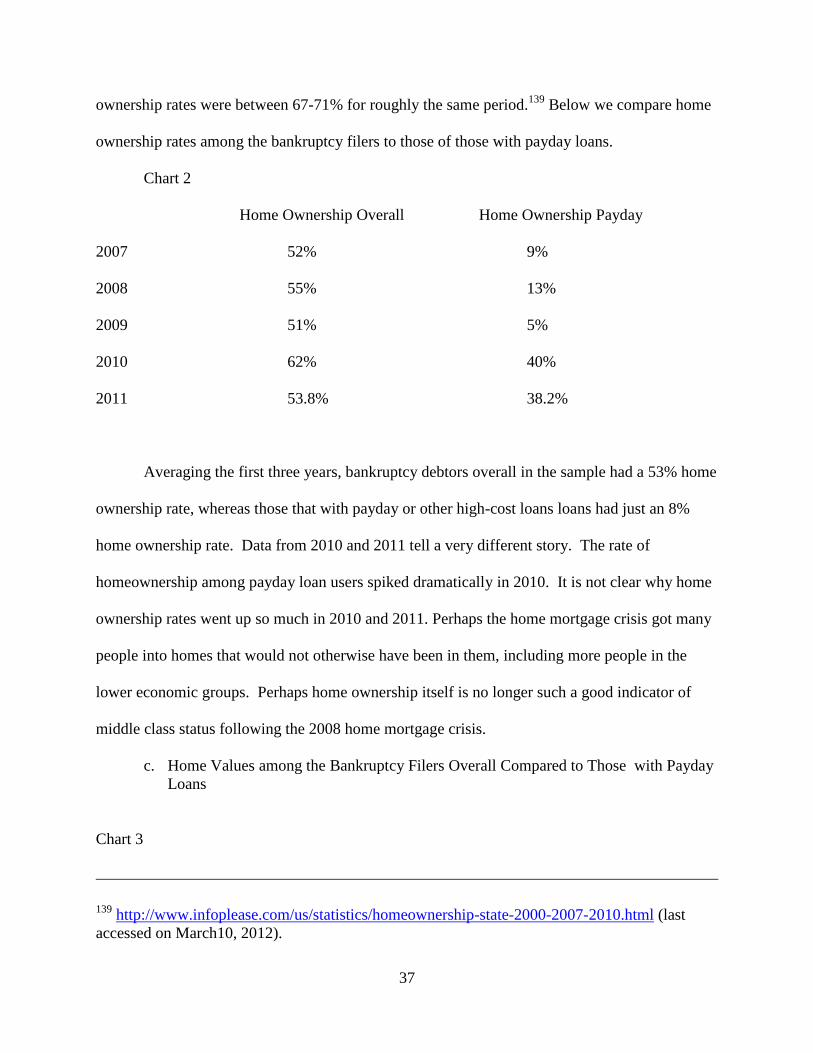
37
ownership rates were between 67-71% for roughly the same period.139
Below we compare home
ownership rates among the bankruptcy filers to those of those with payday loans.
Chart 2
Home Ownership Overall Home Ownership Payday
2007 52% 9%
2008 55% 13%
2009 51% 5%
2010 62% 40%
2011 53.8% 38.2%
Averaging the first three years, bankruptcy debtors overall in the sample had a 53% home
ownership rate, whereas those that with payday or other high-cost loans loans had just an 8%
home ownership rate. Data from 2010 and 2011 tell a very different story. The rate of
homeownership among payday loan users spiked dramatically in 2010. It is not clear why home
ownership rates went up so much in 2010 and 2011. Perhaps the home mortgage crisis got many
people into homes that would not otherwise have been in them, including more people in the
lower economic groups. Perhaps home ownership itself is no longer such a good indicator of
middle class status following the 2008 home mortgage crisis.
c. Home Values among the Bankruptcy Filers Overall Compared to Those with Payday
Loans
Chart 3
139
http://www.infoplease.com/us/statistics/homeownership-state-2000-2007-2010.html (last
accessed on March10, 2012).
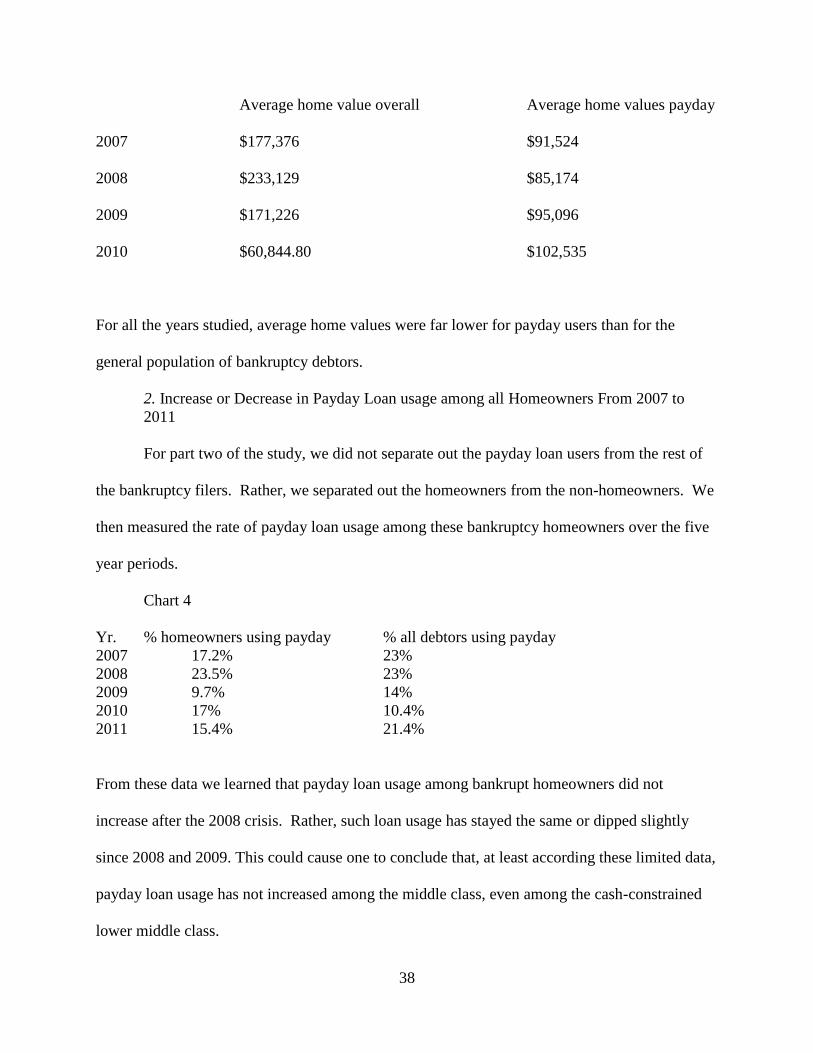
38
Average home value overall Average home values payday
2007 $177,376 $91,524
2008 $233,129 $85,174
2009 $171,226 $95,096
2010 $60,844.80 $102,535
For all the years studied, average home values were far lower for payday users than for the
general population of bankruptcy debtors.
2. Increase or Decrease in Payday Loan usage among all Homeowners From 2007 to
2011
For part two of the study, we did not separate out the payday loan users from the rest of
the bankruptcy filers. Rather, we separated out the homeowners from the non-homeowners. We
then measured the rate of payday loan usage among these bankruptcy homeowners over the five
year periods.
Chart 4
Yr. % homeowners using payday % all debtors using payday
2007 17.2% 23%
2008 23.5% 23%
2009 9.7% 14%
2010 17% 10.4%
2011 15.4% 21.4%
From these data we learned that payday loan usage among bankrupt homeowners did not
increase after the 2008 crisis. Rather, such loan usage has stayed the same or dipped slightly
since 2008 and 2009. This could cause one to conclude that, at least according these limited data,
payday loan usage has not increased among the middle class, even among the cash-constrained
lower middle class.
39
VI. Conclusion
In sum, our data show that chapter 7 filers typically have a median income well below the
median income in the state overall.140
Not surprisingly, at least to me, when you separate out the
bankruptcy filers who took out payday loans from those who did not, and compare the payday
users‘ income to the whole of bankruptcy filers, the filers with payday loans had even lower
median incomes than the sample of bankruptcy debtors as a whole. High-cost loan users also
had lower home ownership rates. From 2007-2009, the payday users had far lower home
ownership rates, up to 10 times lower. In 2010 and 2011, however, the homeownership rates
among the bankruptcy debtors who used payday loans spiked considerable, making the
difference between the two groups more like 10-30% rather than 1,000%.
Since homeownership has long been considered an indicator of middle class status, I also
wanted to see if these bankruptcy data would shed light on whether more home owners were
using payday loans more often following the crisis. To test this possible hypothesis, I
recalculated the data, this time starting with the home owners rather than the payday lending
customers as the breakout group to compare to the whole. In other words, if we isolated all of the
homeowners in the sample, would the rate of payday loan usage among homeowners go up after
the crisis? The answer turned out to be no. leading me to conclude that if even homeowners in
bankruptcy have not turned to these loans with greater frequency, can we really conclude that the
loans were now more popular with the middle class? I think not.
Many scholars had previously analyzed the high-cost loan industries‘ claims that they
serve primarily the middle class. All sources other than the industries‘ own studies have found
140
Again, the median income for families of one in New Mexico, according to the United States
Trustee‘s web site used for means testing, were $32,695 for 2007, $35,695 for 2008, $35,913 for
2009, $36,642 in 2010, and $37,274 in 2011. See supra note 137. Median incomes for all
bankruptcy debtors in our sample, as well as the payday borrowers only, are in Chart 1above.

40
the middle class myth to be just that, a myth. My own study, though limited in scope, suggests
that the 2008 financial crisis has not necessarily changed the demographics for payday loans and
other high-cost loans. Rather, these products most likely continue to be used by the same
demographic traditionally served, namely the working poor. Given that these individuals have
more to lose through high-cost credit than a more middle class clientele would, more effective
regulation is warranted in my view.