Embed Size (px)
Citation preview
Biomedicines 2015, 3, 224-236; doi:10.3390/biomedicines3030224
biomedicines ISSN 2227-9059
www.mdpi.com/journal/biomedicines/
Article
High Levels of IL-10 and CD4+CD25hi+ Treg Cells in Endemic Burkitt’s Lymphoma Patients
Godfred Futagbi 1,*, Ben Gyan 2, Harriet Nunoo 1, John K.A. Tetteh 2, Jennifer E. Welbeck 3,
Lorna Awo Renner 3, Michael Ofori 2, Daniel Dodoo 2, Dominic A. Edoh 1 and
Bartholomew D. Akanmori 4
1 Department of Animal Biology and Conservation Science, College of Basic and Applied Sciences,
University of Ghana, Legon, Accra, Ghana; E-Mails: [email protected] (H.N.);
[email protected] (D.A.E.) 2 Immunology Department, Noguchi Memorial Institute for Medical Research, College of Health
Sciences, University of Ghana, Legon, Accra, Ghana;
E-Mails: [email protected] (B.G.); [email protected] (J.K.A.T.);
[email protected] (M.O.); [email protected] (D.D.) 3 Department of Child Health, School of Medicine and Dentistry, College of Health Sciences,
University of Ghana, Accra, Ghana; E-Mails: [email protected] (J.E.W.);
[email protected] (L.A.R.) 4 Division of Immunization, Vaccines & Emergencies (IVE), WHO Regional Office for Africa,
Cité Djoué, PO Box 06 Brazzaville, Congo Republic; E-Mail: [email protected]
* Author to whom correspondence should be addressed; E-Mail: [email protected];
Tel.: +233-244012416.
Academic Editor: Kenneth Cornetta
Received: 29 June 2015 / Accepted: 28 July 2015 / Published: 4 August 2015
Abstract: Background: The interplay between Epstein-Barr virus infection, malaria, and
endemic Burkitt’s Lymphoma is not well understood. Reports show diminished EBV-specific
Th1 responses in children living in malaria endemic areas and deficiency of EBNA1-specific
IFN-γ T cell responses in children with endemic Burkitt’s Lymphoma (eBL). This study,
therefore, examined some factors involved in the loss of EBNA-1-specific T cell responses
in eBL. Methods: T-cell subset frequencies, activation, and IFN-γ- or IL-4-specific
responses were analyzed by flow-cytometry. Plasma cytokine levels were measured by
ELISA. Results: CD4+ and CD8+ cells in age- and sex-matched healthy controls (n = 3)
expressed more IFN-γ in response to all immunostimulants than in pediatric endemic BL
OPEN ACCESS

Biomedicines 2015, 3 225
(eBL) patients (n = 4). In healthy controls, IFN-γ expression was higher than IL-4
expression, whereas in eBL patients the expression of IL-4 by CD4+ cells to EBNA-1 was
slightly higher than IFN-γ. Moreover, the blood levels of TNF-α was significantly lower
(p = 0.004) while IL-10 was significantly higher (p = 0.038), in eBL patients (n = 21)
compared to controls (n = 16). Additionally, the frequency of CD4+CD25hi+ T cells was
higher in both age-matched acute uncomplicated malaria (n = 26) and eBL (n = 14)
patients compared to healthy controls (n = 19; p = 0.000 and p = 0.027, respectively).
Conclusion: The data suggest that reduced Th1 response in eBL might be due to increased
levels of IL-10 and T reg cells.
Keywords: Burkitt’s lymphoma; malaria; EBNA1; Th2; Treg cells
1. Introduction
Endemic Burkitt’s Lymphoma (eBL) is a common childhood malingnacy in Equatorial Africa [1,2]
Strong and consistent association of BL and Epstein-Barr virus (EBV) is known, and EBV and malaria
are believed to be co-factors in the development of eBL [3–5]. EBV is also associated with some
malignancies, including nasopharyngeal carcinoma and AIDS-related non-Hodgkin lymphoma. [6–8]
Expression of latent and lytic genes by EBV does not only differ from one malignancy to another but
also from one stage to another. However, Epstein-Barr nuclear antigen 1 (EBNA-1), which is a latent
protein, is expressed in all EBV-associated lymphomas. Furthermore, it has been reported that some of
the EBV infected B lymphocytes in blood express only EBNA-1 [9], making it an important target.
Aside the speculations that malaria could play a role in early events such as providing an additive
risk for development of B-cell clones with chromosome translocations associated with the tumor [10],
there is also the need to understand the immunological mechanisms by which infection with
Plasmodium falciparum may contribute to eBL. This is moreso since there is no conclusive
explanation for the fact that about ninety percent (90%) of the world population is latently and
permanently infected with EBV [11] and yet Burkitt’s lymphoma is predominantly associated with
malaria endemic areas [12], at least before the advent of HIV and AIDS. It is easy to guess that during
P. falciparum malaria the immune surveillance may be derailed as a result of imbalances in the
immune regulation.
Because BL cells lack the ability to process EBNA-1 onto MHC Class I molecules, it was initially
assumed that CD8+ cells do not recognize EBNA-1. It has now been shown that EBNA-1 can be
presented on MHC Class I molecules if it is exogenously processed and EBNA-1-specific CD8+
cytotoxic T lymphocytes (CTLs) that do recognize EBV-transformed cells have been identified [13,14].
EBNA-1 can also be processed onto MHC class II for CD4+ T cells and in both in vitro system and a
mouse model EBNA-1-specific CD4+ T cells have been shown to have the capacity to prevent BL
development [15–18]. Furthermore, among the virus-encoded antigens that stimulate CD4+ T cells,
EBNA-1 is preferentially recognized. However, it has also been found that there is diminished
EBV-specific Th1 responses in children living in malaria-holoendemic areas [19] and deficiency of
EBNA-1-specific IFN-γ T cell responses in children with eBL [8]. The mechanism is not clear and in

Biomedicines 2015, 3 226
this study we examined some of the possible factors that may contribute to the deficiency of
EBNA-1-specific Th1 responses.
2. Experimental Section
2.1. Study Population and Inclusion Criteria
This was a case control study involving two categories of patients and a third group of age-and
sex-matched healthy controls. Twenty-one children with endemic Burkitt’s lymphoma (eBL), aged
from three to 11 years, were enrolled at the Korle-Bu Teaching Hospital. Recruitment followed clinical
and confirmatory diagnosis. BL patients who had started treatment with malaria or asymptomatic
parasitemia were excluded from the study. Twenty-six children with acute uncomplicated malaria,
confirmed on blood film, of ages ranging from three to 14 years were also enrolled from University of
Ghana hospital and the Ghana Atomic Energy Commission clinic. Nineteen age-matched healthy
controls without parasitaemia were also enrolled for the study (Table 1). Informed consent was
obtained from parents or guardians of children before enrollment in the study. The study was
conducted in accordance with the Declaration of Helsinki. The Institutional Review Board at Noguchi
Memorial Institute granted ethical approvals for the study (Certified Protocol Number (CPN): 047/07-08).
Table 1. Clinical characteristics of the study participants.
Characteristic
Participants Significance
Malaria Patients (MAL)
eBL Patients
Controls (CON)
CON vs. MAL
CON vs. eBL
eBL vs. MAL
Mean (95% CI) p-Value
Male # 14 14 13 - - - Female # 12 7 6 - - -
Mean Age (range, years)
8.6 (3 to 14) 6.9
(3 to 11) 8.7 (5 to 14) - - -
WBC # (×103/μL)
8.75 (7.36 to 10.15)
8.17 (6.96 to 9.38)
5.95 (5.43 to 6.47)
0.0039 0.0017 0.5518
HGB (g/dL) 11.63
(10.9 to 12.3) 10.78
(7.7 to 13.9) 12.10
(11.5 to 12.7) - 0.2906 * -
Parasitemia (parasites/μL)
475 (76 to 9275)
- - - - -
# represents number.* p-value for student’s t-test.
2.2. Sample Collection and Processing
Blood was collected into sterile heparin and EDTA tubes (BD Vacutainer™) using sterile safety-lok™
blood collection set and were processed within three hours. Peripheral blood mononuclear cells
(PBMC) were isolated by Ficoll-Histopaque (Sigma-Aldrich, St. Louis, MO, USA) density gradient
centrifugation using a 10ml cell-separator tube (LeucoSep™ tube; Sigma-Aldrich). PBMC layer was
harvested, washed three times in RPMI1640 containing 10% heat-inactivated foetal calf serum (FCS),
and supplemented with penicillin/streptomycin and L-glutamine. The PBMC were then dispersed in a
cold freezing mix (10% DMSO in FCS), aliquoted into cryotubes, placed in Mr. Frosty® (Nalgene
Biomedicines 2015, 3 227
cryo1 °C freezing container, Nalgene, Rochester, NY, USA) and frozen at −80 °C overnight. The cells
were transferred into liquid nitrogen the following day for cryopreservation. The plasma was stored in
vials at −80 °C.
2.3. Parasitological and Haematological Examinations
An automated haematology analyzer (Sysmex KX-21, Sysmex, Kobe, Japan) was used to determine
all the haematological parameters of the participants. The absolute counts of lymphocytes were
determined from this analysis. All the venous blood samples were examined for presence of
parasite-infected red blood cells to confirm infection with P. falciparum and also to exclude
asymptomatic healthy donors. Thick and thin blood smears were prepared, dried and the thin smears
fixed in methanol. The films were then stained with freshly prepared 10% Giemsa (BDH Laboratory
Supplies, Poole BH15 ITD, Leics., UK) and washed cautiously and thoroughly under running tap
water. The slides were dried and observed with immersion oil under a light microscope (Olympus
BH-2, Olympus Optical Co., Tokyo, Japan) at 100× magnification, for the presence of P. falciparum
infected red blood cells.
2.4. Cell Phenotyping
PBMC were quickly thawed in a water bath at 37 °C and washed twice in RPMI1640 containing
10% heat-inactivated FCS, supplemented with penicillin/streptomycin and L-glutamine. The cells were
then stained with Trypan blue to ascertain cell viability and viable cell concentration adjusted to
1 × 10⁶/mL in a staining buffer, and stained with combinations of T-cell subset or activation marker,
CD25 or CD95-specific monoclonal antibodies conjugated to fluorescein isothiocyanate (FITC),
phycoerythrin (PE) or PE-Cy5. Surface staining was done with antibodies directed against CD3
(HIT3a; BioLegend, San Diego, CA, USA), CD4 (RPA-T4; BioLegend), CD8 (RPA-T8; BioLegend),
CD25 (BC96; BioLegend), and CD95 (DX2; BioLegend).
Three microliters (3 µL) of the antibodies were added to the cells and mixed. Stained PBMC were
incubated at room temperature in the dark for 15 min. After incubation, the cells were washed with
FACS Buffer three times with supernatants decanted. Cells were re-suspended in 200 µL of FACS
buffer for acquisition or re-suspended in 1 mL of fixation/permeabilization buffer and taken through
intracellular staining.
2.5. Intracellular Cytokine Detection
PBMC were first stimulated with antigens or mitogens of interest before any staining was done, as
described below. Before intracellular staining, the cells were stained with antibodies directed against
CD4 (RPA-T4; BioLegend), CD8 (RPA-T8; BioLegend), and CD25 (BC96; BioLegend) as described
above. Intracellular staining was done using FoxP3 staining buffer set (cat 00-5523, eBiosciences, San
Diego, CA, USA), according to the manufacturer’s instructions. However, the data on FoxP3+ cells
were not presented in this report.
Surface-labelled PBMC were fixed and permeabilized by adding 1ml of freshly prepared
fixation/permeabilization buffer and incubated in the dark at room temperature for 20 min. After

Biomedicines 2015, 3 228
incubation, the cells were washed twice with 2 mL of 1× permeabilization wash buffer and supernatant
carefully aspirated each time. The fixed/permeabilized cells were re-suspended in residual
permeabilization wash buffer. The 3 µL of antibodies for intracellular staining; interferon-gamma
(IFN-, 4S.B3; BioLegend), interleukin-4 (IL-4, MP4-25D2; BioLegend) and FoxP3 (PCH101,
eBiosciences), were then added to the cells, pulse vortexed and incubated in the dark for 20 min. After
incubation, the PBMC were first washed with 2 mL of 1× permeabilization buffer and, second, with
2 mL of flow cytometry staining buffer. The stained cells were then re-suspended in 200 µL of flow
cytometry staining buffer for acquisition.
2.6. In Vitro Stimulation
PBMC were cultured for 6 h in the presence of stimulants, such as PepTivator-EBV EBNA-1
(EBNA-1; Miltenyi Biotec, Auburn, CA, USA) peptide pool and phytohaemagglutinin (PHA),
at 1.5 × 10⁶ PBMC/well in 150 µL medium in 96 flat-bottom plates (culture medium: RPMI
supplemented with penicillin/streptomycin and 10% human pool AB serum). After 2 h, 1:1000
brefeldin A was added to allow accumulation of cytokines in the cytosol and incubated for the
remainder of the 6 h. Six hours was chosen for the cytokine secretion assay with respect to the
EBNA-1 manufacturer’s recommendations (Miltenyi Biotec). 3 mL of EBNA-1 peptide pool of stock
concentration of 30 nmol of each peptide per mL was added to each well making a final concentration
approximately 0.6 nmol/mL (or 1 µg/mL) of each peptide. The pool of EBNA-1 peptides consists
mainly of 15-mer sequences with 11 amino acids overlap, covering the compete sequence (except the
GA region) of the EBNA-1 (Miltenyi Biotec). Therefore, the peptides spanned all the regions
(including the entire C-terminal region) of the protein, encompassing all possible epitopes. PHA was
added as a positive control at a final concentration of 5 µg/mL. Medium without stimulant was
included as a negative control.
After stimulation, the cells were carefully collected by pipetting up and down and wells rinsed with
buffer. The cells were then washed in FACS buffer and aliquoted at a minimum of 100,000 cells in 100 µL
for surface and intracellular staining as described above.
2.7. Flow Cytometric Acquisition and Analyses
Flow cytometry acquisition was done using a FACScan flow cytometer (Becton Dickinson, San
Jose, CA, USA). Two or three-color flow cytometry analyses panels were employed. Appropriate
isotype controls were also analyzed. Before data acquisition, instrument parameters were checked and
optimized using CaliBRITE beads (Becton Dickinson). Data were acquired with Multiset CellQuest
software (Becton Dickinson) and analyzed using FlowJo software (Treestar, Ashland, OR, USA).
Lymphocyte population was set using FSC display and gated.
2.8. Measurement of Cytokines by ELISA
Levels of the cytokines, tumor necrosis factor-alpha (TNF-α), and Interleukin-10 (IL-10) were
determined in plasma of eBL patients as well as their healthy counterparts by ELISA. Briefly,
microtiter plates were coated with 50 μL/well of purified anti-human TNF-α or anti-human IL-10
Biomedicines 2015, 3 229
monoclonal antibody at 2 μg/mL and incubated overnight at 4 °C. After washing and blocking,
standard recombinant human TNF-α or IL-10 was added at serial dilutions from 200 pg/mL to
3 pg/mL in addition to undiluted plasma at 50 μL/well in duplicates. After incubation and washing,
a biotinylated anti-human TNF-α or IL-10 was added and the plates again incubated and washed.
An avidin peroxidase conjugate was then added at 2.5 μg/mL followed by another incubation. After
washing, OPD substrate was added and the plates developed, and read at 492 nm. The optical density
values of the standards were used to draw the appropriate curves that were used to transform the
sample optical density values to concentrations in pg/mL.
2.9. Statistical Analyses
Data was analyzed using SPSS 16.0 (SPSS Inc., Chicago, IL, USA) and GraphPad Prism
(GraphPad Prism, GraphPad Software, San Diego, CA, USA) software. Statistical analyses were
performed using Student t-test and Kruskall-Wallis or Mann–Whitney rank sum nonparametric tests.
p < 0.05 was considered significant.
3. Results
3.1. Characteristics of Study Participants
Participants recruited for this study included; 19 healthy controls, 21 eBL patients and 26 malaria
patients, with mean ages 8.7 (range: 5–14), 6.9 (range: 3–11) and 8.6 (range: 3–14) years respectively.
Absolute number of WBC, were significantly higher in malaria patients and eBL patients compared to
healthy controls (p = 0.004, p = 0.002, respectively). There were no differences between malaria and
eBL patients with regard to absolute numbers of WBC (p = 0.552; Table 1).
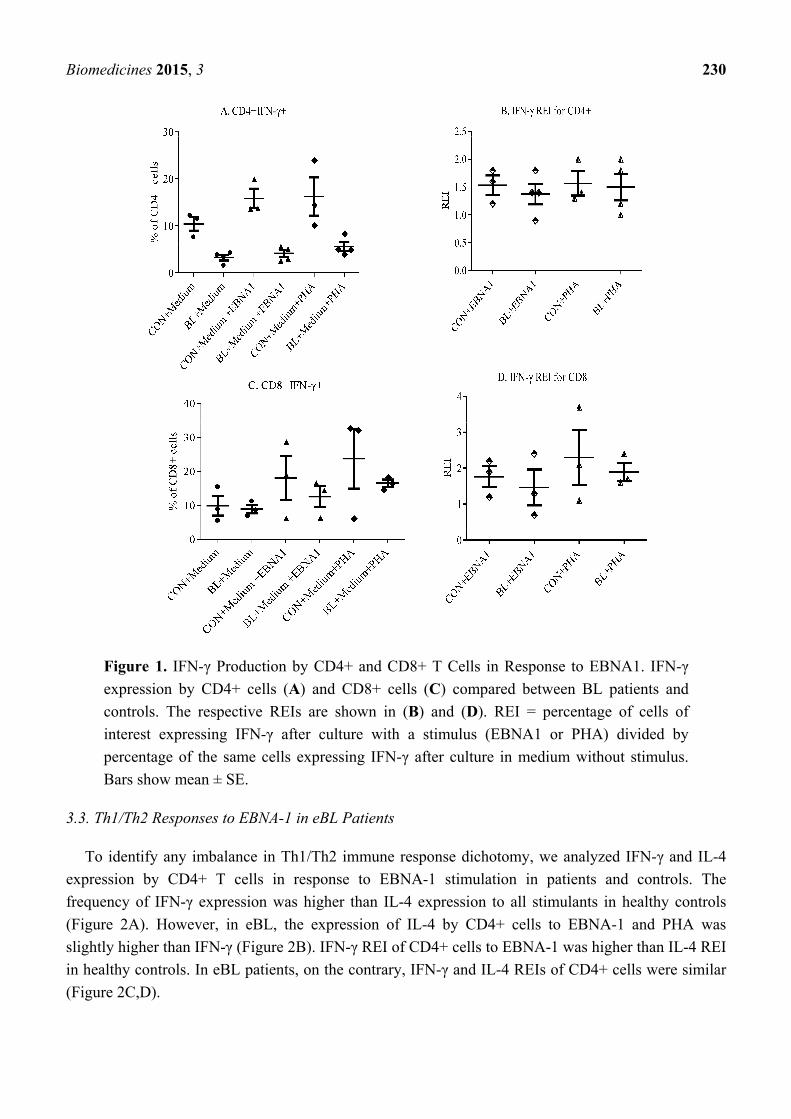
3.2. Decrease in Responses by T Cells of eBL Patients
To evaluate the specific responses of T cells, PBMC were stimulated with EBNA-1. PHA and
medium without any stimulation were used as positive and negative controls, respectively. Only three
controls and four eBL patients were included in the intracellular staining, due to limited resources.
They were selected based on age- and sex-matching and being used in other assays. Figure 1 shows the
response of CD4+ and CD8+ T cells to EBNA-1. Generally, CD4+ and CD8+ cells expressed more
IFN-γ in controls than in eBL patients to all the stimulants (Figure 1A,C). It was also observed that
CD4+ T cells from healthy controls had higher interferon-γ relative expression index (IFN-γ REI) to
EBNA-1 compared to those from eBL patients (Figure 2B). This indicates a decrease in EBNA-1-specific
response by CD4+ T cells in eBL. On the contrary, CD8+ cells of patients and controls had similar
IFN-γ REI (Figure 1D). This indicates that, although there is general decrease in response by CD8+
cells, there is no reduction in EBNA-1-specific Th1 response by CD8+ T cells in eBL.
Biomedicines 2015, 3 230
Figure 1. IFN-γ Production by CD4+ and CD8+ T Cells in Response to EBNA1. IFN-γ
expression by CD4+ cells (A) and CD8+ cells (C) compared between BL patients and
controls. The respective REIs are shown in (B) and (D). REI = percentage of cells of
interest expressing IFN-γ after culture with a stimulus (EBNA1 or PHA) divided by
percentage of the same cells expressing IFN-γ after culture in medium without stimulus.
Bars show mean ± SE.
3.3. Th1/Th2 Responses to EBNA-1 in eBL Patients
To identify any imbalance in Th1/Th2 immune response dichotomy, we analyzed IFN-γ and IL-4
expression by CD4+ T cells in response to EBNA-1 stimulation in patients and controls. The
frequency of IFN-γ expression was higher than IL-4 expression to all stimulants in healthy controls
(Figure 2A). However, in eBL, the expression of IL-4 by CD4+ cells to EBNA-1 and PHA was
slightly higher than IFN-γ (Figure 2B). IFN-γ REI of CD4+ cells to EBNA-1 was higher than IL-4 REI
in healthy controls. In eBL patients, on the contrary, IFN-γ and IL-4 REIs of CD4+ cells were similar
(Figure 2C,D).

Biomedicines 2015, 3 231
Figure 2. IFN-γ and IL-4 Expression to EBNA1 and PHA by CD4+ Cells. Comparisons were
made between IFN-γ and IL-4 expression by CD4+ of controls (A) and eBL patients (B).
REIs for IFN-γ and IL-4 for controls and eBL patients are also presented in the lower
panels (C and D, respectively). Bars show mean ± SE.
3.4. High Plasma Level of TNF-α and IL-10 in eBL Patients
Plasma levels of TNF-α and IL-10 were also measured to examine Th1/Th2 cytokine balance
in vivo. The median level of peripheral blood TNF-α was significantly lower in eBL patients compared
to healthy controls (p = 0.004). Conversely, plasma level of IL-10 was significantly higher in eBL
patients than in healthy controls (p = 0.038; Figure 3).
Figure 3. Plasma levels of TNF-alpha and IL-10 of eBL patients (n = 21) and controls
(n = 16) compared. The whiskers show maximum and minimum values.

Biomedicines 2015, 3 232
3.5. High Frequency of CD4+CD25hi+ Treg Cells in Patients
The frequency of Treg cells was also analyzed to determine their possible role in diminished
responses in the eBL patients. The median frequency of CD4+CD25hi+ Treg cells were higher in both
malaria and eBL patients compared to healthy controls (p = 0.000 and p = 0.027, respectively). Data on
the frequency of CD4+CD25hi+FoxP3+ Treg cells has yet to be concluded. Additionally, the
CD4+CD25hi+/CD4+CD25+ ratio was also examined and found to be significantly higher in malaria
and eBL patients compared to the healthy controls (p = 0.004 and p = 0.014, respectively).
No significant differences were found between malaria and eBL patients with regard to the frequency
of CD4+CD25hi+ cells and CD4+CD25hi+/CD4+CD25+ ratio (p = 0.411 and p = 0.148, respectively;
Figure 4).
Figure 4. CD25hi expression by CD4+ cells. The quadrants represent CD25 expression by
CD4+ cells in eBL (left panels, n = 14), acute uncomplicated malaria (middle panels, n = 26)
and healthy controls (right panels, n = 19). The charts compare CD25hi expression by CD4+
cells and CD4+CD25hi+/CD4+CD25+ among the categories. Error bars represent 95% CI.
Biomedicines 2015, 3 233
4. Discussion
Children living in malaria endemic regions are at the highest risk of having eBL. It has been
established that malaria contributes to the development of eBL and it is believed that persistent malaria
and associated dysregulation of the immune system could play an important role in the development of
eBL. Recent studies have shown diminished EBV-specific Th1 responses in children living in
malaria-holoendemic areas [19] and deficiency of EBNA-1-specific IFN-γ T cell responses in children
with eBL [8]. This study aimed at shedding light on some of the mechanisms that could lead to
reduced specific responses to EBNA-1 and the contribution of malaria infection.
The higher IFN-γ REI for CD4+ T cells from healthy donors compared to those from eBL patients
corroborate the loss of EBNA-1-specific response by CD4+T cells in eBL reported in a recent study [8].
The similarity in IFN-γ REI for CD8+ T cells between eBL patients and healthy controls suggests that
there is no reduction in EBNA-1-specific Th1 response by CD8+ T cells in eBL. This finding is also in
agreement with what has been observed by others [8]. Moreover, in CD4+ T cells, the frequency of
IFN-γ expression to all stimulants was higher in healthy controls than in eBL patients. Furthermore, in
CD8+ cells, IFN-γ expression to all stimulants was slightly lower in eBL patients compared to the
healthy controls. This implies that IFN-γ expression by CD4+ T cells is somehow affected in eBL patients.
To explain this we examined Th1/Th2 dichotomy comparisons that were made between IFN-γ and
IL-4 expression by CD4+ cells of controls and eBL patients. The results point to a slight tilting of
EBNA-1-specific responses in favor of Th2 in eBL, compared to strongly skewed responses in favor of
Th1 in controls. However, further work is required. Th2-weighted responses are known to suppress
T-cell function [20]. The low plasma level of TNF-α and the high level of IL-10 in patients is an
indication of similar dysregulation of the immune response in vivo. IL-10 promotes Th2 responses
while down-regulating Th1 responses, particularly proliferation and activation of CTLs. Priming of
EBNA-1-specific CD4+ T cells by dendritic cells might also be impaired in vivo by IL-10 [21]. TNF-α,
as its name connotes, has the ability to kill tumor cells. It has been shown in an islet cancer of the
pancreas that TNF, as well as IFN-γ, can, at least, drive cancer cells into senescence [22,23].
Down-regulation of TNF-α production in eBL patients indicates that the anti-tumor mechanism
involving TNF-α is rather reduced in patients where it is most needed.
The possible involvement of Treg cells in eBL development was also examined. Treg cells are
involved in immunological tolerance and malaria is known to promote the development and function
of Treg cells. In a murine model, addition of antigen-specific Treg cells inhibits effector T cell
response [24]. Our data show a significant increase in the frequency of CD4+CD25hi+ cells in both
malaria and eBL. This suggests the involvement of Treg cells in immunity to eBL and may support the
speculation that malaria could contribute to the development of EBV+ tumors through activities of
Treg cells. Previous studies have pointed to Treg cells in the development of tumors [25,26] but this is
the first time they are implicated in eBL. CD4+CD25hi+ Treg cells is a composite group, some express
FoxP3 and exert their suppressive activity through cell-cell contact and others lack the FoxP3 (Tr1
cells) and exert their activity through secretion of immunosuppressive cytokines such as TGF-β and
IL-10 [27,28]. Tr1 cells are known to secrete IL-10 [29] and this suggests that CD4+CD25hi+ cells
may contribute to the high IL-10 levels in the patients. EBV-infected B cells also produced human
IL-10 [30]. CD4+CD25hi+/CD4+CD25+ ratio, which represents Treg cell/effector T cell ratios, was

Biomedicines 2015, 3 234
found to be higher in both malaria and eBL patients than in controls. This is an indication of impaired
function of effector T cells in the patients. However, further analysis of the CD4+CD25hi+ Treg cells
is required to fully understand their role in eBL development.
The high plasma level of IL-10 in eBL, and the high frequency of CD4+CD25hi+ Treg cells in malaria
and eBL, give credence to the parallel between dysregulation of the immune system in the two diseases.
5. Conclusions
In summary, the data suggest that the reduced Th1 responses in eBL might be due to increased
levels of IL-10 and Treg cells. It also indicates that malaria may also contribute to the development of
eBL through increased secretion of IL-10 and generation of Treg cells.
Acknowledgments
Parents, guardians and children are thanked for their participation in this study. Our indebtedness
goes to all doctors and nurses who assited with the sample collection, especially, Juliana Mitchell and
Cathrine Segbefia. Gerald Laryea, Kakra Dickson, Eric Kyei-Baafour and Andrea Arku Twumwah are
thanked for technical assistance.
This work was supported by a grant from University of Ghana Research Fund.
Author Contributions
Godfred Futagbi: designed the study, collected the samples, carried out laboratory work, data
analysis and interpretation and drafted the manuscript. Ben Gyan: designed the study, assisted with
data analysis and extensively revised the manuscript for intellectual content. Harriet Nunoo: assisted
with sample collection and laboratory work. John K.A. Tetteh: assisted with flow cytometry and data
analysis. Jennifer E. Welbeck: assisted with design of study as well as revision of manuscript for
intellectual content. Lorna Awo Renner: assisted with design of study as well as revision of manuscript
for intellectual content. Michael Ofori, Daniel Dodoo and Dominic A. Edoh: assisted with design of
study and revised manuscript for intellectual content. Bartholomew D. Akanmori: designed the study
and extensively revised the manuscript for intellectual content.
Conflicts of Interest
The authors declare no conflict of interest.
References
1. Mwanda, O.W.; Rochford, R.; Moormann, A.M.; Macneil, A.; Whalen, C.; Wilson, M.L. Burkitt’s
lymphoma in Kenya: Geographical, age, gender and ethnic distribution. East Afr. Med. J. 2004, 8,
S68–S77.
2. Phillips, J.A. Is Burkitt’s lymphoma sexy enough? Lancet 2006, 368, 2251–2252.
3. Epstein, M.A.; Achong, B.G.; Barr, Y.M. Virus particles in cultured lymphoblasts from Burkitt’s
lymphoma. Lancet 1964, 1, 702–703.

Biomedicines 2015, 3 235
4. Oyama, T.; Yamamoto, K.; Asano, N.; Oshiro, A.; Suzuki, R.; Kagami, Y.; Morishima, Y.;
Takeuchi, K.; Izumo, T.; Mori, S.; et al. Age-related EBV-associated B-cell lymphoproliferative
disorders constitute a distinct clinicopathologic group: A study of 96 patients. Clin. Cancer Res.
2007, 13, 5124–5132.
5. Shimoyama, Y.; Yamamoto, K.; Asano, N.; Oyama, T.; Kinoshita, T.; Nakamura, S. Age-related
Epstein-Barr virus-associated B-cell lymphoproliferative disorders: special references to
lymphomas surrounding this newly recognized clinicopathologic disease. Cancer Sci. 2008, 99,
1085–1091.
6. Piriou, E.; van Dort, K.; Nanlohy, N.M.; van Oers, M.H.; Miedema, F.; van Baarle, D. Loss of
EBNA1-specific memory CD4+ and CD8+ T cells in HIV-infected patients progressing to
AIDS-related non-Hodgkin lymphoma. Blood 2005, 106, 3166–3174.
7. Fogg, M.H.; Wirth, L.J.; Posner, M.; Wang, F. Decreased EBNA-1-specific CD8+ T cells in
patients with Epstein-Barr virus-associated nasopharyngeal carcinoma. Proc. Natl. Acad. Sci. USA
2009, 106, 3318–3323.
8. Moormann, A.M.; Heller, K.N.; Chelimo, K.; Embury, P.; Ploutz-Snyder, R.; Otieno, J.A.; Oduor, M.;
Munz, C.; Rochford, R. Children with endemic Burkitt lymphoma are deficient in EBNA1-specific
IFN-gamma T cell responses. Int. J. Cancer 2009, 124, 1721–1726.
9. Chen, F.; Zou, J.-Z.; di Renzo, L.; Wingberg, G.; Hu, L.-F.; Klein, E. A subpopulation of normal
B cells latently infected with Epstein-Bar virus resembles Burkitt lymphoma cells in expressing
EBNA-1 But not EBNA-2 or LMPl. J. Virol. 1995, 69, 3752–3758.
10. Magrath, I.; Jain, V.; Bhatia, K. Epstein-Barr virus and Burkitt’s lymphoma. Semin. Cancer Biol.
1992, 3, 285–295.
11. Magrath, I. The pathogenesis of Burkitt’s lymphoma. Adv. Cancer Res. 1990, 55, 133–270.
12. Brady, G.; MacArthur, G.J.; Farrel, P.J. Epstein-Barr virus and Burkitt lymphoma. J. Clin. Path.
2007, 12, 1397–1402.
13. Blake, N.; Lee, S.; Redchenko, I.; Thomas, W.; Steven, N.; Leese, A.; Steigerwald-Mullen, P.;
Kurilla, M.G.; Frappier, L.; Rickinson, A. Human CD8+ T cell responses to EBV EBNA1: HLA
class I presentation of the (Gly-Ala)-containing protein requires exogenous processing. Immunity
1997, 7, 791–802.
14. Voo, K. S.; Fu, T.; Wang, H.Y.; Tellam, J.; Heslop, H.E.; Brenner, M.K.; Rooney, C.M.;
Wang, R.F. Evidence for the presentation of major histocompatibility complex class I-restricted
Epstein-Barr virus nuclear antigen 1 peptides to CD8+ T lymphocytes. J. Exp. Med. 2004, 199,
459–470.
15. Munz, C.; Bickham, K.L.; Subklewe, M.; Tsang, M.L.; Chahroudi, A.; Kurilla, M.G.; Zhang, D.;
O’Donnell, M.; Steinman, R.M. Human CD4(+) T lymphocytes consistently respond to the latent
Epstein-Barr virus nuclear antigen EBNA1. J. Exp. Med. 2000, 191, 1649–1660.
16. Nikiforow, S.; Bottomly, K.; Miller, G. CD4+ T-cell effectors inhibit Epstein-Barr virus-induced
B-cell proliferation. J. Virol. 2001, 75, 3740–3752.
17. Paludan, C.; Bickham, K.; Nikiforow, S.; Tsang, M.L.; Goodman, K.; Hanekom, W.A.;
Fonteneau, J.F.; Stevanovic, S.; Munz, C. Epstein-Barr nuclear antigen 1-specific CD4(+) Th1
cells kill Burkitt’s lymphoma cells. J. Immunol. 2002, 169, 1593–1603
Biomedicines 2015, 3 236
18. Nikiforow, S.; Bottomly, K.; Miller, G.; Munz, C. Cytolytic CD4(+)-T-cell clones reactive to
EBNA1 inhibit Epstein-Barr virus-induced B-cell proliferation. J. Virol. 2003, 77, 12088–12104.
19. Moormann, A.M.; Chelimo, K.; Sumba, P.O.; Tisch, D.J.; Rochford, R.; Lutzke, M.L.;
Ploutz-Snyder, R.; Newton, D.; Kazura, J. Exposure to holoendemic malaria results in suppression
of Epstein-Barr virus specific T cell immunosurveillance in Kenyan children. J. Infect. Dis. 2007,
195, 799–808.
20. Lubega, J. T-helper 1 versus T-helper 2 lymphocyte immunodysregulation is the central factor in
genesis of Burkitt lymphoma: Hypothesis. Infect. Agent. Cancer 2007, 2, doi:10.1186/1750-9378-2-10.
21. Pouniotis, D.S.; Proudfoot, O.; Bogdanoska, V.; Scalzo, K.; Kovacevic, S.; Coppel, R.L.;
Plebanski, M. Selectively impaired CD8+ but not CD4+ T cell cycle arrest during priming as a
consequence of dendritic cell interaction with plasmodium-infected red cells. J. Immunol. 2005,
175, 3525–3533.
22. Muller-Hermelink, N.; Braumuller, H.; Pichler, B.; Wieder, T.; Mailhammer, R.; Schaak, K.;
Ghoreschi, K.; Yazdi, A.; Haubner, R.; Sander, C.A.; et al. TNFR1 signaling and IFN-gamma
signaling determine whether T cells induce tumor dormancy or promote multistage
carcinogenesis. Cancer Cell 2008, 13, 507–518.
23. Braumuller, H.; Wieder, T.; Brenner, E.; Assmann, S.; Hahn, M.; Alkhaled, M.; Schilbach, K.;
Essmann, F.; Kneilling, M.; Griessinger, C.; et al. T-helper-1-cell cytokines drive cancer into
senescence. Nature 2013, 494, 361–365.
24. Noyan, F.; Lee, Y.-S.; Hardtke-Wolenski, M.; Knoefel, A.-K.; Taubert, R.; Baron, U.; Manns,
M.P.; Jaeckel, E. Donor-specific regulatory T cells generated on Donor B Cells are superior to
CD4+CD25high cells in controlling alloimmune responses in humanized mice. Transplant Proc.
2013, 45, 1832–1837.
25. Yang, Z.Z.; Novak, A.J.; Ziesmer, S.C.; Witzig, T.E.; Ansell, S.M. Attenuation of CD8(+) T-cell
function by CD4(+)CD25(+) regulatory T cells in B-cell non-Hodgkin’s lymphoma. Cancer Res.
2006, 66, 10145–10152.
26. Strauss, L.; Bergmann, C.; Gooding, W.; Johnson, J.T.; Whiteside, T.L. The frequency and
suppressor function of CD4+CD25highFoxp3+ T cells in the circulation of patients with
squamous cell carcinoma of the head and neck. Clin. Cancer Res. 2007, 13, 6301–6311.
27. Roncarolo, M.G.; Gregori, S. Is FOXP3 a bona fide marker for human regulatory T cells? Eur. J.
Immunol. 2008, 38, 925–927.
28. Umetsu, D.T.; Akbari, O.; Dekruyff, R.H. Regulatory T cells control the development of allergic
disease and asthma. J. Allergy Clin. Immunol. 2003, 112, 480–487.
29. Roncarolo, M.G.; Bacchetta, R.; Bordignon, C.; Narula, S.; Levings, M.K. Type 1 T regulatory
cells. Immunol. Rev. 2001, 182, 68–79.
30. Burdin, N.; Peronne, C.; Banchereau, J.; Rousset, F. Epstein-Bar virus transformation induces
B-Iymphocytes to produce human interleukin 10. J. Exp. Med. 1993, 177, 295–304.
© 2015 by the authors; licensee MDPI, Basel, Switzerland. This article is an open access article
distributed under the terms and conditions of the Creative Commons Attribution license
(http://creativecommons.org/licenses/by/4.0/).


![Treg cells maintain selective access to IL-2 and immune homeostasis … · survival signals downstream of IL-2 signaling maintain Treg cells [4, 5]. Notably, Treg cells cannot make](https://img.pdfslide.net/doc/110x75/5e779032b1981e5188625c5e/treg-cells-maintain-selective-access-to-il-2-and-immune-homeostasis-survival-signals.jpg)