Embed Size (px)
Citation preview
Hic
ACE
h
•
•
•
a
ARRAA
KHsPEFS
(
0h
Analytica Chimica Acta 804 (2013) 197– 206
Contents lists available at ScienceDirect
Analytica Chimica Acta
j ourna l ho mepage: www.elsev ier .com/ locate /aca
igh-performance ion mobility spectrometry with direct electrosprayonization (ESI-HPIMS) for the detection of additives andontaminants in food
nthony J. Midey ∗, Amanda Camacho, Jayanthi Sampathkumaran,linton A. Krueger, Mark A. Osgood, Ching Wu
xcellims Corporation, 20 Main St., Acton, MA 01720, United States
i g h l i g h t s
A new ESI source was built for directionization from syringe.Phthalates, food dyes, and sweeten-ers detected with high-performanceIMS.Phthalates directly detected in cola,soy bubble tea matrices with simpletreatment.
g r a p h i c a l a b s t r a c t
r t i c l e i n f o
rticle history:eceived 24 July 2013eceived in revised form 1 October 2013ccepted 6 October 2013vailable online 14 October 2013
eywords:igh-performance ion mobility
pectrometryhthalateslectrosprayood dyesweeteners
a b s t r a c t
High-performance ion mobility spectrometry (HPIMS) with an electrospray ionization (ESI) sourcedetected a series of food contaminants and additive compounds identified as critical to monitoring thesafety of food samples. These compounds included twelve phthalate plasticizers, legal and illegal foodand cosmetic dyes, and artificial sweeteners that were all denoted as detection priorities. HPIMS sep-arated and detected the range of compounds with a resolving power better than 60 in both positiveand negative ion modes, comparable to the commonly used high-performance liquid chromatography(HPLC) methods, but with most acquisition times under a minute. The reduced mobilities, K0, have beendetermined, as have the linear response ranges for ESI-HPIMS, which are 1.5–2 orders of magnitude forconcentrations down to sub-ng �L−1 levels. At least one unique mobility peak was seen for two subsetsof the phthalates grouped by the country where they were banned. Furthermore, ESI-HPIMS successfullydetected low nanogram levels of a phthalate at up to 30 times lower concentration than internationaldetection levels in both a cola matrix and a soy-based bubble tea beverage using only a simplified sam-
ple treatment. A newly developed direct ESI source (Directspray) was combined with HPIMS to detectfood-grade dyes and industrial dye adulterants, as well as the sweeteners sodium saccharin and sodiumcyclamate, with the same good performance as with the phthalates. However, the Directspray methodeliminated sources of carryover and decreased the time between sample runs. Limits-of-detection (LOD)for the analyte standards were estimated to be sub-ng �L−1 levels without extensive sample handling orpreparation.∗ Corresponding author. Tel.: +1 978 264 1980; fax: +1 978 264 1981.E-mail addresses: [email protected], [email protected]
A.J. Midey).
003-2670/$ – see front matter © 2013 Elsevier B.V. All rights reserved.ttp://dx.doi.org/10.1016/j.aca.2013.10.010
© 2013 Elsevier B.V. All rights reserved.
1. Introduction
Identification of contaminants is critical to ensuring the safetyof the food supply, whether they are present either accidentally orintentionally [1,2]. Ion mobility spectrometry (IMS) is an analysis
1 himica Acta 804 (2013) 197– 206
tvwbtfmda(u
bdamp[oidcltiairdpp
d[iaactiAiaruCwit
oslwbfbisopfisf3[
Table 1Experimental conditions for the positive ion mode analysis of phthalate plasticiz-ers using electrospray ionization (ESI) high-performance ion mobility spectrometry(HPIMS).
Electrospray ionization (ESI) conditions Parameter
Positive ion mode Infusion ESI90:10 methanol:water solvent, 0.5%(v/v) acetic acidLiquid sample injection rate for ESI 3 �L min−1
Drift tube voltage 9100 VESI source voltage 3500 VDrift tube temperature 170 ◦CGas pre-heater temperature 170 ◦CMobility spectrum width 30 msBradbury–Nielsen gate pulse width 87 �sBradbury–Nielsen gate voltage 43 V
Data acquisition sampling rate 200,000 s−1
Number of spectra summed per cycle 20
98 A.J. Midey et al. / Analytica C
echnique providing separation of ionized samples in millisecondsia drift time differences determined by their size and structure,here the total analysis finishes in seconds [3]. A recent review
y Karpas highlights the burgeoning applications of IMS for detec-ing these contaminants in foodomics [4], where IMS could be aaster, potentially simpler method than the more widely used chro-
atographic methods [5,6]. Many of these applications of IMS haveetected volatiles associated with contamination of food and bever-ge samples via atmospheric pressure chemical ionization methodsAPCI) [4,7]; however, electrospray ionization (ESI) has also beensed in more recent work [8–11].
In particular, phthalates are one class of compound that haseen used as illicit clouding agents in some food and drinks pro-uced outside of the United States [12]. Phthalate plasticizersre used in many household and personal care products, toys,edical supplies, and other items [13]. How easily these com-
ounds are released from the plastics causes the greatest concern14]. More importantly, they are considered endocrine disrupt-rs because exposure to them has been reported to increase thencidence of developmental abnormalities and to impair repro-uction and development [15–17]. While typical screening useshromatography and mass spectrometry (MS) to detect phtha-ate contamination, the current protocols are not readily amenableo field screening [13,18,19]. However, IMS has a proven historyn rapid field detection of threats for security applications suchs chemical weapons agent (CWA) monitoring, drugs of abusenterdiction, and explosives trace detection (ETD) because the sepa-ation medium is simply ambient air [3]. Joshi et al. have previouslyetected diethyl and dibutyl phthalate (DEP and DBP) volatilesresent as additives in the headspace above smokeless explosiveowders using IMS [20].
Previously, chromatographic methods have also been used toetect many chemicals of concern, including antibiotics [19], dyes21], pesticides [22,23], and growth promoters [24]. These contam-nants are also amenable to IMS detection, but some of them, suchs the dyes, have not yet been studied with IMS. Some of the dyesre approved food and cosmetic grade colorants, but have beenited as a cause of sensitivities in certain individuals [25]. However,he toxic and carcinogenic industrial dye Rhodamine B has beenllegally added to enhance the pink color of food products [26,27].nother dye, Malachite Green, has been found in seafood because
t is an anti-bacterial agent used in aquaculture [28]. Additives suchs the artificial sweeteners sodium cyclamate and sodium saccha-in are banned to varying degrees depending on country basedpon potential health concerns from prolonged exposure [29–31].onsequently, the application of IMS instead of chromatographyould allow for a rapid screening method that could be more eas-
ly developed for on-site testing, particularly if used with ESI forhe non-volatile compounds [8].
To advance the development of potential field screening meth-ds, a series of the highest priority contaminants cited under foodafety monitoring programs are reported on having been ana-yzed using high-performance ion mobility spectrometry (HPIMS)
ith electrospray ionization (ESI) to establish its detection capa-ilities. These compounds include phthalates, legal and illegalood dyes, and artificial sweeteners. ESI-HPIMS has previouslyeen used to analyze nutritional supplements [8] and been shown
n a recent overview to be amenable to analyzing the dyealts and phthalates [32], routinely achieving resolving power ofver 60, comparable to high-performance liquid chromatogra-hy (HPLC) [33] and over twice the resolving power of currenteld-use IMS instruments in security applications [34]. Using a
implified sample preparation method, ESI-HPIMS has success-ully detected phthalates in beverages to single nanogram level,0 times lower than some current international detection levels35,36].Drift gas flow rate 1.5 LpmCurtain gas pumping rate 1.5 Lpm
In addition, a new ESI source that ionizes the sample directlyfrom a syringe’s needle tip (i.e., Directspray) has been devel-oped. Its use to analyze both legal and illegal artificial food dyes[32] and artificial sweeteners is discussed here, where the aimis high-throughput sample processing. Directly ionizing from thesample-containing syringe eliminates the transfer tubing of infu-sion sources to greatly reduce both carryover and the amount ofrinsing solvent needed between samples. Sub-nanogram concen-trations of Rhodamine B, Malachite Green, and other legal andillegal dye compounds have also been detected with a good linearresponse range using only simple dilution and no preconcentration.Similar performance to LC methods is achieved with ESI-HPIMS aswith the phthalates, again using only air drift gas.
2. Material and methods
2.1. Experimental
2.1.1. Electrospray ionization (ESI) source for phthalatesThe well-established electrospray ionization (ESI) technique
was employed to ionize the analyte compounds prior to injec-tion into the HPIMS for ion mobility separation. The phthalatestandards were prepared as 5–50 ng �L−1 ESI solutions in 90:10methanol:water with 0.5% (v/v) acetic acid and used with theinstrument conditions in Table 1 discussed later. As seen previously[8], the “softer” ionization afforded by ESI excelled at providing ameans for introducing and ionizing non-volatile, higher molecularweight compounds and solutions of ionic salt compounds, pro-ducing peaks that preserved the analytes’ structure. The completeinstrument parameters are given in Table 1 for the phthalate exper-iments and Table 2 for the dye and sweetener experiments. For theformer compounds, a traditional infusion-type ESI source was used,whereby a gas-tight syringe was attached to a needle port and aninfusion pump pushed the liquid analyte sample through 150 �mID fused silica chemically-deactivated capillary tubing (SGE) at3 �L min−1 to the ESI needle. The ions produced via ESI were sam-pled through an aperture into an interface region pumped by adiaphragm pump to assist in the electrospray process and beginthe desolvation of the ions. Typical interface region pumping rateswere 0.3–1.5 Lpm and were adjusted as needed to achieve the moststable ESI intensity. The ions in the interface region passed througha second larger diameter aperture into the desolvation region of
the high-performance ion mobility spectrometry (HPIMS) instru-ment schematically illustrated in Fig. 1(a) and described in thesucceeding sections.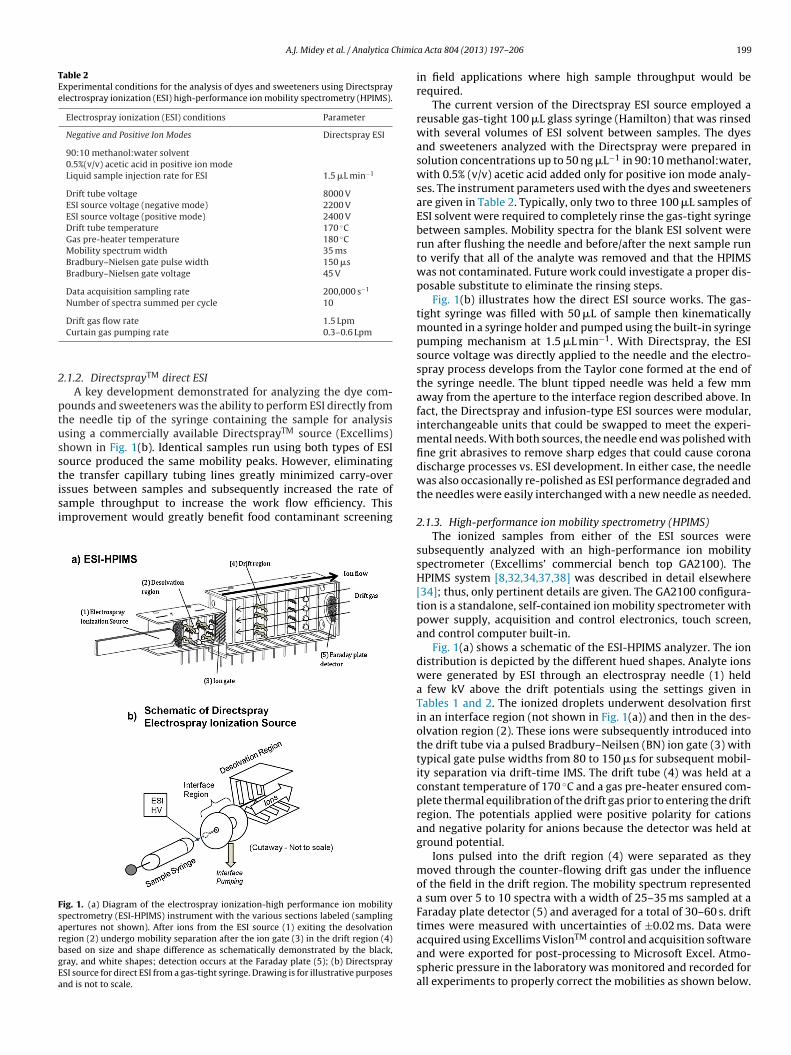
A.J. Midey et al. / Analytica Chimic
Table 2Experimental conditions for the analysis of dyes and sweeteners using Directsprayelectrospray ionization (ESI) high-performance ion mobility spectrometry (HPIMS).
Electrospray ionization (ESI) conditions Parameter
Negative and Positive Ion Modes Directspray ESI
90:10 methanol:water solvent0.5%(v/v) acetic acid in positive ion modeLiquid sample injection rate for ESI 1.5 �L min−1
Drift tube voltage 8000 VESI source voltage (negative mode) 2200 VESI source voltage (positive mode) 2400 VDrift tube temperature 170 ◦CGas pre-heater temperature 180 ◦CMobility spectrum width 35 msBradbury–Nielsen gate pulse width 150 �sBradbury–Nielsen gate voltage 45 V
Data acquisition sampling rate 200,000 s−1
Number of spectra summed per cycle 10
2
ptusstisi
FsarbgEa
Drift gas flow rate 1.5 LpmCurtain gas pumping rate 0.3–0.6 Lpm
.1.2. DirectsprayTM direct ESIA key development demonstrated for analyzing the dye com-
ounds and sweeteners was the ability to perform ESI directly fromhe needle tip of the syringe containing the sample for analysissing a commercially available DirectsprayTM source (Excellims)hown in Fig. 1(b). Identical samples run using both types of ESIource produced the same mobility peaks. However, eliminatinghe transfer capillary tubing lines greatly minimized carry-over
ssues between samples and subsequently increased the rate ofample throughput to increase the work flow efficiency. Thismprovement would greatly benefit food contaminant screeningig. 1. (a) Diagram of the electrospray ionization-high performance ion mobilitypectrometry (ESI-HPIMS) instrument with the various sections labeled (samplingpertures not shown). After ions from the ESI source (1) exiting the desolvationegion (2) undergo mobility separation after the ion gate (3) in the drift region (4)ased on size and shape difference as schematically demonstrated by the black,ray, and white shapes; detection occurs at the Faraday plate (5); (b) DirectspraySI source for direct ESI from a gas-tight syringe. Drawing is for illustrative purposesnd is not to scale.
a Acta 804 (2013) 197– 206 199
in field applications where high sample throughput would berequired.
The current version of the Directspray ESI source employed areusable gas-tight 100 �L glass syringe (Hamilton) that was rinsedwith several volumes of ESI solvent between samples. The dyesand sweeteners analyzed with the Directspray were prepared insolution concentrations up to 50 ng �L−1 in 90:10 methanol:water,with 0.5% (v/v) acetic acid added only for positive ion mode analy-ses. The instrument parameters used with the dyes and sweetenersare given in Table 2. Typically, only two to three 100 �L samples ofESI solvent were required to completely rinse the gas-tight syringebetween samples. Mobility spectra for the blank ESI solvent wererun after flushing the needle and before/after the next sample runto verify that all of the analyte was removed and that the HPIMSwas not contaminated. Future work could investigate a proper dis-posable substitute to eliminate the rinsing steps.
Fig. 1(b) illustrates how the direct ESI source works. The gas-tight syringe was filled with 50 �L of sample then kinematicallymounted in a syringe holder and pumped using the built-in syringepumping mechanism at 1.5 �L min−1. With Directspray, the ESIsource voltage was directly applied to the needle and the electro-spray process develops from the Taylor cone formed at the end ofthe syringe needle. The blunt tipped needle was held a few mmaway from the aperture to the interface region described above. Infact, the Directspray and infusion-type ESI sources were modular,interchangeable units that could be swapped to meet the experi-mental needs. With both sources, the needle end was polished withfine grit abrasives to remove sharp edges that could cause coronadischarge processes vs. ESI development. In either case, the needlewas also occasionally re-polished as ESI performance degraded andthe needles were easily interchanged with a new needle as needed.
2.1.3. High-performance ion mobility spectrometry (HPIMS)The ionized samples from either of the ESI sources were
subsequently analyzed with an high-performance ion mobilityspectrometer (Excellims’ commercial bench top GA2100). TheHPIMS system [8,32,34,37,38] was described in detail elsewhere[34]; thus, only pertinent details are given. The GA2100 configura-tion is a standalone, self-contained ion mobility spectrometer withpower supply, acquisition and control electronics, touch screen,and control computer built-in.
Fig. 1(a) shows a schematic of the ESI-HPIMS analyzer. The iondistribution is depicted by the different hued shapes. Analyte ionswere generated by ESI through an electrospray needle (1) helda few kV above the drift potentials using the settings given inTables 1 and 2. The ionized droplets underwent desolvation firstin an interface region (not shown in Fig. 1(a)) and then in the des-olvation region (2). These ions were subsequently introduced intothe drift tube via a pulsed Bradbury–Neilsen (BN) ion gate (3) withtypical gate pulse widths from 80 to 150 �s for subsequent mobil-ity separation via drift-time IMS. The drift tube (4) was held at aconstant temperature of 170 ◦C and a gas pre-heater ensured com-plete thermal equilibration of the drift gas prior to entering the driftregion. The potentials applied were positive polarity for cationsand negative polarity for anions because the detector was held atground potential.
Ions pulsed into the drift region (4) were separated as theymoved through the counter-flowing drift gas under the influenceof the field in the drift region. The mobility spectrum representeda sum over 5 to 10 spectra with a width of 25–35 ms sampled at aFaraday plate detector (5) and averaged for a total of 30–60 s. drifttimes were measured with uncertainties of ±0.02 ms. Data were
acquired using Excellims VisIonTM control and acquisition softwareand were exported for post-processing to Microsoft Excel. Atmo-spheric pressure in the laboratory was monitored and recorded forall experiments to properly correct the mobilities as shown below.
2 himic
r(rd
K
K
rtKumtiK
fw
K
Kcr(it(amu
2
m(tdriHvsp
pD((lcpnArwRd
00 A.J. Midey et al. / Analytica C
An ion’s mobility through the drift tube determined its sepa-ation, defined practically as the ratio of the average ion velocityvd) to the applied electric field (E) when operating in the low-fieldegion. Experimentally, an ion’s mobility (K) in cm2 V−1 s−1 wasetermined with the following equation:
= vd
E= L2
tdV(1)
0 = K ·(
P
29.92
)·(
273.15Td
)(2)
This equation described separation over the length of the driftegion, L, in cm based on the time in seconds to travel the length ofhe drift region (drift time, td) under the voltage V applied to it [3].
could be converted using Eq. (2) to a reduced mobility definednder standard conditions, K0, for direct comparison to mobilitieseasured in other drift time IMS experiments [3,20], where P was
he drift tube operating pressure (here, the atmospheric pressuren inches of Hg) and Td was the temperature of the drift tube inelvin [3].
To account for any systematic differences or other instrumentalactors, the reduced mobilities for the target compounds, K0(unk),ere calibrated using Eq. (4) [39,40].
0(unk) =(
td(cal)td(unk)
)· K0(cal) (4)
In positive ion mode, K0(unk) was calibrated against0(cal) = 1.22 cm2 V−1 s−1 for l-glutathione (GSH), an HPIMSalibrant used to check for proper ESI source operation whoseeduced mobility had been verified previously using nicotinamideK0 = 1.86 cm2 V−1 s−1) routinely employed as an internal standardn commercial trace detection IMS instruments [41,42]. For nega-ive ion mode, the K0(cal) for 1,2,4,5-benzenetetracarboxylic acidi.e., pyromellitic acid) of 1.32 cm2 V−1 s−1measured by Beauchampnd co-workers [43] using ESI-IMS-MS was used to calibrate thoseobilities and verify ESI functionality. The reduced mobilities had
ncertainties of ±0.01 cm2 V−1 s−1.
.2. Materials used
All of the following materials were used as obtained from theanufacturer for the experiments. Breathing quality cylinder air
Middlesex Gases) was used as the IMS drift gas. The gas was passedhrough a column containing 8X molecular sieve and DrieriteTM
esiccant to remove trace amounts of organics and water vapor,espectively, prior to entering the gas pre-heating system of thenstrument. The methanol and water electrospray solvents werePLC Grade (Alfa Aesar). Positive ion mode analyses had 0.5% byolume of acetic acid (Sigma Aldrich, 99.7 + %) added to the ESIolvent of the diluted samples to increase cation production, i.e.,rotonated analytes.
The phthalates DBP (dibutyl phthalate); DCHP (dicyclohexylhthalate); DEP (diethyl phthalate); DIDP (diisodecyl phthalate);MP (dimethyl phthalate); DIBP (diisobutyl phthalate); DMGP
dimethoxyethyl phthalate or dimethylglycol phthalate); iso-BEHPdi or bis (2-ethylhexyl) isophthalate); and DINP (diisononyl phtha-ate) were purchased from UltraScientific in 1 g amounts of pureompound. The phthalates BEHP or DEHP (di or bis (2-ethylhexyl)hthalate, 98+%); BBP (benzylbutyl phthalate, 98%); and DNOP (di--octyl phthalate, 98%) were purchased as pure compounds fromlfa Aesar. Rhodamine B, Malachite Green oxalate, sodium saccha-
in (99%), sodium cyclamate (98%), Tartrazine, and Brilliant Blue FCFere purchased from Alfa Aesar. Allura Red AC (80% dye), Sudaned I (95% dye), Amaranth (85–95% dye), Sunset Yellow FCF (90%ye), and New Coccine (Ponceau 4R, 75% dye) were purchased froma Acta 804 (2013) 197– 206
Sigma Aldrich. Coca-ColaTM and Pearl SoyTM Bubble Tea were pur-chased off the shelf for use in detecting phthalates in beveragematrices.
3. Results and discussion
3.1. Phthalates detection with ESI-HPIMS
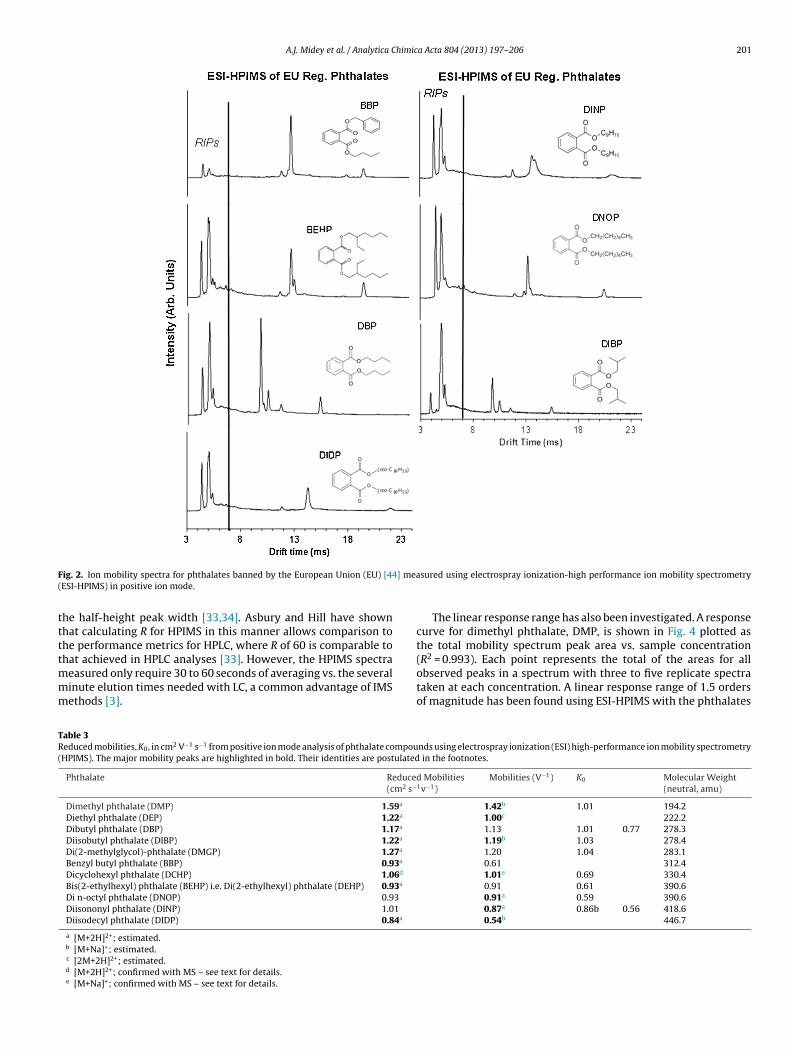
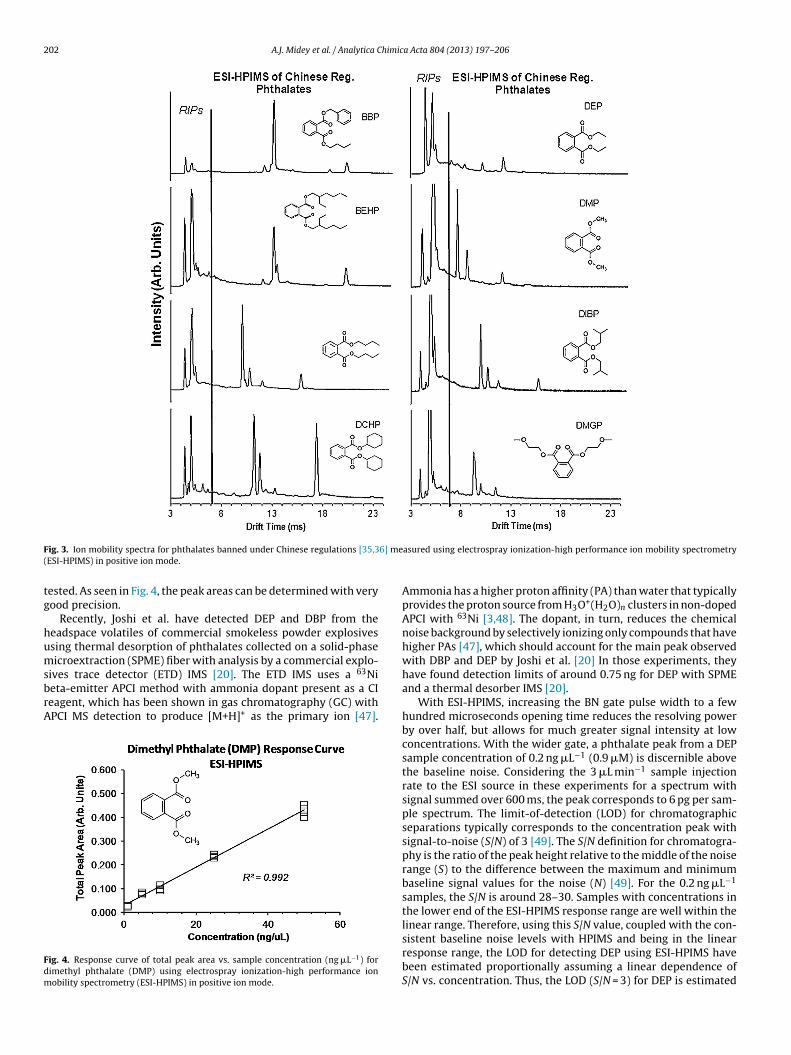
The ion mobility spectra from a preliminary screening of eachof the twelve key phthalates using ESI-HPIMS in positive ion modeare shown in Figs. 2 and 3. The compounds have then been catego-rized according to the countries in which they are banned, i.e., theEuropean Union (EU) [44] and China [35,36]. Mobility spectra forthe six phthalates banned under the EU regulations are comparedin Fig. 2. A similar comparison of the ion mobility spectra for themain phthalates identified in the Chinese regulations is presentedin Fig. 3.
Examining Figs. 2 and 3 and the mobilities in Table 3, at least oneunique peak has been observed for each of the phthalates measuredseparately, but shown in a given subset for either EU [44] or Chinese[35,36] regulations, providing selectivity toward the targeted con-taminants. The higher mobility peaks (shorter drift times) increasein intensity at the lower concentrations, while the smallest mobility(longest drift time peaks) decrease in intensity as the concentra-tion decreases. Furthermore, detecting and quantifying a mixtureof several phthalates may potentially be hindered by charge com-petition between the different phthalates depending on the rangeof their charge affinities.
A precursory check on the identity of the peaks for the phtha-lates has been done with DCHP using an analogous, separateESI-HPIMS analyzer interfaced to a quadrupole MS (Excellims’RA4100 research-grade commercial instrument) to gain someinsight into the peaks observed with the phthalate esters. Selectedion monitoring (SIM) with MS allows the mobility spectrum for themajor peaks to be measured at a fixed m/z to identify the mobil-ity peaks recorded at the Faraday plate of the HPIMS. It should benoted that IMS separates not solely on structural differences, butalso has a dependence on mass-to-charge ratio (m/z). Thus, mul-tiply charged peaks of a fixed mass, m, will arrive at shorter drifttimes (have higher mobilities). The general structure for the neutralphthalate compounds shown in Figs. 2 and 3 has two carboxyl oxy-gens that can be protonated. Doubly protonated phthalate peaks forDCHP (MW = 330.4) have been identified with SIM to correspondto the main K0 = 1.06 cm2 V−1 s−1 peak for [M+2H]2+ at m/z = 166.Therefore, for phthalates with more than one mobility peak, partic-ularly the larger ones, the shortest drift time peak (highest mobility)likely represents a doubly protonated cation. ESI is well-known tocreate doubly charged peaks with biomolecules and larger com-pounds like insulin [37]. SIM with DCHP has also shown that asmaller, singly-charged [M+Na]+ peak from the sodium adduct withDCHP at m/z = 353 accounts for the next higher drift time peak withK0 = 1.01 cm2 V−1 s−1. Sodium adduct peaks are commonly createdwith ESI in positive ion mode [45] where Na+ present in the solventsleached from the glass storage vessels [46]. Doubly protonatingDCHP could result in a more compact structure than the complexwith small, but singly charged Na+. Consequently, the [M+2H]2+ ionarrives at the detector sooner. The lowest mobility peak for DCHP inTable 3 appears to come from a phthalate dimer ion. Based on thisdata, the identities of the major phthalate mobility peaks are esti-mated to be largely from [M+2H]2+ with some contributions from[M+Na]+ peaks and a possible [2M+2H]2+ dimer at the highest con-
centrations. The postulated identities are footnoted accordingly inTable 3.Furthermore, ESI-HPIMS shows consistently good response withresolving power, R, of >60, where R is the ratio of the drift time to
A.J. Midey et al. / Analytica Chimica Acta 804 (2013) 197– 206 201
F ] mea(
ttttmmm
TR(
ig. 2. Ion mobility spectra for phthalates banned by the European Union (EU) [44ESI-HPIMS) in positive ion mode.
he half-height peak width [33,34]. Asbury and Hill have shownhat calculating R for HPIMS in this manner allows comparison tohe performance metrics for HPLC, where R of 60 is comparable to
hat achieved in HPLC analyses [33]. However, the HPIMS spectraeasured only require 30 to 60 seconds of averaging vs. the severalinute elution times needed with LC, a common advantage of IMSethods [3].
able 3educed mobilities, K0, in cm2 V−1 s−1 from positive ion mode analysis of phthalate compouHPIMS). The major mobility peaks are highlighted in bold. Their identities are postulated
Phthalate Reduce(cm2 s−
Dimethyl phthalate (DMP) 1.59a
Diethyl phthalate (DEP) 1.22a
Dibutyl phthalate (DBP) 1.17a
Diisobutyl phthalate (DIBP) 1.22a
Di(2-methylglycol)-phthalate (DMGP) 1.27a
Benzyl butyl phthalate (BBP) 0.93a
Dicyclohexyl phthalate (DCHP) 1.06d
Bis(2-ethylhexyl) phthalate (BEHP) i.e. Di(2-ethylhexyl) phthalate (DEHP) 0.93a
Di n-octyl phthalate (DNOP) 0.93
Diisononyl phthalate (DINP) 1.01
Diisodecyl phthalate (DIDP) 0.84a
a [M+2H]2+; estimated.b [M+Na]+; estimated.c [2M+2H]2+; estimated.d [M+2H]2+; confirmed with MS – see text for details.e [M+Na]+; confirmed with MS – see text for details.
sured using electrospray ionization-high performance ion mobility spectrometry
The linear response range has also been investigated. A responsecurve for dimethyl phthalate, DMP, is shown in Fig. 4 plotted asthe total mobility spectrum peak area vs. sample concentration
(R2 = 0.993). Each point represents the total of the areas for allobserved peaks in a spectrum with three to five replicate spectrataken at each concentration. A linear response range of 1.5 ordersof magnitude has been found using ESI-HPIMS with the phthalatesnds using electrospray ionization (ESI) high-performance ion mobility spectrometry in the footnotes.
d Mobilities1v−1)
Mobilities (V−1) K0 Molecular Weight(neutral, amu)
1.42b 1.01 194.21.00c 222.21.13 1.01 0.77 278.31.19b 1.03 278.41.20 1.04 283.10.61 312.41.01e 0.69 330.40.91 0.61 390.60.91a 0.59 390.60.87a 0.86b 0.56 418.60.54b 446.7
202 A.J. Midey et al. / Analytica Chimica Acta 804 (2013) 197– 206
F 6] me(
tg
humsbrA
Fdm
ig. 3. Ion mobility spectra for phthalates banned under Chinese regulations [35,3ESI-HPIMS) in positive ion mode.
ested. As seen in Fig. 4, the peak areas can be determined with veryood precision.
Recently, Joshi et al. have detected DEP and DBP from theeadspace volatiles of commercial smokeless powder explosivessing thermal desorption of phthalates collected on a solid-phaseicroextraction (SPME) fiber with analysis by a commercial explo-
ives trace detector (ETD) IMS [20]. The ETD IMS uses a 63Nieta-emitter APCI method with ammonia dopant present as a CIeagent, which has been shown in gas chromatography (GC) withPCI MS detection to produce [M+H]+ as the primary ion [47].
ig. 4. Response curve of total peak area vs. sample concentration (ng �L−1) forimethyl phthalate (DMP) using electrospray ionization-high performance ionobility spectrometry (ESI-HPIMS) in positive ion mode.
asured using electrospray ionization-high performance ion mobility spectrometry
Ammonia has a higher proton affinity (PA) than water that typicallyprovides the proton source from H3O+(H2O)n clusters in non-dopedAPCI with 63Ni [3,48]. The dopant, in turn, reduces the chemicalnoise background by selectively ionizing only compounds that havehigher PAs [47], which should account for the main peak observedwith DBP and DEP by Joshi et al. [20] In those experiments, theyhave found detection limits of around 0.75 ng for DEP with SPMEand a thermal desorber IMS [20].
With ESI-HPIMS, increasing the BN gate pulse width to a fewhundred microseconds opening time reduces the resolving powerby over half, but allows for much greater signal intensity at lowconcentrations. With the wider gate, a phthalate peak from a DEPsample concentration of 0.2 ng �L−1 (0.9 �M) is discernible abovethe baseline noise. Considering the 3 �L min−1 sample injectionrate to the ESI source in these experiments for a spectrum withsignal summed over 600 ms, the peak corresponds to 6 pg per sam-ple spectrum. The limit-of-detection (LOD) for chromatographicseparations typically corresponds to the concentration peak withsignal-to-noise (S/N) of 3 [49]. The S/N definition for chromatogra-phy is the ratio of the peak height relative to the middle of the noiserange (S) to the difference between the maximum and minimumbaseline signal values for the noise (N) [49]. For the 0.2 ng �L−1
samples, the S/N is around 28–30. Samples with concentrations inthe lower end of the ESI-HPIMS response range are well within thelinear range. Therefore, using this S/N value, coupled with the con-
sistent baseline noise levels with HPIMS and being in the linearresponse range, the LOD for detecting DEP using ESI-HPIMS havebeen estimated proportionally assuming a linear dependence ofS/N vs. concentration. Thus, the LOD (S/N = 3) for DEP is estimated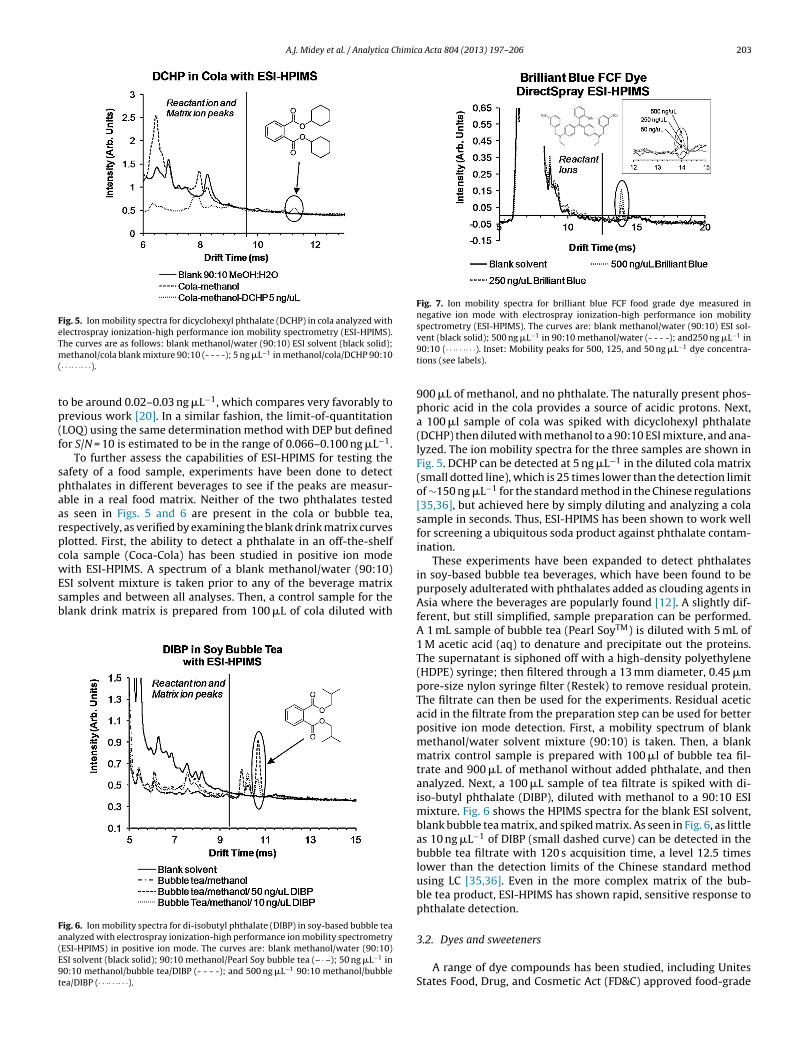
A.J. Midey et al. / Analytica Chimica Acta 804 (2013) 197– 206 203
Fig. 5. Ion mobility spectra for dicyclohexyl phthalate (DCHP) in cola analyzed withelectrospray ionization-high performance ion mobility spectrometry (ESI-HPIMS).Tm(
tp(f
spaarpcwEsb
Fa(E9t
Fig. 7. Ion mobility spectra for brilliant blue FCF food grade dye measured innegative ion mode with electrospray ionization-high performance ion mobilityspectrometry (ESI-HPIMS). The curves are: blank methanol/water (90:10) ESI sol-
−1 −1
he curves are as follows: blank methanol/water (90:10) ESI solvent (black solid);ethanol/cola blank mixture 90:10 (- - - -); 5 ng �L−1 in methanol/cola/DCHP 90:10· · ·· · ·· · ·).
o be around 0.02–0.03 ng �L−1, which compares very favorably torevious work [20]. In a similar fashion, the limit-of-quantitationLOQ) using the same determination method with DEP but definedor S/N = 10 is estimated to be in the range of 0.066–0.100 ng �L−1.
To further assess the capabilities of ESI-HPIMS for testing theafety of a food sample, experiments have been done to detecththalates in different beverages to see if the peaks are measur-ble in a real food matrix. Neither of the two phthalates testeds seen in Figs. 5 and 6 are present in the cola or bubble tea,espectively, as verified by examining the blank drink matrix curveslotted. First, the ability to detect a phthalate in an off-the-shelfola sample (Coca-Cola) has been studied in positive ion modeith ESI-HPIMS. A spectrum of a blank methanol/water (90:10)
SI solvent mixture is taken prior to any of the beverage matrixamples and between all analyses. Then, a control sample for thelank drink matrix is prepared from 100 �L of cola diluted with
ig. 6. Ion mobility spectra for di-isobutyl phthalate (DIBP) in soy-based bubble teanalyzed with electrospray ionization-high performance ion mobility spectrometryESI-HPIMS) in positive ion mode. The curves are: blank methanol/water (90:10)SI solvent (black solid); 90:10 methanol/Pearl Soy bubble tea (– · –); 50 ng �L−1 in0:10 methanol/bubble tea/DIBP (- - - -); and 500 ng �L−1 90:10 methanol/bubbleea/DIBP (· · ·· · ·· · ·).
vent (black solid); 500 ng �L in 90:10 methanol/water (- - - -); and250 ng �L in90:10 (· · ·· · ·· · ·). Inset: Mobility peaks for 500, 125, and 50 ng �L−1 dye concentra-tions (see labels).
900 �L of methanol, and no phthalate. The naturally present phos-phoric acid in the cola provides a source of acidic protons. Next,a 100 �l sample of cola was spiked with dicyclohexyl phthalate(DCHP) then diluted with methanol to a 90:10 ESI mixture, and ana-lyzed. The ion mobility spectra for the three samples are shown inFig. 5. DCHP can be detected at 5 ng �L−1 in the diluted cola matrix(small dotted line), which is 25 times lower than the detection limitof ∼150 ng �L−1 for the standard method in the Chinese regulations[35,36], but achieved here by simply diluting and analyzing a colasample in seconds. Thus, ESI-HPIMS has been shown to work wellfor screening a ubiquitous soda product against phthalate contam-ination.
These experiments have been expanded to detect phthalatesin soy-based bubble tea beverages, which have been found to bepurposely adulterated with phthalates added as clouding agents inAsia where the beverages are popularly found [12]. A slightly dif-ferent, but still simplified, sample preparation can be performed.A 1 mL sample of bubble tea (Pearl SoyTM) is diluted with 5 mL of1 M acetic acid (aq) to denature and precipitate out the proteins.The supernatant is siphoned off with a high-density polyethylene(HDPE) syringe; then filtered through a 13 mm diameter, 0.45 �mpore-size nylon syringe filter (Restek) to remove residual protein.The filtrate can then be used for the experiments. Residual aceticacid in the filtrate from the preparation step can be used for betterpositive ion mode detection. First, a mobility spectrum of blankmethanol/water solvent mixture (90:10) is taken. Then, a blankmatrix control sample is prepared with 100 �l of bubble tea fil-trate and 900 �L of methanol without added phthalate, and thenanalyzed. Next, a 100 �L sample of tea filtrate is spiked with di-iso-butyl phthalate (DIBP), diluted with methanol to a 90:10 ESImixture. Fig. 6 shows the HPIMS spectra for the blank ESI solvent,blank bubble tea matrix, and spiked matrix. As seen in Fig. 6, as littleas 10 ng �L−1 of DIBP (small dashed curve) can be detected in thebubble tea filtrate with 120 s acquisition time, a level 12.5 timeslower than the detection limits of the Chinese standard methodusing LC [35,36]. Even in the more complex matrix of the bub-ble tea product, ESI-HPIMS has shown rapid, sensitive response tophthalate detection.
3.2. Dyes and sweeteners
A range of dye compounds has been studied, including UnitesStates Food, Drug, and Cosmetic Act (FD&C) approved food-grade
204 A.J. Midey et al. / Analytica Chimica Acta 804 (2013) 197– 206
Table 4Reduced mobilities, K0, in cm2 V−1 s−1 of dye compounds and sweeteners using electrospray ionization (ESI) high-performance ion mobility spectrometry (HPIMS).
Dyes, sweeteners, and contaminants Reduced mobilities,K0 (cm2 s−1 V−1)
Molecular Wt.,neutral (amu)
Ion mass-to-chargeratio (m/z)
Negative ion mode Salt anionSodium Cyclamate 1.42 201.2 178.2Sodium Saccharin 1.53 205.2 182.2Sudan I 1.20 248.2Sunset Yellow FCF (Na salt) 1.59 452.4 203.2Allura Red AC (Na salt) 1.49 496.4 225.2Tartrazine (Na salt) 1.47 534.3 155.1Amaranth (Na salt) 1.43 604.5 178.5New Coccine (Ponceau 4R, Na salt) 1.44 604.5 178.5Brilliant Blue FCF (Na salt) 1.06 792.9 373.45
asTa4Etswar
iEa
Fas
Positive ion mode
Malachite Green (Oxalate salt) 1.06
Rhodamine B (Cl salt) 0.89
rtificial colorings such as Brilliant Blue FCF (FD&C Blue No. 1), Sun-et Yellow FCF (FD&C Yellow No. 6), Amaranth (FD&C Red No. 2),artrazine (FD&C Yellow 5), and Allura Red AC (FD&C Red 40) [50],s well as illegal or banned colorants such as New Coccine (PonceauR), Rhodamine B, Malachite Green, and Sudan I. The DirectspraySI source has been used for these studies to show its capabili-ies for ionizing these compounds. Most of the dyes are anions ofalt compounds that can be readily detected in negative ion modeith ESI-HPIMS. Fig. 7 shows ion mobility spectra for the ESI-HPIMS
nalysis of Brilliant Blue FCF artificial food coloring standard withesolving power, R, of 66, again comparable to HPLC values [33].
The reduced mobilities for this series of compounds are givenn Table 4. Preliminary SIM tests for Sudan I and Tartrazine usingSI-HPIMS with MS show that the single peaks correspond to thenion from the salt. Again, the multiply charged anions have higher
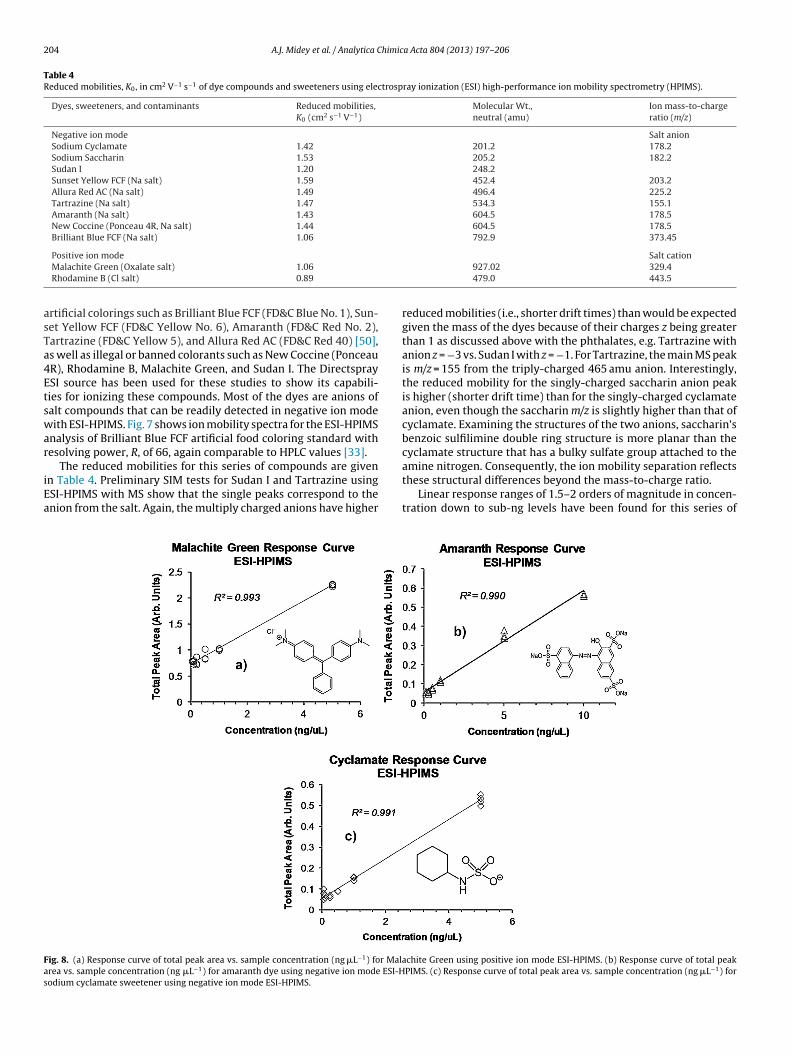
ig. 8. (a) Response curve of total peak area vs. sample concentration (ng �L−1) for Malrea vs. sample concentration (ng �L−1) for amaranth dye using negative ion mode ESI-Hodium cyclamate sweetener using negative ion mode ESI-HPIMS.
Salt cation927.02 329.4479.0 443.5
reduced mobilities (i.e., shorter drift times) than would be expectedgiven the mass of the dyes because of their charges z being greaterthan 1 as discussed above with the phthalates, e.g. Tartrazine withanion z = −3 vs. Sudan I with z = −1. For Tartrazine, the main MS peakis m/z = 155 from the triply-charged 465 amu anion. Interestingly,the reduced mobility for the singly-charged saccharin anion peakis higher (shorter drift time) than for the singly-charged cyclamateanion, even though the saccharin m/z is slightly higher than that ofcyclamate. Examining the structures of the two anions, saccharin’sbenzoic sulfilimine double ring structure is more planar than thecyclamate structure that has a bulky sulfate group attached to the
amine nitrogen. Consequently, the ion mobility separation reflectsthese structural differences beyond the mass-to-charge ratio.Linear response ranges of 1.5–2 orders of magnitude in concen-tration down to sub-ng levels have been found for this series of
achite Green using positive ion mode ESI-HPIMS. (b) Response curve of total peakPIMS. (c) Response curve of total peak area vs. sample concentration (ng �L−1) for
himic
castmetrdiGmgfirtt0htdrsHtb
awssctof0FtLeigf
crLqefltlststEt
4
tT
[[[
[[[
[
[
A.J. Midey et al. / Analytica C
ompounds. The artificial sweeteners have strong ESI responsesnd give two orders of magnitude response range. Fig. 8(a)–(c)how two-order of magnitude linear response curves in both posi-ive and negative ion mode ESI-HPIMS for Malachite Green (positive
ode), Amaranth food dye (negative mode), and artificial sweet-ner sodium cyclamate (negative mode), respectively. As seen inhe inset spectra in Fig. 7 for Brilliant Blue FCF, mobility peaks cor-esponding to concentrations as low as 0.050 ng �L−1 have beenetected above the spectral baseline for dye compounds in negative
on mode. Single nanogram levels of Rhodamine B and Malachitereen have also been detected with ESI-HPIMS in positive ionode while maintaining resolving power R > 70 at narrower BN
ate pulse widths < 100 �s. Concentrations as low as ∼50 ng �L−1
or Rhodamine B and Malachite Green have been detected afterncreasing the BN gate pulse width to 400 �s that compromisesesolving power for increased sensitivity, both of which concen-rations are in the range of LC–MS detection [51]. Similar to DEP,his peak corresponds to about 0.4 pg for 1.5 �L min−1 injection of.05 ng �L−1 sample summed over 350 ms. Moreover, these dyesave been detected without sample preconcentration and detec-ion in 30 s, compared to the several minute elution times for theyes seen even with ultra-high performance liquid chromatog-aphy (UHPLC) and MS/MS detection [21,52]. A peak above theolvent spectrum baseline has previously been observed using ESI-PIMS with a 0.009 ng �L−1 sample of sodium cyclamate. However,
he typical LODs are greater than this concentration as discussedelow.
To estimate the LODs, the measured S/N level is determinedt 0.050 ng �L−1 sample concentration, the lowest concentrationhere the peak heights for the dyes and sweeteners are readily
een above the spectral baseline. First, the observed S/N levels forodium cyclamate and sodium saccharine at 0.050 ng �L−1 are cal-ulated as shown above to be around 6 and 9, respectively, athat sample concentration. Then, using this S/N to linearly extrap-late to S/N of 3 as discussed in the earlier sections indicates LODsor the artificial sweeteners are estimated to be in the range of.017–0.025 ng �L−1. For the dyes, Sunset Yellow and Brilliant BlueCF at 0.050 ng �L−1 sample concentration, both have experimen-ally determined S/N = ∼12. Thus, taking this measured S/N, theODs at S/N = 3 for the dyes are further estimated using the samextrapolation to be about 0.013 ng �L−1, indicating an LOD roughlyn the range of 0.010–0.020 ng �L−1 for the dye compounds. Analo-ously, the LOQs (S/N = 10) are estimated to be 0.056–0.083 ng �L−1
or the sweeteners and 0.033–0.083 ng �L−1 for the dyes.Reversed-phase HPLC analysis of the azo dyes without precon-
entration has shown limits-of-detection in the ∼10 to 20 ng �L−1
ange for Brilliant Blue, Sunset Yellow, and Tartrazine [53]. TheODs determined above with ESI-HPIMS for these dyes compareuite favorably. However, the LC elution times for the dyes are sev-ral minutes [53–55] vs. the HPIMS. Beverages such as juices andavored drinks are essentially all aqueous, where levels of around 8o 65 ng �L−1 have been measured with HPLC [53]. With detectionimits below 0.040 ng �L−1 that are comparable to HPLC, ESI-HPIMShould be able to match or exceed this performance with acquisi-ion times an order of magnitude less, even with possible chargeuppression because of matrix effects from other constituents inhe beverage [45,56]. Similar success should be achievable withSI-HPIMS for the sweeteners that also have several minute elutionimes using LC [57].
. Conclusions
ESI-HPIMS has been used to analyze a wide range of food con-aminant compounds that are of concern because of their toxicity.welve high-priority phthalates cited by international regulations
[
a Acta 804 (2013) 197– 206 205
in regards to guaranteeing food safety have been analyzed withgood selectivity and resolving power, with total analysis timesin seconds vs. chromatographic procedures. Sensitivities up to 30times better than currently accepted detection limits [35,36] forphthalates [34,35] have been achieved in actual beverage samplematrices, but with much simplified sample preparation comparedto standard methods. Several other compounds of concern suchas artificial sweetening agents and dyes have also been readilydetected at resolving power R > 60, comparable to HPLC methodswith 1.5–2 orders of magnitude linear response range in sampleconcentration. Sub-nanogram levels of these contaminants havebeen also been detected, most in under a minute vs. typical LCanalyses which can take much longer [51,52]. Thus, ESI-HPIMS isanother valuable method for rapid food safety screening.
Combining a Directspray ESI source with HPIMS offers advan-tages in faster, simpler sample preparation and analysis. As shownin the current work, ESI-HPIMS can be exploited for more rapid,sensitive detection of phthalate contamination of beverages, whichwould be especially useful for on-site sample analysis when usedwith direct ESI. The Directspray ESI source also could be com-bined with other simplified sample preparation methods such asQuEChERS (quick, easy, cheap, effective, rugged, safe) extraction[58] or microextraction packed sorbent (MEPS) [59,60] clean-upthat remove interfering matrix compounds that could lead tocharge suppression [45,56] or mobility coincidences (false posi-tives). Directspray ESI could thus be adapted for widespread, rapiddetection of molecules of concern in food matrices in the field, allwhile maintaining the streamlined sample analysis advantages ofHPIMS and harnessing the advantages offered by ESI. As such, thecurrent results support the application of improved ion mobilityspectrometry methods as a viable tool for screening applications infood safety assessment.
Acknowledgment
A. C. and J. S. were supported under Massachusetts Life ScienceCouncil (MLSC) internships.
References
[1] J.L.C.M. Dorne, J.L.C.M. Dorne, L.R. Bordajandi, B. Amzal, P. Ferrari, P. Verger,TrAC Trends Anal. Chem. 28 (2009) 695–707.
[2] I.S. Arvanistoyannis, International regulations on food contaminants andresidues, in: Y. Pico (Ed.), Food Contaminants and Residue Analysis, Elsevier,Amsterdam, Netherlands, 2008, pp. 29–73.
[3] G.A. Eiceman, Z. Karpas, Ion Mobility Spectrometry, 2nd ed., CRC Press, BocaRaton, 2005.
[4] Z. Karpas, Food Res. Int. (2013) (in press).[5] A. Onal, Food Chem. 103 (2007) 1475–1486.[6] V. Garcia-Canas, C. Simo, M. Herrero, E. Ibanez, A. Cifuentes, Anal. Chem. 84
(2012) 10150.[7] Z. Karpas, A.V. Guaman, A. Pardo, S. Marco, Anal. Chim. Acta 758 (2013)
122–129.[8] C.A. Krueger, A.J. Midey, T. Kim, M. Osgood, J. Wu, C. Wu, Int. J. Ion Mobil.
Spectrom. 14 (2011) 71–79.[9] M.T. Jafari, B. Rezaei, M. Javaheri, Food Chem. 126 (2011) 1964–1970.10] M.T. Jafari, F. Torki, M. Saraji, Anal. Sci. 28 (2012) 391–395.11] R. Fernandez-Maestre, H.H. Hill, Int. J. Ion Mobil. Spectrom. 12 (2009) 91–102.12] U.S. FDA Notification to Industry Regarding Potential Adulteration of Food Prod-
ucts Used as Emulsifying/Clouding Agents and Flavorings, Rpt. #, Food and DrugAdministration, 2011.
13] C.A. Staples, Phthalate Esters, Springer, New York, 2003.14] R.A. Rudel, L.J. Perovich, Atmos. Environ. 43 (2009) 170–181.15] U. Heudorf, V. Mersch-Sundermann, J. Angerer, Int. J. Hyg. Environ. Health 210
(2007) 623–634.16] R.A. Rudel, D.E. Camann, J.D. Spengler, L.R. Korn, J.G. Brody, Environ. Sci. Technol.
37 (2003) 4543–4553.17] Fourth National Report on Human Exposure to Environmental Chemicals,
Department of Health and Human Services, Centers for Disease Control andPrevention, 2009, pp. 529.
18] S.S. Lateef, High Throughput Screening for Phthalates in Toys and ChildcareArticles Using the Agilent 6140 Single Quadrupole LC/MS System and AnalyticalStudio Browser Software, Rpt. #, Agilent Application Note 1290, 2010.
2 himic
[
[[[
[[
[
[[
[
[[
[[[[
[
[
[
[[[[
[[
[[
[[[[[[
[[[[
[[
06 A.J. Midey et al. / Analytica C
19] O. Nunez, H. Gallart-Ayala, C.P.B. Martins, P. Lucci, J. Chromatogr. A 1228 (2012)298–323.
20] M. Joshi, K. Rigsby, J.R. Almirall, Forensic Sci. Int. 208 (2011) 29–36.21] R. Liu, W. Hei, P. He, Z. Li, J. Chromatogr. B 879 (2011) 2416–2422.22] G.M. Wang, H. Dai, Y.G. Li, X.L. Li, J.Z. Zhang, L. Zhang, Y.Y. Fu, Z.G. Li, Food Addit.
Contam. Part A Chem. Anal. Control Expo Risk Assess. 27 (2010) 983–988.23] B. Jin, L. Zie, Y. Guo, G. Pang, Food Res. Int. 46 (2012) 399–409.24] L. Cun, Y.L. Wu, T. Yang, Y. Zhang, W.G. Huang-Fu, J. Chromatogr. A 1217 (2010)
7873–7877.25] D.D. Metcalfe, Food Allergy: Adverse Reactions to Food and Food Additives,
C.H.I.P.S., Weimar, Texas, 2008, pp. 613.26] M.J. Kelner, West. J. Med. 143 (1985) 523–524.27] M. Soylak, Y.E. Unsal, E. Yilmaz, M. Tuzen, Food Chem. Toxicol. 49 (2011)
1796–1799.28] K. Yamashita, LC–MS/MS Analysis of Malachite Green and Crystal Violet using
PursuitTM XRs, Rpt. #, Varian App. Note S-01313, 2008.29] P.M. Priebem, G.B. Kauffman, Minerva 18 (1980) 556–574.30] S. Takayama, S.M. Sieber, R.H. Adamson, U.P. Thorgeirsson, D.W. Dalgard, L.L.
Arnold, M. Cano, S. Eklund, S.M. Cohen, J. Natl. Cancer Inst. 90 (1998) 19–25.31] D.E. Newton, Food Chemistry, Infobase, New York, 2007.32] A.J. Midey, C.A. Krueger, M.A. Osgood, J. Wu, C. Wu, Am. Lab. 45 (2013) 10.33] G.R. Asbury, H.H. Hill Jr., J. Microcolumn Sep. 12 (2000) 172–178.34] C.K. Hilton, C.A. Krueger, A.J. Midey, M. Osgood, J. Wu, C. Wu, Int. J. Mass Spec-
trom. 298 (2010) 64.35] GB/T 21911-2008 Food Determination of Phthalates, Standardization Admin-
istration of China, 2008.
36] Phthalates determination method with liquid chromatography for twelvephthalates in machinery and electronics products, National Certification andAccreditation Administration Committee, Plan Item No. 2009B463.2k, 2009.
37] C.A. Krueger, C.K. Hilton, M. Osgood, J. Wu, C. Wu, Int. J. Ion Mobil. Spectrom.12 (2009) 33–37.
[
[[
a Acta 804 (2013) 197– 206
38] A.J. Midey, A. Patel, C. Moraff, C.A. Krueger, C. Wu, Talanta 116 (2013) 77–83.39] E.S. Reese, P.B.D. Harrington, J. Forensic Sci. 44 (1999) 68.40] A.B. Kanu, H.H. Hill Jr., Talanta 73 (2007) 692–699.41] T. Keller, A. Keller, E. Tutsch-Bauer, F. Monticelli, Forensic Sci. Int. 161 (2006)
130–140.42] T. Gabowitcz, D. Ridjosic, S. Nacson, U.S. Patent 2008.43] H.I. Kim, P.V. Johnson, L.W. Beegle, J.L. Beauchamp, I. Kanik, J. Phys. Chem. A
109 (2005) 7888.44] EU Directive 2005/84/EC, Rpt. #, European Union, 2007.45] P. Kebarle, Y. Ho, On the mechansim of electrospray mass spectrometry: fun-
damentals, instrumentation, and applications, in: R.B. Cole (Ed.), ElectrosprayIonization Mass Spectrometry, Wiley, New York, 1997, pp. 42–50.
46] K. Schug, H.M. McNair, J. Sep. Sci. 25 (2002).47] C. George, H. Prest, LCGC Asia Pacifc 5 (2002) 27–31.48] C.L. Crawford, H.H. Hill, Talanta 107 (2013) 225–232.49] J.W. Dolan, LC–GC Eur. 19 (2006) 12.50] Color Additive Status List, U.S. FDA (Ed.), Washington, DC, December 2009.51] [51] P. Gulyas, T. Payne, Analysis of 15 Azo Dyes Using the Varian 320-MS Triple
Quadrupole LC/MS/MS, Rpt. #, Agilent App. Note SI-01506, 2008, pp. 3.52] T. Zou, P. He, A. Yasen, Z. Li, Food Chem. 138 (2013) 1742–1748.53] N.A. Zatar, J. Food Technol. 5 (2007) 220–224.54] X. Yi, H. Yang, D. Guo, J. Zhu, Se Pu China J. Chromatogr. 29 (2011) 1062–1069.55] X. Hou, Y. Li, G. Wu, L. Wang, M. Hong, Y. Wu, J. Chromatogr. Sci. 48 (2010)
22–25.56] G.R. Asbury, J. Klasmeier, H.H. Hill Jr., Talanta 50 (2000) 1291–1298.57] H. Gao, M. Yang, M. Wang, Y. Zhao, Y. Cao, X. Chu, J. AOAC Int. 96 (2013) 110–115.
58] M. Anastassiades, S.J. Lehotay, D. Stajnbaher, F.J. Schenck, J. AOAC Int. 86 (2003)412–431.59] M. Abdel-Rehim, Z. Altun, L. Blomberg, J. Mass Spectrom. 39 (2004) 1488–1493.60] A.R. Chaves, F.Z. Leandro, J.A. Carris, M.E.C. Queiroz, J. Chromatogr. B 878 (2010)
2123–2129.


![Electrospray ionization mass spectrometry of ...93)85031-R.pdfElectrospray Ionization Mass Spectrometry of Phosphopeptides Isolated by On-Line ... this purpose [19~22]. Immobilized](https://img.pdfslide.net/doc/110x75/5ad660d07f8b9a6b668b8d17/electrospray-ionization-mass-spectrometry-of-9385031-rpdfelectrospray-ionization.jpg)