Embed Size (px)
Citation preview
HIGH PERFORMANCE MODULAR INSULATING PANEL DEVELOPMENT FOR A REEFER VAN
by Abdollah Labbani Motlagh
B.Sc., Sharif University of Technology, 2006
Thesis Submitted in Partial Fulfillment of the
Requirements for the Degree of
Master of Applied Science
in the
School of Mechatronics System Engineering
Faculty of Applied Sciences
Abdollah Labbani 2016 SIMON FRASER UNIVERSITY
Spring 2016

Approval
Name: Abdollah Labbani Motlagh Degree: Master of Applied Science Title: High Performance Modular Insulating Panel
Development for a Reefer Van
Examining Committee: Chair: Flavio Firmani Lecturer
Majid Bahrami Senior Supervisor Professor
Woo Soo Kim Supervisor Assistant Professor
John Jones Internal Examiner Associate Professor
Date Defended:
April 04 , 2016
ii

Abstract
A new modular insulation panel technology for insulating reefer vans is proposed that
can solve some of the problems of traditional methods. New insulating materials with
lower thermal conductivity and aging rate are considered to be sandwiched in composite
panels to provide better thermal performance in addition to stronger structure. The
developed technology can be applied on a variety of commercial vans to improve the
quality of insulation while reducing the cost and installation time of the process
dramatically. The present method suggests prefabricating of modular insulation panels
with accurate size in controlled conditions instead of spraying insulation foam inside the
vehicles. In addition, the installation method of modular panels enables the operators to
replace the damaged parts of insulation easily with less cost instead of changing the
whole insulation in the old method. The MATLAB optimization toolbox is utilized to
optimize the thickness of insulation panels based on energy cost and operational
conditions. To validate the proposed model, a full-scale prototype is built and installed on
a Ford transit connect and tested under road conditions for performance approval.
Keywords: Modular insulating panel; Composite sandwich panel; Reefer van; Thermal performance; Insulation thickness optimization
iii

Acknowledgements
I wish to express my sincere thanks to my senior supervisor, Dr. Majid Bahrami, for his
expert, sincere and valuable guidance and encouragement extended to me. Without his
guidance and persistent help this dissertation would not have been possible.
I also thank Mr. Marius Haiducu and Dr. Wendell Huttema our research group
passionate lab engineers, for their absolute and unconditional help throughout the
experimentation of my study.
I take this opportunity to record my sincere thanks to all my friends and colleagues who directly or indirectly, have lent their helping hand in this venture.
iv

Table of Contents
Approval .......................................................................................................................... ii Abstract .......................................................................................................................... iii Acknowledgements ........................................................................................................ iv Table of Contents ............................................................................................................ v List of Tables ................................................................................................................. vii List of Figures................................................................................................................ viii Glossary ......................................................................................................................... xi List of Acronyms ............................................................................................................ xii Executive Summary ...................................................................................................... xiii
Chapter 1. Introduction ............................................................................................. 1 1.1. Importance of Insulation ......................................................................................... 1 1.2. Background ............................................................................................................ 2 1.3. Research Objective ................................................................................................ 7 1.4. Outline of the Thesis ............................................................................................... 8
Chapter 2. Literature Review ..................................................................................... 9 2.1. Insulating Material .................................................................................................. 9
2.1.1. Definition ................................................................................................... 9 2.1.2. Categories of Insulating Materials ............................................................ 10 2.1.3. Properties of Insulating Materials ............................................................. 12 2.1.4. Traditional Thermal Insulation Materials .................................................. 13 2.1.5. Long Term Aging of Closed-Celled Foam Insulation ................................ 15 2.1.6. Modern Thermal Insulation Materials ....................................................... 19 2.1.7. Insulating material Comparison ............................................................... 24
2.2. Sandwich Panels .................................................................................................. 26 2.2.1. Introduction .............................................................................................. 26 2.2.2. Sandwich Panel Concept ......................................................................... 26 2.2.3. Design Considerations ............................................................................. 28 2.2.4. Thermal Insulating Performance of Sandwich Panels .............................. 30
Chapter 3. Model Development ............................................................................... 33 3.1. Design Approach .................................................................................................. 33 3.2. Insulation Thickness Optimization of Foam-Core Sandwich Panel........................ 34
3.2.1. Problem Formulation: .............................................................................. 36 3.2.2. Methodology ............................................................................................ 38 3.2.3. Results and Analysis ............................................................................... 38
3.3. Web-Core Sandwich Panels ................................................................................. 44 3.3.1. Problem Formulation ............................................................................... 45 3.3.2. Methodology ............................................................................................ 48 3.3.3. Coupling ANSYS with Genetic Algorithm ................................................. 52 3.3.4. Results and Discussion ........................................................................... 54
v

Chapter 4. Implementation of Modular Insulating Panels ..................................... 61 4.1. Modular Panels and Attachment Methods ............................................................ 61 4.2. Scanning the Geometry of the Vehicle .................................................................. 63 4.3. Scaled Chamber for Experimental Test Setup ...................................................... 68 4.4. Modular Panel Modeling ....................................................................................... 70 4.5. Full Scale Prototype ............................................................................................. 76 4.6. Finalizing the Panels and Reefer Installation ........................................................ 80
Chapter 5. Conclusions and Future Works ............................................................ 84
References ................................................................................................................ 86 Appendix A. MATLAB Codes for Optimization ............................................................. 90 Appendix B. Air Infiltration Study ................................................................................. 94
Model Development ......................................................................................... 94 Experimental Setup ......................................................................................... 95 Results and Discussion ................................................................................... 97 References ...................................................................................................... 99
vi
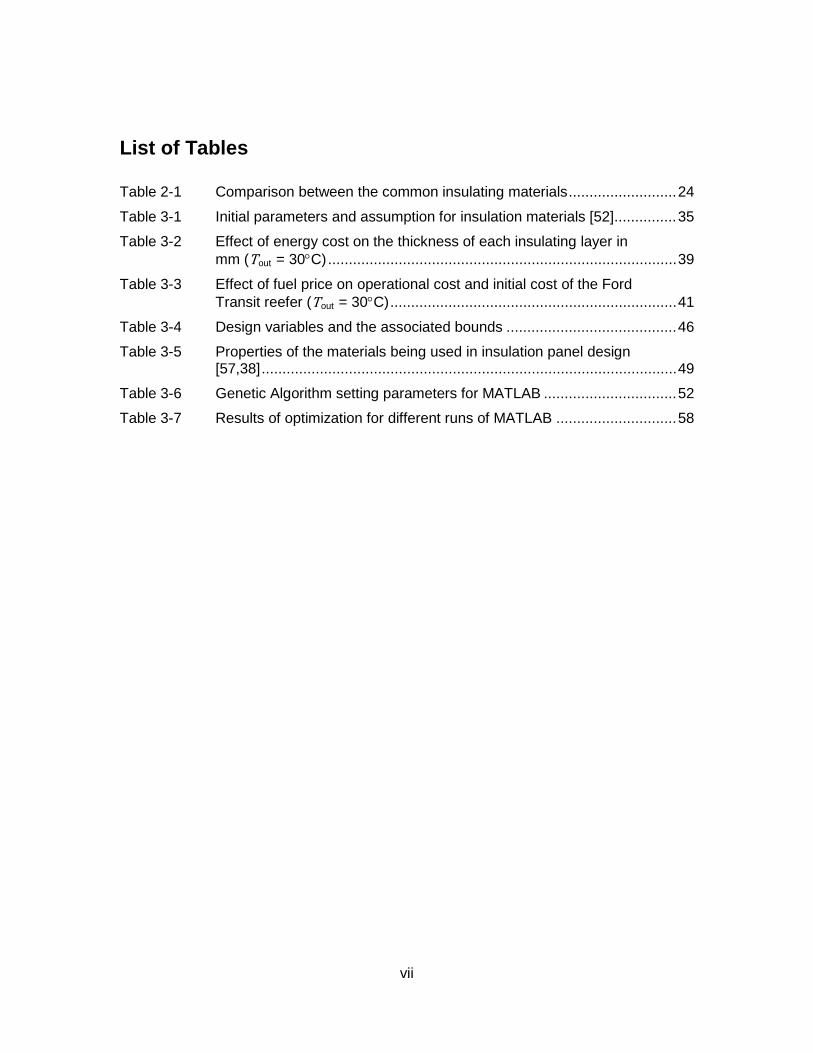
List of Tables
Table 2-1 Comparison between the common insulating materials .......................... 24
Table 3-1 Initial parameters and assumption for insulation materials [52] ............... 35
Table 3-2 Effect of energy cost on the thickness of each insulating layer in mm (Tout = 30°C) .................................................................................... 39
Table 3-3 Effect of fuel price on operational cost and initial cost of the Ford Transit reefer (Tout = 30°C) ..................................................................... 41
Table 3-4 Design variables and the associated bounds ......................................... 46
47TTable 3-547T 47TProperties of the materials being used in insulation panel design [57 ,38]47T .................................................................................................... 49
Table 3-6 Genetic Algorithm setting parameters for MATLAB ................................ 52
Table 3-7 Results of optimization for different runs of MATLAB ............................. 58
vii

List of Figures
Figure 1.1. World Energy consumption by sector at 2012[5] ...................................... 1
Figure 1.2. Commercial reefer vans that are the subject of this project ...................... 4
Figure 1.3. Spraying Polyurethane foam on the interior walls of a reefer van [61] .................................................................................................... 5
Figure 1.4. Typical spray foam insulation of reefers and associated issues[11] .......... 6
Figure 2.1. Thermal conductivity in porous materials, including conduction through the solid and the gas, and radiation through the pores [15]. .......................................................................................................... 9
Figure 2.2. Example structure of cellular solids, left: open-cell PU foam; Right: closed-cell PU foam [18] ........................................................................ 10
Figure 2.3. SEM micrograph of glass-fiber mats [19] ................................................ 11
Figure 2.4. The macrostructure of expanded polystyrene [20] .................................. 11
Figure 2.5. Basic structure of closed-cell foam insulation [12] .................................. 15
Figure 2.6. Aging of closed-cell foam insulation [12] ................................................ 16
Figure 2.7. Thermal resistivity versus time for a typical, 25-mm-thick, polyurethane foam specimen [10] .......................................................... 16
Figure 2.8. Aging of PIR foam core slices due to lateral diffusion [9] ........................ 17
Figure 2.9. SEM image of commercial ceramic hollow microsphere [26] .................. 18
Figure 2.10. Effect of insulated paint on building wall’s temperature in thermal image, while one building is painted and the other one not [28] .............. 18
Figure 2.11. Honeycomb sandwich panel with fiberglass facing [30] .......................... 19
Figure 2.12. SEM image of aerogel microstructure [33].............................................. 20
Figure 2.13. Aerogel above a flame presenting the super-insulating properties [34] ......................................................................................................... 20
Figure 2.14. Flexible industrial aerogel blanket with integral vapour barrier for sub-ambient and cryogenic applications [37] .......................................... 21
Figure 2.15. Left: A vacuum insulation panel on top of a traditional foam panel of the same U factor. Right: Components of a VIP [21] .......................... 23
Figure 2.16. Thermal bridge through the laminate around the VIP. Adding a second layer of VIP can reduce this effect [14]. ...................................... 23
Figure 2.17. Sandwich panel basic components [46]. ................................................ 27
Figure 2.18. Web-core sandwich panel at left and corrugated-core sandwich panel at right [48]. .................................................................................. 28
Figure 2.19. Left: buckling of the compressed face. Right: Shear failure of the core [46] ................................................................................................. 29
viii

Figure 2.20. Schematic of the foam-core insulating sandwich panel and its sub layers ..................................................................................................... 31
Figure 2.21. Schematic of the web-core insulating sandwich panel and its sub layers ..................................................................................................... 32
Figure 3.1. Effect of energy cost on the thickness of insulating layers in mm (Tout = 30°C) ........................................................................................... 40
Figure 3.2. Effect of outside temperature on the thickness of insulating layers (Fuel price =$1.3 /lit). ............................................................................. 42
Figure 3.3. Effect of insulation thickness on normalized cost of reefer (with no constraint on the maximum thickness of panel) ...................................... 44
Figure 3.4. Schematic of the reinforcing structure for the insulating panel and associated design variables ................................................................... 46
Figure 3.5. Temperature distribution contour of two-dimensional analysis for a web-core panel ...................................................................................... 47
Figure 3.6. Schematic of applied load and boundary condition to the panel ............. 49
Figure 3.7. Flow chart of the optimization process .................................................. 53
Figure 3.8. Mesh generated in ANSYS [60] .............................................................. 55
Figure 3.9. Nodal solution by ANSYS, indicating equivalent stress (Von Mises) of the panel ................................................................................. 56
Figure 3.10. Example of the evaluation on the value of the panel height .................... 57
Figure 4.1. Schematic showing the concept of a French cleat [62] ........................... 62
Figure 4.2. Schematic showing the concept of toggle mechanism [63] ..................... 63
Figure 4.3. Interior view of the Ford Transit Connect, which is to be insulated for reefer applications ............................................................................. 64
Figure 4.4. Schematic of the 3-D scanner working process [64] ................................ 65
Figure 4.5. Taking the 3-D image of the vehicle interior surface using a HANDYSCAN scanner ........................................................................... 66
Figure 4.6. Isometric view of the geometry imported to SolidWorks from the 3-D scanner............................................................................................... 67
Figure 4.7. View of the regenerated model in SolidWorks based on the original imported geometry from the 3-D scanner ................................... 68
Figure 4.8. Render of a complex panel from the test bed design in SolidWorks ....... 69
Figure 4.9. Complete model of the printed prototype after assembling ..................... 70
Figure 4.10. SolidWorks model of 2-inches-thick modular insulating panels ............... 71
Figure 4.11. Shows toggle mechanism application for holding the side panels with floor panel. ...................................................................................... 72
Figure 4.12. Toggle mechanism for the ceiling panels and the extra edge to keep them on top of the side panels. ...................................................... 73
ix

Figure 4.13. Attachment of side panels to the wall by means of small hooks ............. 74
Figure 4.14. Use of toggle clamps to attach and hold the front panels to the side panels. ............................................................................................ 75
Figure 4.15. Modular insulation panel installation process ......................................... 76
Figure 4.16. View of a modeled wooden side panel in SolidWorks ............................. 78
Figure 4.17. Wooden side panel for the Ford transit before installation in the vehicle .................................................................................................... 79
Figure 4.18. Final assembly of wooden panels inside the Ford transit van ................. 80
Figure 4.19. Floor panel after being insulated with closed-cell PU foam ..................... 81
Figure 4.20. Rear view of assembled insulating panels covered with FRP facing ..................................................................................................... 82
Figure 4.21. Side view of the insulated van after installation of the electric refrigeration system ................................................................................ 83
Figure B. 5.1. Schematic of a scaled down prototype of a Ford transit connect with overall dimensions .......................................................................... 95
47TFigure B.5.2.47T 47T Experimental setup of the infiltrated chamber47T ........................................ 96
47TFigure B.5.3.47T 47TExperimental setup view shows the position of instruments47T ................... 97
47TFigure B.5.4.47T 47TTemperature distribution inside and outside of the chamber 0.6 s after opening the door.47T ........................................................................... 98
47TFigure B.5.5.47T 47TAverage temperature inside the chamber for both the experiment and numerical analysis 47T ........................................................................... 99
x

Glossary
𝑄𝑄�̇�𝐴 Heat flux (W/m2)
Cf Energy cost coefficient ($/kJ) E Young modulus (N/m2) R Thermal resistance (K∙m2/W) T Temperature (K) U Thermal transmittance (W/m2∙K) h Panel height (m) k Thermal conductivity (W/m∙K) n Number of webs p Insulation cost coefficient ($/m3) t Thickness (m) ρ Density (kg/m3) σa Allowable flexural stress (N/m2)
𝜗𝜗 Poisson ratio
xi

List of Acronyms
APDL ANSYS Parametric Design Language BA Blowing Agent EPS Expanded Polystyrene FRP Fibre Reinforced Plastic GA Genetic Algorithm ISP Insulated Sandwich Panel LTTR Long Term Thermal Resistance PIR Polyisocyanurate PP Polypropylene PU Polyurethane PVC Polyvinyl Chloride VIP Vacuum Insulated Panel
xii

Executive Summary
Refrigeration systems consume a significant amount of the power generated in
service and reefer vehicles. Reefers distribute most of the chilled and frozen products
around the world on a daily basis. Minimizing the heat transferred from the environment
to the refrigerated space reduces the cooling load and leads to a tremendous reduction
in the operating cost and the environmental impacts such as reductions in particular
matter and greenhouse gas emissions. A key to cooling load reduction in all refrigeration
systems is devising efficient thermal insulation systems. The focus of this study is to
design, develop, and experimentally validate an advanced insulation technology for
reefer vans that can address the issues of present insulation systems and improve their
thermal and mechanical performance.
Motivation
Laboratory for Alternative Energy Conversion (LAEC) at Simon Fraser University
in collaboration with Cool-It Hi-Way Services plan to develop new insulation technology
in a collaborative project to not only improve the thermal performance and lifespan of the
insulation on the reefer vans, but also to reduce the manufacturing and installation costs
of the process. The common insulation method uses a foam core composite
construction. Polyurethane (PU) foam with foaming agent is commonly sprayed onto the
inside of a truck body. Then a sheet of plywood is installed on the foam. Finally, the
assembly is sealed using a fiberglass layer over the plywood faces and the edges and
seams of the insulation is caulked with silicone adhesives to protect it from water and
gas penetration.
The time-consuming nature of this process makes it expensive and the quality of
the final product is highly dependent on the installer’s skills. In addition, the thermal
conductance of the foam material rises dramatically due to penetration of air and
humidity (water vapor) into the cells if the foam core is not completely sealed. The
humidity adsorption destroys the thermal performance of the insulation layer, insulation
degradation up to 5% a year have been reported in the literature. Furthermore, insulation
structure is not repairable, and in the case of van accident or damage, the insulation
xiii
system has to be rebuilt from scratch or suffer significantly from thermal losses. The
ever-increasing demand for system efficiency mandates comprehensive and systematic
research into new insulation materials and installation technologies that can provide
better thermal insulation, both at the time of manufacturing and throughout the lifetime of
the vehicle.
The focus of this project is to suggest proper insulating methods for reefer
utilization of commercial vans that are manufactured for multi-proposed application.
Research objectives
The objectives of this research can be summarized as the following:
• Investigating the available insulating materials, including emerging materials such as aerogel and vacuum insulated panels to find the best option for the application of this study.
• Development of a custom-designed modular insulation panels that can be prefabricated in controlled conditions and are capable of quick installation in the vehicle, an installation time of 1 hour is targeted.
• Optimization of the insulation thickness based on thermal and mechanical performance of panels inside the vehicle.
• Design and construction of full-scaled insulation panel prototype for Ford Transit Connect as the targeted vehicle in this project to validate the structural performance of developed technology.
Methodology
In this thesis, the development of new insulation technology for the application of
reefer vans is presented. A comprehensive literature review is performed on the
available insulating materials in the market for the application of refrigeration to
categorize them based on the required characteristics and compare their benefits and
drawbacks. In the next step, the concept of composite sandwich panels is investigated to
utilize their benefits such as high strength-to-weight ratio in insulation panel designs.
Two different structures of sandwich panels with rigid insulating core and web-core filled
by soft insulating material are studied. An optimization algorithm is used to choose the
xiv

best insulating material and its optimum thickness for the foam core sandwich panels
considering the energy cost and operational conditions. Also, a finite element code in
collaboration with genetic algorithm is developed to optimize the structure of a web-core
sandwich panel based on the required thermal performance.
Along with conceptual design of modular insulating panels, experimental work on CAD
modeling of panels for the targeted vehicle is performed. The interior geometry of the
Ford transit van is 3-D scanned and imported into SolidWorks. The proposed model is
used to design the modular insulating panels for the vehicle. To validate the practical
aspect of the design and structural performance test of the developed insulation panel, a
full-scale prototype is built and installed in the Ford transit van and tested under road
conditions. An overview of the research project is shown in Fig. 1.
Figure 1: Research road-map
High Performance Modular Insulating Panel Development for a Reefer Van
Model Development
• Material selection
• Sandwich panel design
• Insulation thickness optimization
• Web-core panel FEM design
Experimental Study
• Vehicle geometry scan
• SolidWorks modeling
• Modular panel design
• Wooden prototype design
Insulating panel prototype fabrication and reefer installation
xv

Chapter 1. Introduction
1.1. Importance of Insulation
Refrigeration systems consume a significant portion of the power generated in
reefer trucks, up to 40% [1]. This is a tremendous amount energy usage when one
considers the fact that transportation has the biggest portion in world’s energy
consumption see Figure 1.1. Over a million refrigerated road vehicles and 400,000
refrigerated containers currently distribute a large amount of cooled and frozen products
around the world [2] which are responsible for a significant amount of particular matter
(PM) and greenhouse gas emissions. In 2000, the US Environmental Protection Agency
(EPA) identified diesel PM as a “likely human carcinogen,” [3] and followed this with
stringent standards call for a 75% reduction in diesel PM by 2010 and an 85% reduction
by 2020 from the year 2000 baseline [4]. Any improvement in refrigeration system which
reduces the energy and fuel consumption, will impact the greenhouse gas emission and
environmental issues in the world.
Figure 1.1. World Energy consumption by sector at 2012[5]
1
Apart from refrigeration industry, HVAC (Heating, Ventilating and Air
conditioning) systems can take roughly 40% of total building energy consumption, while
35%-40% of total worldwide energy consumption is considered to be used by
buildings [5]. Therefore, any improvement in thermal performance of roof and wall
insulation of buildings can significantly decrease the energy consumption in the world.
A key to energy consumption reduction in all HVAC-R systems is devising
efficient thermal insulation systems. By minimizing the heat transferred from the
environment to the A/C or refrigerated space, the cooling load is minimized leading to a
reduction in operating cost and environmental impact.
1.2. Background
According to “Agreement on the International Carriage of Perishable Foodstuffs
and on the Special Equipment to be Used for such Carriage” (ATP agreement) [6], an
insulated refrigerated truck body for use in the refrigerated food transport industry must
have a thermal conductance (U factor) equal to or less than 0.7 W/(m2 K) and a heavily
insulated refrigerated truck body must have a thermal conductance equal to or less than
0.4 W/(m2 K). These values are measured at the time of manufacturing and do not take
into account the effects of thermal insulation decay. The performance decay of some
refrigerated truck insulation systems has been shown to be 5% per year [7]. That
equates to a 26 to 50% decay in insulation performance over the 10 year lifespan a
truck, resulting in up to a 50% increase in the A/C-R loads. Considering the fact that
these trucks typically are kept in service for more than 10 years, the problem of
insulation decay and the need for a new insulation technology that does not lose its
insulation value over time is of critical importance. A reduction in the heat losses into the
refrigerated box will reduce the required cooling capacity, and therefore the power
consumption of the refrigeration system.
The most commonly used insulation manufacturing method uses a foam core
composite (multi-layer) construction. The manufacturing of truck body insulation systems
is predominantly performed using one-off production techniques. Polyurethane (PU)
foam with cyclopentane foaming agent is sprayed onto the inside of a truck body, then a
2
sheet of plywood is applied to the face of the foam. Finally, the assembly is sealed using
a fiberglass layer over the plywood faces and the edges and seams of the insulation are
caulked with silicone adhesives to protect it from water and gas penetration.
Labour and technician time form a large portion of the insulation system’s
manufacturing costs; due to the large amount of time required to build the insulation
system by hand, one truck at a time. The average cost for manufacturing an insulation
system is approximately $8,000 Canadian, not including the base vehicle cost. This
process can take up to two weeks and the insulation value of the end product is highly
dependent on the skill of the installer. If the insulating foam is of the wrong density or if
there are air gaps present behind the plywood panels, the insulation value of the
assembly will be poor.
The exact thermal conductance of the foam core varies spatially due to the
nature of the installation process, but the average conductance value is 0.022 W/(m∙K).
The high thermal resistance of closed-cell foam is due to low thermal conductivity of the
high-molecular-weight blowing agent gas, such as cyclopentane (thermal conductivity of
0.0128 W/(m∙K) [8]), used during the manufacturing of the foam [1]. The blowing agent
gas starts to diffuse out of the cells or dissolve into the polymer matrix during the service
life of the insulation and comparatively light-weight air components, such as nitrogen,
water vapor and carbon dioxide, start to penetrate into the cells from the environment.
Due to the higher thermal conductivity of the invasive air and water vapour over the
displaced cyclopentane, the thermal conductivity of the foam rises. Sealing of the foam
from the air provides some protection from aging; however, recent research suggests
that even with regular sealing, the joints of the structure still age rapidly. Macchi-Tejda et
al. [8] found a 9% increase in thermal conductivity in just two years. Mukhopadhyaya et
al.[9] observed decay of the thermal resistivity from the initial 50 m∙K/W (or 0.020
W/(m∙K) conductivity) to 40 m∙K/W (or 0.025 W/(m∙K) conductivity) in just 100 days. In
the case of prefabricated panels, a variety of impermeable facers, such as aluminum
foils, steel sheets, plasterboards, and fiber-reinforced plastics on the surface of the rigid
foam may be used to enhance the LTTR (long term thermal resistance) of the boards by
protecting the foam from the environment. However, according to research published by
the National Research Council Canada (NRC) none of the sealing methods can stop the
3

aging of foams, and their performance decreases dramatically, by more than 40% after 2
years [10]. Considering the fact that these insulations are typically kept in service for
more than 10 years, the problem of insulation decay and the need for new insulation
technology that does not lose its insulation value over time are of critical importance.
In the event of a collision, insulation panels are not repairable, and the insulation
system has to be rebuilt from scratch or suffer significantly increased thermal losses.
The rapid decay of current insulation systems and the ever increasing demand for
system efficiency mandates comprehensive and systematic research into new insulation
materials and installation technology that can provide better thermal insulation, both at
the time of manufacturing and throughout the lifetime of the vehicle.
The focus of this project is to investigate and develop proper insulating methods
for commercial vans that are manufactured for multi-proposed application, without
insulation on their bodies. Trucks of interest include: Ford Transit, Dodge Sprinter, and
Chevy Savana, shown in Figure 1.2.
Figure 1.2. Commercial reefer vans that are the subject of this project
As previously mentioned, the traditional method to insulate these vehicles is to
spray polyurethane foam on the interior surface of the refrigerated compartment (Figure
1.3). By installing a layer of plywood on top of the foam and some wooden post at the
middle of the foam the mechanical strength of insulation is increased against puncturing
4

and heavy loads. In the next step, the sealing layer such as aluminum plate, fiber
reinforced plastic (FRP) or other food grade plastics is glued or screwed to the wood to
make the insulation washable and protect it from water and gas absorption as well as
mold growth. Another technique is to build a one-piece fiberglass layer on top of the
insulation with glass fibers and thermoset resin. The final step is to use silicon adhesive
or some other sealant to caulk the edges and seams. In heavy-duty applications an
aluminum checker plate is installed at the end on the floor to make it strong enough for
loading skids with a forklift.
Figure 1.3. Spraying Polyurethane foam on the interior walls of a reefer van [61]
The time to insulate a van is 2 to 4 days, depending on the curing time for the
material and the capability of the labor force. Labour is the biggest portion of insulation
cost, due to time-consuming nature of the work. The quality of the insulation, including
the density and the thickness of sprayed foam, is highly dependent on the skill of the
workers and can also be affected by ambient temperature and humidity. To make the
final surface of the insulation flat, metal ribs on the body of vehicle are either not sprayed
or poorly covered, creating thermal bridges through the insulation. Due to complicated
geometry of the doors, the insulation is generally poor on doors and large portion of
metal is not properly covered (see Figure 1.4). In the case of an accident and damage to
the insulation, repair or replacement of the sprayed foam and extra protective layers is
5

very difficult, so insulation should either be removed completely and rebuilt or the loss in
performance accepted until the end of life of the van.
Aging of the insulating material can be a major issue because it causes a
reduction in thermal resistance and raises heat load on the refrigeration system. Open-
cell foams, which are very common for insulating the reefer vans because of their lower
price in comparison to closed-cell, can lose 50% of their thermal resistance in the first
year alone due to diffusion of water vapor and other light gases into the foam if they are
not completely sealed from the environment [12]. Although closed-cell foams are a
better and more expensive insulating material, their thermal conductivity will also rise if
placed in humid environment [13]. Condensation of water inside cold rooms provides
hard conditions for foam materials and perfect sealing of the paneling is required to
avoid decay of the insulation.
Figure 1.4. Typical spray foam insulation of reefers and associated issues[11]
6

1.3. Research Objective
This thesis presents the process of developing a new insulation system for a
reefer vehicle that addresses the issues of present insulation system as mentioned
above. To improve the quality of insulation for reefer vans and address the issues with
the traditional method, three different areas are considered in this project.
First of all, better insulating materials were studied to choose a better option for
this application. Some new materials, such as aerogel and vacuum insulated panels
(VIP), with super insulating properties were investigated and compared with typical
insulating materials in the market such as polyurethane and glass wool.
Secondly, it is proposed to use modular panels that can be prefabricated in ideal
factory conditions with high quality and then assembled on the vehicle at the time of
installation. In this way, not only the quality of the insulation panels can be controlled at
the time of production and is independent of installer skills, but also labor time and cost
will be significantly reduced. In the case of insulation systems using spray foam,
insulation will be an inseparable part of the van and it is almost impossible to remove it
from the body to facilitate repairs/reconstruction. Thus, modular panels will help users
and service providers to repair or replace the damaged panels easily and quickly, with
lower cost than building a new insulation system in the traditional way.
Finally, sandwich composite panels attracted a special attention in this project.
Insulated sandwich panels (ISP) combine the properties of various materials into a
single unit and are commonly used in commercial applications. They are made of
different layers to produce a structure with the required properties, such as mechanical
strength, thermal resistance and degradation protection. Panels that can be
prefabricated would make the installation easier, faster and more reliable.
Although this research investigates a number of different commercial vans to
develop a proper insulating system, a Ford Transit Connect was considered as the pilot
project for applying all of the proposed ideas and evaluating them in real-world
conditions. Therefore, in the experimental part of this project the geometry of a Ford
Transit Connect is studied to design suitable insulating panels. After building the scaled-
7

down prototype to examine some theoretical ideas and heat transfer analysis, a real
scale prototype was built based on the design and assembled in the targeted vehicle to
show the desired goals of the research. Finally, with the assistance of industrial partner
of the project, Cool-It Highway Services, the insulated van was turned into a reefer, with
a modern electrical refrigeration system and deployed to verify the capability of the
developed insulation system.
1.4. Outline of the Thesis
This work details the structural and thermal design considerations for the
modular sandwich insulation panels developed for reefer vans. Because the choice of
the core material of the insulating sandwich panel is particularly important, an overview
of available insulating materials in the market is presented in Chapter 2. In addition, a
brief introduction to composite sandwich panels and their thermal performance is
presented in the same chapter. Chapter 3 describes the design approach of the
insulating panels for the reefer van and the thickness optimization based on mechanical
and thermal considerations. The development process of design and building the real-
scale prototype insulating panels for the targeted vehicle is presented in Chapter 4.
Validation of the proposed design approach is performed by the installation of insulating
panels in the Ford transit reefer, which is described at the end of Chapter 4. Conclusions
regarding the use of modular insulating panels and some suggestions for future works
are given in Chapter 5.
8

Chapter 2. Literature Review
2.1. Insulating Material
2.1.1. Definition
Insulation is designed to minimize the heat transfer through a system. It can
normally be divided in three parts; solid conduction, gas conduction and radiation
through pores. The largest portion of the heat transfer is through solid conduction.
Therefore, highly porous materials with a small amount of solid structure make a good
insulation material [14]. The radiation importance can increase by lower amounts of solid,
as shown in Figure 2.1. Thus, there is an optimal point for a certain material, where the
sum of the radiation and solid conduction is at a minimum. In addition, density and
conductivity relationship is demonstrated in Figure 2.1.
Figure 2.1. Thermal conductivity in porous materials, including conduction through the solid and the gas, and radiation through the pores [15].
9

Wide variety of insulating materials are available in the market and it is the task
of the designer to choose the right product based on his application. Considering the life
expectancy of the insulation and requirements of the system, number of products might
be satisfying and final decision depends on cost, availability and other
considerations [16].
In this section, different common insulating materials for low temperature
application are reviewed and their performance properties are discussed.
2.1.2. Categories of Insulating Materials
Insulation materials may be categorized into one of these four major types [16-
17]:
1. Cellular Insulations consist of small individual cells that form a cellular
structure. A variety of foaming agents can be used to create this structure from base
materials such as glass or plastic. Cellular insulations are often classified as open cell
(i.e. cells are interconnecting) or closed cell (cells sealed from each other). Generally,
materials that contain more than 90% closed cells are considered to be closed cell.
Figure 2.2. Example structure of cellular solids, left: open-cell PU foam; Right: closed-cell PU foam [18]
2. Fibrous Insulations are composed of small diameter organic or inorganic
fibers that finely divide the air space and may be held together by a binder. Typical
inorganic fibers are glass, rock wool, slag wool, and alumina silica. Fibrous insulations
are further classified as either wool, or textile-based insulations that are composed of
10

woven and non-woven fibers and yarns. Coatings may be applied to these materials for
specific properties, e.g. weather and chemical resistance.
Figure 2.3. SEM micrograph of glass-fiber mats [19]
3. Granular Insulations are composed of small nodules that contain voids or
hollow spaces, e.g. calcium silicate and expanded polystyrene insulations. These
materials are sometimes classified as open cell materials if gases can be transferred in
the material matrix.
Figure 2.4. The macrostructure of expanded polystyrene [20]
4. Reflective Insulations and Treatments are applied to surfaces to lower the
radiant heat transfer to or from the surface. Low emittance facings, such as aluminum
foil, are often used in combination with other insulation materials. Thermal insulating
coatings or paints are available for use on pipes and buildings ‘roofs and are considered
11
reflective insulation, but there is not much about them in literature to prove their
performance.
2.1.3. Properties of Insulating Materials
Understanding the physical properties of available insulating materials is
necessary for selecting the proper one regarding the application [16].
Thermal Conductivity is defined as the steady state heat flow through a unit
area of a homogeneous material per unit time that is induced by a unit temperature
gradient in a direction perpendicular to that unit area. The symbol typically used for
thermal conductivity is k or λ and it has units of W/(m.K).
Apparent Thermal Conductivity indicates the presence of additional modes of
heat transfer such as radiation or convection. Because thermal conductivity is a function
of temperature, in many specifications insulation conductivity is evaluated at a mean
temperature of 24°C. Conductivity data may be provided in a range of temperatures to
allow consideration closer to the actual working conditions.
Thermal Resistance, or R-value, is defined as a unit heat flow rate through a
unit area divided by the temperature difference, at steady state, over a specific thickness
of material. For a flat insulation, R is calculated as the thickness divided by the thermal
conductivity (R=t/k). The thermal transmittance, or U-factor, is the inverse of thermal
resistance.
Density is the mass per unit volume of a material. For insulation, "bulk" or the
"apparent" density of the product is normally important for user. Bulk density is the mass
of the product divided by the overall occupied volume. The symbol typically used for
density is ρ in units of kg/m³.
Specific Heat is the amount of thermal energy required to raise the temperature
of a unit mass of a material by one degree that is expressed in units of kJ/(kg·K).
12

Compressive Resistance is defined as the compressive load per unit of area at
a specified deformation. Compressive Strength is start point of complete failure.
Compressive strength and resistance are expressed in N/m2 and are important where
the insulation material must support a structural load.
Flexural Resistance is the ability of an insulating block to resist bending and is
measured in N/m2. Flexural Strength is the flexural resistance at breaking point.
Water Absorption is generally measured by immersing a sample of material
under a specified head of water for a specific time period. It is useful to consider the
amount of water absorbed due to leaks in barriers or during storage. Water absorption
can be measured by variety of immersion methods that differ in immersion time and
reported units (% by weight or % by volume).
Water Vapor Sorption is a measure of the amount of water vapor adsorbed by
an insulating material under high-humidity conditions. The test includes drying a sample
to constant weight and leave it at high humidity condition until the weight stops changing.
2.1.4. Traditional Thermal Insulation Materials
The following is a short description of the most common traditional thermal
insulation materials in use today [16,21].
Mineral Wool including glass wool (fibreglass) and rock wool is normally
manufactured in mats and boards, and sometime as filling material. The light and flexible
products are applicable in insulating the structure of buildings while the harder boards
can be used in floors and roofs that mechanical strength is required. The main drawback
of these insulating material is absorbing the water vapor and providing proper
environment for mold growth.
Glass wool is produced at a temperature around 1400°C, where the heated mass
of borosilicate glass is pulled through rotating nozzles and creating fibres. Rock wool is
produced from melting stone at about 1500°C, by hurling out the hot liquid from a wheel
or disk.
13

Expanded Polystyrene (EPS) is made by expanding small beads of polystyrene
(from crude oil) containing an expansion agent, e.g. pentane C5H12, at hot water vapor
atmosphere. The expanding spheres bond together at their contact areas and create
insulation material blocks in a mold or continuous boards on a production line. Typical
thermal conductivity of EPS with partly open pore structure is between 35 and 45
mW/(m∙K), while varies with temperature, moisture content and mass density. As an
example, the thermal conductivity of EPS may increase from 36 to 54 mW/(m∙K) with
increasing moisture content from 0 to 10 vol% [21].
Graphite Polystyrene is produced by adding graphite to the mixture of EPS that
leads to reduction of radiation heat transfer and decrease the thermal conductivity about
20% lower than the conventional material [22].
Polyurethane (PU) is produced by a reaction between isocyanates and polyols
(alcohols containing multiple hydroxyl groups). Blowing agent gases such as
hydrofluorocarbons (HFC) or cyclopentane, C5H10 that has lower thermal conductivity
than air fills the pores of the material during expansion process. PU foam can be formed
inside mold or be used as spray foam at the site to fill cavities. Typical thermal
conductivity values for PU are between 20 and 30 mW/(m∙K), which is lower than glass
wool and polystyrene. The thermal conductivity of PU varies with temperature, moisture
content and mass density. For instance, the thermal conductivity of PU may increase
from 25 to 46 mW/(m∙K) with increasing moisture content from 0 to 10 vol%. During a
fire PU release hydrogen cyanide (HCN) and isocyanates, which are poisonous [21].
PU foam is supplied in open-cell and closed-cell form. Open-cell foam is soft and
weak because the cell walls, or surfaces of the bubbles are broken (Figure 2.2). Thus,
the blowing agent gas is not trapped by the forming cells and releases to the
atmosphere during expansion and replaces with air. The foam's strength, depends on
its closed or open cell structure, enable it to resist liquid water or absorbing water
vapour.
Polyisocyanurate (PIR) is an improvement of the polyurethane (PU) by using
other substances in the production process. The main improvement is the fire
14

performance in comparison with PU that produces toxic gasses such as hydrogen
cyanide (HCN) and isocyanates in case of fire [21].
Moulded board of PIR is commonly used as insulation in prefabricated panels for
roofs, walls, sandwich walls and floors of cold rooms and buildings. PIR also ages
similar to PU and its thermal conductivity increases over time from the diffusion of gases.
Creating air gaps between the panels inside a structure due to PIR shrinkage can also
be an issue [14].
2.1.5. Long Term Aging of Closed-Celled Foam Insulation
While higher thermal resistance (R-value) is in high demand for insulating
materials, the overall benefit of them is dependent on their long-term thermal resistance
(LTTR) or aging characteristics. The basic structure of closed-cell foam insulation
consists of polymer matrix and gas-filled closed cells (Figure 2.5). The blowing agent
(BA) fills up the closed-cells and is surrounded by the polymer matrix during the
manufacturing process of the foam. The thermal conductivity of the blowing agent that is
usually lower than air reduces the gas conduction component of thermal conductivity of
the foam [12]. As blowing agent(s) diffuses out of the closed-cells (Figure 2.6) and
replaces with air the thermal conductivity of the foam increases over time (called aging).
Figure 2.5. Basic structure of closed-cell foam insulation [12]
Parameters such as properties of the foam matrix, geometry and structure of the
cells, density, manufacturing process, thickness, and permeability of the surfaces, affect
the rate of the diffusion. Before reaching the equilibrium, the aging rate slows down over
the time as it is higher after [12].
15

Figure 2.6. Aging of closed-cell foam insulation [12]
Bomberg and Kumaran [24] developed a computer model that explains the aging
process of the insulting foam. As shown in Figure 2.7, Curve 1 shows that a 25 mm
thick polyurethane specimen that is fully sealed with a coating of epoxy is not affected by
aging, as sealing the foam protects it from the entry of air. If air is allowed to enter but
the blowing agent redistribution is removed from specific phase, the aging rate is quite
high as is shown in curve 2. Adding the effect of blowing agent absorption to previous
case results in curve 3. Curve 4 considers the diffusion of blowing agent out of foam
matrix in addition to previous affects. This model shows that the biggest change in the
thermal conductivity of the foam happens due to penetration of air into the cells [10].
Figure 2.7. Thermal resistivity versus time for a typical, 25-mm-thick, polyurethane foam specimen [10]
Based on a comprehensive research project to determine the LTTR of
polyisocyanurate (polyiso) foam insulation board with impermeable facers [9], aging of
16

PIR foam also does occur due to the lateral diffusion of the blowing agent gas parallel to
the facer surface. Foam slices without any facer show a faster aging than PIR foam
slices with facer. Also, as shown in Figure 2.8 the aging ratio (the ratio of the thermal
resistivity at any specified time to the initial thermal resistivity) of the two-sided 12 mm
thick core slice appears to be faster than the one-sided aging of the 6 mm core slice
(Figure 2.8).
Figure 2.8. Aging of PIR foam core slices due to lateral diffusion [9]
Moreover, research in Foam Supplies, Inc. (FSI) as one of the biggest insulation
suppliers in North America has shown that “water vapor diffusion has horrific effects on
the thermal conductivity of closed-cell foams” and can increase it to 200% of the initial
value in just one week if there is no barrier to protect the foam from water [13].
Insulated Paints consist of ordinary paints that are mixed with ceramic paint
additives to insulate and reflect heat. The additives are hollow microspheres that have
had all the gas inside of them removed to create vacuum. They help the paint to reflect
the heat away from the protected surface and act like barrier that increases the thermal
resistance of the paint layer. The tiny ceramic beads look like fine powder in bulk and
have inert, chemical resistant properties, which make them an easy material to mix with
paint, adhesive or coating to increase the volume of the mixture and decrease heat
transfer [25].
17
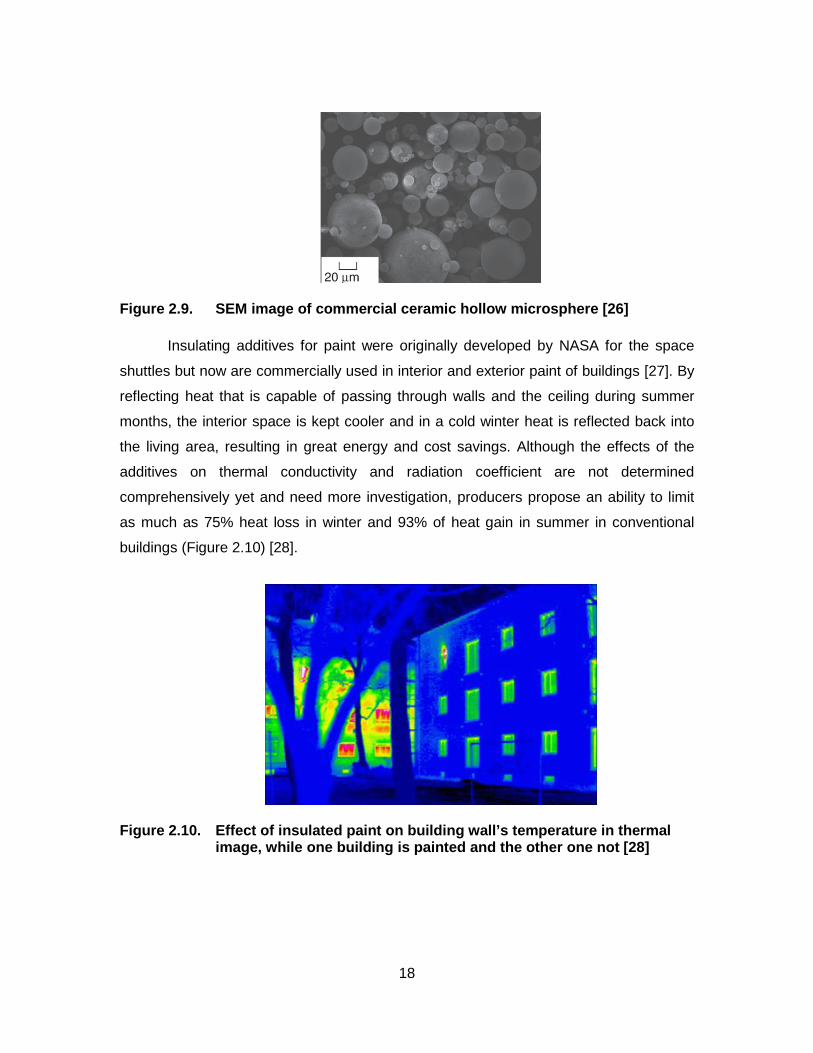
Figure 2.9. SEM image of commercial ceramic hollow microsphere [26]
Insulating additives for paint were originally developed by NASA for the space
shuttles but now are commercially used in interior and exterior paint of buildings [27]. By
reflecting heat that is capable of passing through walls and the ceiling during summer
months, the interior space is kept cooler and in a cold winter heat is reflected back into
the living area, resulting in great energy and cost savings. Although the effects of the
additives on thermal conductivity and radiation coefficient are not determined
comprehensively yet and need more investigation, producers propose an ability to limit
as much as 75% heat loss in winter and 93% of heat gain in summer in conventional
buildings (Figure 2.10) [28].
Figure 2.10. Effect of insulated paint on building wall’s temperature in thermal image, while one building is painted and the other one not [28]
18

Honeycomb Structure has the hexagonal form of bee-developed honeycomb,
which allows for maximum strength with the least weight. It can be fabricated from
different materials, such as paper, plastic, or metals. Plastic honeycomb cores are light,
efficient structures that show good insulating properties in addition to mechanical
strength and stiffness. Convection can be ignored due to the small size of the cells and
conduction through thin plastic walls is very small. Depending on the cell size and wall
thickness, thermal conductivity can vary from 0.04 W/(m∙K) to 0.09 W/(m∙K) for different
type of material, such as polycarbonate, polypropylene, and polyethylene. Honeycomb
sandwich panels are constructed from a plastic honeycomb core that is packed between
outer fiberglass shells, see Figure 2.11. These composite panels are already in use in
truck body manufacturing and are good candidates to be used as floor panels in reefer
trucks without supporting beams because of their strong structure and low thermal
conductivity [29].
Figure 2.11. Honeycomb sandwich panel with fiberglass facing [30]
2.1.6. Modern Thermal Insulation Materials
In this section some new insulating material with very low thermal conductivity
will be introduced. They are gaining a lot of interest recently, especially as their price
reduces, due to new and less expensive production methods.
Aerogels are highly porous materials made up of air up to 99.8% and show very
low thermal conductivity on the order of 0.004 W/(m∙K). They are former gel with
removed liquid phase and preserved solid structure during the drying [14]. Kistler that
19

investigated aerogel for the first time [31], heated gel samples to the critical temperature
of the liquid while holding the pressure above the vapour pressure. Gel structure will not
be damaged by the transition of liquid to gas at temperatures above the critical point.
Thus, dry gel was left unbroken and his experiment was successful for different
materials [32].
Figure 2.12. SEM image of aerogel microstructure [33]
Figure 2.13. Aerogel above a flame presenting the super-insulating properties [34]
Aerogel can be produced as monolithic blocks, as granules with different sizes or
as blanket, which is reinforced by some fibrous material. Granular and powder aerogels
that showed higher conductivity than monolithic aerogel can be used to fill complex
geometry in buildings [14]. Since silica aerogel is mostly transparent, it can be used in
20

windows as a thermal insulation. Rubin et al [35] tested aerogel windows with
transparent aerogel. Radiant conductivity of aerogel can be decreased by applying
opacifying agents. Stepanian et al. [36] have patented the aerogel blanket that handle
the brittleness problem of aerogel. They claimed reaching conductivities around 10
mW/(m∙K) at room temperature at their test on reinforced silica aerogel. The proposed
composite of a silica aerogel and fibrous reinforcement turns the brittle aerogel into a
durable, flexible/solid and hydrophobic material (Figure 2.14).
Figure 2.14. Flexible industrial aerogel blanket with integral vapour barrier for sub-ambient and cryogenic applications [37]
Aerogel blanket shows thermal conductivity of less than 15mW/(mK) which is
much lower than the traditional insulating foams such as polyurethane [38]. It may be
used to insulate the wood-frame or steel-frame building envelopes or insulate the
pipelines in cryogenic industries. The current cost of the product is about ten times of the
cost of a conventional insulation material to create the same thermal resistance;
nevertheless, wherever space and endurance are important considerations, aerogel may
be a good option [21].
21

Although the super insulating properties and flexibility of aerogel blankets provide
opportunity for the application of this material in different industries, the properties of
aerogel products under various humidity and temperature conditions are still not well-
understood and the complete characterization, including thermal resistance decay during
temperature and humidity cycling, are under investigation.
Vacuum Insulation Panels (VIP) are another insulator technology that has
recently received immense interest. Vacuum insulation panels are a composite
construction of two basic layers. The inside core of the composite is an open cell
structure, usually fumed silica, but it could also be aerogel or foam, that is surrounded by
a sealing membrane (Figure 2.15). The sealing membrane performs three main
functions: it seals the core material from the environment, protects the panel from
damage and reduces radiation heat transfer [39]. The pressure inside a vacuum filled
panel shortly after manufacturing is in the range of 1.33 to 133 Pa. The thermal
conductivity of a newly manufactured vacuum insulation panel is on the order of
0.004 W/(m∙K). The most common VIP envelope is a metalized multi-layered polymer
laminate which is heat sealed to form a continuous envelope. A very important factor
influencing the service life of the VIP is the durability of the laminate over time. The
insulation ages through reduction in the internal vacuum and infiltration of water vapor.
With the use of desiccants and getters, the thermal conductance of a vacuum insulation
panel was shown to increase to about 0.009 W/(m∙K) over the period of 450 days [39].
The thermal conductance will continue to increase until the internal pressure approaches
the ambient pressure, resulting in a maximum thermal conductance of
0.020 W/(m∙K) [15]. If the panel is punctured, the thermal conductance instantly jumps
up to its maximum value.
22

Figure 2.15. Left: A vacuum insulation panel on top of a traditional foam panel of
the same U factor. Right: Components of a VIP [21]
The most commonly core material for a VIP is fumed silica, SiO2, which is
produced from silicon tetrachloride, SiCl4. Other materials used in the core are glass
wool, polyurethane and polystyrene. The thermal resistance of a material depends on
the thermal conductivity of the solid material, convection and gas conductivity in the
pores, and radiation between the surfaces of the pores. Fumed silica is significantly
heavier than glass wool and polyurethane foam, but has a lower thermal conductivity at
higher internal pressure, which increases the service life of the VIP [14].
The laminate film around the VIP creates a thermal bridge because it is
composed of metalized multi-layered skin as shown in Figure 2.16. Thermal bridge can
be calculated by multiplying the perimeter of panel by the thermal transmittance of the
laminate. This value depends on the thermal conductivity values at the center of the
panel and laminate, thickness of panel and laminate, and air gaps between the panels
[40].
Figure 2.16. Thermal bridge through the laminate around the VIP. Adding a
second layer of VIP can reduce this effect [14].
23
Schwab et al.[41] have performed a complete study on the calculation of
laminate thermal bridges using a two-dimensional finite-difference model to calculate the
influence of air gaps between the VIP. They showed 360% enhancement in overall heat
transfer of an aluminum laminated panel due to laminate thermal bridge.
VIP can easily be punctured during production, storage, or at the time of
installation by workers. Visual inspection for loos or wrinkles laminate can detect the
damaged panels quickly. VIP found its application first in refrigeration industry and cold
shipping boxes as a compact insulating material. However, the expected service life for
refrigerators is about 10 years that demands durable insulating materials. It is also an
interesting insulation for building application specifically to retrofit the old buildings. Apart
from its sensitivity to puncturing, its limited size and thickness due to manufacturing
process prevent it from being a conventional insulating material [14].
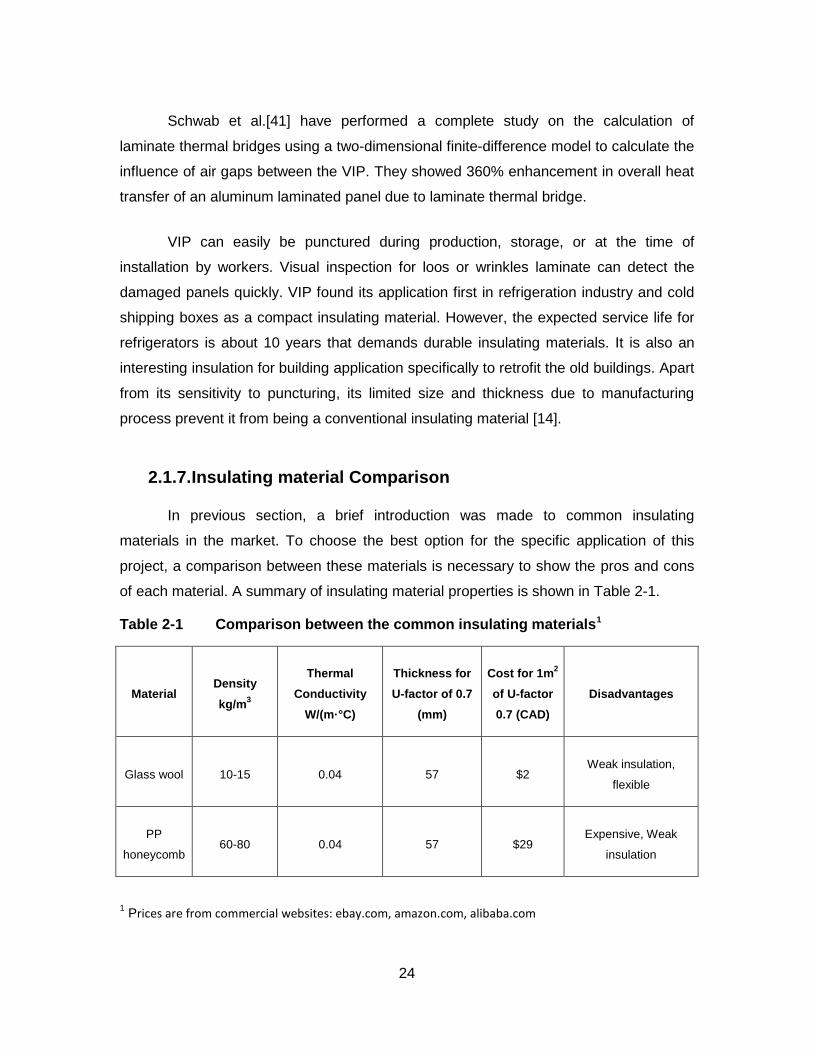
2.1.7. Insulating material Comparison
In previous section, a brief introduction was made to common insulating
materials in the market. To choose the best option for the specific application of this
project, a comparison between these materials is necessary to show the pros and cons
of each material. A summary of insulating material properties is shown in Table 2-1.
Table 2-1 Comparison between the common insulating materials1
Material Density kg/m3
Thermal Conductivity
W/(m·°C)
Thickness for U-factor of 0.7
(mm)
Cost for 1m2 of U-factor 0.7 (CAD)
Disadvantages
Glass wool 10-15 0.04 57 $2 Weak insulation,
flexible
PP
honeycomb 60-80 0.04 57 $29
Expensive, Weak
insulation
1 Prices are from commercial websites: ebay.com, amazon.com, alibaba.com
24

EPS 10-35 0.035 50 $6 Weak insulation
Open-cell
PU 6.5-15 0.025 36 $4
Fast aging, low
mechanical strength
Closed-cell
PU 24-32 0.022 31 $7
Water absorption, fire
hazard
Closed-cell
PIR 24-32 0.022 31 $6 Aging, water absorption
Aerogel
blanket 110-180 0.015 21 $50 Expensive, flexible
VIP 170-190 0.004 6 $18
Envelope thermal
bridge, sensitivity to
puncturing
The designer of an insulation system has to consider the thermal and mechanical
properties of insulating materials as well as limitations in the production and cost to
select the best choice for each part of their system. For example, although honeycomb
panels are not very good insulating materials in comparison with other choices, their
superior mechanical strength will make them suitable for the floor, since they can
tolerate the weight and impacts of goods during loading of reefer vehicles. On the other
hand, vacuum insulated panels are very good insulating materials, but they are
manufactured only in flat shape and certain rectangular sizes that make it difficult or
even impossible to use them for complicated geometries with round or curved features.
Moreover, it can be understood from the table that for the same U-factor, aerogel
blanket and VIP are the most expensive insulating materials. Though using these
materials make it possible to save some space in cargo compartment of reefer, they will
increase the initial cost of insulation by 3 to 8 times that of other insulation types, which
may not be acceptable for customers in this industry. Therefore, the designer should
keep all of these insulating materials in mind until the design is finalized.
25

2.2. Sandwich Panels
2.2.1. Introduction
One of the most widely employed materials in the modern world of engineering is
sandwich panels. Not only are they suitable in the field of aeronautical construction for
which they were initially developed, but also in transportation and marine construction
fields [42]. In fact, conventional materials are replacing with sandwich panels in different
industrial application due to their high flexural resistance and stiffness [43], high impact
strength [44], and low thermal and acoustical conductivity [45]. The design of structures
made from sandwich composites is not an easy task, although many research projects
have been done in this field. Perhaps, the main reason is that reliable prediction of
strength requires in-depth knowledge of the mechanical behaviour of the core and facing
materials, as well as damage mechanisms and proper design criteria.
Lightweight sandwich panels are receiving considerable attention in the field of
cold storage and refrigerated warehouse facilities in today’s food storage industry.
Promises of high efficiency, durability and easy fabrication are made by manufactures
for the usage of sandwich panels. However, some issues, such as stress creation in
panels due to bending as a result of temperature difference between inside and outside
of panels, need to be investigated further [46].
2.2.2. Sandwich Panel Concept
Generally, a sandwich panel is composed of two faces and an enclosing core
(Figure 2.17). Core material needs to tolerate shear stress and distributed load while
facer handle impacts and high mechanical stresses. . A model of an I-beam can be used
to describe the behavior of a sandwich panel under bending; the inner and outer faces
act as the flange and the core material plays the role of the beam web. Therefore, the
presence of a core increases the moment of inertia of the cross section of the beam and
the outer faces would be under tension or compression [47]. This model will be very
useful at time of design because it explains the mechanical requirement for each part of
the sandwich panel.
26

Figure 2.17. Sandwich panel basic components [46].
High strength to weight ratio is the main characteristic of sandwich panels used
in the field of refrigeration. Different compositions of materials are used to serve specific
functions to provide strength, chemical resistance, thermal insulation, and durability for
the structure.
The faces of a lightweight sandwich panel satisfy different requirements. Besides
providing beauty and cleanliness, facing materials also provide structural stiffness, which
carries stresses caused by a bending moment, and protect the more vulnerable core
material from environmental effects and puncturing. A variety of facing materials have
been developed for the application of cold room insulating panels, such as stainless
steel, galvanized coated steel, aluminum sheet, fiberglass reinforced plastics (FRP), and
PVC plastic sheets. The common feature of all these materials is that they are food-safe,
washable, and regard the importance of hygiene regulations. The thin faced panels may
classified into flat and lightly corrugated faced panels.
The core of a lightweight sandwich panel is usually glued to the facing and has
many functions. It handles the shear or compression stresses based on the applied
loading to the structure while facers tolerate the normal stress and impacts. The critical
buckling stress and the ultimate compressive strength of the facers can significantly
increase by the presence of the core [47]. The core also provides the insulating
properties of the system since it usually has the biggest thickness in the panel.
27

Therefore, selecting the right core material, which is capable of handling the shear stress
as well as provide the proper thermal resistance, is one of the key points. Rigid foams
such as polyurethane and polyisocyanurate, honeycomb structures made from
thermoplastics such as polypropylene, and expandable foams like polystyrene are
common insulating materials that are applicable as core material in the field of insulating
sandwich panels.
2.2.3. Design Considerations
As explained in the early concepts, the core material is supposed to resist shear
deformation due to structural loads. If the sandwich panel is to be an insulating panel,
some insulating material cannot play their mechanical role as a core, since they are not
strong enough to tolerate the shear stress or compression under loading. For example,
aerogel blanket or glass wool bats are not proper materials for the core part of a
sandwich panel because they are not rigid solids and will not keep the facings of panels
together. Crowley [49] proposed a panel consisting of face sheets and reinforcing webs
to address the mentioned problem with soft insulating materials (Figure 2.18). The soft
insulating materials fill the space between the structural webs to provide insulating
properties for the sandwich panel and no contribution to structural performance. [50]. In
this study, the possibility of using a rigid insulating material and soft one have been
considered, so the two different designs of the sandwich panel, with or without web-
cores, were taken into account.
Figure 2.18. Web-core sandwich panel at left and corrugated-core sandwich panel at right [48].
After selecting the proper core design for the sandwich panel, thermal
performance needs to be calculated to check if it complies with desire for the project.
28

Regarding the “Agreement on the International Carriage of Perishable Foodstuffs and on
the Special Equipment to be Used for such Carriage” (ATP agreement) [6], an insulated
refrigerated truck body for use in the refrigerated food transport industry must have a
thermal conductance (U factor) equal to or less than 0.7 W/(m2K). To achieve this goal,
the thermal resistance of all parts of the sandwich panel, including faces and webs, has
to be calculated. In the next section, the isothermal planes method to calculate the
overall thermal conductance of sandwich panel using the analogy of thermal resistors in
parallel and series will be discussed.
In addition to the core design of a sandwich panel, the mechanical strength of the
panels has to be calculated to ensure they do not fail under the possible loadings. The
failure of a sandwich structure can occur through several damage mechanisms such as
skin compressive/tensile failure, core shear failure (Figure 2.19), delamination or skin–
core de-bonding, core indentation failure, or buckling of the webs [50].
Figure 2.19. Left: buckling of the compressed face. Right: Shear failure of the core [46]
Considering all these failure modes, a structural calculation of the sandwich
panels to satisfy the relevant design criteria is beyond this project. However, taking into
account the application of panels in this project, it makes the structural calculation much
easier. Since these panels are supposed to be installed inside a vehicle, the metal body
29

of the van would support them mechanically. If the panels attached properly to the rigid
walls and roof of the vehicle most of the bending and compression load will be
transferred directly to the outer structure and panels can stay safe from mechanical
failure damage. Nevertheless, there is another important concern about the failure of the
floor panel under the weight of goods that are loaded into the reefer, which has to be
calculated based on the maximum vertical load that is allowed to be inserted.
2.2.4. Thermal Insulating Performance of Sandwich Panels
The concept of the isothermal planes method for one-dimensional heat
conduction has been discussed completely in [51]. Here is a brief summary that is used
in the calculation of the overall heat transfer in sandwich panels.
Based on Fourier's law for conduction, heat transfer in one-dimensional form is
�̇�𝑸𝑨𝑨 = 𝑻𝑻𝒐𝒐𝒐𝒐𝒐𝒐−𝑻𝑻𝒊𝒊𝒊𝒊𝑹𝑹
(1)
𝑹𝑹 = 𝒐𝒐 𝒌𝒌
(2)
where 𝑄𝑄�̇�𝐴 is the rate of heat transfer per unit surface area from the outside into the
refrigerated compartment (W/m2) and 𝑇𝑇out and 𝑇𝑇in are the temperature of outside and
inside the storage area respectively. R is the thermal resistance to heat transfer through
the insulating panel, which depends on t (thickness) and k (thermal conductivity of
material W/(m∙K)). If there is more than one path for heat to transfer through, the amount
of R (total thermal resistance) can be calculated based on the analogy for electrical
resistors in series and parallel. For example, if there is a compound plate that consists of
n layers whose thicknesses are t1, t2, …, tn, and whose thermal conductivities are k1, k2,
…, kn, respectively, and the conduction heat flow rate is common to each layer, then the
total thermal resistance of the plate can be calculated as resistors in series:
𝑹𝑹𝒐𝒐𝒐𝒐𝒐𝒐 = 𝑹𝑹𝟏𝟏 + 𝑹𝑹𝟐𝟐 + ⋯+ 𝑹𝑹𝒊𝒊 (3)
On the other hand, for the heat conduction through a compound layer that consists of n
layers of widths w1, w2, …, wn, and same thickness, with the heat flow parallel to the
interfaces of layers, the total thermal resistance can be calculated as resistors in parallel:
30

𝑹𝑹𝒐𝒐𝒐𝒐𝒐𝒐 = ( 𝟏𝟏𝑹𝑹𝟏𝟏
+ 𝟏𝟏𝑹𝑹𝟐𝟐
+ ⋯+ 𝟏𝟏𝑹𝑹𝒊𝒊
)−𝟏𝟏 (4)
Figure 2.20. Schematic of the foam-core insulating sandwich panel and its sub layers
Based on the above, a foam-core sandwich panel with different sub layers is
considered in Figure 2.20. Following the well-known electrical circuit analogy, the
thermal performance of the panel assembly is determined by treating the layers as
thermal resistances in series.
𝑹𝑹 𝐟𝐟𝐟𝐟𝐟𝐟𝐟𝐟−𝐜𝐜𝐟𝐟𝐜𝐜𝐞𝐞 = 𝑹𝑹𝟏𝟏 + 𝑹𝑹𝟐𝟐 + 𝑹𝑹𝟑𝟑 + 𝑹𝑹𝟒𝟒 + 𝑹𝑹𝟓𝟓 + 𝑹𝑹𝟔𝟔 + 𝑹𝑹𝟕𝟕 (5)
For the web-core panels described in this work, the R-value is also determined
using the isothermal planes method. In this method, which is illustrated in Figure 2.21,
the panel assembly is broken down into a set of layers, defined by (assumed) isothermal
interfaces. Following the well-known electrical circuit analogy, the thermal performance
of the panel assembly is determined by treating the layers as thermal resistances in
series and parallel. The structural layer of the panel is similarly broken down: assuming
no lateral heat transfer between the webs and insulating material, these components act
as parallel resistances.
31

Figure 2.21. Schematic of the web-core insulating sandwich panel and its sub layers
The R-value of the panel assembly is determined from the equivalent thermal
resistance of the components:
𝑹𝑹 𝐰𝐰𝐞𝐞𝐰𝐰−𝐜𝐜𝐟𝐟𝐜𝐜𝐞𝐞 = 𝑹𝑹𝟏𝟏 + ( 𝟏𝟏𝑹𝑹𝟐𝟐
+ 𝟏𝟏𝑹𝑹𝟑𝟑
+ 𝟏𝟏𝑹𝑹𝟒𝟒
)−𝟏𝟏 (6)
After calculation of total thermal resistance for each case the U factor (the overall
thermal conductance) which is the inverse of R with SI units of W/m2K will be
determined. This will be the thermal performance design consideration for the sandwich
panel:
𝑼𝑼 = 𝟏𝟏𝑹𝑹𝒐𝒐𝒐𝒐𝒐𝒐
(7)
32

Chapter 3. Model Development
3.1. Design Approach
The analysis and design of sandwich insulating panel requires the simultaneous
consideration of thermal and structural performance. As discussed in Chapter 2, there
are a few candidates for the insulating material to be used in the sandwich panel
structure. In addition, for soft insulating materials that cannot handle the mechanical
compression or shear stresses in the panel, a web-core design has to be deployed in
order to have rigid structure. Therefore, in the first step a decision about the type of
material has to be made, so that it complies with the desired thermal performance
needed in this project and then the structure of the panels will be designed.
It is obvious that the selection of insulating material is not only a function of
required thermal performance, but will also affect the cost of the product. The financial
cost of insulation includes the initial investment in the insulating material as well as
exploitation costs, such as the energy cost for the refrigeration system. To keep the
balance between these two categories, an optimization process is required to determine
the proper insulating material with correct thickness, which will not only comply with the
minimum thermal performance of the system, but also minimizes the overall cost of
reefer vehicle.
For web-core sandwich panels, since the material of the webs is not a perfect
insulation they act like thermal bridges through the core of the panel and the thickness of
them is best kept very small to reduce their thermal effects. On the other hand, the
thickness and depth of these webs has a key role in the mechanical strength of the
panel and larger thickness results in stronger panels. Therefore, there is a challenge in
determining the thickness and depth of the webs to design an optimum panel with the
right thermal performance and enough rigidity.
33

3.2. Insulation Thickness Optimization of Foam-Core Sandwich Panel
It is expected the reefer truck will operate while maintaining the cold temperature
of the storage area. For typical lifespan of ten years of operation, we aim to minimize the
total cost, which is the sum of the initial cost and the operational cost. The initial cost is
dependent on the type, thickness and price of the insulation that is used to lower the
heat gain of the cabin, while the operational cost is mainly the funds spent on the extra
fuel that is fed to the engine to provide power for the cooling system installed in the
reefer truck. The fuel that is used to provide power for moving the truck is not being
considered in this problem.
In summary, the problem here is designing a proper insulating panel that will
keep the balance between the initial cost of insulating material and the operational cost,
which is a result of fuel consumption. It is obvious that a low-quality insulation panel will
result in higher cooling loads to the refrigerated vehicle, which leads to higher
operational costs.
As discussed in previous sections, structure of a foam-core multi-layer insulation
panel, which is being used as a thermal shield in a reefer truck, consists of different
necessary layers that have different properties such as thermal conductivity, mechanical
strength and thicknesses. It should be mentioned that we are not going to consider
mechanical strength as a design constraint in this part, and the only parameter that is
going to be optimized will be the thickness of each layer, which depends on thermal
conductivity and price for the material.
The inner layer of insulating sandwich panels is made of fiber reinforced plastic
(FRP) sheet that is rated as a food grade material. The next layer would be the
insulating material, which has very high thermal resistance and is the main component
that is responsible for minimizing the heat gain in the storage area. This could be any of
the following commercialized insulating materials: open-cell polyurethane foam; closed-
cell PU; closed-cell (PIR); polypropylene honeycomb structure; or expanded polystyrene
(EPS) foam. Finally, the last layer must be made of a material that is capable of sealing
the entire panel against moisture and gas diffusion, such as polyvinyl chloride (PVC) or
34

polypropylene (PP) plastic sheet. Proper installation of this layer is crucial for the system
since it can protect the inner material from degradation and can significantly increase the
life expectancy of the insulation panel.
The variables in this optimization problem are the thicknesses of these 3 different
layers of the insulation panel that potentially can be used to minimize the heat transfer
from the environment to the storage area, reducing the total cost of the operation. Initial
values for the parameters in the optimization code are given in Table 3-1.
Table 3-1 Initial parameters and assumption for insulation materials2 [52]
FRP Open-cell
PU
Closed-cell
PU
Closed-
cell PIR
PP
honeycomb EPS PVC
Thermal
conductivity
(W/(m∙K))
0.3 0.028 0.022 0.022 0.040 0.035 0.15
Life
expectancy
(years)
10 3 5 5 10 10 10
Cost per 1
m3 (CAD) $5,000 $90 $200 $180 $500 $160 $1,000
Minimum
thickness
(mm)
2 - - - - - 1.0
Apart from FRP and PVC that are facing materials for the sandwich panel, it is
inferred from the table that PP honeycomb, which is a strong material, is the most
expensive insulation material that can be used. PS foam is a traditional insulating
2 Prices are from commercial websites: ebay.com, amazon.com, alibaba.com
35

material that is still commonly used in different refrigeration applications and has the
most reasonable price when considering its high mechanical strength in comparison to
open-cell PU. Open-cell PU foam is the most commonly used material since it has a
quite a low thermal conductivity and low price, but its life expectancy is also low due to
fast degradation.
It should be noted that the inside temperature is fixed at the desired level which
is 0°C since the product in the reefer should be kept below freezing.
3.2.1. Problem Formulation:
Formulation of a problem is the most important step in optimization and without
taking this step properly and carefully, one might face multiple issues in optimizing and
finding the optimum solution of function. The concept of problem formulation is
introduced in Ref. [53].
By calculating the heat gain of the refrigerated compartment, one can predict the
cost of the energy that is consumed to provide the cooling in a refrigeration system. The
energy cost depends on different parameters such as the type of refrigerating system,
the type and size of the vehicle, road conditions and the cost of fuel per litre in each
region. Therefore, for ten years of operation, which is a desired lifetime for a reefer van,
the total cost can be introduced as the sum of energy cost and price of insulation, which
is the initial cost.
𝑪𝑪𝒐𝒐𝑪𝑪𝒐𝒐 = 𝑬𝑬𝒊𝒊𝑬𝑬𝑬𝑬𝑬𝑬𝑬𝑬 𝒄𝒄𝒐𝒐𝑪𝑪𝒐𝒐 + 𝑰𝑰𝒊𝒊𝑪𝑪𝒐𝒐𝑰𝑰𝑰𝑰𝒐𝒐𝒊𝒊𝒐𝒐𝒊𝒊 𝒎𝒎𝑰𝑰𝒐𝒐𝑬𝑬𝑬𝑬𝒊𝒊𝑰𝑰𝑰𝑰 𝒄𝒄𝒐𝒐𝑪𝑪𝒐𝒐 = 𝑪𝑪𝒇𝒇 × �̇�𝑸 × 𝒐𝒐𝒘𝒘 + ∑ 𝒐𝒐𝒊𝒊𝒑𝒑𝒊𝒊𝒊𝒊𝒊𝒊=𝟏𝟏 × 𝑰𝑰𝒐𝒐
𝒅𝒅𝒊𝒊 (8)
Where 𝐶𝐶𝑓𝑓 is the energy cost, �̇�𝑄 is the rate of heat load and is calculated based on
Equation (1) , 𝑡𝑡𝑖𝑖 is the thickness of each layer of insulation and 𝑝𝑝𝑖𝑖 is the price of
insulation, 𝑙𝑙𝑡𝑡 is the expected lifetime, which is 10 years , 𝑑𝑑𝑖𝑖 is the degradation time for
each type of insulation, and 𝑡𝑡𝑤𝑤 is the working time of the reefer during its life. 𝑡𝑡𝑤𝑤 can be
calculated based on the expected lifetime (𝑙𝑙𝑡𝑡) and working schedule of the reefer. For
example, if it is assumed that the reefer only works during summer time (about 100 day
a year) and each day 8 hours, 𝑡𝑡𝑤𝑤 would be calculated as:
36
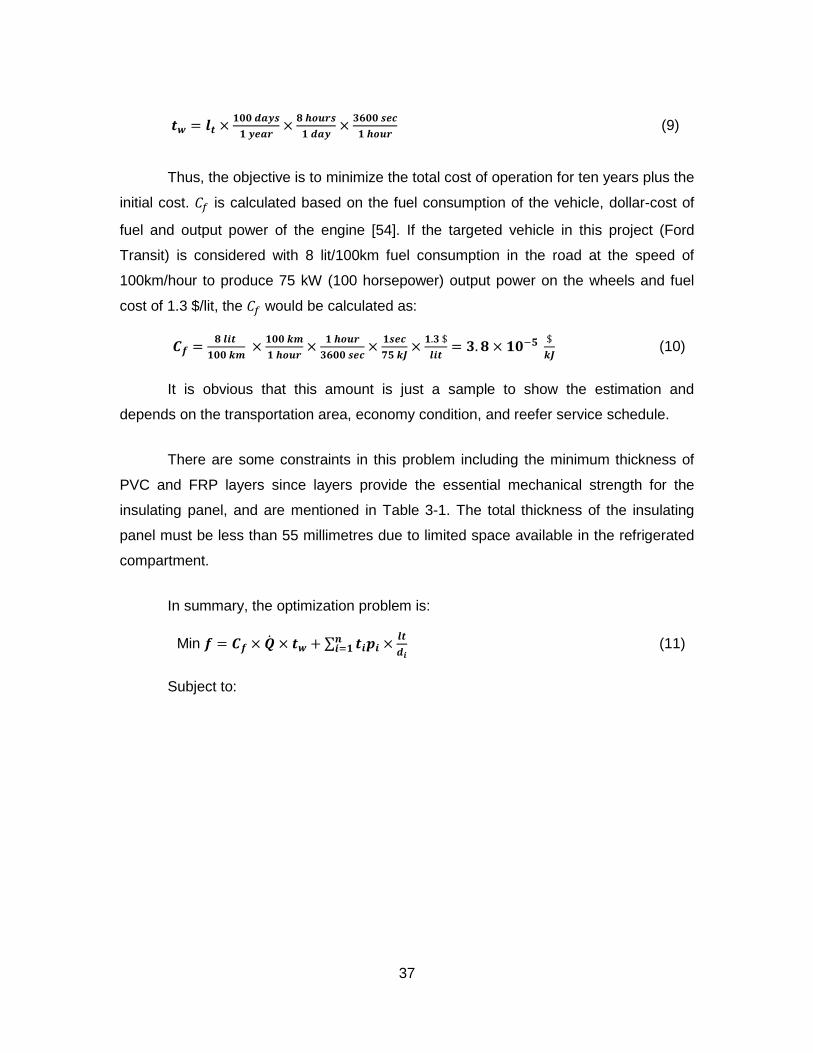
𝒐𝒐𝒘𝒘 = 𝑰𝑰𝒐𝒐 × 𝟏𝟏𝟏𝟏𝟏𝟏 𝒅𝒅𝑰𝑰𝑬𝑬𝑪𝑪𝟏𝟏 𝑬𝑬𝑬𝑬𝑰𝑰𝑬𝑬
× 𝟖𝟖 𝒉𝒉𝒐𝒐𝒐𝒐𝑬𝑬𝑪𝑪𝟏𝟏 𝒅𝒅𝑰𝑰𝑬𝑬
× 𝟑𝟑𝟔𝟔𝟏𝟏𝟏𝟏 𝑪𝑪𝑬𝑬𝒄𝒄𝟏𝟏 𝒉𝒉𝒐𝒐𝒐𝒐𝑬𝑬
(9)
Thus, the objective is to minimize the total cost of operation for ten years plus the
initial cost. 𝐶𝐶𝑓𝑓 is calculated based on the fuel consumption of the vehicle, dollar-cost of
fuel and output power of the engine [54]. If the targeted vehicle in this project (Ford
Transit) is considered with 8 lit/100km fuel consumption in the road at the speed of
100km/hour to produce 75 kW (100 horsepower) output power on the wheels and fuel
cost of 1.3 $/lit, the 𝐶𝐶𝑓𝑓 would be calculated as:
𝑪𝑪𝒇𝒇 = 𝟖𝟖 𝑰𝑰𝒊𝒊𝒐𝒐 𝟏𝟏𝟏𝟏𝟏𝟏 𝒌𝒌𝒎𝒎
× 𝟏𝟏𝟏𝟏𝟏𝟏 𝒌𝒌𝒎𝒎𝟏𝟏 𝒉𝒉𝒐𝒐𝒐𝒐𝑬𝑬
× 𝟏𝟏 𝒉𝒉𝒐𝒐𝒐𝒐𝑬𝑬𝟑𝟑𝟔𝟔𝟏𝟏𝟏𝟏 𝑪𝑪𝑬𝑬𝒄𝒄
× 𝟏𝟏𝑪𝑪𝑬𝑬𝒄𝒄𝟕𝟕𝟓𝟓 𝒌𝒌𝒌𝒌
× 𝟏𝟏.𝟑𝟑 $𝑰𝑰𝒊𝒊𝒐𝒐
= 𝟑𝟑.𝟖𝟖 × 𝟏𝟏𝟏𝟏−𝟓𝟓 $𝒌𝒌𝒌𝒌
(10)
It is obvious that this amount is just a sample to show the estimation and
depends on the transportation area, economy condition, and reefer service schedule.
There are some constraints in this problem including the minimum thickness of
PVC and FRP layers since layers provide the essential mechanical strength for the
insulating panel, and are mentioned in Table 3-1. The total thickness of the insulating
panel must be less than 55 millimetres due to limited space available in the refrigerated
compartment.
In summary, the optimization problem is:
Min 𝒇𝒇 = 𝑪𝑪𝒇𝒇 × �̇�𝑸 × 𝒐𝒐𝒘𝒘 + ∑ 𝒐𝒐𝒊𝒊𝒑𝒑𝒊𝒊𝒊𝒊𝒊𝒊=𝟏𝟏 × 𝑰𝑰𝒐𝒐
𝒅𝒅𝒊𝒊 (11)
Subject to:
37

𝒐𝒐(𝟏𝟏) + 𝒐𝒐(𝟐𝟐) + 𝒐𝒐(𝟑𝟑) + 𝒐𝒐(𝟒𝟒) + 𝒐𝒐(𝟓𝟓) + 𝒐𝒐(𝟔𝟔) + 𝒐𝒐(𝟕𝟕)− 𝟏𝟏.𝟏𝟏𝟓𝟓𝟓𝟓 ≤ 𝟏𝟏
−𝒐𝒐(𝟏𝟏) + 𝟏𝟏.𝟏𝟏𝟏𝟏𝟏𝟏 ≤ 𝟏𝟏
−𝒐𝒐(𝟑𝟑) + 𝟏𝟏.𝟏𝟏𝟏𝟏𝟓𝟓 ≤ 𝟏𝟏 (12)
−𝒐𝒐(𝟕𝟕) + 𝟏𝟏.𝟏𝟏𝟏𝟏𝟐𝟐 ≤ 𝟏𝟏
−𝒐𝒐(𝟏𝟏,𝟐𝟐,𝟑𝟑,𝟒𝟒,𝟓𝟓,𝟔𝟔,𝟕𝟕) ≤ 𝟏𝟏
3.2.2. Methodology
MATLAB [55] is a software package that is frequently used for optimization, since
it has a strong toolbox containing very useful functions such as ‘fmincon’ to solve
constrained optimization nonlinear problems. This function uses a sequential quadratic
programming method to solve a quadratic programming sub problem at each
iteration. Fmincon updates an estimate of the Hessian of the Lagrangian at each
iteration using the BFGS formula and performs a line search using a merit function [56].
In this study, “fmincon” will be used to find the optimum point for the objective function
since the cost function is nonlinear and constrained. The default settings of the “fmincon”
function yield reliable results, so the settings have not been changed from default in this
study. To exploit the “fmincon” function, it is required to define the objective function and
its constraints in the proper way. Therefore, three different MATLAB files were created.
The first of these three contains the run file while the other two define the constraints
and the objective function. For more details, please refer to the Appendix A of this report.
3.2.3. Results and Analysis
The final cost depends on many variables, such as the outside and inside
temperatures, the unit price of each insulating material and the fuel cost. In order to
better understand the effect of different parameters we need to change one variable
while keeping the others fixed. Since the outside temperature and the energy cost vary
in different regions and at different times of the year, it has been decided to perform a
parametric study on the effects of these parameters on the insulation thickness. The
results are gathered in Table 3-2.
38

Table 3-2 Effect of energy cost on the thickness of each insulating layer in mm (Tout = 30°C)
Energy cost ($/kJ) FRP Open-
cell PU Closed-cell PIR
Closed-cell PU
PP honeycomb EPS PVC
5.0E-06 2 0 0 0 30 1 1.0E-05 2 0 0 0 43 1 2.0E-05 2 0 0 0 0 52 1 4.0E-05 2 0 12 0 0 40 1 6.0E-05 2 0 35 0 0 17 1 8.0E-05 2 0 52 0 0 0 1
It is obvious from Table 3-2 that the insulating material and its thickness are
greatly dependent on energy cost. Not only does the higher energy cost affect the
operating expense but it forces the manufacturer to use more expensive and high quality
insulation as well. Also, the optimization code always tries to keep the thickness of PVC,
and FRP layers at minimum due to their very high cost in comparison with insulating
materials. To have a better understanding of this phenomena and see how the optimizer
switches from low-quality insulation to high-quality, the results are shown on Figure 3.1.
It is shown that as the fuel cost goes higher, the thickness of better insulation material (in
this case PIR) increases and low quality insulation gets thinner.
39
Figure 3.1. Effect of energy cost on the thickness of insulating layers in mm (Tout = 30°C)
Moreover, the overall thickness of insulating panel is calculated to be 55 mm,
which is the maximum, and it shows that no matter what type of material has been used,
it is more economical to invest more on insulation since it will reduce the fuel
consumption. Only if the energy cost is very cheap, as in the left side of the graph, does
it makes sense to use a smaller thickness of insulation.
It was discussed before that better insulation requires high initial cost or bigger
investment while cheap insulation will result in high fuel consumption or bigger
operational cost. To see this phenomenon, the targeted vehicle of this project (Ford
Transit Connect) with average reefer surface area of 20 m2 is considered. Based on the
optimization results for different fuel price, the operational and initial cost of the reefer
are calculated as in Table 3-3.
0
5
10
15
20
25
30
35
40
45
50
55
0 0.5 1 1.5 2 2.5 3
Insu
lario
n th
ickn
ess
(mm
)
Fuel price ($/lit)
Closed-cell PIR
EPS
Current cost=4e-5 $/kj
40

Table 3-3 Effect of fuel price on operational cost and initial cost of the Ford Transit reefer (Tout = 30°C)
Fuel price $/lit Operational cost Initial Cost Total cost Operational cost portion %
0.17 $100 $320 $420 23.81 0.34 $140 $360 $500 28.00 0.68 $240 $380 $620 38.71 1.37 $400 $440 $840 47.62 2.05 $500 $520 $1020 49.02 2.74 $580 $600 $1180 49.15
At the first rows of the table, the fuel price is quite low and consequently the
operational cost has the smaller portion of the total cost. As the fuel price raises toward
the bottom of the table, initial cost and operational cost both increase. Operational cost
is a direct function of fuel price while the initial cost will be bigger since the optimizer
tries to compensate the effect of energy cost by adding more thermal insulation to
reduce the load on the system. However, the rate of operational cost expansion is faster
than initial cost and at the bottom of the table, it reaches the 50% of total cost of the
reefer.
It should be noted that dollar amounts shown in Table 3-3 are the net costs
based on some assumptions and estimations. These values would be different from the
real amounts and should not be considered as final cost of the project. For example, to
manufacture the insulating panels in specific size and shape of the vehicles there is
always some scraps or leftover which raises the cost of initial material. Also,
manufacturing process and labour cost can be more expensive than the required
material for the panels. On the other hand, the energy cost of the reefer is a portion of
fuel cost for the vehicle and in this study is calculated only for the warm days of the year
(100 days assumption).
In Figure 3.2, the energy cost (fuel price) was kept constant to see the effect of
outside temperature change on the insulation material. In fact, because the inside
temperature is fixed at 0°C, this figure shows the effect of temperature difference
between inside and outside. It is inferred from the figure that by reducing the outside
41

temperature, the thickness and quality of insulation can decrease, which makes sense.
Thus, by running in colder climates the cost would be decreased. The other interesting
result is that the optimization code always chooses between two materials, EPS and
Closed-cell PIR. The first one is the cheapest insulating material and the second is the
best quality insulating material with a lower price. Although the unit price of open-cell
PU is less than EPS, the optimizing code prefer to use the EPS instead of open-cell PU.
The reason is that the lifespan of open-cell PU is less than operational life of the reefer
vehicle (10 years) and the insulating material needs to be replaced after that or the heat
transfer from outside will be increased gradually, which raises the energy consumption
as well. Since the algorithm just considers the total cost of project it cannot see the
advantages of the other material, such as the better mechanical strength of PP-
honeycomb panel, and the designer has to consider these issues.
Figure 3.2. Effect of outside temperature on the thickness of insulating layers (Fuel price =$1.3 /lit).
0
10
20
30
40
50
60
15 20 25 30 35 40 45
Insu
lario
n th
ickn
ess
(mm
)
Outside temprature (ºC)
Closed-cell PIR
EPS
42

It will be better for the environment to invest in the insulation instead of paying for
the consumption of fuel. However, what would be the optimum thickness of insulation for
this project? To answer this question, the conditions in a particular area have to be
considered. For example, if the average outside temperature is 25°C and energy cost is
4e-5 $/kJ (current energy cost based on the average cost of gas around 1.3 $/lit), the
result would be 48mm of EPS plus 4mm of closed-cell PIR. The thermal resistance of
the panel in this case is 1.56 that is equivalent to the U-value of 0.64 W/(m2K) which is
lower than the acceptable value mentioned from APC agreement (0.7 W/(m2K)).
In addition, shifting the constraint on the maximum thickness of the panel, which
is 55mm, has direct effect on the results. With 100mm constraint on the maximum
thickness and same condition for temperature and fuel cost, the result is 79mm of EPS
that is equivalent to U-value of 0.44 W/(m2K). In fact, if there is no maximum limit for the
thickness of the panel then 79mm of EPS will be the best insulation that minimizes the
overall cost of reefer. This phenomena can be seen in Figure 3.3 that shows the effect of
insulation thickness on normalized values of insulation and operational cost of reefer
where there is no limit on the maximum thickness of panel. As the insulation thickness
changes from the optimum value (79mm of EPS), the total cost increases.
43

Figure 3.3. Effect of insulation thickness on normalized cost of reefer (with no constraint on the maximum thickness of panel)
On the other hand, tighter constraint on the maximum thickness of the panel
would force the optimizer to use more efficient insulating material in the provided space.
For example, defining maximum thickness of 30mm urges the optimizer to recommend
closed-cell PIR as the proper insulation.
3.3. Web-Core Sandwich Panels
The decay of currently utilized foam insulation systems and the ever increasing
demand for system efficiency mandates comprehensive and systematic research into
new insulation materials. As was shown in the previous section regarding increasing
energy costs, high quality insulating material has to be employed to reduce the
operational cost of refrigerated vehicles. It was also discussed that super insulating
materials such as aerogel and vacuum insulation panels cannot tolerate the mechanical
0
10
20
30
40
50
60
70
80
90
100
110
50 60 70 80 90 100 110
Nor
mal
ized
Cos
t (%
)
Insulation Thickness (mm)
Insulation Cost
Operational Cost
Total Cost
Optimum value
44

stress in ordinary sandwich panels and web-core sandwich panels were invented to
solve this problem. The webs, which are working like reinforcing webs among the
insulating material, increase the rigidity of the panel. Although the number of webs and
their thickness play key roles in panel strength, they would also change the thermal
resistance of the panel in the opposite way since they act like thermal bridges between
the two sides of the panel. Therefore, these parameters have to be designed in such a
way to provide the required efficiency for the insulation panel, both thermally and
structurally.
3.3.1. Problem Formulation
In this section, a proper geometry for the reinforcing structure will be chosen and
optimized in order to have the smallest thickness of the panel while maintaining a
satisfactory mechanical strength and thermal performance. The main reason to reduce
the height (overall thickness) of the panel is decreasing the cost of insulating material.
As it mentioned before, aerogel blanket is one of the most expensive insulating materials
in the market and its application will have significant impact on the initial cost of the
reefer. Obviously, smaller height of the panel would save some useful space in cargo
area of the reefer and might lower the weight of the panel and its manufacturing cost as
well.
In Figure 3.4, the insulation panel is shown to consist of a plastic tray with
reinforcing webs in the back. The insulating material fills in the space between the webs.
The length and width of the insulating panel unit are fixed (1m x 0.5m) while the
thicknesses shown in Figure 3.4 and the number of webs in each direction (n1 in the
length and n2 in the width) are the design variables that should be optimized to gain the
minimum thickness of the panel while maintaining the thermal resistance above the
design value and the maximum stress in the allowable range (Table 3-4).
45

Figure 3.4. Schematic of the reinforcing structure for the insulating panel and associated design variables
Table 3-4 Design variables and the associated bounds
Variables h (mm) tp (mm) ts (mm) tr (mm) n1 n2
Lower bound 20 1.5 1.5 1.5 1 1
Higher bound 55 6 6 6 5 3
Since our application requires the reefer truck to be heavily insulated to minimize
the costs associated with cooling the truck, the U factor value of 0.5 W/(m2K) has been
chosen to be the constraint on thermal performance of the insulation panel, a lower
value than is demanded in ATP agreement. In addition, this value can provide the
opportunity to compare the results of this section with previous one to see which core
46

structure and material would work better for this project. To calculate the U factor for the
reinforced insulation panel, one-dimensional heat conduction was considered as is
shown in Figure 2.21. The total thermal resistance of the panel can be calculated based
on equation (6) and then the U factor is the inverse of R. Because the goal is to have an
insulation panel with U factor less than 0.5 W/(m2K) for any combination of design
variables including number of webs and the thickness of panel in different areas, this
constraint has to be considered during analysis:
𝑼𝑼 = 𝟏𝟏𝑹𝑹𝒐𝒐𝒐𝒐𝒐𝒐
< 𝟏𝟏.𝟓𝟓 𝐖𝐖𝐟𝐟𝟐𝟐𝐊𝐊
(13)
In reality, the heat transfer through the web-core panel is two-dimensional which
is not easy to calculate theoretically. To justify the one dimensional calculation for the
case of this study, a FEM analysis was performed on a two-dimensional model of a PVC
panel with aerogel insulation that is exposed to 25 ºC of temperature deference between
the both sides. Result for temperature distribution inside the panel is shown in
Figure 3.5.
Figure 3.5. Temperature distribution contour of two-dimensional analysis for a web-core panel
The isothermal planes that are shown in Figure 3.5 with different colors can be
considered quite flat which means the heat transfer that is vertical to these planes is only
in one direction and can be estimated as one dimensional.
47

It should be noted that heat transfer analysis and U-factor calculation during
optimization process could be done using FEM analysis of the same 3-D structural
model. However, since it increases the computation time of the process and on the other
hand, theoretical calculation is quite accurate and fast, it was decided to use one
dimensional heat transfer method that is discussed in section 2.2.4.
3.3.2. Methodology
To design the mechanical strength of the panel, the highest load on the panels
shall be assumed, which includes the weight of all products and the workers during
loading or unloading. For example, if Ford Transit Connect considered as the targeted
vehicle, since the maximum load capacity of the vehicle is 400 kg and cargo size is 2 x
1.25 m then a uniformly distributed loading of 150 kg/m2 can be applied with the safety
factor of 2. Calculating the stress or deflection of the panel under this load based on an
analytical formulation is a difficult problem, requiring many simplifications and unreal
assumptions. FEM software such as ANSYS is powerful tool that can help to solve this
problem and provide reliable results. Because the optimization process needs the
structural calculations to be performed repeatedly for variety of design variable values,
programing the FEM software for the desired problem has to be done in a parametric
way. Therefore, an ANSYS script file was written for modeling the panel under the given
design parameters.
The code reads the initial values from a .txt file as an input, creates the
necessary points, lines and areas to build the model, meshes the model with Shell
element and applies the desired boundary conditions, such as supports on the bottom of
the panel and vertical distributed load on the top surface of the FEM model. The loading
is perpendicular to the face of the panel and it is assumed that the panel is mounted on
the ground (floor of the truck) so the vertical displacements of all the nodes at the bottom
edge of the webs are zero as shown in Figure 3.6. Also, due to symmetry and to avoid
free body displacement of the panel only the center node of the panel is fixed in the
horizontal directions. After solving the problem, the maximum equivalent stress (Von
Mises) of the panel under the applied load has to be found and written in another .txt file
as the result of analysis. The output result from ANSYS is the constraint value for the
48

optimizer based on the given initial parameters, which should be less than the allowable
flexural stress of the material.
Figure 3.6. Schematic of applied load and boundary condition to the panel
Material properties for the body of panel and insulating material that are used in
this project are provided in Table 3-5.
Table 3-5 Properties of the materials being used in insulation panel design [57 ,38]
Material Young
modulus
Poisson
Ratio
Thermal
Conductivity
Allowable
flexural stress
Density
Panel body PVC plastic 2 GPa 0.4 0.15 W/mK 2.5 MPa 1400 kg/m3
Insulation Aerogel
Blanket - - 0.015 W/mK - 130 kg/m3
On one hand, the modular geometry of the structure provides mechanical
support for the panel; on the other hand, the high thermal conductivity of the material
used in the structure acts as a thermal bridge and reduces the thermal resistance of the
insulation panel, which in turn leads to higher energy loss during operation. In
W=0.5 m L=1 m
: Simply support in vertical direction
P=300 kg/m2
49
conclusion, there is a trade-off between mechanical strength and thermal performance of
the insulation panel. This is where optimization of the problem could help to find the best
solution.
ANSYS allows the user to perform optimization algorithms to minimize the
mechanical stress or deflection in a structure. MATLAB also has a very sophisticated
and comprehensive optimization toolbox that can be used in order to optimize different
kinds of engineering problems; however, it is not a finite element method software. It is a
powerful program that provides different optimization algorithms besides the possibility
to define new optimization algorithm. In conclusion, coupling ANSYS and MATLAB can
create a powerful tool to solve optimization problems that associated with complicated
FEM analysis. Since the user can change the optimization and geometry parameters in
the same algorithm, different parameter’s effect on the results can be observed. One of
the main advantages of coupling ANSYS with MATLAB is that this method is done
automatically and user intervention is not required until a stopping criterion is satisfied
and the final solution for the problem has been found [59].
Different optimization algorithms are available in the optimization toolbox of
MATLAB. Genetic algorithm has been selected to optimize the reinforcing structure of
this study because it is a global optimizer and capable of doing multidimensional search
in a space defined by different design variables and includes so many local minimums.
Genetic algorithm efficiency has been proved in variety of scientific fields
experimentally [58]
A genetic algorithm uses a group of variables, called individuals, that are
changed and mutated during the process. A chromosome that is described by the design
variables represents each individual. Initial population of individuals are selected
randomly at the beginning of the process. Based on newly generated variables, the
objective function will be evaluated with respect to the constraints, if there are any.
Valuable individuals with higher performance will be selected as parents to transfer their
genetic materials to the next generation. Probability of selection is higher if the individual
shows better evaluation. Selected individuals can be sent to the next generation directly
or passed through crossover process. Crossover uses two random parents and
50

exchange their chromosomes to generate new individuals. Mutation process which
introduces new different individuals from the first generation is the next step after
crossover that all the individuals have to pass before going to next generation.
Population size remains the same during all these processes and generation of the new
populations. Repetition of the evaluation process will be stopped if the population
converges to a certain level (difference between individuals is smaller than the defined
tolerance) or maximum number of generation is reached [58].
It is noteworthy that a genetic algorithm is not deterministic and in different runs,
one might get slightly different results. Thus, no general conclusion can be gained, but
some guidelines have been proposed to determine the best type of operator and genetic
algorithm parameters and the size of the population, which are mostly based on
experiments and trial and error. If a convergence criterion is defined in the algorithm, it
will allow the genetic algorithm to stop the search for the global optimum without actually
obtaining the exact value of that. In order to reach an acceptable solution, different kinds
of criteria can be defined. It can be based on the best individual, the average of the
population, the specified maximum number of generations or maximum allowable time
for the process [58].
Compared to other optimization methods, a genetic algorithm has many
advantages. The most significant advantage of a genetic algorithm is that it can optimize
large number of continuous and discrete variables and can deal with analytical functions
as well as experimental or numerical data. In spite of that, a genetic algorithm could be
time consuming regarding the performance evaluation of each individual. For the case of
this study, where the finite element method is used to evaluate the constraint of
structural performance, this could be an issue. In fact, if the settings of the genetic
algorithm are not properly defined, the run time could exceed a few days. Furthermore,
genetic algorithms do not guarantee to find the global optimum and there is no exact
way to determine which type of operators and parameter setting would result in the best
optimized value. Only through a set of experiments with different parameters, one can
observe the effect of various operators and setting on the optimized value and some
improvement on the initial configuration can be achieved [58]. Table 3-6 indicates the
51

genetic algorithm settings used to solve the problem. Further discussion about the effect
of each setting on the final results is found in section 3.3.4.
Table 3-6 Genetic Algorithm setting parameters for MATLAB
Parameter Number of
Variables
Population
size TolFun TolCon Generations
Mutation
rate
Value 6 100 1E-3 1E-3 20 0.05
3.3.3. Coupling ANSYS with Genetic Algorithm
In order to be able to automate the proposed optimization methodology it is
necessary to couple optimization algorithm from MATLAB to FEM problem in ANSYS.
Similar process has been performed to optimize the weight of a bus structure that is
described completely in [59] and used as a reference in this study.
Any FEM problem can be created and solved in ANSYS either by using
commands from menus or by running a code in ANSYS Parametric Design Language
(APDL). Creating and solving a model by means of APDL has advantages, for example
the model can be defined using variables that can be manipulated to define different
models. Generally, the variables that are defined to create a parametric model are panel
thickness and height, number of webs in longitudinal and lateral directions and the
thickness of the webs, as they influence panel mechanical strength. Other variables
such as the panel dimensions are defined as constant parameters based on the
geometry of the reefer truck that the panel is supposed to be installed in. During the
optimization loop, the values of design variables will be changing until the stopping
criteria is satisfied. Separate files with text format can be created with APDL to provide
the possibility of transferring data such as results or input variables between ANSYS and
MATLAB.
Figure 3.7 demonstrates the optimization loop and the output files that transfer
information between different steps. All of the created files are placed in the same folder
that is introduced to MATLAB and APDL code.
52

Figure 3.7. Flow chart of the optimization process
Following steps are performed by the optimization algorithm:
The file “OptimPanel.m” that runs the genetic algorithm in MATLAB, needs to
evaluate the fitness function and satisfaction of the constraints. Thus, it creates the first
set of design variables in the specified bands and recall files “fitnessfunction.m” and
“Constraint.m” in a loop for evaluation.
The file “Constraint.m” that supposed to investigate the validity of mechanical
and thermal constraints, inserts the values associated to each of the variables in the file
“parameters.txt”. After that the finite element model can be run. The finite element model
is programmed, by means of APDL, in a text file (“Reinforcing Panel.txt”). This text file
gets the values of the variables from file “parameters.txt”. After running the finite element
analysis, once the model is solved, the result is stored in a file (“Stress.txt”). This result
will be used to evaluate the constraint, which represents the maximum equivalent stress
in the panel under the defined load and must be less than the allowable amount for the
Constraint.m
Stress.txt
Reinforcing Panel.txt
Parameters.txt
Genetic Algorithm
OptimPanel.m
MATLABCode
ANSYSParametric
Code
MATLABCode
Stress EvaluationU-value Evaluation
53

material. In addition, U-value of the panel based on the design variables is calculated
and compared with reference value by MATLAB code in file “Constraint.m”.
In the next step, the value of all the variables is changed by the genetic algorithm
using genetic operators, in order to achieve a minimum in the fitness function. The new
values of the design variables are stored and overwritten during each loop in
“parameters.txt”. The process will continue until a stopping criterion is satisfied. For more
details, please refer to Appendix A. of this report.
3.3.4. Results and Discussion
In order to calculate the stress of the web-core panel under a uniform constant
load, a proper mesh should be generated in ANSYS. Mesh generation is one of the most
important steps in engineering analysis using a finite element approach. Too many cells
may extend the computing time and make the FEM analysis a very long and slow
process, while too few cells may lead to unreliable results. The mesh generated in
ANSYS for this specific problem is shown in Figure 3.8. In order to find the satisfying
mesh of the panel a sensitivity study on the element size is performed for a few different levels of mesh sizes. Less than 2 percent relative difference for equivalent stress at
critical points is observed for refining mesh size from 10mm to 5mm while the
computation time increases more than 3 times. Therefore, the element sized is selected
to be 10mm and using a typical Pentium Dual-Core PC the average computation time for
the proposed model is about 5 seconds.
54

Figure 3.8. Mesh generated in ANSYS [60]
Figure 3.9 shows equivalent stress (Von Mises) in the structure of the reinforcing
panel under a uniform load. It is observed that the maximum stress occurs at the
junction of webs and the panel surface, which verifies that the webs are supporting the
panel against deflection, as there is some stress concentration at this point. In order to
reduce the maximum stress, the number of supporting webs could be increased.
However, it should be noted that increasing the number of webs could result in higher
thermal conductance values since the thermal conductivity of the webs is orders of
magnitude higher than that of aerogel blanket.
1
XY
Z
APR 9 201519:12:36
ELEMENTS
55

Figure 3.9. Nodal solution by ANSYS, indicating equivalent stress (Von Mises) of the panel
One of the important parameter in the genetic algorithm is population size, which
is used to increase the accuracy of the obtained result. Therefore, the value of this
parameter is increased by an order of magnitude in a few steps to find the proper size.
More accurate results are achieved by increasing the population size, with a higher
number of function evaluations and more computation time. Since, for each function
count, the GA has to run the ANSYS script one time, which takes about 5 seconds, large
population size ended up taking around one full day to run. However, in the end, the
value of 100 demonstrated the decent result for this study since brief exploration of the
individuals in population showed good coverage of ranges; and thus, was chosen as the
initial setting.
The crossover rate is also changed and a crossover rate of 0.8 evolved as the
best value for this problem. Decreasing the rate will result in more stagnant generation
characteristics. This means that with a lower crossover rate, less change will happen in
the genetic characteristics of two consecutive generations. Thus, slower march towards
the global optimum value will be observed.
1
MN
MX
X Y
Z
13424.7
243442473459
703476933493
.116E+07.139E+07
.162E+07.185E+07
.208E+07
OCT 14 201510:45:08
NODAL SOLUTION
STEP=1SUB =1TIME=1SEQV (AVG)DMX =.001161SMN =13424.7SMX =.208E+07
56

Mutation options specify how the genetic algorithm makes small random changes
to the individuals in the population to create mutation children. The initial setting for the
mutation rate parameter of the GA in MATLAB optimization toolbox is 1%. Increasing the
rate to more than 10% can make the convergence unstable. It is known from the physics
of the present optimization problem that there are many local minimums for the fitness
function, which can confuse the GA when searching for the absolute optimum of the
problem. After a few tries, it was concluded that the mutation rate of 1% is not enough
for the GA to jump over the local minimums and consider the diversity of answers. As a
result, the mutation value was changed and 5% was discovered to be a good value in
order to find better results.
The MATLAB code was run multiple times with the final settings to find the
minimum height of the insulated panel and some selected results are shown in
Table 3-7. In addition, as an example of obtained results, Figure 3.10 shows the
evolution of the height value of the insulated panel. From Figure 3.10 it can be observed
that although very big values of the height were obtained at the beginning, once smaller
values minimize the fitness function the genetic algorithm converges to a solution.
Figure 3.10. Example of the evaluation on the value of the panel height
As mentioned before, one of the shortcomings of the genetic algorithm is that it is
not a deterministic method, which means that in different runs the results generated by
the genetic algorithm might be different. For this reason, in this study the optimization
57

process was run multiple times in order to make sure that the results are consistent and
GA is not reporting a local minimum as the global one.
Table 3-7 Results of optimization for different runs of MATLAB
Run h
(mm)
tp
(mm
)
ts
(mm)
tr
(mm
)
n1 n2 Evaluation
Count
U
W/m2K
Weight
kg
Webs
Heat
transfer
%
Stress
(MPa)
1 46.2 3.3 1.5 1.6 1 3 2300 0.38 3 10 0.982
2 42.4 5.7 1.7 1.7 1 1 3400 0.40 4.4 5 1.602
3 38.4 5 1.6 2.8 3 2 1800 0.50 4.5 18 0.65
4 36.2 5.4 1.6 1.7 2 2 2300 0.47 4.3 9 0.62
The minimum height that is found for the panel as the final answer of optimization
process is shown in the last row of the table, which is 36.2 mm. A legitimate reason for
being the global minimum is multiple convergences of the algorithm to this value among
so many runs. Although genetic algorithm reported some local minimums, as the final
answer in other runs, as brought in other rows of the table, the only way to make sure it
is not missing the global optimum is running it so many times to increase the possibility
of covering all the design space.
As it is observed in Table 3-7, different results for height and thickness of webs,
thickness of surrounding structure, thickness of base plate, the number of webs placed
along the length (n1), and the number of webs placed along the width (n2) are reported
that do not indicate the minimum possible height of the panel, but can be interpreted as
good solution to the problem. This is due to the fact that local minimums of this problem
also have some advantages which can be used by the designer. For example, the first
row of the Table 3-7 introduces a panel that is very low in weight in comparison with
other, or the panel that is shown in the second row has the minimum number of webs,
58

which can be an advantage regarding the manufacturing cost of the panel. Considering
the results, the designer has different choices for the height, thickness and number of
webs in the insulating panel. If the required space for the reefer is very limited, it is better
to choose the lowest height although a larger number of webs would be necessary,
making the manufacturing process harder and more expensive. On the other hand, a
thicker panel provides better insulating capability and perhaps more insulating material
and higher cost as well
Taking a closer look at the weight of the panels, it can be concluded that the
smaller number and thickness of the webs and panel plate would result in lighter panels
and consequently less material that can bring the cost of manufacturing down. Also, the
smaller height of the panel does not necessarily result in lighter panel as item number 4
is much heavier than item number 1. On the other hand, it should be noted that the
deeper panel (bigger height) requires more insulating material which is quite expensive
in the case of aerogel blanket and can affect the final cost of insulating panel.
It is mentioned before that a portion of heat transfer from the insulated panel is
through the webs since they can create thermal bridges between sides of the panel by
having higher thermal conductivity than the insulating material. Calculated results in the
last column of Table 3-7 prove this idea and show that structural webs can play a
significant role in the thermal resistance of the panel. For instance, item number 3 that
has maximum number of webs relative to the other items, conducting bigger portion of
heat through the webs up to 18 percent.
It is observed in Table 3-7 that the thickness of the panel is higher than the
thickness of the webs. To justify this result, a deeper understanding of the loading
distribution and the way the reinforcing panel would bend under load is necessary. The
stress concentration over the panel facing plate due to the bending moment under load
causes higher stress on the closest elements to this point, while the inner webs are only
under a compressive pressure and not bending as shown in Figure 3.9. Since the
uniformly distributed load is symmetrical with respect to the web, it eliminates any sort of
bending moment on the webs.
59

It would be beneficial to have a comparison between the minimum thickness of
web-core panel that is achieved in this section for aerogel insulating material and the
equivalent thickness of a foam-core sandwich panel that provides same amount of U-
value. Regarding the thermal properties of insulating material in Table 2-1, thickness of a
panel with Polyisocyanurate (PIR) core should be 48mm to provide the U-value of 0.47
W/m2K while expanded polystyrene (EPS) foam requires 76mm of thickness. Therefore,
the PIR panel would be only 12 mm thicker than aerogel panel. It is interesting that
although aerogel blanket has super insulating properties but necessary reinforcing webs
in the structure of its insulating panel for the application of this study reduce its thermal
performance and advantages as well. Needless to mention that aerogel blanket cannot
compete in price with other insulating materials in the current market.
60

Chapter 4. Implementation of Modular Insulating Panels
Initial concepts for designing the insulating panel such as selection of insulating
materials, required thickness and mechanical structure of the panel were discussed in
the previous chapters. The next step is designing modular panels that can be
prefabricated in mass production methods that provide faster and better quality
insulating panels. Building a full-scale prototype to validate the capability of the
developed design for quick and easy installation inside the target vehicle of this project
(Ford Transit Connect) is also necessary.
4.1. Modular Panels and Attachment Methods
One of the important parts in the design of a mechanical system is the installation
process, since it can affect the final quality of the product and its working life. Also,
installation takes time and labor and so may be costly if is not planned properly. As
mentioned before, in the traditional method of insulating reefer vans, insulation material
and protective layers are built and installed inside the vehicle one after another. Since, in
this project insulating panels are supposed to be prefabricated, the manufacturing and
installation process are separated, making it much easier and faster for the installer.
Moreover, the modular system of panels would help not only in the installation,
but also later during maintenance or repair, since each part of the insulation can be
assembled or disassembled from the others individually. For instance, the whole
insulation package can include panels for the floor, ceiling, side walls, front wall, and
backdoors. Also, if one of the panels is too big to be manufactured or installed based on
this arrangement, it can be sliced to smaller sections, i.e. the floor could be made of two
parts. However, having separate components in the system requires an attachment
method that can hold each part in the right spot. The common way to mount the panels
61

inside the vehicles is to use normal fasteners such as bolts, screws, or rivets. However,
using the metal fasteners would create thermal bridges between inside and outside of
the panels, which is not desirable. Also, this process can be time-consuming and
requires certain equipment that may not be available to all installers. Therefore, in this
section some engineering solutions are proposed for mounting the modular panels
inside the vehicle in an easy and quick way, which also avoids thermal bridges.
A French cleat is a common way to mount the cabinets on the wall (Figure 4.1).
In this mechanism there are two wedges, one attached to the wall and the other to the
part to be hanged. The weight of the cabinet causes the two edges to come together in
such a way that they cannot move. The same concept can be used for the attachment of
the panels to the walls of the van.
Figure 4.1. Schematic showing the concept of a French cleat [62]
Toggle mechanisms are an often-used clamping method that can pull or push
two objects toward or against each other (Figure 4.2). In this mechanism related parts
are jointed to each other by hinges that are so arranged that a small force applied at
middle point can create a much larger force at the side points. If the angle between the
links passes the dead point (zero degree) the mechanism is locked and cannot open up
by itself. To deploy this concept for the attachment of panels inside the vehicle, each pair
of panels should be jointed together by hinges. For example, if the floor panel is sliced
into two parts that are hinged together, they can work like a toggle mechanism to push
the side panels back against the walls and tightly hold them in place.
62

Figure 4.2. Schematic showing the concept of toggle mechanism [63]
4.2. Scanning the Geometry of the Vehicle
In order to design a proper insulating system for the targeted vehicle, the first
step was to know the geometry of the refrigerated compartment, its size and space
limitations. Unfortunately, a detailed CAD drawing of the Ford Transit Connect is not
accessible for research applications. As it is shown in Figure 4.3, the interior design of
the vehicle has a complicated geometry, including a lot of curves, angled surfaces,
round shapes, holes, beams, and side doors. As such, a simple measurement with
ordinary measuring tools is not satisfactory and would not provide enough information to
design the insulating panels.
63

Figure 4.3. Interior view of the Ford Transit Connect, which is to be insulated for reefer applications
Therefore, it was decided to take a three-dimensional image of the vehicle
interior body and transform the geometry to a computer model. One of the most accurate
and easy ways to do this is to use a portable 3-D scanner. It is possible to bring this
device wherever is desired and scan in constrained spaces like the interior or outer
surface of objects. A HANDYSCAN 3-D scanner [64] was employed to scan the interior
geometry of the van. In order to recognize its position relative to the surface of the
object, the scanner requires some positioning targets as small reflecting dots on the
surface of the objects. The reflecting targets are small stickers that have to be mounted
on the object prior to the scanning process (Figure 4.4). The scanner sees the same
64

patterns of positioning targets and by triangulation, the scanner is able to determine its
position relative to the part (or targets).
Figure 4.4. Schematic of the 3-D scanner working process [64]
The scanners have automatic surface generation that, during the scanning
process, produces the curves in an optimization loop from the collected data. The
density and arrangement of the positioning targets can affect the quality of imaging and
should be done by an experienced person [64]. The resolution of the camera was set to
2 mm in order to scan the small features of the vehicle body. The presence of small
holes inside the body of the van can be confusing for the scanner since there are two or
three layers of surfaces at the spot and it is not easy to put the reflector stickers inside
the holes. To solve this problem, all the small holes were covered with masking tape.
Figure 4.5 shows the scanning process of the Ford Transit Connect.
65
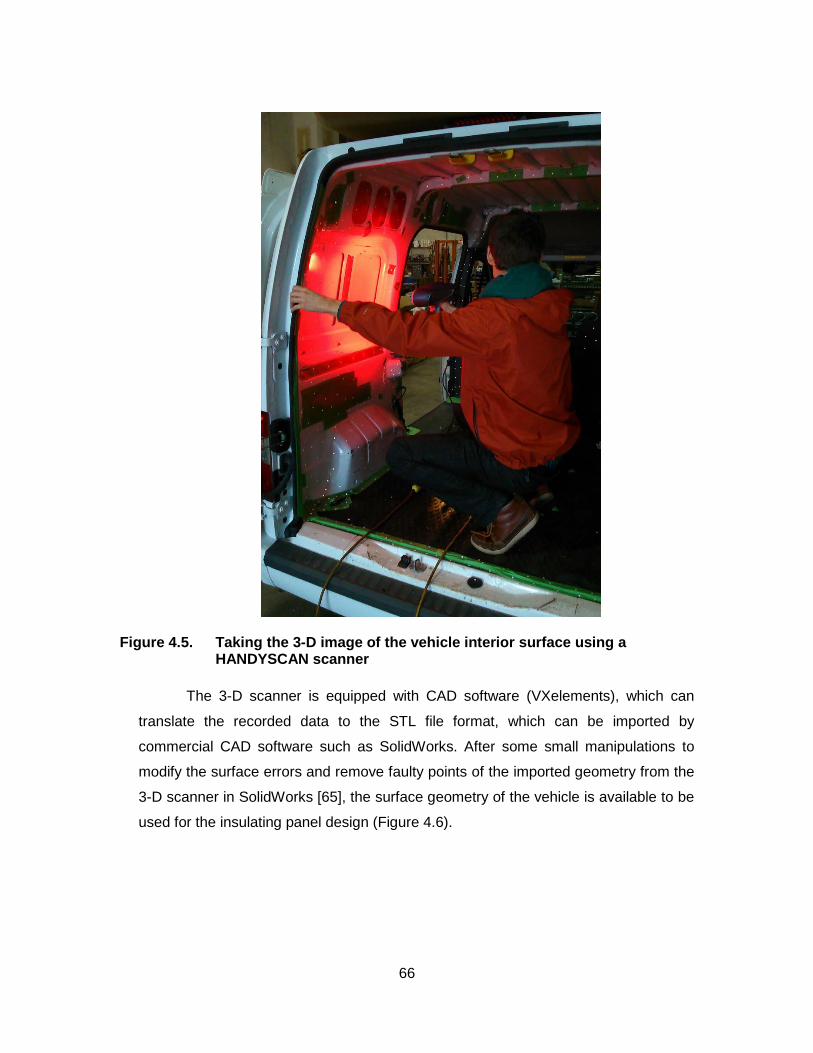
Figure 4.5. Taking the 3-D image of the vehicle interior surface using a HANDYSCAN scanner
The 3-D scanner is equipped with CAD software (VXelements), which can
translate the recorded data to the STL file format, which can be imported by
commercial CAD software such as SolidWorks. After some small manipulations to
modify the surface errors and remove faulty points of the imported geometry from the
3-D scanner in SolidWorks [65], the surface geometry of the vehicle is available to be
used for the insulating panel design (Figure 4.6).
66
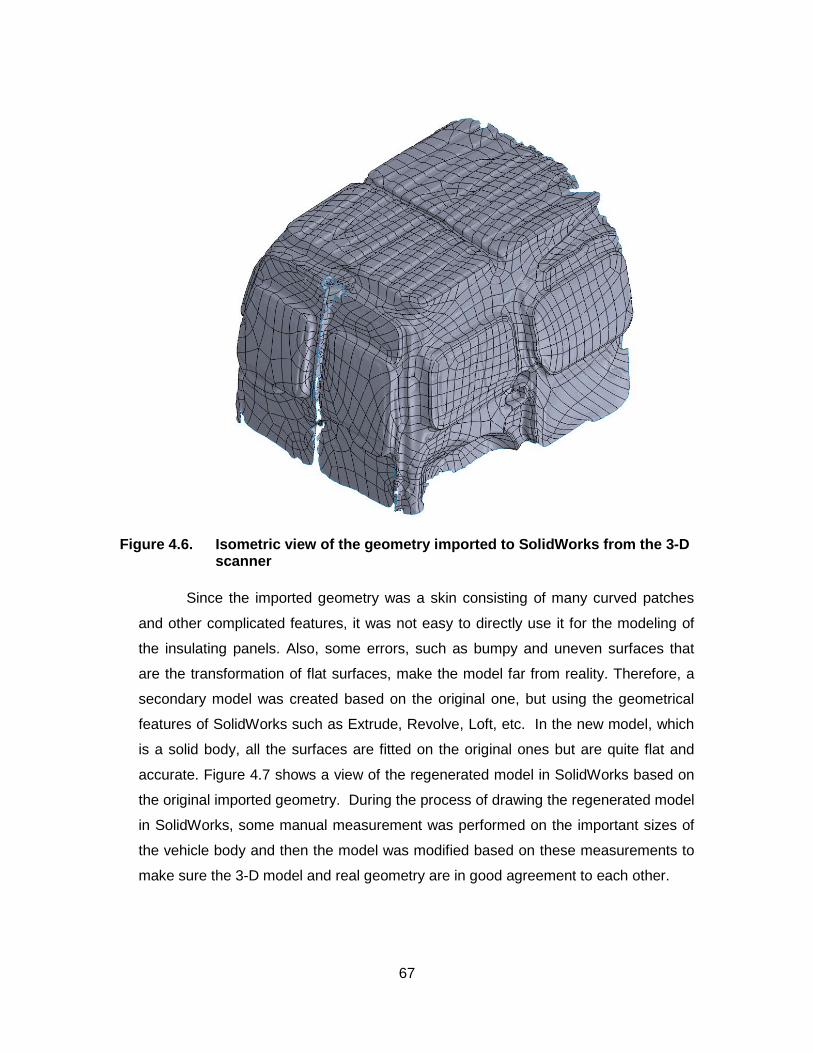
Figure 4.6. Isometric view of the geometry imported to SolidWorks from the 3-D scanner
Since the imported geometry was a skin consisting of many curved patches
and other complicated features, it was not easy to directly use it for the modeling of
the insulating panels. Also, some errors, such as bumpy and uneven surfaces that
are the transformation of flat surfaces, make the model far from reality. Therefore, a
secondary model was created based on the original one, but using the geometrical
features of SolidWorks such as Extrude, Revolve, Loft, etc. In the new model, which
is a solid body, all the surfaces are fitted on the original ones but are quite flat and
accurate. Figure 4.7 shows a view of the regenerated model in SolidWorks based on
the original imported geometry. During the process of drawing the regenerated model
in SolidWorks, some manual measurement was performed on the important sizes of
the vehicle body and then the model was modified based on these measurements to
make sure the 3-D model and real geometry are in good agreement to each other.
67

Figure 4.7. View of the regenerated model in SolidWorks based on the original imported geometry from the 3-D scanner
4.3. Scaled Chamber for Experimental Test Setup
In this phase of the project, a small experimental test setup was designed and
built to provide some measurements. For example, to prove the proposed CFD model
for the air infiltration of the reefer at the time of door opening or to measure the overall
heat transfer of the sandwich panels with the selected insulating material, it was required
to make an experimental setup similar to the real condition. For more details on the air
infiltration testing chamber, please refer to the Appendix B. of this report. Because
building the desired chamber in real scale would be very expensive and requires big
space and facilities to run the test, it was decided that a scaled-down prototype of the
Ford transit loading compartment is built and used for different application.
Design considerations for the test bed panels were different from the real
insulating panels for the van. Because there was no exterior structure like the body of
68

the vehicle to hold the test bed panels, they have to be designed in a way to hold by
themselves after assembling. Also, the thickness of panels could not be a scale of real
one since it would be very thin and not enough insulation for heat transfer tests. The
thickness of insulation was calculated about 50 mm for the real scale and if the prototype
is one fifth of the real size, the thickness would be 10mm that is too small to keep the
heat load in or outside of the chamber walls. Figure 4.8 shows one of the side panels
for the prototype and empty space between the two faces that can be filled with the
insulating material. To easily assemble all the pieces, small connecting dowels were
used as male parts to mate to female holes.
Figure 4.8. Render of a complex panel from the test bed design in SolidWorks
To quickly prototype the test bed, 3D printing was explored. Through exploring
different options 3D printer at the School of Mechatronics of SFU were found to be less
costly than outside sources, but the limited size of printing forced the scale of the
prototype to be very small or each panel had to be made in a few parts and attached to
each other later. Other option for the 3-D printing was partnership with Sheridan College
in Ontario. Sheridan’s largest 3D printer is able to print 3’x2’x3’; having a larger printing
area made it possible to print items without the need to separate them into multiple
69

parts. Sheridan College also used ABS-M30 plastic instead of regular ABS which is
more durable. Figure 4.9 shows the complete model of the 3D printed parts.
Figure 4.9. Complete model of the printed prototype after assembling
4.4. Modular Panel Modeling
The next step was to design the insulating panels based on the SolidWorks
model. As shown in Section 3.2.3, the thickness of the insulation should be around
50mm or 2 inches. Therefore, for each side of the chamber a panel was designed that
covers the whole surface and does not interfere with features on the main body. In order
to use the space inside the chamber in the best way and not to waste any volume, the
designed panels would have a similar shape to the walls. In this way, panels for the
floor, roof, rear doors, sides and front wall were modeled in SolidWorks (Figure 4.10).
70
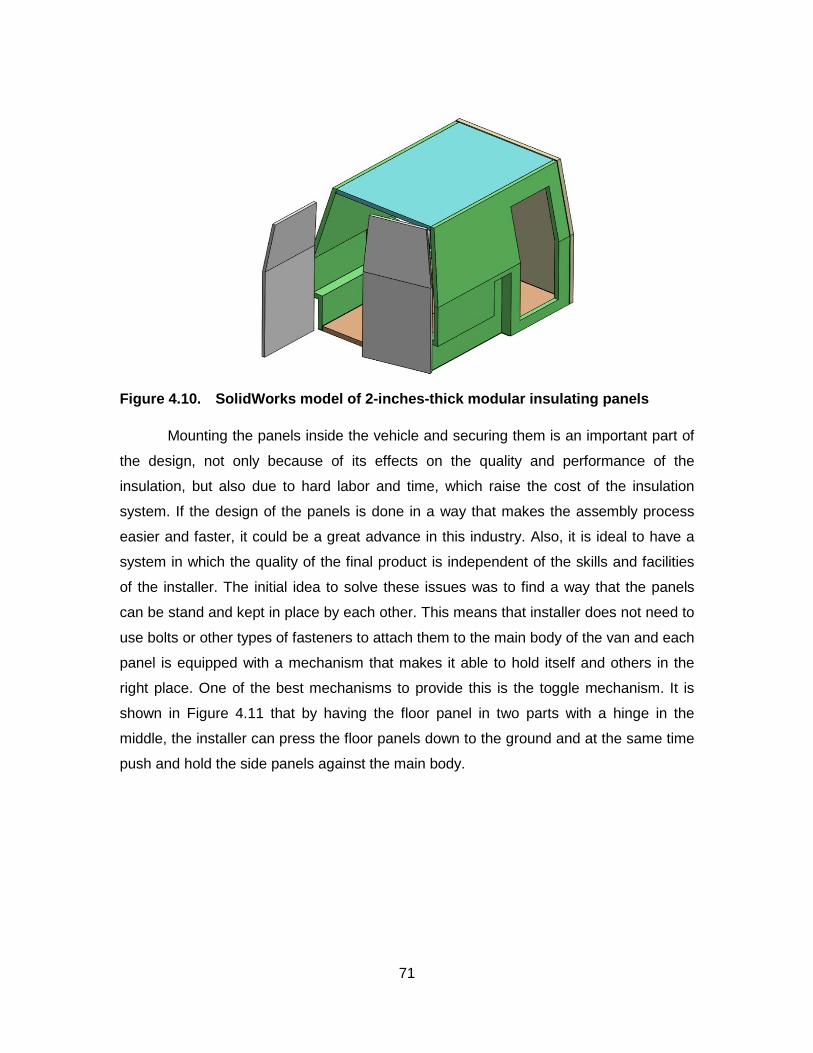
Figure 4.10. SolidWorks model of 2-inches-thick modular insulating panels
Mounting the panels inside the vehicle and securing them is an important part of
the design, not only because of its effects on the quality and performance of the
insulation, but also due to hard labor and time, which raise the cost of the insulation
system. If the design of the panels is done in a way that makes the assembly process
easier and faster, it could be a great advance in this industry. Also, it is ideal to have a
system in which the quality of the final product is independent of the skills and facilities
of the installer. The initial idea to solve these issues was to find a way that the panels
can be stand and kept in place by each other. This means that installer does not need to
use bolts or other types of fasteners to attach them to the main body of the van and each
panel is equipped with a mechanism that makes it able to hold itself and others in the
right place. One of the best mechanisms to provide this is the toggle mechanism. It is
shown in Figure 4.11 that by having the floor panel in two parts with a hinge in the
middle, the installer can press the floor panels down to the ground and at the same time
push and hold the side panels against the main body.
71
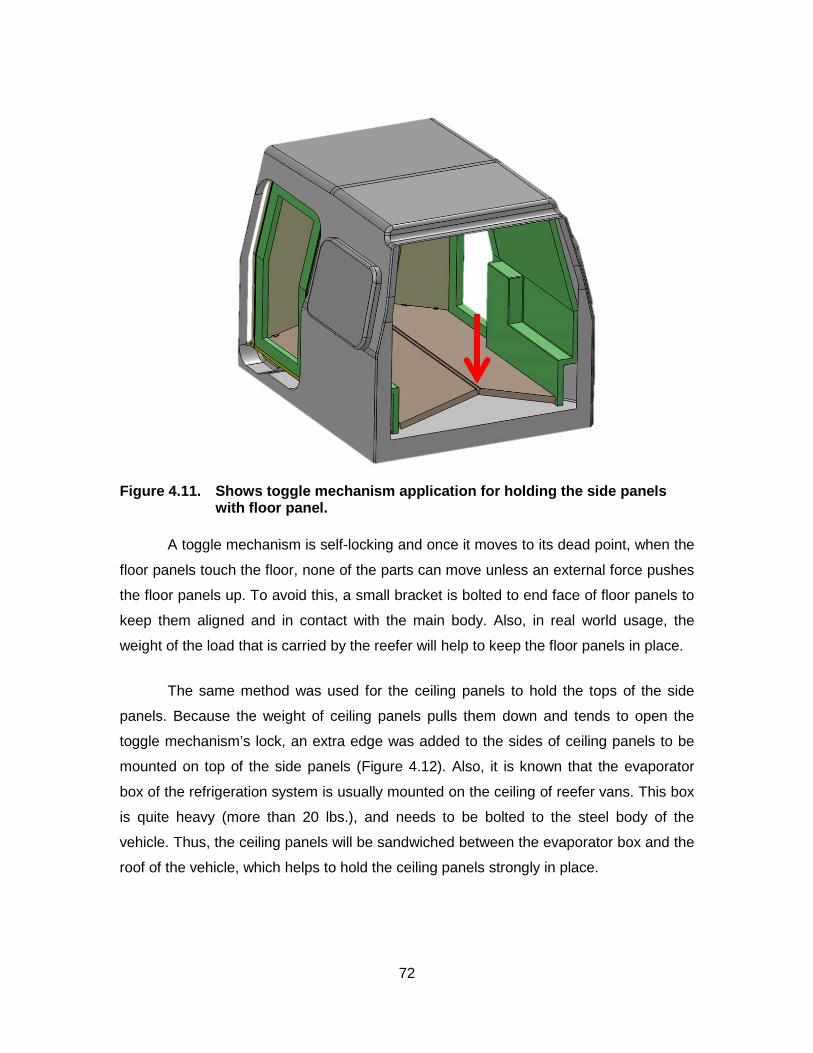
Figure 4.11. Shows toggle mechanism application for holding the side panels with floor panel.
A toggle mechanism is self-locking and once it moves to its dead point, when the
floor panels touch the floor, none of the parts can move unless an external force pushes
the floor panels up. To avoid this, a small bracket is bolted to end face of floor panels to
keep them aligned and in contact with the main body. Also, in real world usage, the
weight of the load that is carried by the reefer will help to keep the floor panels in place.
The same method was used for the ceiling panels to hold the tops of the side
panels. Because the weight of ceiling panels pulls them down and tends to open the
toggle mechanism’s lock, an extra edge was added to the sides of ceiling panels to be
mounted on top of the side panels (Figure 4.12). Also, it is known that the evaporator
box of the refrigeration system is usually mounted on the ceiling of reefer vans. This box
is quite heavy (more than 20 lbs.), and needs to be bolted to the steel body of the
vehicle. Thus, the ceiling panels will be sandwiched between the evaporator box and the
roof of the vehicle, which helps to hold the ceiling panels strongly in place.
72

Figure 4.12. Toggle mechanism for the ceiling panels and the extra edge to keep them on top of the side panels.
Apart from holding the side panels by the pressure of floor and ceiling panels,
adding some extra joints between the side panels and body of the vehicle would help
with the rigidity of the system and make it less likely to be disturbed by vibration when
the reefer is driving on the road. Thus, a few small hooks that can attach to holes in the
van body are added to the top of the side panels. Consequently, the side panels have to
be placed inside the van before assembling the floor and ceiling panels. Figure 4.13
shows the engagement of the small hooks in the holes in the walls. For a better joint
between the panels, extra nubs and matched holes can also be made at the side of
panels, so that during assembly these nubs and holes are engaged with each other and
hold the panels firmly in place.
73

Figure 4.13. Attachment of side panels to the wall by means of small hooks
To hold the front panel in its place and attach it to the others, latch clamps are
useful because they are strong and capable of creating large tension forces to draw the
edges toward each other. Also, they are very quick and easy to latch, so the installer
would be able to fasten them in a few seconds. Figure 4.14 shows the application of
these clamps for holding the front panel. These clamps need to be pre-installed on the
panels at the time of manufacturing, so the installer only needs to latch them after
assembling the panels inside the reefer.
74

Figure 4.14. Use of toggle clamps to attach and hold the front panels to the side panels.
In summary, the entire assembly process that was discussed in this section is
shown in Figure 4.15. Two small insulation panels are designed for the rear doors with
the same shape to be mounted on them and will be installed at the beginning or end of
the assembly process. A U-shape frame is also shown in the figure, which was created
to hold the bottom side of the front panel. This frame is mounted on the floor of the van
before assembling the other panels and can be attached to the floor or just clamped to
the side panels later. Because of its L-Shape cross section, the frame can support the
edge of the front panel and prevent it from getting separated from the floor and side
panels. Thus, the front panel is installed after the frame and mounted on top of it. The
next step is to bring the side panels inside the van and properly locate them. Floor
panels that are attached to each other by hinges along the middle are assembled
between the side panels and used as a toggle mechanism to push the side panels
against the walls. Finally, the ceiling panels, which are also coupled together with
hinges, would be taken inside the vehicle and placed on top of side panels. The ceiling
panels also work with a toggle mechanism and push against the side panels. A small
bracket will be used to keep the ceiling panels in position, not letting them to bend and
fall. Finally, the toggle clamps that are attached to the front panel will be engaged to fix
all the panels together. The whole process of assembling the insulating panels should
75

not take more than one hour, which is much less than the usual time to insulate a reefer
van.
Figure 4.15. Modular insulation panel installation process
4.5. Full Scale Prototype
To examine the feasibility of the different design ideas that have been discussed
in this chapter and provide a proof of concept for easy installation of modular insulating
panels, it was decided at this stage of project to build a full scale prototype for the
targeted vehicle. Considering the available budget and time, there were not many
options for the material and production method of the panels. Since manufacturing web-
core sandwich panels requires molding of plastic, it is outside of the scope of this
project. Also, super insulating materials, such as aerogel blanket, were too expensive at
this stage to be used for the complete set of full scale prototype panels. Therefore, foam-
core insulation panels were made for the first prototype.
76

In addition, if the insulating material was applied to the sandwich panels from
beginning, the possibility of modifying of them was limited, which is not comfortable for
the first prototype. Thus, it was better to make the panels independent of the insulating
material and try their size, shape, modularity, and assembling capability first, and then
insulate them thermally for use in the real reefer. The best candidate to cope with all
these limitations is wood because it is an inexpensive material that is easy to work with
and very flexible and able to compensate for possible unexpected issues. Also, wooden
panels can be designed to be quite strong and so can tolerate the structural
requirements of the system even without filling them with insulating foam. Furthermore,
thermal conductivity of the wood is quite low (0.05-0.1 W/(m∙K)), which makes it an
insulating material; thus later on when the wooden panels are insulated and used as
insulating panels inside the reefer van, there will be very little thermal bridging.
To build the wooden full scale panels, it was necessary to redesign the original 3-
D model of the modular panels. Considering the 2 inch thickness of the panels, 2”x2”
lumber was choose for structural parts and 3/8” thick plywood for the facing of the
panels. Figure 4.16 shows a view of modeled wooden side panel in SolidWorks.
77

Figure 4.16. View of a modeled wooden side panel in SolidWorks
In the next step, all the necessary material to build the panels was purchased
based on the prepared bill of material and in 2 days the manufacturing process was
finished. Figure 4.17 shows a picture of a finished wooden side panel.
78
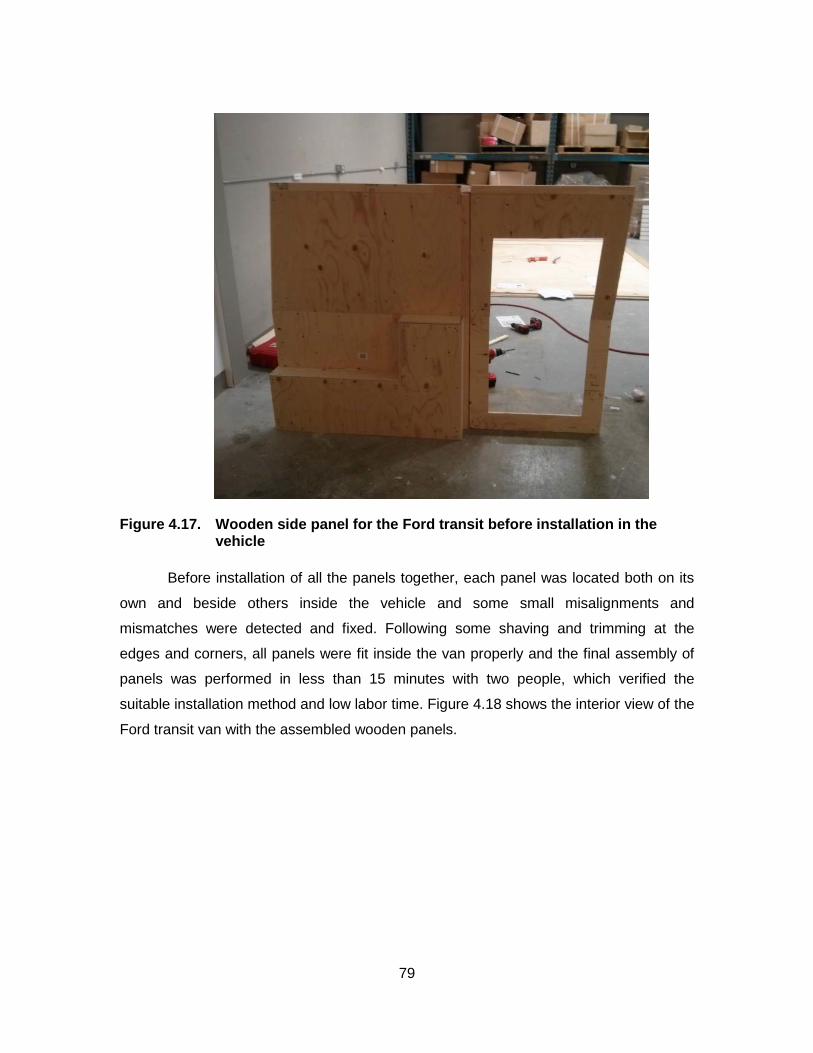
Figure 4.17. Wooden side panel for the Ford transit before installation in the vehicle
Before installation of all the panels together, each panel was located both on its
own and beside others inside the vehicle and some small misalignments and
mismatches were detected and fixed. Following some shaving and trimming at the
edges and corners, all panels were fit inside the van properly and the final assembly of
panels was performed in less than 15 minutes with two people, which verified the
suitable installation method and low labor time. Figure 4.18 shows the interior view of the
Ford transit van with the assembled wooden panels.
79

Figure 4.18. Final assembly of wooden panels inside the Ford transit van
4.6. Finalizing the Panels and Reefer Installation
To see the performance of the insulation panels in real conditions and investigate
possible issues when they are installed in a reefer truck, it was decided to add insulating
material to the panels and prepare them for final installation in the Ford Transit reefer.
After considering the available insulating materials, the best choices was closed-cell PU
foam. Closed-cell PIR is available in the market but comes in rigid boards with certain
thickness that did not match with size of the panels. Also, inexpensive glass wool bat
and EPS board are common in the industry for reefer insulation, but their insulating
80
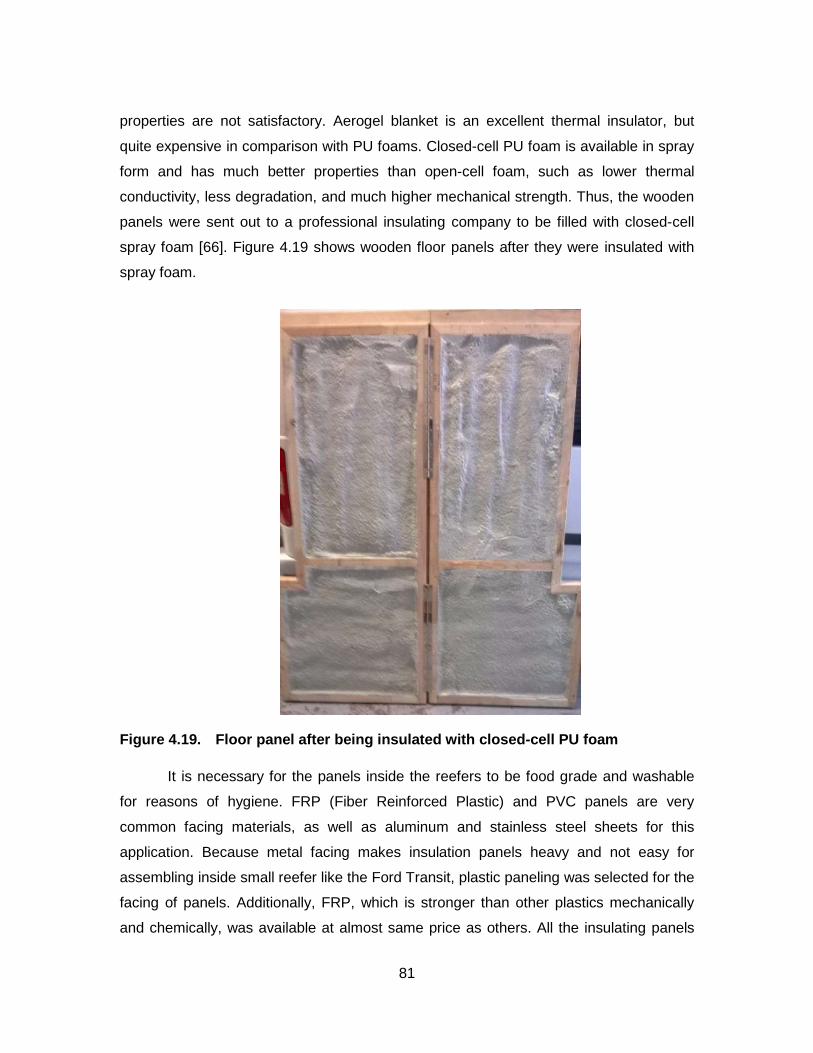
properties are not satisfactory. Aerogel blanket is an excellent thermal insulator, but
quite expensive in comparison with PU foams. Closed-cell PU foam is available in spray
form and has much better properties than open-cell foam, such as lower thermal
conductivity, less degradation, and much higher mechanical strength. Thus, the wooden
panels were sent out to a professional insulating company to be filled with closed-cell
spray foam [66]. Figure 4.19 shows wooden floor panels after they were insulated with
spray foam.
Figure 4.19. Floor panel after being insulated with closed-cell PU foam
It is necessary for the panels inside the reefers to be food grade and washable
for reasons of hygiene. FRP (Fiber Reinforced Plastic) and PVC panels are very
common facing materials, as well as aluminum and stainless steel sheets for this
application. Because metal facing makes insulation panels heavy and not easy for
assembling inside small reefer like the Ford Transit, plastic paneling was selected for the
facing of panels. Additionally, FRP, which is stronger than other plastics mechanically
and chemically, was available at almost same price as others. All the insulating panels
81

were covered with FRP facing on both sides. To protect the edges on the door opening
and the surface of the floor panel from possible damage during loading and unloading of
goods, aluminum angles and strips were glued and screwed shallowly on the panels.
Figure 4.20 shows the interior view of the van after assembling the insulating panels
covered with FRP facing.
Finally, an electric refrigeration system that is designed for mobile refrigeration
applications [67] was installed by COOL-IT, the industrial partner for this project. As is
shown in Figure 4.20 and Figure 4.21 the evaporator module was attached inside on the
ceiling panels and condenser module, which includes the compressor, was installed
outside on the roof. This refrigeration system runs on DC 12 volts and has a maximum
cooling capacity of 1530 W, which is powered by the battery and alternator of the
vehicle.
Figure 4.20. Rear view of assembled insulating panels covered with FRP facing
82

Figure 4.21. Side view of the insulated van after installation of the electric refrigeration system
83

Chapter 5. Conclusions and Future Works
A new modular insulating panel design for reefer vans was proposed, designed,
and tested. Experimental and analytical studies were performed in order to design and
build a full scale prototype of insulating panels for Ford transit connect with the industrial
partner of project, Cool-It Hi-Way Services Ltd. As explained in Chapter 1, the traditional
methods of applying insulation on the reefer vans suffer from a number of drawbacks
including time consumption, high labour cost, low quality, big thermal bridges, and quick
aging.
In the new design, insulating panels are prefabricated in the factory, which
improves the quality of the product and reduces the installation time from a few days to
less than an hour. The labour cost is reduced as well. The concept of composite
sandwich panels was used in the new design to increase the strength of the panels
besides protecting the core material from negative environmental effects. In addition,
modularity of panels makes the installation process much easier in comparison with
spraying foam inside the vehicle and enables the user to replace the damaged pieces
quickly.
The proposed optimization algorithm in Chapter 3 can be generally used for
selecting the insulating material and its thickness for any type of reefer van based on the
energy cost and ambient conditions. Furthermore, it was shown that to use super
insulating materials such as aerogel blanket, a web-core sandwich structure is
necessary to protect the soft core against mechanical loads. The minimum possible
thickness of these panel is also calculated considering the thermal bridges of the web
structure and the required thermal and mechanical resistance.
To validate the structural performance of present modular design, the interior
geometry of the targeted vehicle was 3-D scanned and modeled in SolidWorks, which
was used to draft the wooden prototype of insulating panels. The finalized insulated
84

panels were installed inside the reefer van and its structural performance was examined
in road conditions.
Future Works
The following directions can be considered as the continuation of this project:
1. The proposed insulation method in this work can be applied to a variety of
commercial vans in different sizes. However, since the geometry, size, and
application of them are different; more work is required to find the best design for
each case and match the proposed techniques for installation.
2. The presented method to build the insulation panel prototype is suitable for
production of initial samples and does not guarantee the high quality and
profitability of the product. To achieve better results, mass production methods
for manufacturing sandwiched insulated panels has to be considered. This
includes thermoforming or molding the exterior layers of the panels from proper
plastic materials or cutting the desired geometry from prefabricated sandwich
sheets.
3. Although, many research projects have been carried out on the insulating
materials for refrigeration application, proper characterization of them under
various humidity and temperature conditions is still not well understood. The
characterization of thermal resistance decay during temperature and humidity
cycling would be another remarkable contribution to this industry.
85
References
[1] Tassou, S.A., De-Lille, G., Ge, Y.T., “Food transport refrigeration – Approaches to reduce energy consumption and environmental impacts of road transport,” Applied Thermal Engineering, Vol. 29, pp. 1467–1477 (2009).
[2] Gac, A., “Refrigerated transport: what’s new?,” International Journal of Refrigeration, Vol. 25, pp. 501–503 (2002).
[3] Available at: http://www.epa.gov/ttn/atw/natamain/gloss1.html [4] Argonne National Laboratory. “Analysis of technology options to reduce the fuel consumption
of idling trucks,” U.S. DOE( June 2000). [5] According to the International Energy Agency (“IEA”) report available at:
http://www.worldenergyoutlook.org/weo2012/ [6] ATP agreement, available at: http://www.unece.org/trans/main/wp11/atp.html. [7] Chatzidakis, S.K., Chatzidakis, K.S., “Refrigerated Transport and Environment”, International
journal of Energy Research (2003). [8] Macchi-Tejeda, H., Opatova, H., Guilpart, J., “Contribution to the gas chromatographic
analysis for both refrigerants composition and cell gas in insulating foams – Part II: Aging of insulating foams”, International Journal of Refrigeration, Vol. 30, pp. 338–344 (2007).
[9] Mukhopadhyaya, P., Bomberg, M.T., Kumaran, M.K., Drouin, M., Lackey, J.C., Van Reenen, D., Normandin, N., “Long-term thermal resistance of polyisocyanurate foam insulation with impermeable facers”, NRC Publication Archive (2002).
[10] Bomberg, M.T., Kumaran, M.K., “Use of Field-Applied Polyurethane Foams in Buildings”, Construction Technology Update no. 32 (Dec. 1999).
[11] Available at http://kingtecusa.com/wp-content/uploads/2012/08/typical-spray-foam-application.jpg
[12] Mukhopadhyaya, P., Kumaran, M.K., “Long-Term Thermal Resistance of Closed-Cell Foam Insulation”, 3rd Global Insulation Conference and Exhibition, Barcelona, 16-17 October 2008
[13] Murphy, J., ”Long Term Aging of Closed-Celled Foam Insulation”, Foam Supplies, Inc.,12th International Conference on Blowing Agents and Foaming Processes, pp. 313-326 (May 2010).
[14] Berge, A., Johansson, P., “Literature Review of High Performance Thermal Insulation”, Report in Building Physics, CHALMERS UNIVERSITY OF TECHNOLOGY, Gothenburg, Sweden (2012), Open access to public available at : http://publications.lib.chalmers.se/publication/159807-literature-review-of-high-performance-thermal-insulation
[15] Simmler, H., Brunner, S., Heinemann, U., Schwab, H., Kumaran, K., Mukhopadhyaya, P., Quénard, D., Sallée, H., Noller, K., Kücükpinar- Niarchos, E., Stramm, C., Tenpierik, M.J., Cauberg, J.J.M., Erb, M. “Vacuum Insulation Panels. Study on VIP-components and Panels for Service Life Prediction of VIP in Building Applications”, (Subtask A): IEA/ECBCS Annex 39 High Performance Thermal Insulation (2005), available at: https://www.energie-cluster.ch/admin/data/files/file/file/1042/annex39_report_subtask-a.pdf?lm=1452871097
[16] “Mechanical Insulation Design Guide - Materials and Systems”, by the National Mechanical Insulation Committee (NMIC), Last updated: 10-03-2013, available at: https://www.wbdg.org/design/midg_materials.php
[17] Turner, W.C., Malloy, J.F., “Thermal Insulation Handbook”, R.E. Krieger, (1981).
86

[18] “Testing and Application of New Phenomenological Material Model for Foam Materials”, Last updated: 11-01-2010, available at: http://www.posterus.sk/?p=3923
[19] Li, C.D., Chen, Z.F., Saeed, M.U., “Characterization of hybrid glass wool suspensions and optimization of microstructure and tensile strength of the associated wet-laid mats by various blendings and numbers of beating revolutions”, Materials and Structures, Vol.49, Issue 5, pp 1861-1869 (2016).
[20] Vaitkus, S., Laukaitis, A., Gnipas, I., Keršulis, V., Vejelis, S., “Experimental Analysis of Structure and Deformation Mechanisms of Expanded Polystyrene (EPS) Slabs”, ISSN 1392–1320 Materials Science (MEDZIAGOTYRA). Vol. 12, No. 4. (2006), available online at: http://citeseerx.ist.psu.edu/viewdoc/download?doi=10.1.1.543.9083&rep=rep1&type=pdf
[21] Jelle, B.P., “Traditional, state-of-the-art and future thermal building insulation materials and solutions – Properties, requirements and possibilities”, Journal of Energy and Buildings 43 2549–2563 (2011).
[22] BASF, Neopor Wall Insulation, Ludwigshafen, Germany: BASF SE (2011). [23] Dournel, P., Zipfel, L., “Analysis of the Evolution of PIR Foams in the Context of the phaseout
of HCFCs”, In: Polyurethanes Expo , pp. 325–332 (2001). [24] Bomberg, M.T., Kumaran, M.K., “Laboratory and roofing exposures of cellular plastic
insulation to verify a model of aging”, 3rd Symposium on Roofing Research and Standards Development, ASTM STP 1224, ASTM, Philadelphia, pp. 151-167(1994).
[25] “Ceramic Paint Additive Makes any Paint Insulate”, 20-06-2015, available at: http://hytechsales.com/insulating_paint_additives.html
[26] Rohatgi, P.K., Gupta, N., Schultz, B.F., Luong, D.D., “The Synthesis, Compressive Properties, and Applications of Metal Matrix Syntactic Foams”, JOM Vol. 63, No.2 pp. 36-42, (January 2011).
[27] “Home Insulation With the Stroke of a Brush”, Last updated: 30-07-2015, available at: http://spinoff.nasa.gov/spinoff2003/er_4.html
[28] “The Simple and Affordable Way to Improve Efficiency”, 20-06-2015 available at: http://www.insuladd.com/product-info/see-it-work/
[29] “Truck Body’s Lightweight Panel”, 20-06-2015, available at: http://www.design-composite.com/index.php/en/produkte/truck-bodies
[30] SANDWICH PANEL – COMPOCEL VP, 20-06-2015, available at: http://www.cel.eu/index.php?IDcod=78&lang=tr#prettyPhoto
[31] Kistler, S.S., “Coherent expanded aerogels and jellies”, Nature, 127, p.741(1931a). [32] Kistler, S.S., “Coherent expanded Aerogels”, Journal of Physical Chemistry, 36(1), pp.52-64
(1931b). [33] Xu, J., “Is it possible to create a lighter-than-air aerogel?”, 07-09-2014, available
at: https://www.quora.com/Is-it-possible-to-create-a-lighter-than-air-aerogel [34] “Aerogel Above the Flame”, 01-03-2012, available at: www.aerogel.org [35] Rubin, M., Lampert, C.M., “Transparent silica aerogels for window Insulation”, Solar Energy
Materials, 7(4), pp.393–400 (1983). [36] Stepanian, C., Gould, G., Begag, R., “Aerogel composite with fibrous batting”, Pat. No. US
7,504,346 (2006). [37] “Aspen Aerogels Case Studies ”, 2013, available at:
http://www.aerogel.com/resources/case-studies/ [38] Ruben, Bjørn, P.J., Gustavsen, A., “Aerogel insulation for building applications: A state-of-
the-art review”, Journal of Energy and Buildings 43, pp761–769 (2011). [39] Wong, C., Hung, M., “Polystyrene Foams as Core Materials Used in Vacuum Insulation
Panels”, Journal of Cellular Plastics, Vol. 44, pp. 239–259 (2008) [40] Binz, A., Moosmann, A., Steinke, G., Schonhardt, U., Fregnan, F., Simmler, H., Brunner, S.,
Ghazi, K., Bundi, R., Heinemann, U., Schwab, H., Cauberg, J. J. M., Tenpierik, M. J., Jóhannesson, G. A., Thorsell, T. I., Erb, M., and Nussbaumer, B., “Vacuum Insulation in the Building Sector. Systems and Applications”, (Subtask B): IEA/ECBCS Annex 39 (2005).
[41] Schwab, H., Stark, C., Wachtel, J., Ebert, Fricke, J., “Thermal Bridges in Vacuum-insulated Building Façades”, Journal of Thermal Envelope & Building Science, 28(4), 345-355 (2005).
87
[42] Russo, A., Zuccarello, B., “Experimental and numerical evaluation of the mechanical behaviour of GFRP sandwich panels”, Composite Structures 81 575–586 (2007).
[43] Vinson, J.R., “The behaviour of sandwich structures of isotropic and composite materials”, Westport: Technomic, CRC Press (1999).
[44] Torre, L., Kenny, J.M., “Impact testing and simulation of composite sandwich structures for civil transportation”, Compos Structure, Vol. 50, pp. 257–267 (2000).
[45] Kalaprasad, G., Pradeep, P., George, M., Pavithran, C., Sabu, T., “Thermal conductivity and thermal diffusivity analyses of low-density polyethylene composites reinforced with sisal, glass and intimately mixed sisal/glass fibres”, Compos Sci Technol, Vol. 60, pp.2967–2977 (2000).
[46] Chidom, C.C., “Lightweight Sandwich Panels in Cold Stores and Refrigerated Warehouses”, Bachelor’s thesis, HAMK University of Applied Science (2013), open access to public available at: https://www.theseus.fi/handle/10024/69446?show=full
[47] Narayan, P., “Behaviour and Design of Sandwich panels subjected to local buckling and wrinkling effect”, PhD Thesis, Queensland University of technology, pp. 1-5 (2003)
[48] Available at: http://hypersizer.com/industry/projects/NASA-Ares-V-Interstage.php [49] Crowley, J., Morse-Fortier, L., Dentz, J., Parent, M., Gibson, L.J., Tonyan, T., Glicksman, L.,
“Innovative materials and construction systems for energy efficient building envelopes”, Thermal Performance of the Exterior Envelopes of Buildings Conference”, Vol. 12, pp. 105–113, (1995).
[50] Casey, R., Briscoe, “Design of Lightweight Web Core Sandwich Panels and Application to Residential Roofs”, PhD thesis, University of Minnesota (2010).
[51] ASHRAE Handbook-Fundamentals, 2009, available at: http://www.ashrae.org/resources--publications/Description-of-the-2009-ASHRAE-Handbook-Fundamentals
[52] Sofrata, H., Salmeen, B., “Optimization of insulation thickness using micros”, Energy Conversion, Vol. 34, pp.471–479 (1993).
[53] Arora, J.S., “Introduction to Optimum Design”, 2nd Edition, Elsevier Academic Press, 2004, ISBN: 0-12-064155-0
[54] Wang, H., Fu, L. , Zhou, Y., Li., H., “Modelling of the fuel consumption for passenger cars regarding driving characteristics”, Transp. Res. Part D: Transp. Environ. Vol. 13, pp. 479–482 (2008).
[55] MATLAB and Optimization Toolbox Release 2012a, The MathWorks, Inc., Natick, Massachusetts, United States.
[56] MATLAB 2012a Help, Optimization Toolbox [57] AWWA C900 standard for PVC products available at:
http://www.awwa.org/store/productdetail.aspx?productId=6899 [58] Corriveau, G., Guilbault, R., Tahan, A., “Genetic algorithms and finite element coupling for
mechanical optimization”, Advances in Engineering Software Vol. 41, pp. 422–426 (2010). [59] Gauchía, A., Boada, B.L., Boada, M.J.L., Díaz, V., “Integration of MATLAB and ANSYS for
Advanced Analysis of Vehicle Structures” , MATLAB Applications for the Practical Engineer, Mr Kelly Bennett (Ed.), ISBN: 978-953-51-1719-3, InTech, DOI: 10.5772/57390 (2014).
[60] ANSYS® Mechanical APDL, Academic Research, Release 14.5, [Online] available at: http://www.ansys.com/Products.
[61] Available at: http://www.builditsolarblog.com/2014/07/small-simple-efficient-ram-promaster.html
[62] “French Cleat Screen Hanging Assembly”, 28-08-2009, available at: http://www.avsforum.com/forum/110-diy-screen-section/1163059-attaching-french-cleat-3-4-mdf.html
[63] “How toggle Action Work”, 20-06-2015, available at: http://www.mjvail.com/destaco/intropage3.html
[64] CREAFORM 3-D scanner training script, November 2010, available at: www.creaform3d.com
88

[65] SolidWorks 2013, x64 Edition. Available at: http://www.solidworks.com/sw/education/education-software-mcad.htm
[66] Quik Shield 112 2 lb Spray Foam Insulation, August 2013 Spec. available at: http://swdurethane.com/wp-content/uploads/SWD-Canada-Foamed-in-Place-Insulation-2013-10-10-Final.pdf
[67] Battery powered refrigeration units for cargo van, 15-02-2015, Spec. available at: http://corunclima.en.alibaba.com/product/60341176661-801648850/Battery_powered_refrigeration_units_for_cargo_van.html
89

Appendix A. MATLAB Codes for Optimization
Below the MATLAB and ANSYS codes which were used in this project are
provided.
Insulation Thickness Optimization Codes:
Cost Function: function f = cost(t) Ti=0;%Inside temperature To=30;%Outside temperature k=[0.15,0.035,0.04,0.022,0.022,0.028,0.3]; %[pvc sheet; EPS;PP honeycomb;Closed-cell PIR;Closed-cell PU;Open-cell PU; FRP sheet] R=t(1)/k(1)+t(2)/k(2)+t(3)/k(3)+t(4)/k(4)+t(5)/k(5)+t(6)/k(6)+t(7)/k(7)%Total thermal resistance Q=(To-Ti)/R; d=[10;10;10;5;5;3;10];%Degradation time(years) Lt=10;%Life time Fc=4e-5;%Energy cost $/Kj c=[1000;160;500;180;200;90;5000];%cost/1m of thickness Fuelcost=Q/1000*Fc*Lt*100*8*3600 Panelcost=Lt*(t(1)*c(1)/d(1)+ t(2)*c(2)/d(2)+t(3)*c(3)/d(3)+t(4)*c(4)/d(4)+t(5)*c(5)/d(5)+t(6)*c(6)/d(6)+t(7)*c(7)/d(7)) f=Fuelcost+Panelcost Run: t0=[0.002;0.010;0.010;0.010;0.010;0.010;0.003];%thickness of each layer (mm) A=[]; b= []; [t,fval,exitflag,output]= fmincon(@cost,t0,A,b,[],[],[],[],@mycon) Constriction: function [c, ceq] = mycon(t) c(1) = t(1)+t(2)+t(3)+t(4)+t(5)+t(6)+t(7)-0.055; c(2) = -t(1)+0.001; c(3) = -t(7)+0.002; c(4) = -t(2); c(5) = -t(3); c(6) = -t(4); c(7) = -t(5); c(8) = -t(6); ceq = [ ];
90

Web-Core Panel Optimization Codes:
Fitness function:
function f = fitnessfunction(p) f=p(1);
Optimpanel:
LB = [0.02 0.0015 0.0015 0.0015 1 1]; % Lower bound UB = [0.055 0.006 0.006 0.006 5 3]; % Upper bound ObjectiveFunction = @fitnessfunction; nvars = 6; % Number of variables options=gaoptimset('PopulationSize',100,'TolFun',1e-3,'TolCon',1e-3,'Generations',10,'Display','iter','MutationFcn', {@mutationuniform, 0.05}); [x_ga,fval_ga,exitflag_ga,output_ga]=ga(ObjectiveFunction,nvars,[],[],[],[],LB,UB,@constraint,options);
Constraint:
function [c, ceq] = constraint(p) c(1) = p(1)+p(2)-0.055; R1=p(1)/0.015/(1*0.5); R2=p(1)/(0.15*p(3)*2*(1+0.5)); R3=p(1)/(0.15*p(4)*(p(5)*0.5+p(6)*1)); R4=p(2)/(0.15*1*0.5); Rtot=R4+1/(1/R1+1/R2+1/R3); u=1/(Rtot*(1*0.5)); c(2) = u-0.5; c(3)=0.4-u; p(5)=round(p(5)); p(6)=round(p(6)); fid=fopen('parameters.txt','w'); fprintf(fid,'%12.8f\r\n',p(1)); %height fprintf(fid,'%12.8f\r\n',p(2));%Tp fprintf(fid,'%12.8f\r\n',p(3));%Ts fprintf(fid,'%12.8f\r\n',p(4));%Tr fprintf(fid,'%12.8f\r\n',p(5));%Nl fprintf(fid,'%12.8f\r\n',p(6));%Nw fclose(fid); !"C:\Program Files\ANSYS Inc\v145\ansys\bin\winx64\ansys145.exe" -b -i "C:\Users\alabbani\Desktop\Masoud\Optimization course\Project 2\Ansys files\reinforcingpanel.txt" -o "C:\Users\alabbani\Desktop\Masoud\Optimization course\Project 2\Ansys files\output.txt" fid=fopen('stress.txt','r'); s1=fscanf(fid,'%s',inf); fclose(fid); s=str2num(s1); c(4) = s-2.5e6;
91

ceq = [ ]; ANSYS script, Reinforcingpanel: /PREP7 *SET,l,1 *SET,w,.5 *SET,e,2e9 *SET,nu,.4 *DIM,p,,6,1 *VREAD,p(1),parameters,txt,,ijk,6,1 (1f7.6) *SET,h,p(1,1) *SET,tp,p(2,1) *SET,ts,p(3,1) *SET,tr,p(4,1) *SET,nl,p(5,1) *SET,nw,p(6,1) ET,1,SHELL181 MPTEMP,,,,,,,, MPTEMP,1,0 MPDATA,EX,1,,e MPDATA,PRXY,1,,nu sect,1,shell,, secdata, tp,1,0.0,3 sect,2,shell,, secdata, ts,1,0.0,3 sect,3,shell,, secdata, tr,1,0.0,3 RECTNG,-w/2,w/2,-l/2,l/2, K, ,0,0,0, K, ,0,0,h, LSTR,5,6 ADRAG,1,2,3,4, , ,5 AGEN,nl+1,2, , , ,l/(nl+1), , , AGEN,nw+1,3, , ,-w/(nw+1), , , , APTN,ALL LESIZE,ALL,0.01, , , ,1, , ,1, ASEL,S,LOC,Z,0,0 SECNUM,1 AMESH,ALL ASEL,S,LOC,X,-w/2 ASEL,A,LOC,X,w/2 ASEL,A,LOC,Y,-l/2 ASEL,A,LOC,Y,l/2 SECNUM,2 AMESH,ALL ASEL,A,LOC,Z,0,0 ASEL,INVE SECNUM,3 AMESH,ALL
92

LSEL,S,LOC,Z,h DL,ALL, ,UZ, NSEL,S,LOC,Z,0 NSEL,R,LOC,X,-.005,.005 NSEL,R,LOC,Y,-.005,.005 D,ALL, , , , , ,ALL, , , , , ASEL,S,LOC,Z,0 SFA,ALL,1,PRES,1500 ALLSEL,ALL /SOL SOLVE /POST1 !ETABLE,deflection,U,Z !esort,etab,deflection !*get,def_max,sort,,max !*CFOPEN,displacement,txt !*VWRITE,def_max !(1F8.6) ETABLE,stress,S,EQV esort,etab,stress *get,st_max,sort,,max *CFOPEN,stress,txt *VWRITE,st_max (F20.3)
93

Appendix B. Air Infiltration Study
The focus of this thesis is the insulation of the reefer van to prevent the heating
load getting into the van by conduction heat transfer. However, during loading and more
important than that unloading the reefer trucks at the time of delivery, a lot of door
opening happen which leads to infiltration of air in the refrigerated compartment. This
infiltration would bring moisture and warm air inside that works as the extra heat load on
the refrigeration system [1]. More than half of the total heat load on the refrigeration unit
and the main cause of the frost formation on the evaporators can be considered as air
filtration [2].
The aim of this study was to develop a proper model to measure the air
infiltration in a reefer van that provides a deeper understanding of the problem as well as
being used later for the application of heat load calculation and design of air barriers
such as air curtain. The basic theory for natural convection of fluids at different densities
through openings was expressed more than 70 years ago [3]. Due to the weakness of
present analytical models the CFD model was used to predict the effect of warm spillage
from the cold box to the surroundings. To examine the effectiveness of proposed CFD
model, an experimental setup was designed based on the scaled down prototype of a
Ford Transit Connect reefer to validate the results of the computational model.
Model Development
Although CFD is generally a three dimensional modelling tool, preliminary work
had shown that creating a 3D model to encompass a cold store and its surroundings
while still having a small enough mesh to accurately predict the air exchange at the
opening required a prohibitively large amount of computer resources.
Therefore, a 2D model was created using Fluent, a general purpose CFD code
as shown in Figure B. 5.1. The domain of the model contained the volume inside the
chamber (initially at 64°C) and a much larger volume outside the chamber (initially at
25°C), to provide a source of cool air for exchange. The volume outside the chamber
94

was two times larger than the volume inside the chamber to give a good compromise
between accuracy and numerical speed. All of the boundaries were adiabatic walls. The
numerical mesh was at its finest (2 mm) at the entrance of the door. This was in order to
accurately resolve the large shear created by the air during the infiltration. The total
number of grid nodes for the problem was 23,000.
Infiltration was calculated for 30 seconds door opening durations from the
predicted average temperature inside the cold store.
Figure B. 5.1. Schematic of a scaled down prototype of a Ford transit connect with overall dimensions
Experimental Setup
Experimental study was carried out on a prototype chamber which is a one-fifth
scale model of the Ford Transit with internal dimensions of 0.225m×0.39m×0.23m
(Figure B. 5.2). This prototype is built by 3-D printing the scaled model of the vehicle
image. More details about the modeling and manufacturing of this chamber is discussed
in section 4.3. The chamber had an entrance with dimensions 0.23m wide and 0.225m
height which was closed off by a push-in door. The thickness of walls (panels) is 25 mm
95

which is filled with glass wool insulation material. In addition, the chamber was hanged
from fishing strings to minimize the heat transfer with environment.
Figure B. 5.2. Experimental setup of the infiltrated chamber
A small heater-fan with maximum 500 watt output power with a variable output
auto-transformer used to warm the air inside the chamber (Figure B. 5.3.). To have
uniform temperature distribution before door-opening, two small fans were located
besides the heater. At the moment the temperature inside the chamber got to desired
point, heater and fans were turn off and the door opened to start the infiltration.
T-type thermocouples were placed inside the chambers in eight locations to
measure the temperature distribution and the data was recorded by National Instrument
DAQ system using Lab View software.
96

Figure B. 5.3. Experimental setup view shows the position of instruments
Results and Discussion
Figure B. 5.4 shows the temperature distribution inside and outside of the
chamber at 0.6s after opening the door. As is predicted by stack effect or natural
convection between the warm chamber and cool environment, the warm air goes out
from the top corner and cool air refills the chamber from bottom corner.
97

Figure B. 5.4. Temperature distribution inside and outside of the chamber 0.6 s after opening the door.
To validate the results of CFD analysis, an experiment was performed in similar
condition to measure the temperature change inside the chamber during the first 30
seconds after opening the door. The results for the average temperature inside the
chamber, from both the experiment and numerical analysis, are shown in Figure B. 5.5.
Although the both curves follow the same trend and the temperature after 30 s is
the same, there is a big gap between the results at the beginning of the test. There are
two reasons for this difference. The first reason is that, in reality, it takes about 5
seconds to remove the door panels from the chamber and during these few seconds, the
heat and mass transfer through the opening is reduced. However, in the CFD model,
infiltration of air starts suddenly at the beginning of the analysis and decreases the
temperature dramatically and quickly. The second reason could be the thermal inertia of
the panels and walls inside the experimental setup, which is not considered in the CFD
98

model. This inertia releases the heat energy that has been stored in the panels and
during infiltration of air slows the temperature reduction inside the chamber.
Figure B. 5.5. Average temperature inside the chamber for both the experiment and numerical analysis
References [1] P. Chen, D.J., Cleland, S.J., Lovatt, M.R., Bassett, “An empirical model for
predicting air infiltration into refrigerated stores through doors”, Int. J.
Refrigeration Vol. 25, pp. 799–812 (2002).
[2] Boast, M.F.G., “Frost free operation of large and high rise cold storage”, Proc.
Inst. Refrigeration, Vol. , pp. 1–11 (2003).
[3] Emswiler, J.E., “The neutral zone in ventilation”, J. Am. Soc. Htg. Ventil. Eng. 1
pp. 1–16 (1926).
99