Embed Size (px)
Citation preview
High-precision isotopic characterization of USGS referencematerials by TIMS and MC-ICP-MS
Dominique Weis and Bruno KiefferPacific Centre for Isotopic and Geochemical Research, Department of Earth and Ocean Sciences, University of BritishColumbia, 6339 Stores Road, Vancouver, British Columbia, Canada V6T 1Z4 ([email protected])
Claude MaerschalkDepartment of Earth and Environmental Sciences, Universite Libre de Bruxelles, CP 160/02, Avenue F.D. Roosevelt,50, B-1050 Brussels, Belgium
Jane BarlingPacific Centre for Isotopic and Geochemical Research, Department of Earth and Ocean Sciences, University of BritishColumbia, 6339 Stores Road, Vancouver, British Columbia, Canada V6T 1Z4
Jeroen de JongDepartment of Earth and Environmental Sciences, Universite Libre de Bruxelles, CP 160/02, Avenue F.D. Roosevelt,50, B-1050 Brussels, Belgium
Gwen A. Williams, Diane Hanano, and Wilma PretoriusPacific Centre for Isotopic and Geochemical Research, Department of Earth and Ocean Sciences, University of BritishColumbia, 6339 Stores Road, Vancouver, British Columbia, Canada V6T 1Z4
Nadine MattielliDepartment of Earth and Environmental Sciences, Universite Libre de Bruxelles, CP 160/02, Avenue F.D. Roosevelt,50, B-1050 Brussels, Belgium
James S. Scoates, Arnaud Goolaerts, and Richard M. FriedmanPacific Centre for Isotopic and Geochemical Research, Department of Earth and Ocean Sciences, University of BritishColumbia, 6339 Stores Road, Vancouver, British Columbia, Canada V6T 1Z4
J. Brian MahoneyDepartment of Geology, University of Wisconsin-Eau Claire, 105 Garfield Avenue, Eau Claire, Wisconsin 54702-4004, USA
[1] The Pacific Centre for Isotopic and Geochemical Research (PCIGR) at the University of BritishColumbia has undertaken a systematic analysis of the isotopic (Sr, Nd, and Pb) compositions andconcentrations of a broad compositional range of U.S. Geological Survey (USGS) reference materials,including basalt (BCR-1, 2; BHVO-1, 2), andesite (AGV-1, 2), rhyolite (RGM-1, 2), syenite (STM-1, 2),granodiorite (GSP-2), and granite (G-2, 3). USGS rock reference materials are geochemically wellcharacterized, but there is neither a systematic methodology nor a database for radiogenic isotopiccompositions, even for the widely used BCR-1. This investigation represents the first comprehensive,systematic analysis of the isotopic composition and concentration of USGS reference materials andprovides an important database for the isotopic community. In addition, the range of equipment at thePCIGR, including a Nu Instruments Plasma MC-ICP-MS, a Thermo Finnigan Triton TIMS, and a Thermo
G3G3GeochemistryGeophysics
Geosystems
Published by AGU and the Geochemical Society
AN ELECTRONIC JOURNAL OF THE EARTH SCIENCES
GeochemistryGeophysics
Geosystems
Technical Brief
Volume 7, Number 8
10 August 2006
Q08006, doi:10.1029/2006GC001283
ISSN: 1525-2027
Copyright 2006 by the American Geophysical Union 1 of 30
Finnigan Element2 HR-ICP-MS, permits an assessment and comparison of the precision and accuracyof isotopic analyses determined by both the TIMS and MC-ICP-MS methods (e.g., Nd isotopiccompositions). For each of the reference materials, 5 to 10 complete replicate analyses providecoherent isotopic results, all with external precision below 30 ppm (2 SD) for Sr and Nd isotopiccompositions (27 and 24 ppm for TIMS and MC-ICP-MS, respectively). Our results also show that thefirst- and second-generation USGS reference materials have homogeneous Sr and Nd isotopiccompositions. Nd isotopic compositions by MC-ICP-MS and TIMS agree to within 15 ppm for allreference materials. Interlaboratory MC-ICP-MS comparisons show excellent agreement for Pb isotopiccompositions; however, the reproducibility is not as good as for Sr and Nd. A careful, sequentialleaching experiment of three first- and second-generation reference materials (BCR, BHVO, AGV)indicates that the heterogeneity in Pb isotopic compositions, and concentrations, could be directlyrelated to contamination by the steel (mortar/pestle) used to process the materials. Contamination alsoaccounts for the high concentrations of certain other trace elements (e.g., Li, Mo, Cd, Sn, Sb, W) invarious USGS reference materials.
Components: 12,951 words, 10 figures, 9 tables.
Keywords: MC-ICP-MS; high precision; USGS reference material; Sr-Nd-Pb isotopes; leaching.
Index Terms: 1040 Geochemistry: Radiogenic isotope geochemistry; 1094 Geochemistry: Instruments and techniques.
Received 22 February 2006; Revised 4 May 2006; Accepted 23 May 2006; Published 10 August 2006.
Weis, D., et al. (2006), High-precision isotopic characterization of USGS reference materials by TIMS and MC-ICP-MS,
Geochem. Geophys. Geosyst., 7, Q08006, doi:10.1029/2006GC001283.
1. Introduction
[2] The recent development of multiple collectorinductively-coupled plasma mass spectrometry(MC-ICP-MS) for high-precision isotopic analy-ses of a large number of elements and the abilityof the Ar-ICP source to ionize most elements inthe periodic table, has made these instrumentscritical to the advancement of research in geo-chemical, environmental and medical fields[Halliday et al., 1998; Albarede et al., 2004]. Theprecision achieved on isotopic analyses of Nd, Hfand Pb is significantly better than 100 ppmdue to thefact that most of the analyses can be run in staticmode. Quality control protocols that monitor ac-curacy and precision demand well-characterized,homogenous referencematerials. In addition, matrixeffects can significantly affect the accuracy of theresults, contrary to what was initially believed[e.g., Belshaw et al., 1998; Woodhead, 2002].Therefore the reference material basis must alsoencompass the entire compositional range ofstudied samples. Similarly, recent technicalimprovements in thermo-ionization mass spec-trometers (TIMS) have also led to the ability toproduce more precise analyses on these instru-ments [e.g., Caro et al., 2003].
[3] We have carried out a systematic study of someof the most commonly used USGS reference materi-als: BCR-1, BCR-2, BHVO-1, BHVO-2, AGV-1,AGV-2, STM-1, STM-2, RGM-1, G-2, G-3 andGSP-2. Due to the heterogeneous nature of someof the basaltic samples, both in terms of concen-trations and isotopic compositions, leaching experi-ments were carried out on BHVO-1, BHVO-2,AGV-1, AGV-2, BCR-1 and BCR-2 to further ex-tend the study of Weis et al. [2005a].
[4] The availability of both a TIMS (ThermoElectron, Finnigan Triton) and a MC-ICP-MS(Nu Instruments Plasma) in the same laboratoryallowed us to carry out a parallel study of Sr andNd isotopic compositions on the TIMS, and Nd, Hfand Pb isotopic compositions on the MC-ICP-MS.To improve the comparison and reproducibility ofthe MC-ICP-MS analyses, we also measured Hfand Pb isotopic ratios on two different instrumentsin two different laboratories (Nu Plasma serial #015inBrussels andNuPlasma serial #021 inVancouver)when possible.
[5] The results are presented and discussed foreach separate isotopic system, except where it isrelevant to combine two systems. This paperfocuses on Sr, Nd and Pb isotopes. Hf isotopicresults will be presented in a separate paper,because of interesting developments related to the
GeochemistryGeophysicsGeosystems G3G3
weis et al.: isotopic study of usgs reference materials 10.1029/2006GC001283
2 of 30
role of labware composition [Weis et al., 2005b]and different separation issues.
2. Analytical Techniques
[6] This study aims to present accurate high-precision isotopic compositions for USGS refer-ence materials. We therefore describe our analyticalprocedures in some detail to provide the readerwith sufficient information to evaluate and applyour methods. Cleaning protocols for high-pressurePTFE bombs and other labware are discussed byPretorius et al. [2006]. All of the acids used forsample digestion and chemical separation weresub-boiling distilled in Teflon1 bottles, whereasthe acids used for cleaning columns were quartz-distilled.
2.1. Sample Dissolution Protocol
[7] First, a series of tests was carried out todetermine the appropriate digestion method foreach reference material. This investigation demon-strated that it is critical to use high-pressure PTFEbomb dissolutions to achieve full recovery of traceelements from felsic rocks containing refractoryaccessory phases [Pretorius et al., 2006]. Full traceelement recovery from mafic compositions andvolcanic rock types, however, was achieved witha standard hotplate dissolution, in a Savillex1
beaker.
2.1.1. Felsic Samples
[8] Approximately 100 to 150 mg of sample rockpowder is loaded into a steel-jacketed acid-washedhigh-pressure PTFE bomb with 5.0 mL of 48% HFand 1.0 mL of �14 N HNO3, and then dissolvedfor 5 days at 190�C. Digested samples are drieddown on a hotplate overnight at �130�C, recon-stituted in 6.0 mL of 6 N HCl and re-bombed for24 hours at 190�C. Afterward, samples are taken todryness on a hotplate prior to re-dissolution for ionexchange purification of Pb, Hf, Sr and Nd.
2.1.2. Mafic Samples
[9] For mafic samples the rock powders (100 to250 mg) are placed in 15 mL screw-top Savillex1
beakers with 10.0 mL of 48% HF and 1.0 mL of�14 N HNO3, and then dissolved on a hotplate for48 hours at 130�C. During this step samples areperiodically placed in an ultrasonic bath to ensurecomplete digestion. After digestion, samples aredried down overnight on a hotplate at �130�C,reconstituted in 6.0 mL of 6 N sub-boiled HCl andre-dissolved for 24 hours at 130�C, before com-mencing ion exchange chemistry.
2.2. Ion Exchange Chemistry
2.2.1. Pb Column Chemistry
[10] Pb, Hf, Sr and Nd are all purified from thesame sample solution. The first stage is the sepa-
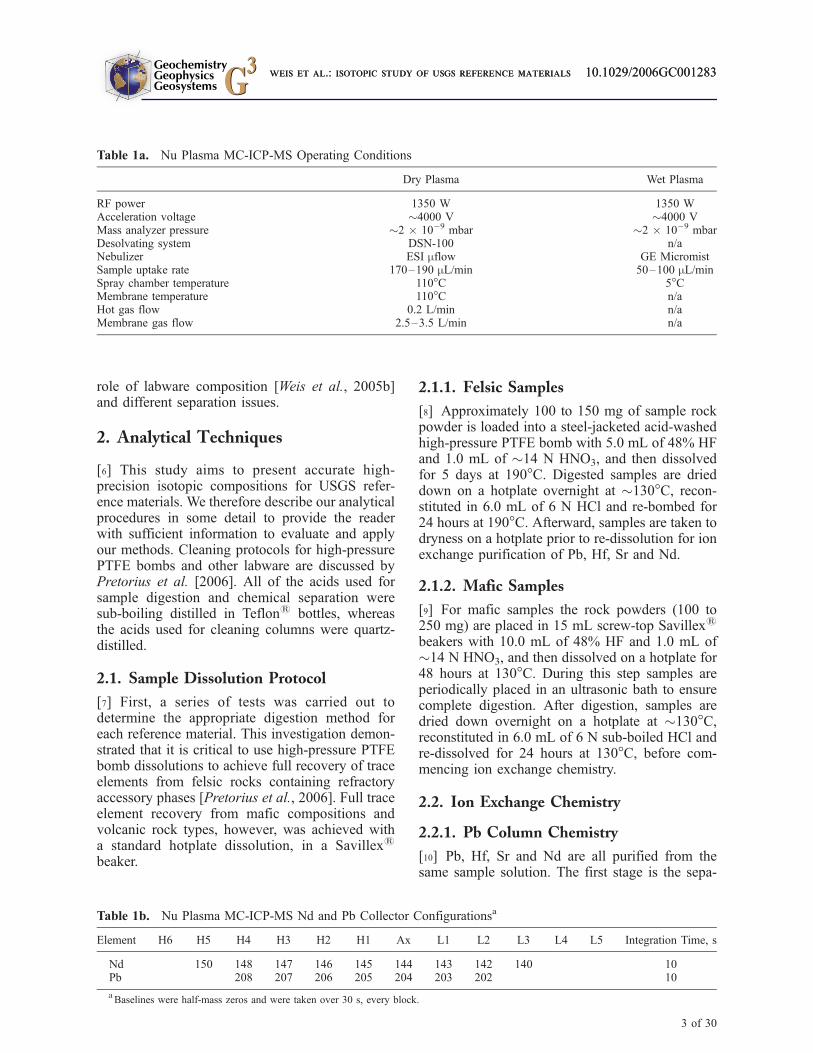
Table 1a. Nu Plasma MC-ICP-MS Operating Conditions
Dry Plasma Wet Plasma
RF power 1350 W 1350 WAcceleration voltage �4000 V �4000 VMass analyzer pressure �2 � 10�9 mbar �2 � 10�9 mbarDesolvating system DSN-100 n/aNebulizer ESI mflow GE MicromistSample uptake rate 170–190 mL/min 50–100 mL/minSpray chamber temperature 110�C 5�CMembrane temperature 110�C n/aHot gas flow 0.2 L/min n/aMembrane gas flow 2.5–3.5 L/min n/a
Table 1b. Nu Plasma MC-ICP-MS Nd and Pb Collector Configurationsa
Element H6 H5 H4 H3 H2 H1 Ax L1 L2 L3 L4 L5 Integration Time, s
Nd 150 148 147 146 145 144 143 142 140 10Pb 208 207 206 205 204 203 202 10
aBaselines were half-mass zeros and were taken over 30 s, every block.
GeochemistryGeophysicsGeosystems G3G3
weis et al.: isotopic study of usgs reference materials 10.1029/2006GC001283weis et al.: isotopic study of usgs reference materials 10.1029/2006GC001283
3 of 30
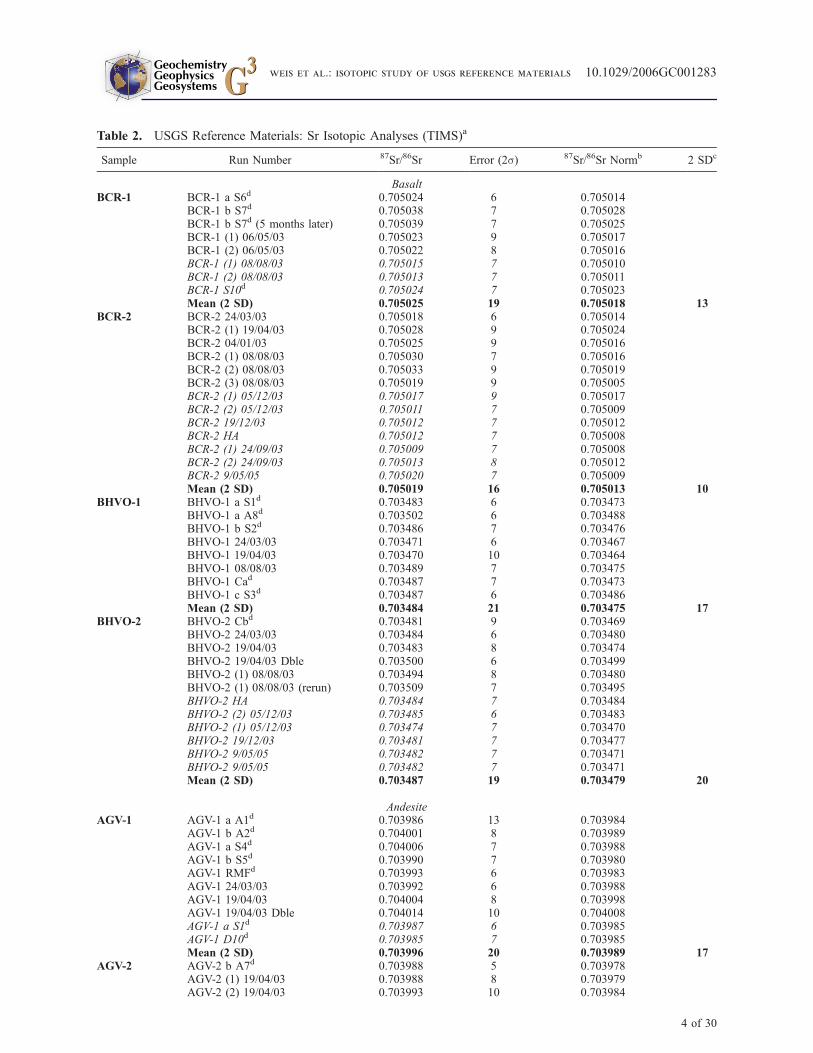
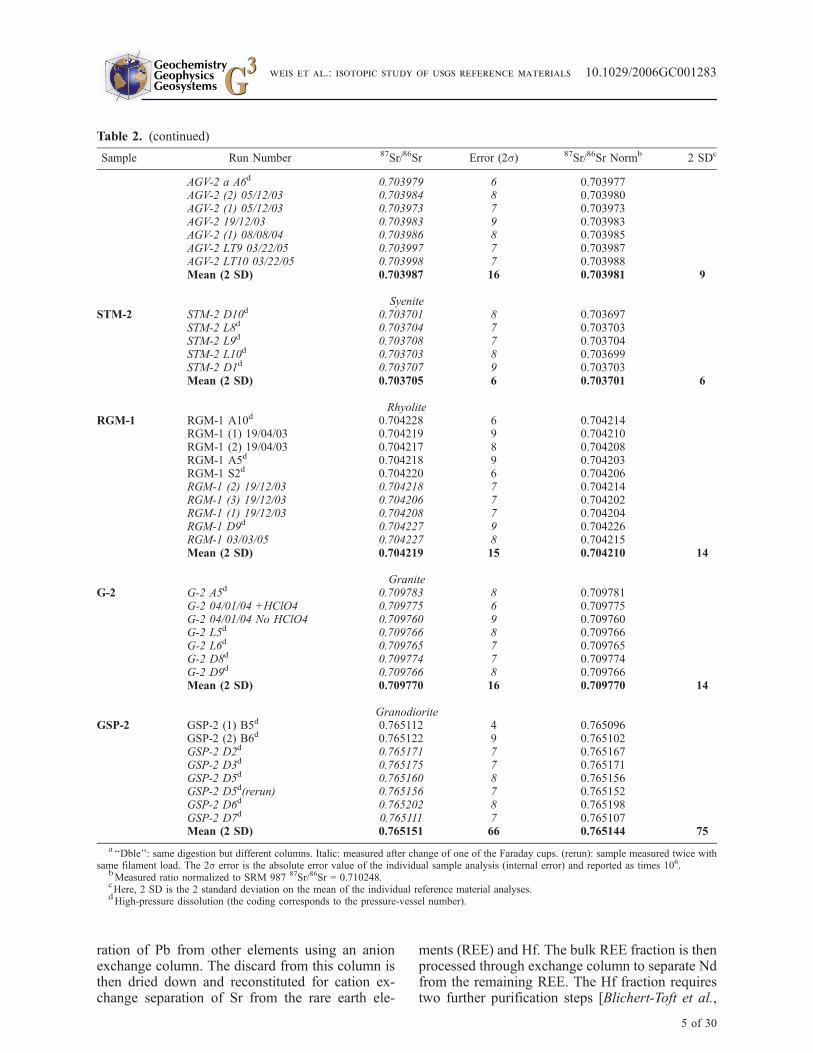
Table 2. USGS Reference Materials: Sr Isotopic Analyses (TIMS)a
Sample Run Number 87Sr/86Sr Error (2s) 87Sr/86Sr Normb 2 SDc
BasaltBCR-1 BCR-1 a S6d 0.705024 6 0.705014
BCR-1 b S7d 0.705038 7 0.705028BCR-1 b S7d (5 months later) 0.705039 7 0.705025BCR-1 (1) 06/05/03 0.705023 9 0.705017BCR-1 (2) 06/05/03 0.705022 8 0.705016BCR-1 (1) 08/08/03 0.705015 7 0.705010BCR-1 (2) 08/08/03 0.705013 7 0.705011BCR-1 S10d 0.705024 7 0.705023Mean (2 SD) 0.705025 19 0.705018 13
BCR-2 BCR-2 24/03/03 0.705018 6 0.705014BCR-2 (1) 19/04/03 0.705028 9 0.705024BCR-2 04/01/03 0.705025 9 0.705016BCR-2 (1) 08/08/03 0.705030 7 0.705016BCR-2 (2) 08/08/03 0.705033 9 0.705019BCR-2 (3) 08/08/03 0.705019 9 0.705005BCR-2 (1) 05/12/03 0.705017 9 0.705017BCR-2 (2) 05/12/03 0.705011 7 0.705009BCR-2 19/12/03 0.705012 7 0.705012BCR-2 HA 0.705012 7 0.705008BCR-2 (1) 24/09/03 0.705009 7 0.705008BCR-2 (2) 24/09/03 0.705013 8 0.705012BCR-2 9/05/05 0.705020 7 0.705009Mean (2 SD) 0.705019 16 0.705013 10
BHVO-1 BHVO-1 a S1d 0.703483 6 0.703473BHVO-1 a A8d 0.703502 6 0.703488BHVO-1 b S2d 0.703486 7 0.703476BHVO-1 24/03/03 0.703471 6 0.703467BHVO-1 19/04/03 0.703470 10 0.703464BHVO-1 08/08/03 0.703489 7 0.703475BHVO-1 Cad 0.703487 7 0.703473BHVO-1 c S3d 0.703487 6 0.703486Mean (2 SD) 0.703484 21 0.703475 17
BHVO-2 BHVO-2 Cbd 0.703481 9 0.703469BHVO-2 24/03/03 0.703484 6 0.703480BHVO-2 19/04/03 0.703483 8 0.703474BHVO-2 19/04/03 Dble 0.703500 6 0.703499BHVO-2 (1) 08/08/03 0.703494 8 0.703480BHVO-2 (1) 08/08/03 (rerun) 0.703509 7 0.703495BHVO-2 HA 0.703484 7 0.703484BHVO-2 (2) 05/12/03 0.703485 6 0.703483BHVO-2 (1) 05/12/03 0.703474 7 0.703470BHVO-2 19/12/03 0.703481 7 0.703477BHVO-2 9/05/05 0.703482 7 0.703471BHVO-2 9/05/05 0.703482 7 0.703471Mean (2 SD) 0.703487 19 0.703479 20
AndesiteAGV-1 AGV-1 a A1d 0.703986 13 0.703984
AGV-1 b A2d 0.704001 8 0.703989AGV-1 a S4d 0.704006 7 0.703988AGV-1 b S5d 0.703990 7 0.703980AGV-1 RMFd 0.703993 6 0.703983AGV-1 24/03/03 0.703992 6 0.703988AGV-1 19/04/03 0.704004 8 0.703998AGV-1 19/04/03 Dble 0.704014 10 0.704008AGV-1 a S1d 0.703987 6 0.703985AGV-1 D10d 0.703985 7 0.703985Mean (2 SD) 0.703996 20 0.703989 17
AGV-2 AGV-2 b A7d 0.703988 5 0.703978AGV-2 (1) 19/04/03 0.703988 8 0.703979AGV-2 (2) 19/04/03 0.703993 10 0.703984
GeochemistryGeophysicsGeosystems G3G3
weis et al.: isotopic study of usgs reference materials 10.1029/2006GC001283
4 of 30
ration of Pb from other elements using an anionexchange column. The discard from this column isthen dried down and reconstituted for cation ex-change separation of Sr from the rare earth ele-
ments (REE) and Hf. The bulk REE fraction is thenprocessed through exchange column to separate Ndfrom the remaining REE. The Hf fraction requirestwo further purification steps [Blichert-Toft et al.,
Table 2. (continued)
Sample Run Number 87Sr/86Sr Error (2s) 87Sr/86Sr Normb 2 SDc
AGV-2 a A6d 0.703979 6 0.703977AGV-2 (2) 05/12/03 0.703984 8 0.703980AGV-2 (1) 05/12/03 0.703973 7 0.703973AGV-2 19/12/03 0.703983 9 0.703983AGV-2 (1) 08/08/04 0.703986 8 0.703985AGV-2 LT9 03/22/05 0.703997 7 0.703987AGV-2 LT10 03/22/05 0.703998 7 0.703988Mean (2 SD) 0.703987 16 0.703981 9
SyeniteSTM-2 STM-2 D10d 0.703701 8 0.703697
STM-2 L8d 0.703704 7 0.703703STM-2 L9d 0.703708 7 0.703704STM-2 L10d 0.703703 8 0.703699STM-2 D1d 0.703707 9 0.703703Mean (2 SD) 0.703705 6 0.703701 6
RhyoliteRGM-1 RGM-1 A10d 0.704228 6 0.704214
RGM-1 (1) 19/04/03 0.704219 9 0.704210RGM-1 (2) 19/04/03 0.704217 8 0.704208RGM-1 A5d 0.704218 9 0.704203RGM-1 S2d 0.704220 6 0.704206RGM-1 (2) 19/12/03 0.704218 7 0.704214RGM-1 (3) 19/12/03 0.704206 7 0.704202RGM-1 (1) 19/12/03 0.704208 7 0.704204RGM-1 D9d 0.704227 9 0.704226RGM-1 03/03/05 0.704227 8 0.704215Mean (2 SD) 0.704219 15 0.704210 14
GraniteG-2 G-2 A5d 0.709783 8 0.709781
G-2 04/01/04 +HClO4 0.709775 6 0.709775G-2 04/01/04 No HClO4 0.709760 9 0.709760G-2 L5d 0.709766 8 0.709766G-2 L6d 0.709765 7 0.709765G-2 D8d 0.709774 7 0.709774G-2 D9d 0.709766 8 0.709766Mean (2 SD) 0.709770 16 0.709770 14
GranodioriteGSP-2 GSP-2 (1) B5d 0.765112 4 0.765096
GSP-2 (2) B6d 0.765122 9 0.765102GSP-2 D2d 0.765171 7 0.765167GSP-2 D3d 0.765175 7 0.765171GSP-2 D5d 0.765160 8 0.765156GSP-2 D5d(rerun) 0.765156 7 0.765152GSP-2 D6d 0.765202 8 0.765198GSP-2 D7d 0.765111 7 0.765107Mean (2 SD) 0.765151 66 0.765144 75
a‘‘Dble’’: same digestion but different columns. Italic: measured after change of one of the Faraday cups. (rerun): sample measured twice with
same filament load. The 2s error is the absolute error value of the individual sample analysis (internal error) and reported as times 106.bMeasured ratio normalized to SRM 987 87Sr/86Sr = 0.710248.
cHere, 2 SD is the 2 standard deviation on the mean of the individual reference material analyses.
dHigh-pressure dissolution (the coding corresponds to the pressure-vessel number).
GeochemistryGeophysicsGeosystems G3G3
weis et al.: isotopic study of usgs reference materials 10.1029/2006GC001283
5 of 30
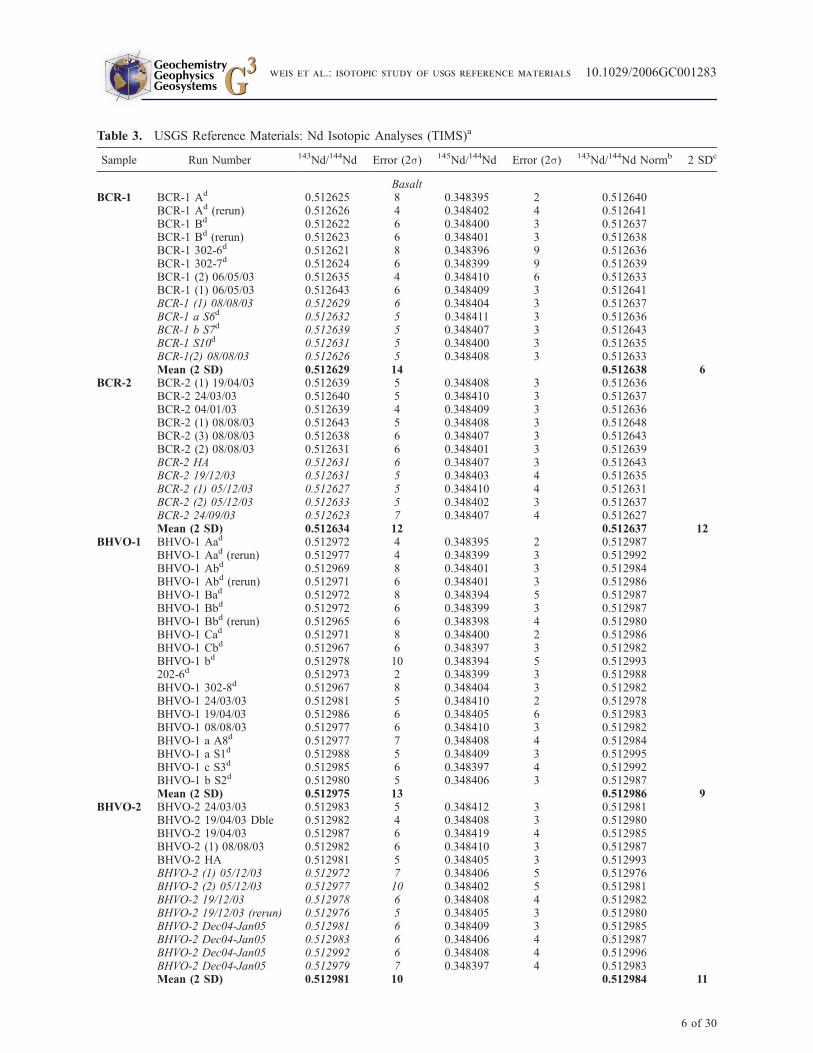
Table 3. USGS Reference Materials: Nd Isotopic Analyses (TIMS)a
Sample Run Number 143Nd/144Nd Error (2s) 145Nd/144Nd Error (2s) 143Nd/144Nd Normb 2 SDc
BasaltBCR-1 BCR-1 Ad 0.512625 8 0.348395 2 0.512640
BCR-1 Ad (rerun) 0.512626 4 0.348402 4 0.512641BCR-1 Bd 0.512622 6 0.348400 3 0.512637BCR-1 Bd (rerun) 0.512623 6 0.348401 3 0.512638BCR-1 302-6d 0.512621 8 0.348396 9 0.512636BCR-1 302-7d 0.512624 6 0.348399 9 0.512639BCR-1 (2) 06/05/03 0.512635 4 0.348410 6 0.512633BCR-1 (1) 06/05/03 0.512643 6 0.348409 3 0.512641BCR-1 (1) 08/08/03 0.512629 6 0.348404 3 0.512637BCR-1 a S6d 0.512632 5 0.348411 3 0.512636BCR-1 b S7d 0.512639 5 0.348407 3 0.512643BCR-1 S10d 0.512631 5 0.348400 3 0.512635BCR-1(2) 08/08/03 0.512626 5 0.348408 3 0.512633Mean (2 SD) 0.512629 14 0.512638 6
BCR-2 BCR-2 (1) 19/04/03 0.512639 5 0.348408 3 0.512636BCR-2 24/03/03 0.512640 5 0.348410 3 0.512637BCR-2 04/01/03 0.512639 4 0.348409 3 0.512636BCR-2 (1) 08/08/03 0.512643 5 0.348408 3 0.512648BCR-2 (3) 08/08/03 0.512638 6 0.348407 3 0.512643BCR-2 (2) 08/08/03 0.512631 6 0.348401 3 0.512639BCR-2 HA 0.512631 6 0.348407 3 0.512643BCR-2 19/12/03 0.512631 5 0.348403 4 0.512635BCR-2 (1) 05/12/03 0.512627 5 0.348410 4 0.512631BCR-2 (2) 05/12/03 0.512633 5 0.348402 3 0.512637BCR-2 24/09/03 0.512623 7 0.348407 4 0.512627Mean (2 SD) 0.512634 12 0.512637 12
BHVO-1 BHVO-1 Aad 0.512972 4 0.348395 2 0.512987BHVO-1 Aad (rerun) 0.512977 4 0.348399 3 0.512992BHVO-1 Abd 0.512969 8 0.348401 3 0.512984BHVO-1 Abd (rerun) 0.512971 6 0.348401 3 0.512986BHVO-1 Bad 0.512972 8 0.348394 5 0.512987BHVO-1 Bbd 0.512972 6 0.348399 3 0.512987BHVO-1 Bbd (rerun) 0.512965 6 0.348398 4 0.512980BHVO-1 Cad 0.512971 8 0.348400 2 0.512986BHVO-1 Cbd 0.512967 6 0.348397 3 0.512982BHVO-1 bd 0.512978 10 0.348394 5 0.512993202-6d 0.512973 2 0.348399 3 0.512988BHVO-1 302-8d 0.512967 8 0.348404 3 0.512982BHVO-1 24/03/03 0.512981 5 0.348410 2 0.512978BHVO-1 19/04/03 0.512986 6 0.348405 6 0.512983BHVO-1 08/08/03 0.512977 6 0.348410 3 0.512982BHVO-1 a A8d 0.512977 7 0.348408 4 0.512984BHVO-1 a S1d 0.512988 5 0.348409 3 0.512995BHVO-1 c S3d 0.512985 6 0.348397 4 0.512992BHVO-1 b S2d 0.512980 5 0.348406 3 0.512987Mean (2 SD) 0.512975 13 0.512986 9
BHVO-2 BHVO-2 24/03/03 0.512983 5 0.348412 3 0.512981BHVO-2 19/04/03 Dble 0.512982 4 0.348408 3 0.512980BHVO-2 19/04/03 0.512987 6 0.348419 4 0.512985BHVO-2 (1) 08/08/03 0.512982 6 0.348410 3 0.512987BHVO-2 HA 0.512981 5 0.348405 3 0.512993BHVO-2 (1) 05/12/03 0.512972 7 0.348406 5 0.512976BHVO-2 (2) 05/12/03 0.512977 10 0.348402 5 0.512981BHVO-2 19/12/03 0.512978 6 0.348408 4 0.512982BHVO-2 19/12/03 (rerun) 0.512976 5 0.348405 3 0.512980BHVO-2 Dec04-Jan05 0.512981 6 0.348409 3 0.512985BHVO-2 Dec04-Jan05 0.512983 6 0.348406 4 0.512987BHVO-2 Dec04-Jan05 0.512992 6 0.348408 4 0.512996BHVO-2 Dec04-Jan05 0.512979 7 0.348397 4 0.512983Mean (2 SD) 0.512981 10 0.512984 11
GeochemistryGeophysicsGeosystems G3G3
weis et al.: isotopic study of usgs reference materials 10.1029/2006GC001283
6 of 30
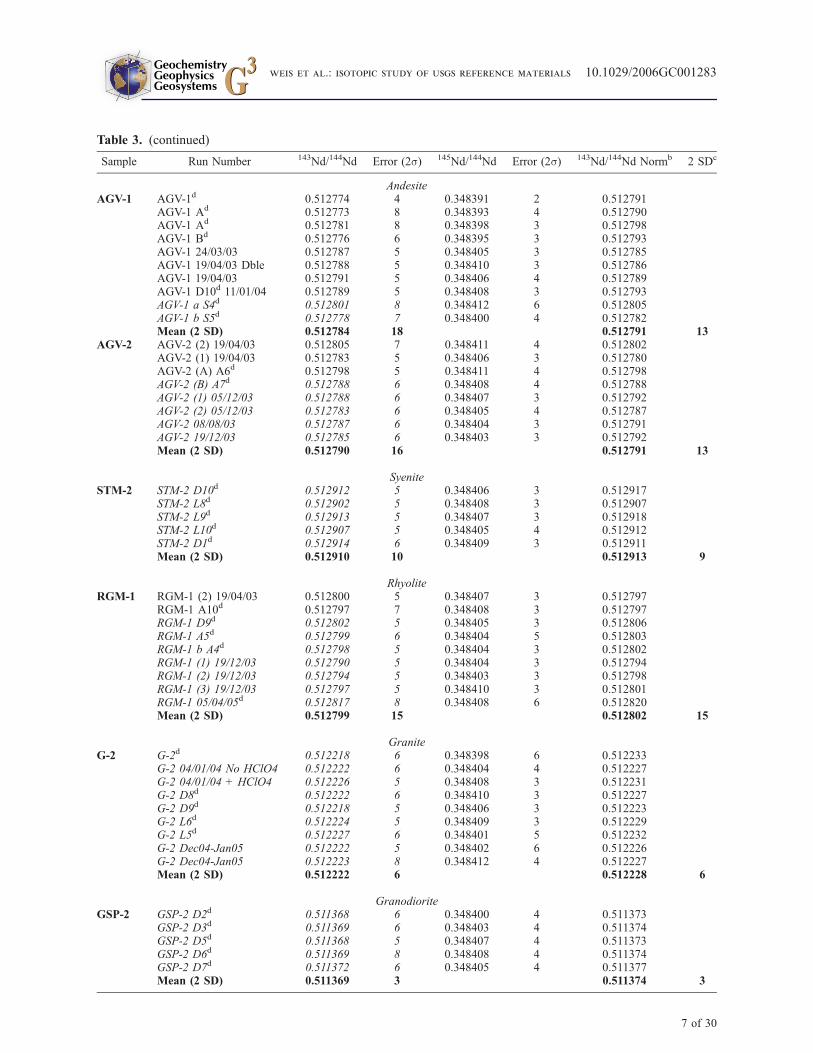
Table 3. (continued)
Sample Run Number 143Nd/144Nd Error (2s) 145Nd/144Nd Error (2s) 143Nd/144Nd Normb 2 SDc
AndesiteAGV-1 AGV-1d 0.512774 4 0.348391 2 0.512791
AGV-1 Ad 0.512773 8 0.348393 4 0.512790AGV-1 Ad 0.512781 8 0.348398 3 0.512798AGV-1 Bd 0.512776 6 0.348395 3 0.512793AGV-1 24/03/03 0.512787 5 0.348405 3 0.512785AGV-1 19/04/03 Dble 0.512788 5 0.348410 3 0.512786AGV-1 19/04/03 0.512791 5 0.348406 4 0.512789AGV-1 D10d 11/01/04 0.512789 5 0.348408 3 0.512793AGV-1 a S4d 0.512801 8 0.348412 6 0.512805AGV-1 b S5d 0.512778 7 0.348400 4 0.512782Mean (2 SD) 0.512784 18 0.512791 13
AGV-2 AGV-2 (2) 19/04/03 0.512805 7 0.348411 4 0.512802AGV-2 (1) 19/04/03 0.512783 5 0.348406 3 0.512780AGV-2 (A) A6d 0.512798 5 0.348411 4 0.512798AGV-2 (B) A7d 0.512788 6 0.348408 4 0.512788AGV-2 (1) 05/12/03 0.512788 6 0.348407 3 0.512792AGV-2 (2) 05/12/03 0.512783 6 0.348405 4 0.512787AGV-2 08/08/03 0.512787 6 0.348404 3 0.512791AGV-2 19/12/03 0.512785 6 0.348403 3 0.512792Mean (2 SD) 0.512790 16 0.512791 13
SyeniteSTM-2 STM-2 D10d 0.512912 5 0.348406 3 0.512917
STM-2 L8d 0.512902 5 0.348408 3 0.512907STM-2 L9d 0.512913 5 0.348407 3 0.512918STM-2 L10d 0.512907 5 0.348405 4 0.512912STM-2 D1d 0.512914 6 0.348409 3 0.512911Mean (2 SD) 0.512910 10 0.512913 9
RhyoliteRGM-1 RGM-1 (2) 19/04/03 0.512800 5 0.348407 3 0.512797
RGM-1 A10d 0.512797 7 0.348408 3 0.512797RGM-1 D9d 0.512802 5 0.348405 3 0.512806RGM-1 A5d 0.512799 6 0.348404 5 0.512803RGM-1 b A4d 0.512798 5 0.348404 3 0.512802RGM-1 (1) 19/12/03 0.512790 5 0.348404 3 0.512794RGM-1 (2) 19/12/03 0.512794 5 0.348403 3 0.512798RGM-1 (3) 19/12/03 0.512797 5 0.348410 3 0.512801RGM-1 05/04/05d 0.512817 8 0.348408 6 0.512820Mean (2 SD) 0.512799 15 0.512802 15
GraniteG-2 G-2d 0.512218 6 0.348398 6 0.512233
G-2 04/01/04 No HClO4 0.512222 6 0.348404 4 0.512227G-2 04/01/04 + HClO4 0.512226 5 0.348408 3 0.512231G-2 D8d 0.512222 6 0.348410 3 0.512227G-2 D9d 0.512218 5 0.348406 3 0.512223G-2 L6d 0.512224 5 0.348409 3 0.512229G-2 L5d 0.512227 6 0.348401 5 0.512232G-2 Dec04-Jan05 0.512222 5 0.348402 6 0.512226G-2 Dec04-Jan05 0.512223 8 0.348412 4 0.512227Mean (2 SD) 0.512222 6 0.512228 6
GranodioriteGSP-2 GSP-2 D2d 0.511368 6 0.348400 4 0.511373
GSP-2 D3d 0.511369 6 0.348403 4 0.511374GSP-2 D5d 0.511368 5 0.348407 4 0.511373GSP-2 D6d 0.511369 8 0.348408 4 0.511374GSP-2 D7d 0.511372 6 0.348405 4 0.511377Mean (2 SD) 0.511369 3 0.511374 3
GeochemistryGeophysicsGeosystems G3G3
weis et al.: isotopic study of usgs reference materials 10.1029/2006GC001283
7 of 30
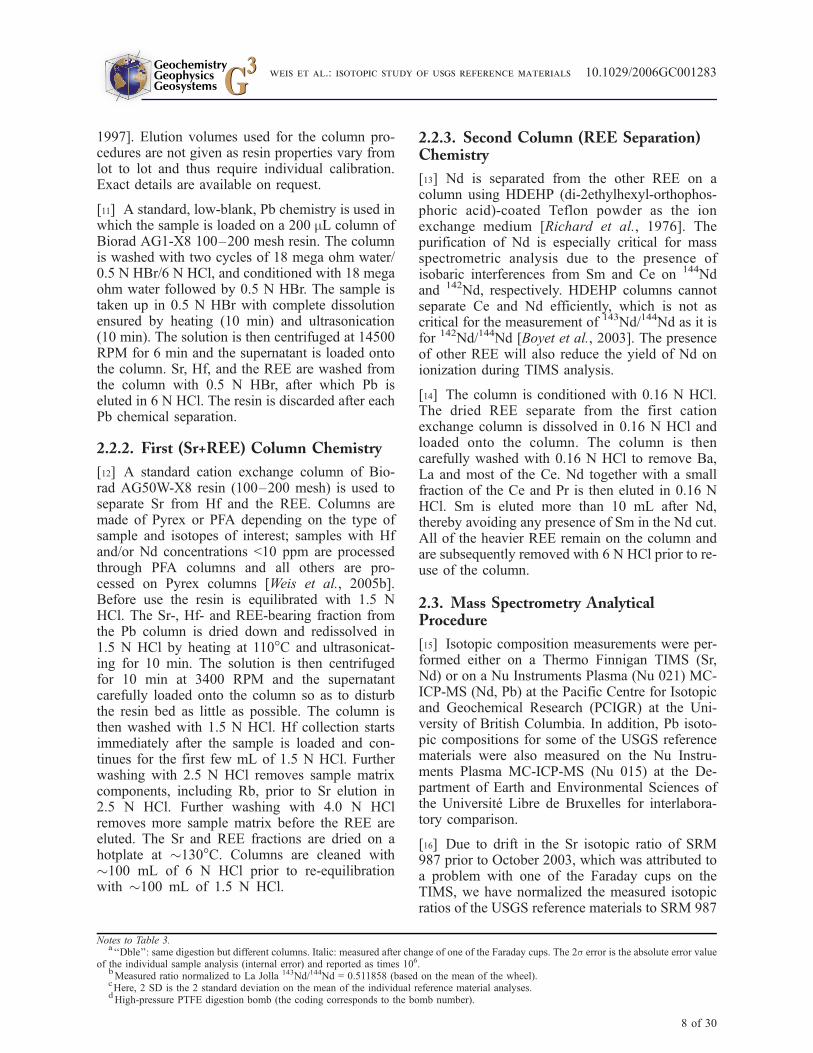
1997]. Elution volumes used for the column pro-cedures are not given as resin properties vary fromlot to lot and thus require individual calibration.Exact details are available on request.
[11] A standard, low-blank, Pb chemistry is used inwhich the sample is loaded on a 200 mL column ofBiorad AG1-X8 100–200 mesh resin. The columnis washed with two cycles of 18 mega ohm water/0.5 N HBr/6 N HCl, and conditioned with 18 megaohm water followed by 0.5 N HBr. The sample istaken up in 0.5 N HBr with complete dissolutionensured by heating (10 min) and ultrasonication(10 min). The solution is then centrifuged at 14500RPM for 6 min and the supernatant is loaded ontothe column. Sr, Hf, and the REE are washed fromthe column with 0.5 N HBr, after which Pb iseluted in 6 N HCl. The resin is discarded after eachPb chemical separation.
2.2.2. First (Sr+REE) Column Chemistry
[12] A standard cation exchange column of Bio-rad AG50W-X8 resin (100–200 mesh) is used toseparate Sr from Hf and the REE. Columns aremade of Pyrex or PFA depending on the type ofsample and isotopes of interest; samples with Hfand/or Nd concentrations <10 ppm are processedthrough PFA columns and all others are pro-cessed on Pyrex columns [Weis et al., 2005b].Before use the resin is equilibrated with 1.5 NHCl. The Sr-, Hf- and REE-bearing fraction fromthe Pb column is dried down and redissolved in1.5 N HCl by heating at 110�C and ultrasonicat-ing for 10 min. The solution is then centrifugedfor 10 min at 3400 RPM and the supernatantcarefully loaded onto the column so as to disturbthe resin bed as little as possible. The column isthen washed with 1.5 N HCl. Hf collection startsimmediately after the sample is loaded and con-tinues for the first few mL of 1.5 N HCl. Furtherwashing with 2.5 N HCl removes sample matrixcomponents, including Rb, prior to Sr elution in2.5 N HCl. Further washing with 4.0 N HClremoves more sample matrix before the REE areeluted. The Sr and REE fractions are dried on ahotplate at �130�C. Columns are cleaned with�100 mL of 6 N HCl prior to re-equilibrationwith �100 mL of 1.5 N HCl.
2.2.3. Second Column (REE Separation)Chemistry
[13] Nd is separated from the other REE on acolumn using HDEHP (di-2ethylhexyl-orthophos-phoric acid)-coated Teflon powder as the ionexchange medium [Richard et al., 1976]. Thepurification of Nd is especially critical for massspectrometric analysis due to the presence ofisobaric interferences from Sm and Ce on 144Ndand 142Nd, respectively. HDEHP columns cannotseparate Ce and Nd efficiently, which is not ascritical for the measurement of 143Nd/144Nd as it isfor 142Nd/144Nd [Boyet et al., 2003]. The presenceof other REE will also reduce the yield of Nd onionization during TIMS analysis.
[14] The column is conditioned with 0.16 N HCl.The dried REE separate from the first cationexchange column is dissolved in 0.16 N HCl andloaded onto the column. The column is thencarefully washed with 0.16 N HCl to remove Ba,La and most of the Ce. Nd together with a smallfraction of the Ce and Pr is then eluted in 0.16 NHCl. Sm is eluted more than 10 mL after Nd,thereby avoiding any presence of Sm in the Nd cut.All of the heavier REE remain on the column andare subsequently removed with 6 N HCl prior to re-use of the column.
2.3. Mass Spectrometry AnalyticalProcedure
[15] Isotopic composition measurements were per-formed either on a Thermo Finnigan TIMS (Sr,Nd) or on a Nu Instruments Plasma (Nu 021) MC-ICP-MS (Nd, Pb) at the Pacific Centre for Isotopicand Geochemical Research (PCIGR) at the Uni-versity of British Columbia. In addition, Pb isoto-pic compositions for some of the USGS referencematerials were also measured on the Nu Instru-ments Plasma MC-ICP-MS (Nu 015) at the De-partment of Earth and Environmental Sciences ofthe Universite Libre de Bruxelles for interlabora-tory comparison.
[16] Due to drift in the Sr isotopic ratio of SRM987 prior to October 2003, which was attributed toa problem with one of the Faraday cups on theTIMS, we have normalized the measured isotopicratios of the USGS reference materials to SRM 987
Notes to Table 3.a‘‘Dble’’: same digestion but different columns. Italic: measured after change of one of the Faraday cups. The 2s error is the absolute error value
of the individual sample analysis (internal error) and reported as times 106.bMeasured ratio normalized to La Jolla 143Nd/144Nd = 0.511858 (based on the mean of the wheel).
cHere, 2 SD is the 2 standard deviation on the mean of the individual reference material analyses.
dHigh-pressure PTFE digestion bomb (the coding corresponds to the bomb number).
GeochemistryGeophysicsGeosystems G3G3
weis et al.: isotopic study of usgs reference materials 10.1029/2006GC001283
8 of 30
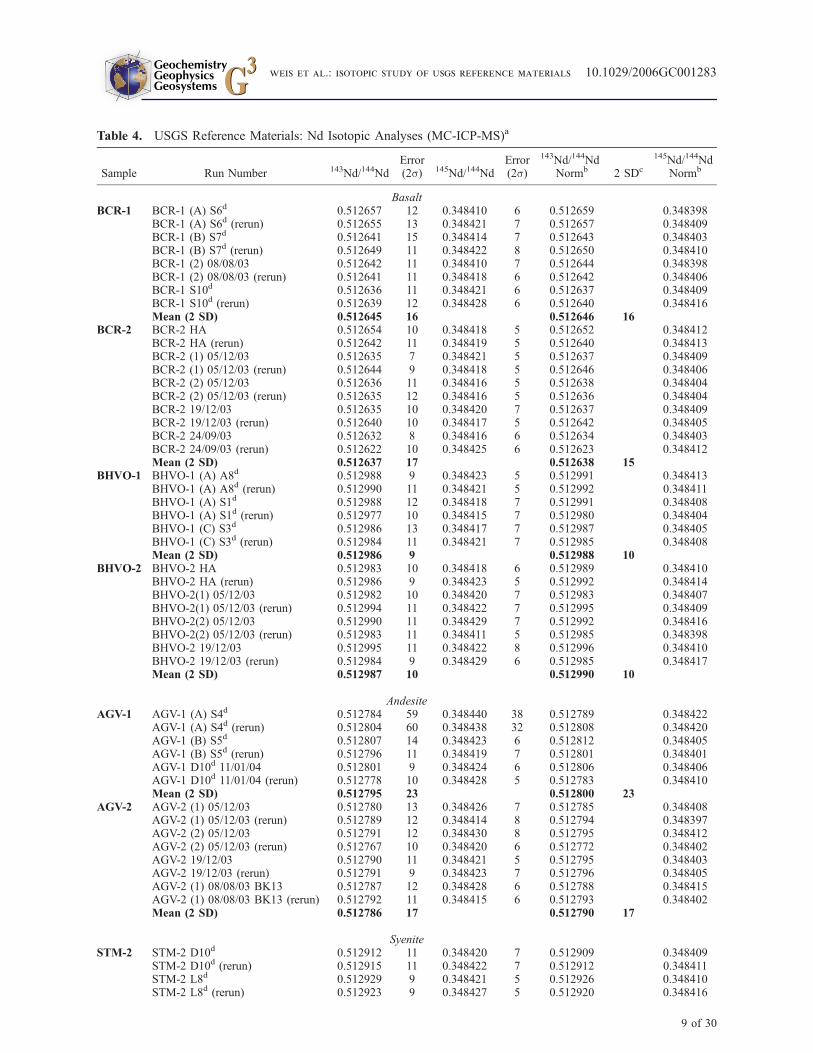
Table 4. USGS Reference Materials: Nd Isotopic Analyses (MC-ICP-MS)a
Sample Run Number 143Nd/144NdError(2s) 145Nd/144Nd
Error(2s)
143Nd/144NdNormb 2 SDc
145Nd/144NdNormb
BasaltBCR-1 BCR-1 (A) S6d 0.512657 12 0.348410 6 0.512659 0.348398
BCR-1 (A) S6d (rerun) 0.512655 13 0.348421 7 0.512657 0.348409BCR-1 (B) S7d 0.512641 15 0.348414 7 0.512643 0.348403BCR-1 (B) S7d (rerun) 0.512649 11 0.348422 8 0.512650 0.348410BCR-1 (2) 08/08/03 0.512642 11 0.348410 7 0.512644 0.348398BCR-1 (2) 08/08/03 (rerun) 0.512641 11 0.348418 6 0.512642 0.348406BCR-1 S10d 0.512636 11 0.348421 6 0.512637 0.348409BCR-1 S10d (rerun) 0.512639 12 0.348428 6 0.512640 0.348416Mean (2 SD) 0.512645 16 0.512646 16
BCR-2 BCR-2 HA 0.512654 10 0.348418 5 0.512652 0.348412BCR-2 HA (rerun) 0.512642 11 0.348419 5 0.512640 0.348413BCR-2 (1) 05/12/03 0.512635 7 0.348421 5 0.512637 0.348409BCR-2 (1) 05/12/03 (rerun) 0.512644 9 0.348418 5 0.512646 0.348406BCR-2 (2) 05/12/03 0.512636 11 0.348416 5 0.512638 0.348404BCR-2 (2) 05/12/03 (rerun) 0.512635 12 0.348416 5 0.512636 0.348404BCR-2 19/12/03 0.512635 10 0.348420 7 0.512637 0.348409BCR-2 19/12/03 (rerun) 0.512640 10 0.348417 5 0.512642 0.348405BCR-2 24/09/03 0.512632 8 0.348416 6 0.512634 0.348403BCR-2 24/09/03 (rerun) 0.512622 10 0.348425 6 0.512623 0.348412Mean (2 SD) 0.512637 17 0.512638 15
BHVO-1 BHVO-1 (A) A8d 0.512988 9 0.348423 5 0.512991 0.348413BHVO-1 (A) A8d (rerun) 0.512990 11 0.348421 5 0.512992 0.348411BHVO-1 (A) S1d 0.512988 12 0.348418 7 0.512991 0.348408BHVO-1 (A) S1d (rerun) 0.512977 10 0.348415 7 0.512980 0.348404BHVO-1 (C) S3d 0.512986 13 0.348417 7 0.512987 0.348405BHVO-1 (C) S3d (rerun) 0.512984 11 0.348421 7 0.512985 0.348408Mean (2 SD) 0.512986 9 0.512988 10
BHVO-2 BHVO-2 HA 0.512983 10 0.348418 6 0.512989 0.348410BHVO-2 HA (rerun) 0.512986 9 0.348423 5 0.512992 0.348414BHVO-2(1) 05/12/03 0.512982 10 0.348420 7 0.512983 0.348407BHVO-2(1) 05/12/03 (rerun) 0.512994 11 0.348422 7 0.512995 0.348409BHVO-2(2) 05/12/03 0.512990 11 0.348429 7 0.512992 0.348416BHVO-2(2) 05/12/03 (rerun) 0.512983 11 0.348411 5 0.512985 0.348398BHVO-2 19/12/03 0.512995 11 0.348422 8 0.512996 0.348410BHVO-2 19/12/03 (rerun) 0.512984 9 0.348429 6 0.512985 0.348417Mean (2 SD) 0.512987 10 0.512990 10
AndesiteAGV-1 AGV-1 (A) S4d 0.512784 59 0.348440 38 0.512789 0.348422
AGV-1 (A) S4d (rerun) 0.512804 60 0.348438 32 0.512808 0.348420AGV-1 (B) S5d 0.512807 14 0.348423 6 0.512812 0.348405AGV-1 (B) S5d (rerun) 0.512796 11 0.348419 7 0.512801 0.348401AGV-1 D10d 11/01/04 0.512801 9 0.348424 6 0.512806 0.348406AGV-1 D10d 11/01/04 (rerun) 0.512778 10 0.348428 5 0.512783 0.348410Mean (2 SD) 0.512795 23 0.512800 23
AGV-2 AGV-2 (1) 05/12/03 0.512780 13 0.348426 7 0.512785 0.348408AGV-2 (1) 05/12/03 (rerun) 0.512789 12 0.348414 8 0.512794 0.348397AGV-2 (2) 05/12/03 0.512791 12 0.348430 8 0.512795 0.348412AGV-2 (2) 05/12/03 (rerun) 0.512767 10 0.348420 6 0.512772 0.348402AGV-2 19/12/03 0.512790 11 0.348421 5 0.512795 0.348403AGV-2 19/12/03 (rerun) 0.512791 9 0.348423 7 0.512796 0.348405AGV-2 (1) 08/08/03 BK13 0.512787 12 0.348428 6 0.512788 0.348415AGV-2 (1) 08/08/03 BK13 (rerun) 0.512792 11 0.348415 6 0.512793 0.348402Mean (2 SD) 0.512786 17 0.512790 17
SyeniteSTM-2 STM-2 D10d 0.512912 11 0.348420 7 0.512909 0.348409
STM-2 D10d (rerun) 0.512915 11 0.348422 7 0.512912 0.348411STM-2 L8d 0.512929 9 0.348421 5 0.512926 0.348410STM-2 L8d (rerun) 0.512923 9 0.348427 5 0.512920 0.348416
GeochemistryGeophysicsGeosystems G3G3
weis et al.: isotopic study of usgs reference materials 10.1029/2006GC001283
9 of 30
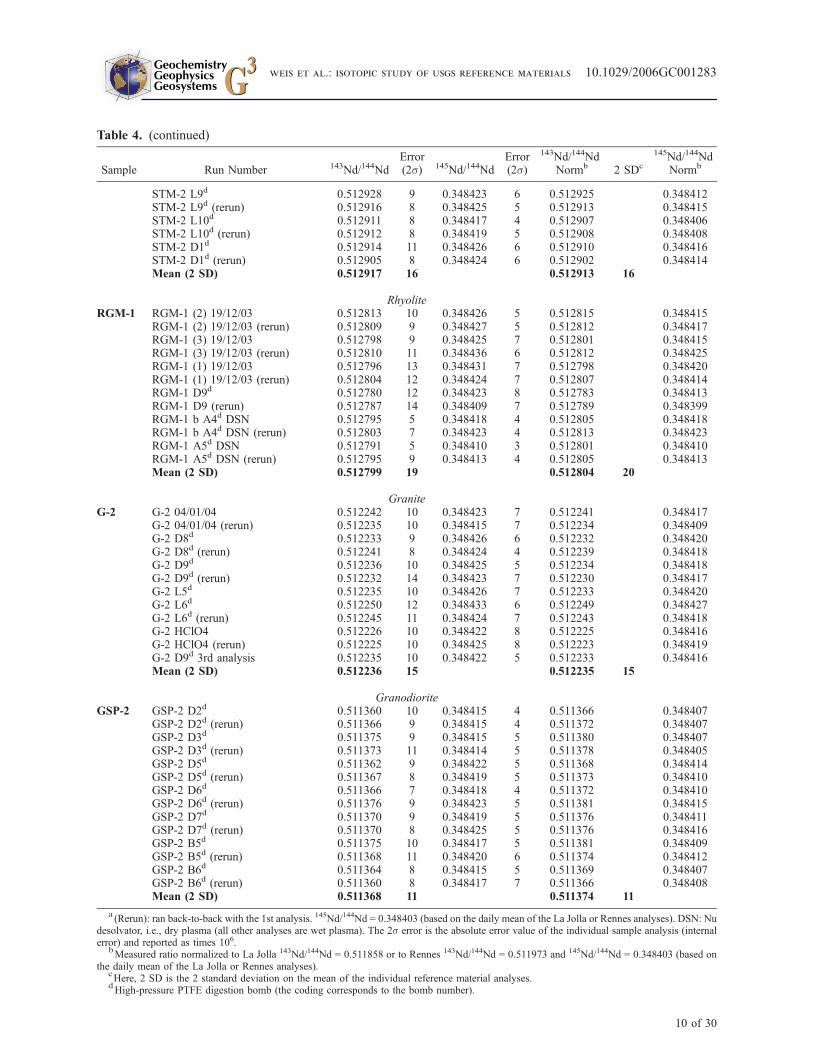
Table 4. (continued)
Sample Run Number 143Nd/144NdError(2s) 145Nd/144Nd
Error(2s)
143Nd/144NdNormb 2 SDc
145Nd/144NdNormb
STM-2 L9d 0.512928 9 0.348423 6 0.512925 0.348412STM-2 L9d (rerun) 0.512916 8 0.348425 5 0.512913 0.348415STM-2 L10d 0.512911 8 0.348417 4 0.512907 0.348406STM-2 L10d (rerun) 0.512912 8 0.348419 5 0.512908 0.348408STM-2 D1d 0.512914 11 0.348426 6 0.512910 0.348416STM-2 D1d (rerun) 0.512905 8 0.348424 6 0.512902 0.348414Mean (2 SD) 0.512917 16 0.512913 16
RhyoliteRGM-1 RGM-1 (2) 19/12/03 0.512813 10 0.348426 5 0.512815 0.348415
RGM-1 (2) 19/12/03 (rerun) 0.512809 9 0.348427 5 0.512812 0.348417RGM-1 (3) 19/12/03 0.512798 9 0.348425 7 0.512801 0.348415RGM-1 (3) 19/12/03 (rerun) 0.512810 11 0.348436 6 0.512812 0.348425RGM-1 (1) 19/12/03 0.512796 13 0.348431 7 0.512798 0.348420RGM-1 (1) 19/12/03 (rerun) 0.512804 12 0.348424 7 0.512807 0.348414RGM-1 D9d 0.512780 12 0.348423 8 0.512783 0.348413RGM-1 D9 (rerun) 0.512787 14 0.348409 7 0.512789 0.348399RGM-1 b A4d DSN 0.512795 5 0.348418 4 0.512805 0.348418RGM-1 b A4d DSN (rerun) 0.512803 7 0.348423 4 0.512813 0.348423RGM-1 A5d DSN 0.512791 5 0.348410 3 0.512801 0.348410RGM-1 A5d DSN (rerun) 0.512795 9 0.348413 4 0.512805 0.348413Mean (2 SD) 0.512799 19 0.512804 20
GraniteG-2 G-2 04/01/04 0.512242 10 0.348423 7 0.512241 0.348417
G-2 04/01/04 (rerun) 0.512235 10 0.348415 7 0.512234 0.348409G-2 D8d 0.512233 9 0.348426 6 0.512232 0.348420G-2 D8d (rerun) 0.512241 8 0.348424 4 0.512239 0.348418G-2 D9d 0.512236 10 0.348425 5 0.512234 0.348418G-2 D9d (rerun) 0.512232 14 0.348423 7 0.512230 0.348417G-2 L5d 0.512235 10 0.348426 7 0.512233 0.348420G-2 L6d 0.512250 12 0.348433 6 0.512249 0.348427G-2 L6d (rerun) 0.512245 11 0.348424 7 0.512243 0.348418G-2 HClO4 0.512226 10 0.348422 8 0.512225 0.348416G-2 HClO4 (rerun) 0.512225 10 0.348425 8 0.512223 0.348419G-2 D9d 3rd analysis 0.512235 10 0.348422 5 0.512233 0.348416Mean (2 SD) 0.512236 15 0.512235 15
GranodioriteGSP-2 GSP-2 D2d 0.511360 10 0.348415 4 0.511366 0.348407
GSP-2 D2d (rerun) 0.511366 9 0.348415 4 0.511372 0.348407GSP-2 D3d 0.511375 9 0.348415 5 0.511380 0.348407GSP-2 D3d (rerun) 0.511373 11 0.348414 5 0.511378 0.348405GSP-2 D5d 0.511362 9 0.348422 5 0.511368 0.348414GSP-2 D5d (rerun) 0.511367 8 0.348419 5 0.511373 0.348410GSP-2 D6d 0.511366 7 0.348418 4 0.511372 0.348410GSP-2 D6d (rerun) 0.511376 9 0.348423 5 0.511381 0.348415GSP-2 D7d 0.511370 9 0.348419 5 0.511376 0.348411GSP-2 D7d (rerun) 0.511370 8 0.348425 5 0.511376 0.348416GSP-2 B5d 0.511375 10 0.348417 5 0.511381 0.348409GSP-2 B5d (rerun) 0.511368 11 0.348420 6 0.511374 0.348412GSP-2 B6d 0.511364 8 0.348415 5 0.511369 0.348407GSP-2 B6d (rerun) 0.511360 8 0.348417 7 0.511366 0.348408Mean (2 SD) 0.511368 11 0.511374 11
a(Rerun): ran back-to-back with the 1st analysis. 145Nd/144Nd = 0.348403 (based on the daily mean of the La Jolla or Rennes analyses). DSN: Nu
desolvator, i.e., dry plasma (all other analyses are wet plasma). The 2s error is the absolute error value of the individual sample analysis (internalerror) and reported as times 106.
bMeasured ratio normalized to La Jolla 143Nd/144Nd = 0.511858 or to Rennes 143Nd/144Nd = 0.511973 and 145Nd/144Nd = 0.348403 (based on
the daily mean of the La Jolla or Rennes analyses).cHere, 2 SD is the 2 standard deviation on the mean of the individual reference material analyses.
dHigh-pressure PTFE digestion bomb (the coding corresponds to the bomb number).
GeochemistryGeophysicsGeosystems G3G3
weis et al.: isotopic study of usgs reference materials 10.1029/2006GC001283
10 of 30
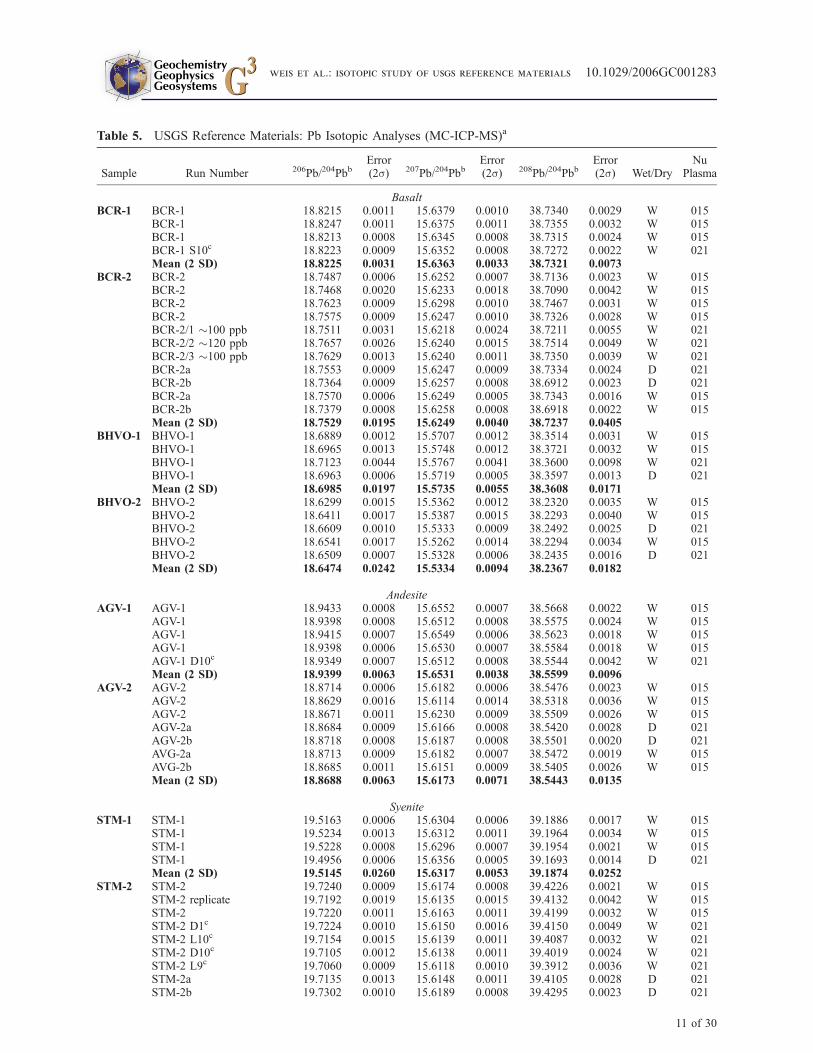
Table 5. USGS Reference Materials: Pb Isotopic Analyses (MC-ICP-MS)a
Sample Run Number 206Pb/204PbbError(2s) 207Pb/204Pbb
Error(2s) 208Pb/204Pbb
Error(2s) Wet/Dry
NuPlasma
BasaltBCR-1 BCR-1 18.8215 0.0011 15.6379 0.0010 38.7340 0.0029 W 015
BCR-1 18.8247 0.0011 15.6375 0.0011 38.7355 0.0032 W 015BCR-1 18.8213 0.0008 15.6345 0.0008 38.7315 0.0024 W 015BCR-1 S10c 18.8223 0.0009 15.6352 0.0008 38.7272 0.0022 W 021Mean (2 SD) 18.8225 0.0031 15.6363 0.0033 38.7321 0.0073
BCR-2 BCR-2 18.7487 0.0006 15.6252 0.0007 38.7136 0.0023 W 015BCR-2 18.7468 0.0020 15.6233 0.0018 38.7090 0.0042 W 015BCR-2 18.7623 0.0009 15.6298 0.0010 38.7467 0.0031 W 015BCR-2 18.7575 0.0009 15.6247 0.0010 38.7326 0.0028 W 015BCR-2/1 �100 ppb 18.7511 0.0031 15.6218 0.0024 38.7211 0.0055 W 021BCR-2/2 �120 ppb 18.7657 0.0026 15.6240 0.0015 38.7514 0.0049 W 021BCR-2/3 �100 ppb 18.7629 0.0013 15.6240 0.0011 38.7350 0.0039 W 021BCR-2a 18.7553 0.0009 15.6247 0.0009 38.7334 0.0024 D 021BCR-2b 18.7364 0.0009 15.6257 0.0008 38.6912 0.0023 D 021BCR-2a 18.7570 0.0006 15.6249 0.0005 38.7343 0.0016 W 015BCR-2b 18.7379 0.0008 15.6258 0.0008 38.6918 0.0022 W 015Mean (2 SD) 18.7529 0.0195 15.6249 0.0040 38.7237 0.0405
BHVO-1 BHVO-1 18.6889 0.0012 15.5707 0.0012 38.3514 0.0031 W 015BHVO-1 18.6965 0.0013 15.5748 0.0012 38.3721 0.0032 W 015BHVO-1 18.7123 0.0044 15.5767 0.0041 38.3600 0.0098 W 021BHVO-1 18.6963 0.0006 15.5719 0.0005 38.3597 0.0013 D 021Mean (2 SD) 18.6985 0.0197 15.5735 0.0055 38.3608 0.0171
BHVO-2 BHVO-2 18.6299 0.0015 15.5362 0.0012 38.2320 0.0035 W 015BHVO-2 18.6411 0.0017 15.5387 0.0015 38.2293 0.0040 W 015BHVO-2 18.6609 0.0010 15.5333 0.0009 38.2492 0.0025 D 021BHVO-2 18.6541 0.0017 15.5262 0.0014 38.2294 0.0034 W 015BHVO-2 18.6509 0.0007 15.5328 0.0006 38.2435 0.0016 D 021Mean (2 SD) 18.6474 0.0242 15.5334 0.0094 38.2367 0.0182
AndesiteAGV-1 AGV-1 18.9433 0.0008 15.6552 0.0007 38.5668 0.0022 W 015
AGV-1 18.9398 0.0008 15.6512 0.0008 38.5575 0.0024 W 015AGV-1 18.9415 0.0007 15.6549 0.0006 38.5623 0.0018 W 015AGV-1 18.9398 0.0006 15.6530 0.0007 38.5584 0.0018 W 015AGV-1 D10c 18.9349 0.0007 15.6512 0.0008 38.5544 0.0042 W 021Mean (2 SD) 18.9399 0.0063 15.6531 0.0038 38.5599 0.0096
AGV-2 AGV-2 18.8714 0.0006 15.6182 0.0006 38.5476 0.0023 W 015AGV-2 18.8629 0.0016 15.6114 0.0014 38.5318 0.0036 W 015AGV-2 18.8671 0.0011 15.6230 0.0009 38.5509 0.0026 W 015AGV-2a 18.8684 0.0009 15.6166 0.0008 38.5420 0.0028 D 021AGV-2b 18.8718 0.0008 15.6187 0.0008 38.5501 0.0020 D 021AVG-2a 18.8713 0.0009 15.6182 0.0007 38.5472 0.0019 W 015AVG-2b 18.8685 0.0011 15.6151 0.0009 38.5405 0.0026 W 015Mean (2 SD) 18.8688 0.0063 15.6173 0.0071 38.5443 0.0135
SyeniteSTM-1 STM-1 19.5163 0.0006 15.6304 0.0006 39.1886 0.0017 W 015
STM-1 19.5234 0.0013 15.6312 0.0011 39.1964 0.0034 W 015STM-1 19.5228 0.0008 15.6296 0.0007 39.1954 0.0021 W 015STM-1 19.4956 0.0006 15.6356 0.0005 39.1693 0.0014 D 021Mean (2 SD) 19.5145 0.0260 15.6317 0.0053 39.1874 0.0252
STM-2 STM-2 19.7240 0.0009 15.6174 0.0008 39.4226 0.0021 W 015STM-2 replicate 19.7192 0.0019 15.6135 0.0015 39.4132 0.0042 W 015STM-2 19.7220 0.0011 15.6163 0.0011 39.4199 0.0032 W 015STM-2 D1c 19.7224 0.0010 15.6150 0.0016 39.4150 0.0049 W 021STM-2 L10c 19.7154 0.0015 15.6139 0.0011 39.4087 0.0032 W 021STM-2 D10c 19.7105 0.0012 15.6138 0.0011 39.4019 0.0024 W 021STM-2 L9c 19.7060 0.0009 15.6118 0.0010 39.3912 0.0036 W 021STM-2a 19.7135 0.0013 15.6148 0.0011 39.4105 0.0028 D 021STM-2b 19.7302 0.0010 15.6189 0.0008 39.4295 0.0023 D 021
GeochemistryGeophysicsGeosystems G3G3
weis et al.: isotopic study of usgs reference materials 10.1029/2006GC001283
11 of 30
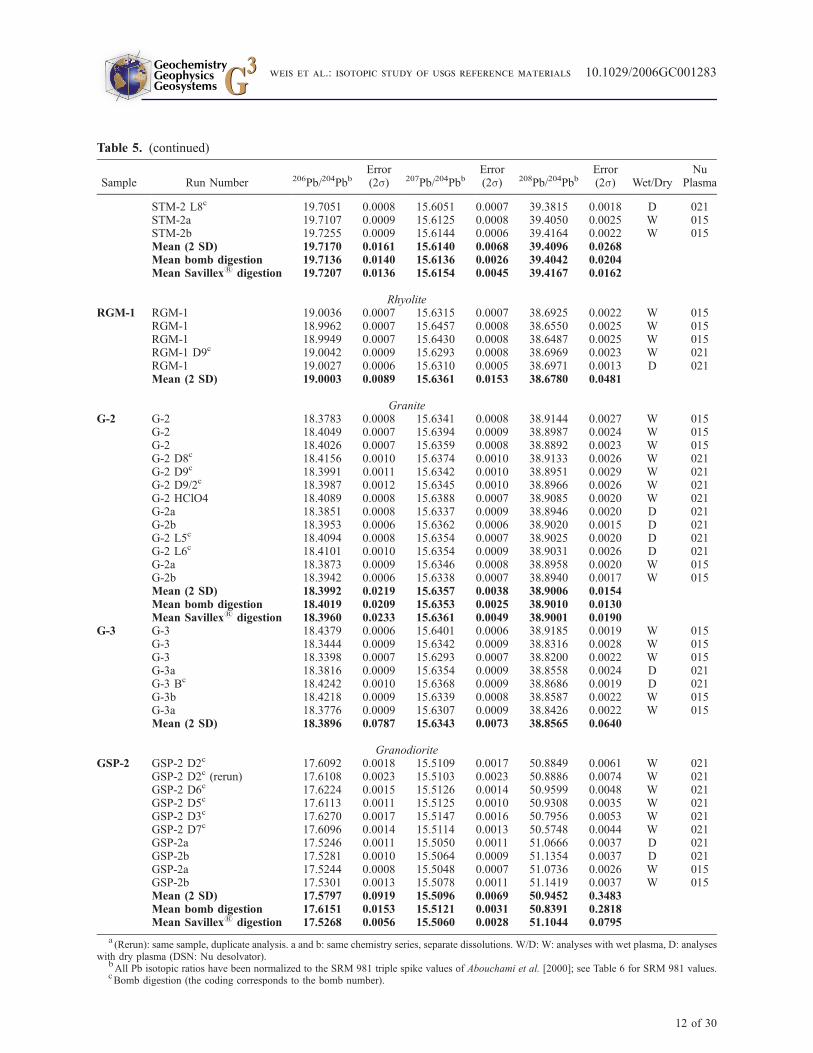
Table 5. (continued)
Sample Run Number 206Pb/204PbbError(2s) 207Pb/204Pbb
Error(2s) 208Pb/204Pbb
Error(2s) Wet/Dry
NuPlasma
STM-2 L8c 19.7051 0.0008 15.6051 0.0007 39.3815 0.0018 D 021STM-2a 19.7107 0.0009 15.6125 0.0008 39.4050 0.0025 W 015STM-2b 19.7255 0.0009 15.6144 0.0006 39.4164 0.0022 W 015Mean (2 SD) 19.7170 0.0161 15.6140 0.0068 39.4096 0.0268Mean bomb digestion 19.7136 0.0140 15.6136 0.0026 39.4042 0.0204Mean Savillex1 digestion 19.7207 0.0136 15.6154 0.0045 39.4167 0.0162
RhyoliteRGM-1 RGM-1 19.0036 0.0007 15.6315 0.0007 38.6925 0.0022 W 015
RGM-1 18.9962 0.0007 15.6457 0.0008 38.6550 0.0025 W 015RGM-1 18.9949 0.0007 15.6430 0.0008 38.6487 0.0025 W 015RGM-1 D9c 19.0042 0.0009 15.6293 0.0008 38.6969 0.0023 W 021RGM-1 19.0027 0.0006 15.6310 0.0005 38.6971 0.0013 D 021Mean (2 SD) 19.0003 0.0089 15.6361 0.0153 38.6780 0.0481
GraniteG-2 G-2 18.3783 0.0008 15.6341 0.0008 38.9144 0.0027 W 015
G-2 18.4049 0.0007 15.6394 0.0009 38.8987 0.0024 W 015G-2 18.4026 0.0007 15.6359 0.0008 38.8892 0.0023 W 015G-2 D8c 18.4156 0.0010 15.6374 0.0010 38.9133 0.0026 W 021G-2 D9c 18.3991 0.0011 15.6342 0.0010 38.8951 0.0029 W 021G-2 D9/2c 18.3987 0.0012 15.6345 0.0010 38.8966 0.0026 W 021G-2 HClO4 18.4089 0.0008 15.6388 0.0007 38.9085 0.0020 W 021G-2a 18.3851 0.0008 15.6337 0.0009 38.8946 0.0020 D 021G-2b 18.3953 0.0006 15.6362 0.0006 38.9020 0.0015 D 021G-2 L5c 18.4094 0.0008 15.6354 0.0007 38.9025 0.0020 D 021G-2 L6c 18.4101 0.0010 15.6354 0.0009 38.9031 0.0026 D 021G-2a 18.3873 0.0009 15.6346 0.0008 38.8958 0.0020 W 015G-2b 18.3942 0.0006 15.6338 0.0007 38.8940 0.0017 W 015Mean (2 SD) 18.3992 0.0219 15.6357 0.0038 38.9006 0.0154Mean bomb digestion 18.4019 0.0209 15.6353 0.0025 38.9010 0.0130Mean Savillex1 digestion 18.3960 0.0233 15.6361 0.0049 38.9001 0.0190
G-3 G-3 18.4379 0.0006 15.6401 0.0006 38.9185 0.0019 W 015G-3 18.3444 0.0009 15.6342 0.0009 38.8316 0.0028 W 015G-3 18.3398 0.0007 15.6293 0.0007 38.8200 0.0022 W 015G-3a 18.3816 0.0009 15.6354 0.0009 38.8558 0.0024 D 021G-3 Bc 18.4242 0.0010 15.6368 0.0009 38.8686 0.0019 D 021G-3b 18.4218 0.0009 15.6339 0.0008 38.8587 0.0022 W 015G-3a 18.3776 0.0009 15.6307 0.0009 38.8426 0.0022 W 015Mean (2 SD) 18.3896 0.0787 15.6343 0.0073 38.8565 0.0640
GranodioriteGSP-2 GSP-2 D2c 17.6092 0.0018 15.5109 0.0017 50.8849 0.0061 W 021
GSP-2 D2c (rerun) 17.6108 0.0023 15.5103 0.0023 50.8886 0.0074 W 021GSP-2 D6c 17.6224 0.0015 15.5126 0.0014 50.9599 0.0048 W 021GSP-2 D5c 17.6113 0.0011 15.5125 0.0010 50.9308 0.0035 W 021GSP-2 D3c 17.6270 0.0017 15.5147 0.0016 50.7956 0.0053 W 021GSP-2 D7c 17.6096 0.0014 15.5114 0.0013 50.5748 0.0044 W 021GSP-2a 17.5246 0.0011 15.5050 0.0011 51.0666 0.0037 D 021GSP-2b 17.5281 0.0010 15.5064 0.0009 51.1354 0.0037 D 021GSP-2a 17.5244 0.0008 15.5048 0.0007 51.0736 0.0026 W 015GSP-2b 17.5301 0.0013 15.5078 0.0011 51.1419 0.0037 W 015Mean (2 SD) 17.5797 0.0919 15.5096 0.0069 50.9452 0.3483Mean bomb digestion 17.6151 0.0153 15.5121 0.0031 50.8391 0.2818Mean Savillex1 digestion 17.5268 0.0056 15.5060 0.0028 51.1044 0.0795
a(Rerun): same sample, duplicate analysis. a and b: same chemistry series, separate dissolutions. W/D: W: analyses with wet plasma, D: analyses
with dry plasma (DSN: Nu desolvator).bAll Pb isotopic ratios have been normalized to the SRM 981 triple spike values of Abouchami et al. [2000]; see Table 6 for SRM 981 values.
cBomb digestion (the coding corresponds to the bomb number).
GeochemistryGeophysicsGeosystems G3G3
weis et al.: isotopic study of usgs reference materials 10.1029/2006GC001283
12 of 30
Table
6.
SRM
981PbIsotopic
Analyses(M
C-ICP-M
S):Averages
forIndividual
Days
Instrument
DateofAnalysis
Wet/Dry
206Pb/204Pb
2SDappm
b207Pb/204Pb
2SDappm
b208Pb/204Pb
2SDappm
b208Pb/206Pb
2SDa
ppm
b207Pb/206Pb
2SDa
ppm
b
Nu015
September
30,2003
W36.7191
0.0094
255
15.4977
0.0040
260
16.9403
0.0046
269
2.16756
0.00013
59
0.91483
0.00003
33
Novem
ber
10,2003
W36.7184
0.0083
226
15.4976
0.0034
219
16.9410
0.0031
180
2.16744
0.00019
89
0.91480
0.00005
53
Decem
ber
19,2003
W36.7136
0.0118
321
15.4963
0.0043
280
16.9398
0.0044
261
2.16729
0.00021
96
0.91479
0.00006
71
February16,2004
W36.7190
0.0084
229
15.4978
0.0029
190
16.9410
0.0037
216
2.16745
0.00014
67
0.91481
0.00004
44
August9,2004
W36.7195
0.0075
203
15.4979
0.0036
230
16.9413
0.0037
218
2.16747
0.00013
62
0.91480
0.00002
25
Nu021
September
12,2003
W36.7137
0.0034
93
15.4965
0.0012
76
16.9400
0.0016
96
2.16730
0.00009
43
0.91480
0.00003
28
September
19,2003
W36.7165
0.0041
111
15.4976
0.0014
87
16.9408
0.0012
73
2.16733
0.00005
24
0.91480
0.00001
15
March
24,2004
D36.7129
0.0079
215
15.4958
0.0033
210
16.9400
0.0036
212
2.16721
0.00013
59
0.91474
0.00005
53
July
1,2004
W36.7181
0.0078
212
15.4974
0.0027
173
16.9421
0.0030
176
2.16726
0.00013
58
0.91472
0.00003
33
July
2,2004
W36.7145
0.0062
168
15.4965
0.0024
156
16.9418
0.0026
155
2.16712
0.00013
61
0.91470
0.00003
33
July
7,2004
W36.7161
0.0080
217
15.4968
0.0032
204
16.9410
0.0033
193
2.16730
0.00017
79
0.91475
0.00006
67
July
9,2004
W36.7170
0.0070
189
15.4971
0.0027
174
16.9415
0.0034
203
2.16729
0.00008
37
0.91474
0.00003
30
July
27,2004
D36.7183
0.0072
197
15.4975
0.0030
192
16.9433
0.0030
176
2.16716
0.00010
46
0.91467
0.00004
43
July
28,2004
D36.7177
0.0046
126
15.4969
0.0019
124
16.9423
0.0021
124
2.16723
0.00009
44
0.91469
0.00003
33
August6,2004
D36.7114
0.0059
126
15.4958
0.0021
124
16.9392
0.0021
124
2.16725
0.00014
44
0.91479
0.00004
33
September
15,2004
D36.7131
0.0100
272
15.4961
0.0034
219
16.9398
0.0026
155
2.16726
0.00030
138
0.91477
0.00006
67
September
22,2004
W36.7138
0.0060
162
15.4965
0.0016
102
16.9398
0.0025
145
2.16734
0.00007
31
0.91481
0.00006
63
September
24,2004
D36.7108
0.0074
200
15.4955
0.0025
158
16.9392
0.0023
138
2.16722
0.00016
74
0.91477
0.00004
41
September
28,2004
D36.7115
0.0111
303
15.4956
0.0036
235
16.9398
0.0031
184
2.16721
0.00021
97
0.91476
0.00005
56
AverageNu015
n=65
36.7163
0.0121
328
15.4968
0.0047
303
16.9400
0.0049
287
2.16744
0.00025
114
0.91481
0.00005
56
AverageNu021
n=167
36.7145
0.0088
240
15.4964
0.0029
188
16.9407
0.0036
215
2.16724
0.00019
86
0.91475
0.00009
97
aThe2standarddeviationonthemeanoftheSRM
981analysesonagiven
day
(nvariesbetween12and20).
bTheppm
error.
GeochemistryGeophysicsGeosystems G3G3
weis et al.: isotopic study of usgs reference materials 10.1029/2006GC001283
13 of 30
87Sr/86Sr = 0.710248 relative to the barrel average.For each barrel of 21 filaments, 4 or 5 positionswere occupied by a reference material (SRM 987for Sr and La Jolla or Rennes for Nd). The averageof these 4 or 5 analyses corresponds to the barrelaverage. The normalization procedure has beenapplied to the Nd isotopic ratios for the La Jollaand Rennes reference materials, with a normaliza-tion value of 143Nd/144Nd = 0.511858 [Lugmair etal., 1983] and 0.511973 [Chauvel and Blichert-Toft, 2001], respectively.
[17] Sr and Nd isotopic compositions were mea-sured in static mode with relay matrix rotation (the‘‘virtual amplifier’’ of Finnigan) on a single Ta anddouble Re-Ta filament, respectively. The data werecorrected for mass fractionation by normalizing to
86Sr/88Sr = 0.1194 and 146Nd/144Nd = 0.7219,using an exponential law. Replicate analyses ofthe La Jolla Nd reference material on the TritonTIMS gave 0.511850 ± 15 (n = 73, where ncorresponds to the number of analyses) and then0.511853 ± 12 (n = 118) after one of the Faradaycups was changed. We also analyzed the RennesNd reference material [Chauvel and Blichert-Toft,2001] and obtained 143Nd/144Nd = 0.511970 ± 10(n = 10). Replicate analyses of the Sr referencematerial SRM 987 yielded 87Sr/86Sr values of0.710256 ± 16 (n = 145) and then 0.710252 ± 13(n = 88) after one of the Faraday cups waschanged. Usually, a single analysis consisted ofminimum of 135 ratios (9 blocks of 15 cycles) toallow for a full rotation of the virtual amplifier.
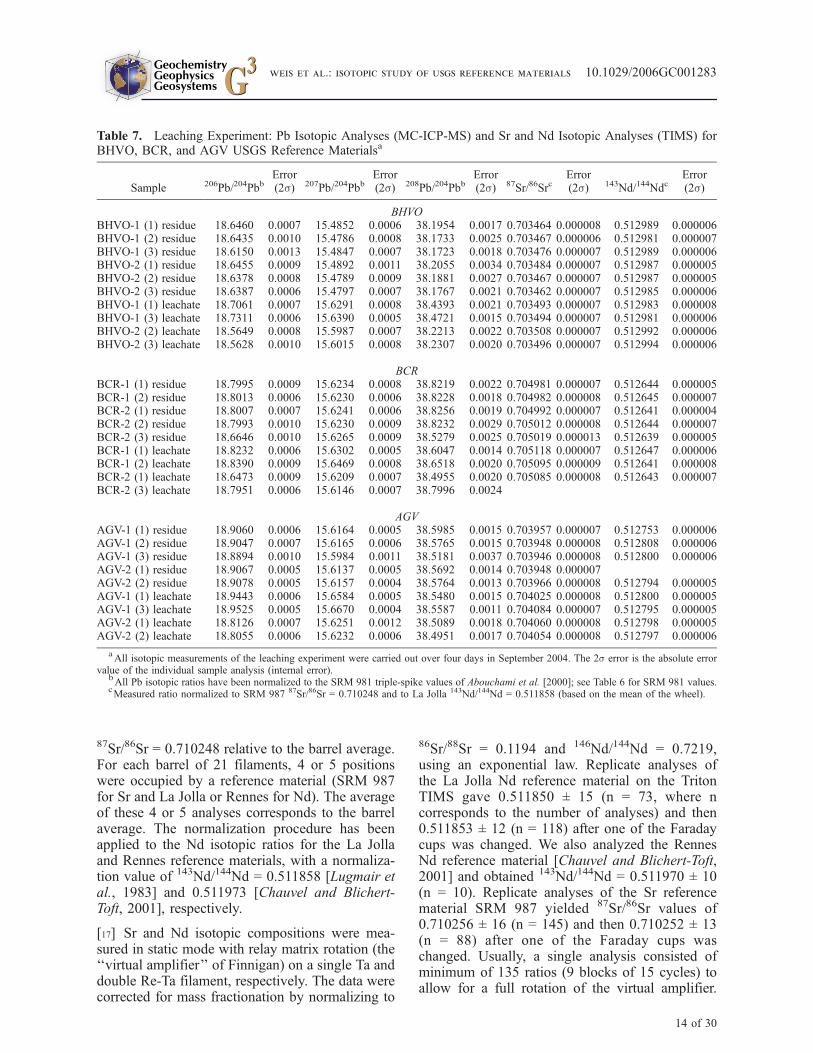
Table 7. Leaching Experiment: Pb Isotopic Analyses (MC-ICP-MS) and Sr and Nd Isotopic Analyses (TIMS) forBHVO, BCR, and AGV USGS Reference Materialsa
Sample 206Pb/204PbbError(2s) 207Pb/204Pbb
Error(2s) 208Pb/204Pbb
Error(2s) 87Sr/86Src
Error(2s) 143Nd/144Ndc
Error(2s)
BHVOBHVO-1 (1) residue 18.6460 0.0007 15.4852 0.0006 38.1954 0.0017 0.703464 0.000008 0.512989 0.000006BHVO-1 (2) residue 18.6435 0.0010 15.4786 0.0008 38.1733 0.0025 0.703467 0.000006 0.512981 0.000007BHVO-1 (3) residue 18.6150 0.0013 15.4847 0.0007 38.1723 0.0018 0.703476 0.000007 0.512989 0.000006BHVO-2 (1) residue 18.6455 0.0009 15.4892 0.0011 38.2055 0.0034 0.703484 0.000007 0.512987 0.000005BHVO-2 (2) residue 18.6378 0.0008 15.4789 0.0009 38.1881 0.0027 0.703467 0.000007 0.512987 0.000005BHVO-2 (3) residue 18.6387 0.0006 15.4797 0.0007 38.1767 0.0021 0.703462 0.000007 0.512985 0.000006BHVO-1 (1) leachate 18.7061 0.0007 15.6291 0.0008 38.4393 0.0021 0.703493 0.000007 0.512983 0.000008BHVO-1 (3) leachate 18.7311 0.0006 15.6390 0.0005 38.4721 0.0015 0.703494 0.000007 0.512981 0.000006BHVO-2 (2) leachate 18.5649 0.0008 15.5987 0.0007 38.2213 0.0022 0.703508 0.000007 0.512992 0.000006BHVO-2 (3) leachate 18.5628 0.0010 15.6015 0.0008 38.2307 0.0020 0.703496 0.000007 0.512994 0.000006
BCRBCR-1 (1) residue 18.7995 0.0009 15.6234 0.0008 38.8219 0.0022 0.704981 0.000007 0.512644 0.000005BCR-1 (2) residue 18.8013 0.0006 15.6230 0.0006 38.8228 0.0018 0.704982 0.000008 0.512645 0.000007BCR-2 (1) residue 18.8007 0.0007 15.6241 0.0006 38.8256 0.0019 0.704992 0.000007 0.512641 0.000004BCR-2 (2) residue 18.7993 0.0010 15.6230 0.0009 38.8232 0.0029 0.705012 0.000008 0.512644 0.000007BCR-2 (3) residue 18.6646 0.0010 15.6265 0.0009 38.5279 0.0025 0.705019 0.000013 0.512639 0.000005BCR-1 (1) leachate 18.8232 0.0006 15.6302 0.0005 38.6047 0.0014 0.705118 0.000007 0.512647 0.000006BCR-1 (2) leachate 18.8390 0.0009 15.6469 0.0008 38.6518 0.0020 0.705095 0.000009 0.512641 0.000008BCR-2 (1) leachate 18.6473 0.0009 15.6209 0.0007 38.4955 0.0020 0.705085 0.000008 0.512643 0.000007BCR-2 (3) leachate 18.7951 0.0006 15.6146 0.0007 38.7996 0.0024
AGVAGV-1 (1) residue 18.9060 0.0006 15.6164 0.0005 38.5985 0.0015 0.703957 0.000007 0.512753 0.000006AGV-1 (2) residue 18.9047 0.0007 15.6165 0.0006 38.5765 0.0015 0.703948 0.000008 0.512808 0.000006AGV-1 (3) residue 18.8894 0.0010 15.5984 0.0011 38.5181 0.0037 0.703946 0.000008 0.512800 0.000006AGV-2 (1) residue 18.9067 0.0005 15.6137 0.0005 38.5692 0.0014 0.703948 0.000007AGV-2 (2) residue 18.9078 0.0005 15.6157 0.0004 38.5764 0.0013 0.703966 0.000008 0.512794 0.000005AGV-1 (1) leachate 18.9443 0.0006 15.6584 0.0005 38.5480 0.0015 0.704025 0.000008 0.512800 0.000005AGV-1 (3) leachate 18.9525 0.0005 15.6670 0.0004 38.5587 0.0011 0.704084 0.000007 0.512795 0.000005AGV-2 (1) leachate 18.8126 0.0007 15.6251 0.0012 38.5089 0.0018 0.704060 0.000008 0.512798 0.000005AGV-2 (2) leachate 18.8055 0.0006 15.6232 0.0006 38.4951 0.0017 0.704054 0.000008 0.512797 0.000006
aAll isotopic measurements of the leaching experiment were carried out over four days in September 2004. The 2s error is the absolute error
value of the individual sample analysis (internal error).bAll Pb isotopic ratios have been normalized to the SRM 981 triple-spike values of Abouchami et al. [2000]; see Table 6 for SRM 981 values.
cMeasured ratio normalized to SRM 987 87Sr/86Sr = 0.710248 and to La Jolla 143Nd/144Nd = 0.511858 (based on the mean of the wheel).
GeochemistryGeophysicsGeosystems G3G3
weis et al.: isotopic study of usgs reference materials 10.1029/2006GC001283
14 of 30
Note that with the new version of the Finnigansoftware (version 3.0 and higher), the number ofblocks must match the number of collectors used,i.e., 5 for Sr and 8 for Nd. Four or five standardsare loaded per 21 sample barrel.
[18] Nd isotopic compositions were also measuredon the Nu Plasma, by static multicollection withFaraday cups on aliquots of the same samplesolutions used for TIMS analyses and on separatedissolutions. Instrument parameters and collectorconfigurations are summarized in Tables 1a, 1b,and 2. Each analysis consisted of 60 ratios (3blocks of 20 cycles), resulting in a 12–13 minuteduration of data collection for each individualanalysis. Wash-out time and time for standardreplicates after every second sample resulted inan average instrument time of 30 min per sample.All Nd isotopes (150, 148, 146, 145, 144, 143,142) were measured, while simultaneously moni-toring masses 147 (Sm) and 140 (Ce) (Table 1b),allowing for interference corrections on masses144, 148 and 150 (Sm) and 142 (Ce). Except forCe, all other interference corrections were entirelynegligible (e.g., fraction of a mV on 147Sm). Ndisotope measurements were normalized internallyto the values reported above for the Triton TIMSmeasurements, on the basis of the daily mean of
the La Jolla or Rennes reference material analyses.The 144Sm, 148Sm, 150Sm and 142Ce correctionswere made using natural isotopic abundances(144Sm = 0.030734, 147Sm = 0.149934, 148Sm =0.112406, 150Sm = 0.073796, 140Ce = 0.88449,142Ce = 0.11114 [Rosman and Taylor, 1998])corrected for instrumental mass discrimination us-ing an exponential law as monitored by the146Nd/144Nd ratio.
[19] During the period of data collection, the aver-age value measured for the La Jolla referencematerial on the Nu Plasma was 0.511856 ± 15(n = 59) for 143Nd/144Nd and the average for theRennes Nd reference material was 0.511969 ± 13(n = 45). This demonstrates the excellent agree-ment between the MC-ICP-MS and the TIMSinstruments. To achieve comparable precision, theamount of material needed for Nd isotopic analyseson the MC-ICP-MS is about double (200–400 ng)for a wet plasma analysis than that for a TIMS ordry plasma analysis (100–150 ng).
[20] Pb isotopic compositions were analyzed bystatic multicollection. The collector array on the NuPlasma is fixed and a zoom lens is employed toposition the masses in the collectors. For Pb, thecentral collectors (H4-L2) are 1 amu apart and theouter collectors (H6, H5, L3, L4 and L5) are 2 amu
Table 8. Pb Concentrations by Isotope Dilution for USGS Reference Materialsa
Sample Pb, ppm 2s Sample Pb, ppm 2s
BCR-1 BCR-2BCR-1 A 13.16 0.22 BCR-2 A 10.31 0.15BCR-1 B 13.36 0.16 BCR-2 B 12.35 0.15BCR-1 C 13.07 0.15 BCR-2 C 10.11 0.08BCR-1 D 13.79 0.14 BCR-2 C (rerun) 10.14 0.08Mean 13.34 0.64 BCR-2 D 12.21 0.13
Mean 11.02 2.30
AGV-1 AGV-2AGV-1 A 33.01 1.47 AGV-2 A 13.39 0.20AGV-1 B 37.79 1.18 AGV-2 B 12.53 0.20AGV-1 C 40.52 0.81 AGV-2 C 13.59 0.13AGV-1 D 40.46 0.76 AGV-2 D 13.07 0.13AGV-1 E 37.11 0.68 Mean 13.15 0.93AGV-1 F 35.26 0.60Mean 37.36 5.88
BHVO-1 BHVO-2BHVO-1 A 2.46 0.01 BHVO-2 A 1.62 0.01BHVO-1 B 1.98 0.01 BHVO-2 B 1.54 0.01BHVO-1 C 2.02 0.01 BHVO-2 C 1.32 0.01BHVO-1 D 1.99 0.01 BHVO-2 D 1.48 0.01BHVO-1 E 2.04 0.01 BHVO-2 E 1.42 0.01BHVO-1 F 2.05 0.02 BHVO-2 F 1.62 0.01Mean 2.09 0.37 BHVO-2 F (rerun) 1.63 0.01
Mean 1.52 0.24
a(Rerun): same filament.
GeochemistryGeophysicsGeosystems G3G3
weis et al.: isotopic study of usgs reference materials 10.1029/2006GC001283
15 of 30
apart. Therefore masses 208 to 202 are measured incollectors H4 to L2 (Table 1b). The configurationfor Pb isotopic analyses enables simultaneouscollection of Pb (208, 207, 206 and 204) togetherwith Tl (205 and 203) and Hg (202). Tl is used tomonitor and correct for instrumental mass discrim-ination and Hg is used to correct for the isobaricoverlap of 204Hg on 204Pb. The 204Hg correctionwas made using natural abundances (202Hg =0.29863 and 204Hg = 0.06865) adjusted for instru-mental mass fractionation as monitored by the205Tl/203Tl ratio. Ion beam intensities for 202Hg
were always below 0.3 mV for all runs (excepttwo), corresponding to a correction of less than 0.2(0.07) mV on the 204 mass (always >53 mV).
[21] To improve the reproducibility of the analyt-ical conditions for the Pb isotopic compositions,and thus the precision and the accuracy (i.e., betterprecision on 205Tl/203Tl and less interference on204Pb), all sample solutions were analyzed with thesame [Pb]/[Tl] ratio (�4) as the NIST SRM 981reference material. To accomplish this, a smallaliquot of each sample was analyzed using theThermo Finnigan Element2 HR-ICP-MS to deter-
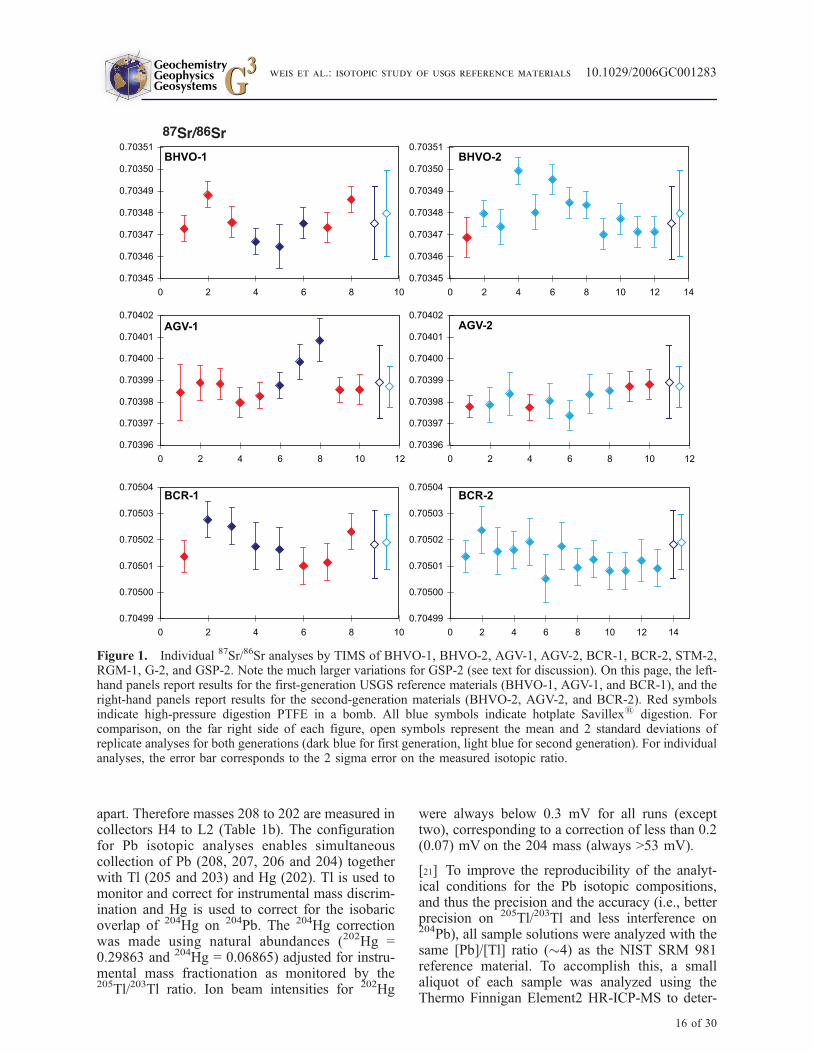
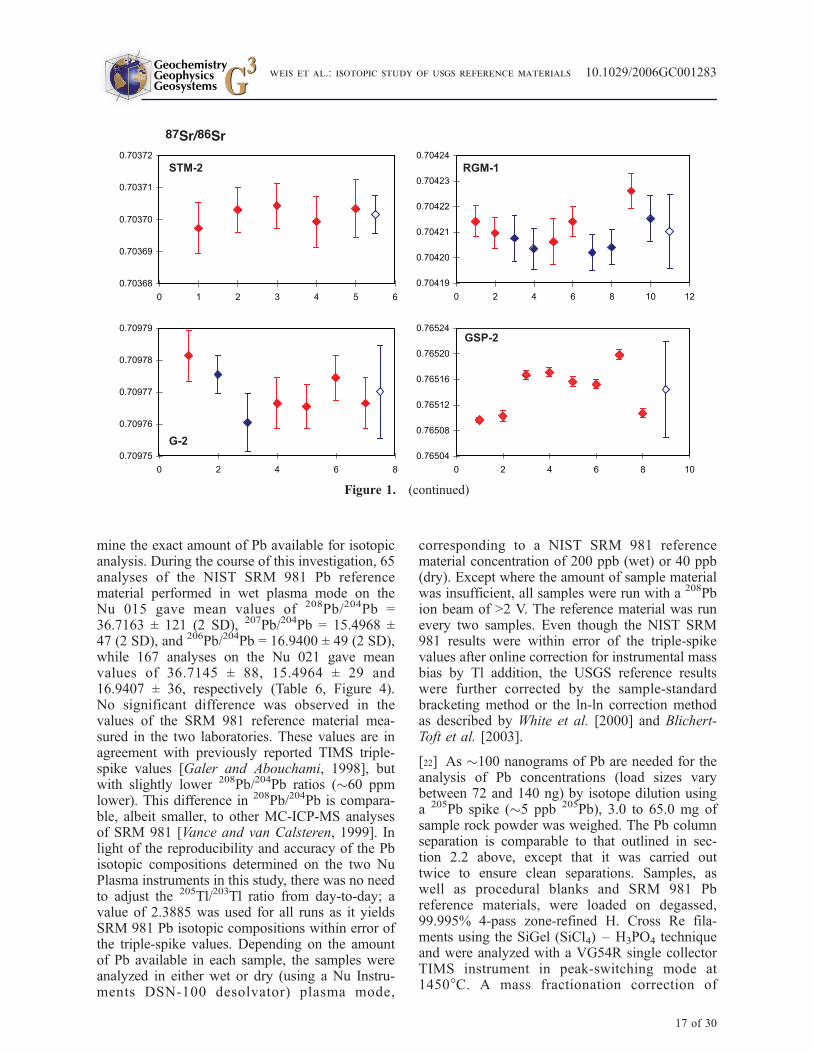
Figure 1. Individual 87Sr/86Sr analyses by TIMS of BHVO-1, BHVO-2, AGV-1, AGV-2, BCR-1, BCR-2, STM-2,RGM-1, G-2, and GSP-2. Note the much larger variations for GSP-2 (see text for discussion). On this page, the left-hand panels report results for the first-generation USGS reference materials (BHVO-1, AGV-1, and BCR-1), and theright-hand panels report results for the second-generation materials (BHVO-2, AGV-2, and BCR-2). Red symbolsindicate high-pressure digestion PTFE in a bomb. All blue symbols indicate hotplate Savillex1 digestion. Forcomparison, on the far right side of each figure, open symbols represent the mean and 2 standard deviations ofreplicate analyses for both generations (dark blue for first generation, light blue for second generation). For individualanalyses, the error bar corresponds to the 2 sigma error on the measured isotopic ratio.
GeochemistryGeophysicsGeosystems G3G3
weis et al.: isotopic study of usgs reference materials 10.1029/2006GC001283
16 of 30
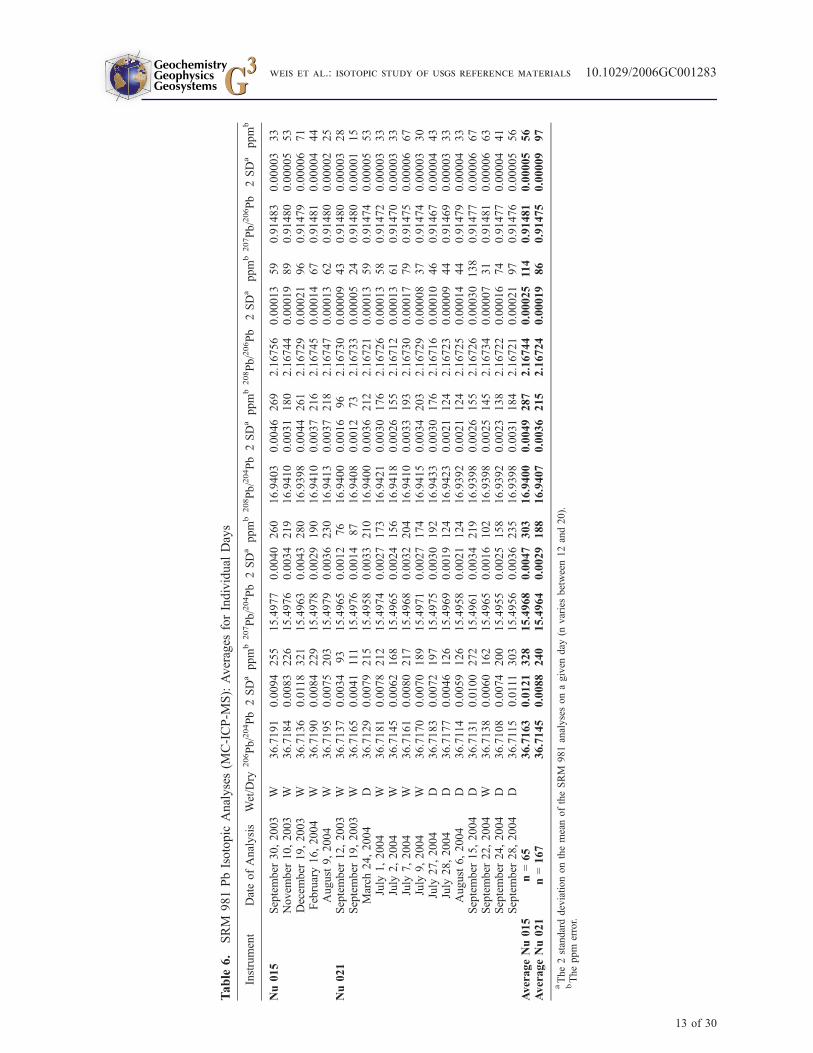
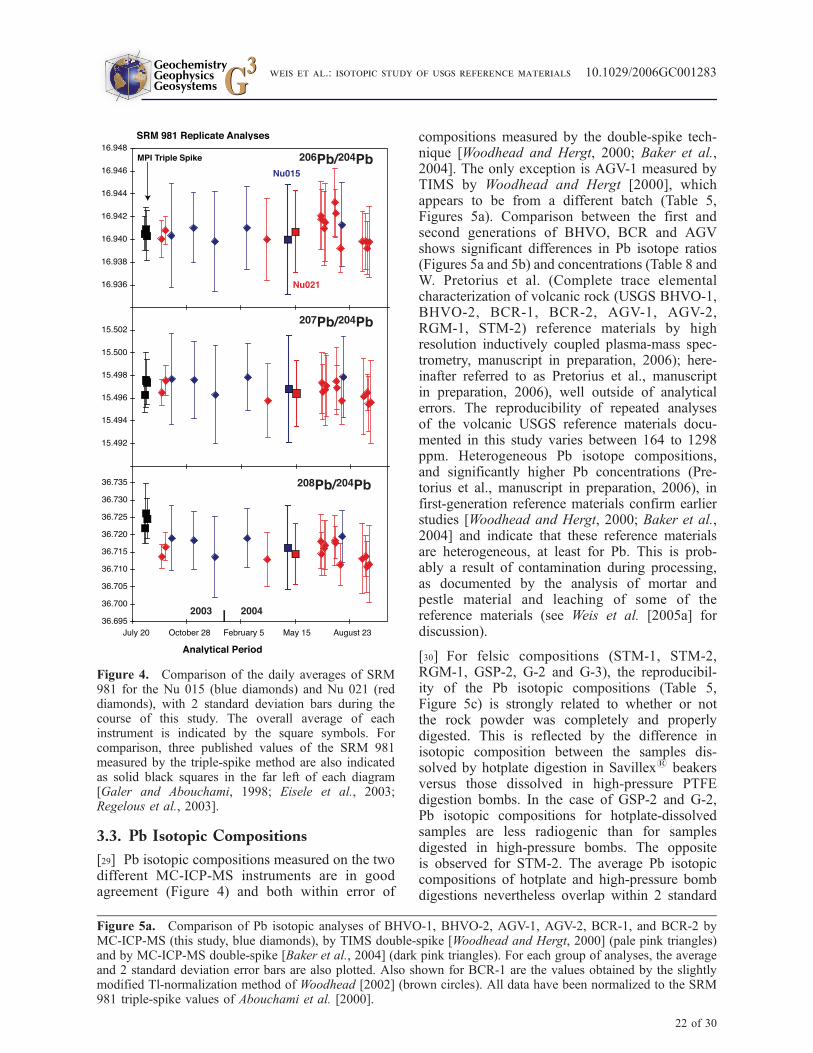
mine the exact amount of Pb available for isotopicanalysis. During the course of this investigation, 65analyses of the NIST SRM 981 Pb referencematerial performed in wet plasma mode on theNu 015 gave mean values of 208Pb/204Pb =36.7163 ± 121 (2 SD), 207Pb/204Pb = 15.4968 ±47 (2 SD), and 206Pb/204Pb = 16.9400 ± 49 (2 SD),while 167 analyses on the Nu 021 gave meanvalues of 36.7145 ± 88, 15.4964 ± 29 and16.9407 ± 36, respectively (Table 6, Figure 4).No significant difference was observed in thevalues of the SRM 981 reference material mea-sured in the two laboratories. These values are inagreement with previously reported TIMS triple-spike values [Galer and Abouchami, 1998], butwith slightly lower 208Pb/204Pb ratios (�60 ppmlower). This difference in 208Pb/204Pb is compara-ble, albeit smaller, to other MC-ICP-MS analysesof SRM 981 [Vance and van Calsteren, 1999]. Inlight of the reproducibility and accuracy of the Pbisotopic compositions determined on the two NuPlasma instruments in this study, there was no needto adjust the 205Tl/203Tl ratio from day-to-day; avalue of 2.3885 was used for all runs as it yieldsSRM 981 Pb isotopic compositions within error ofthe triple-spike values. Depending on the amountof Pb available in each sample, the samples wereanalyzed in either wet or dry (using a Nu Instru-ments DSN-100 desolvator) plasma mode,
corresponding to a NIST SRM 981 referencematerial concentration of 200 ppb (wet) or 40 ppb(dry). Except where the amount of sample materialwas insufficient, all samples were run with a 208Pbion beam of >2 V. The reference material was runevery two samples. Even though the NIST SRM981 results were within error of the triple-spikevalues after online correction for instrumental massbias by Tl addition, the USGS reference resultswere further corrected by the sample-standardbracketing method or the ln-ln correction methodas described by White et al. [2000] and Blichert-Toft et al. [2003].
[22] As �100 nanograms of Pb are needed for theanalysis of Pb concentrations (load sizes varybetween 72 and 140 ng) by isotope dilution usinga 205Pb spike (�5 ppb 205Pb), 3.0 to 65.0 mg ofsample rock powder was weighed. The Pb columnseparation is comparable to that outlined in sec-tion 2.2 above, except that it was carried outtwice to ensure clean separations. Samples, aswell as procedural blanks and SRM 981 Pbreference materials, were loaded on degassed,99.995% 4-pass zone-refined H. Cross Re fila-ments using the SiGel (SiCl4) – H3PO4 techniqueand were analyzed with a VG54R single collectorTIMS instrument in peak-switching mode at1450�C. A mass fractionation correction of
Figure 1. (continued)
GeochemistryGeophysicsGeosystems G3G3
weis et al.: isotopic study of usgs reference materials 10.1029/2006GC001283
17 of 30
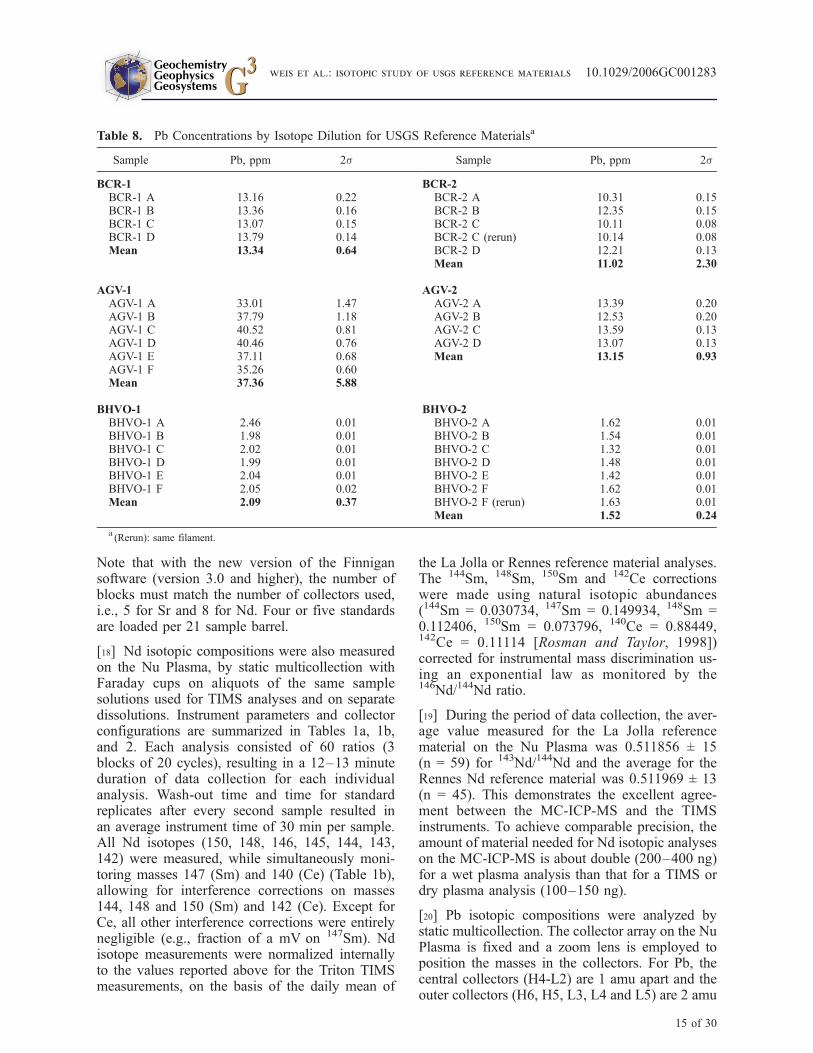
0.12%/amu was applied on the basis of repeatedSRM 981 analyses conducted throughout thecourse of the study. An average procedural blankof 75 pg is based on 5 determinations during thecourse of the study, negligible in comparison tothe sample Pb concentration. Individual blanksranged from 56–84 pg, with 208Pb/204Pb =37.73, 207Pb/204Pb = 15.59 and 206Pb/204Pb =18.33, all ±3% (1 SD). Reported concentrationsare spike- and blank-corrected (0.06–0.12% ofthe total) (Table 8).
2.4. Leaching Experiment
[23] A preliminary study of BHVO-1 and BHVO-2[Weis et al., 2005a] showed clear differences in Pbisotopic composition and trace metal concentra-tions between the two generations of USGS refer-ence materials, confirming the earlier findings ofWoodhead and Hergt [2000]. The differences couldbe ascribed to contamination of the rock powdersduring processing (crushing, pulverization). Werepeated these careful experiments here, on
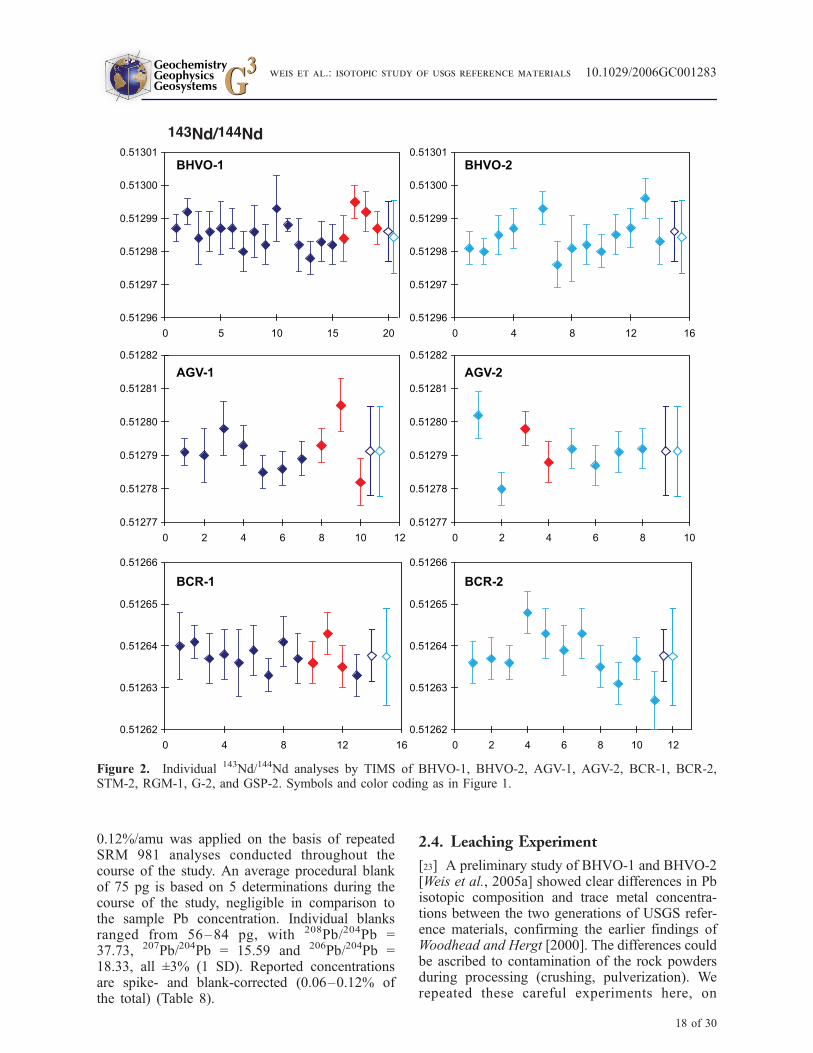
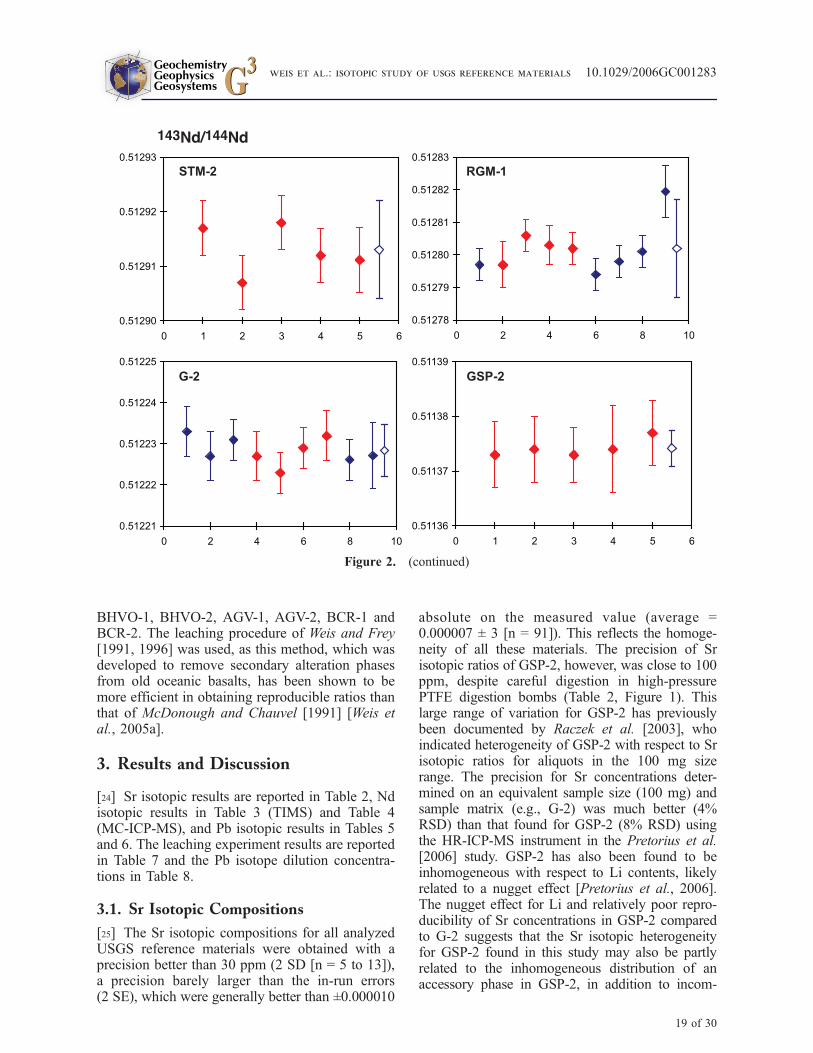
Figure 2. Individual 143Nd/144Nd analyses by TIMS of BHVO-1, BHVO-2, AGV-1, AGV-2, BCR-1, BCR-2,STM-2, RGM-1, G-2, and GSP-2. Symbols and color coding as in Figure 1.
GeochemistryGeophysicsGeosystems G3G3
weis et al.: isotopic study of usgs reference materials 10.1029/2006GC001283
18 of 30
BHVO-1, BHVO-2, AGV-1, AGV-2, BCR-1 andBCR-2. The leaching procedure of Weis and Frey[1991, 1996] was used, as this method, which wasdeveloped to remove secondary alteration phasesfrom old oceanic basalts, has been shown to bemore efficient in obtaining reproducible ratios thanthat of McDonough and Chauvel [1991] [Weis etal., 2005a].
3. Results and Discussion
[24] Sr isotopic results are reported in Table 2, Ndisotopic results in Table 3 (TIMS) and Table 4(MC-ICP-MS), and Pb isotopic results in Tables 5and 6. The leaching experiment results are reportedin Table 7 and the Pb isotope dilution concentra-tions in Table 8.
3.1. Sr Isotopic Compositions
[25] The Sr isotopic compositions for all analyzedUSGS reference materials were obtained with aprecision better than 30 ppm (2 SD [n = 5 to 13]),a precision barely larger than the in-run errors(2 SE), which were generally better than ±0.000010
absolute on the measured value (average =0.000007 ± 3 [n = 91]). This reflects the homoge-neity of all these materials. The precision of Srisotopic ratios of GSP-2, however, was close to 100ppm, despite careful digestion in high-pressurePTFE digestion bombs (Table 2, Figure 1). Thislarge range of variation for GSP-2 has previouslybeen documented by Raczek et al. [2003], whoindicated heterogeneity of GSP-2 with respect to Srisotopic ratios for aliquots in the 100 mg sizerange. The precision for Sr concentrations deter-mined on an equivalent sample size (100 mg) andsample matrix (e.g., G-2) was much better (4%RSD) than that found for GSP-2 (8% RSD) usingthe HR-ICP-MS instrument in the Pretorius et al.[2006] study. GSP-2 has also been found to beinhomogeneous with respect to Li contents, likelyrelated to a nugget effect [Pretorius et al., 2006].The nugget effect for Li and relatively poor repro-ducibility of Sr concentrations in GSP-2 comparedto G-2 suggests that the Sr isotopic heterogeneityfor GSP-2 found in this study may also be partlyrelated to the inhomogeneous distribution of anaccessory phase in GSP-2, in addition to incom-
Figure 2. (continued)
GeochemistryGeophysicsGeosystems G3G3
weis et al.: isotopic study of usgs reference materials 10.1029/2006GC001283
19 of 30
plete recovery of Sr. Thus GSP-2 is a somewhatpoor choice for a reference material for Sr.
[26] The largest difference for Sr isotopic ratios is11 ppm between AGV-1 and AGV-2, whereas it is7 ppm between BCR-1 and BCR-2 and 6 ppmbetween BHVO-1 and BHVO-2 (Figure 1). Takinginto account the difference in NIST SRM 987standard values (e.g., 0.710203 ± 34 (n = 24) forRaczek et al. [2003] versus 0.710256 ± 16 (n =145) and 0.710252 ± 13 (n = 88) after the changeof one of the Faraday cups in this study), our
results agree entirely with those of Raczek et al.[2003].
3.2. Nd Isotopic Compositions
[27] For Nd isotopic compositions analyzed byTIMS (Table 3, Figure 2), the in-run errors (2SE) are more comparable (average = 0.000006 ±3 [n = 103]) than for Sr. For 143Nd/144Nd, the 2standard deviations are all below 30 ppm. Ndisotopic ratios of GSP-2 are as reproducible asthose of the other USGS reference materials. We
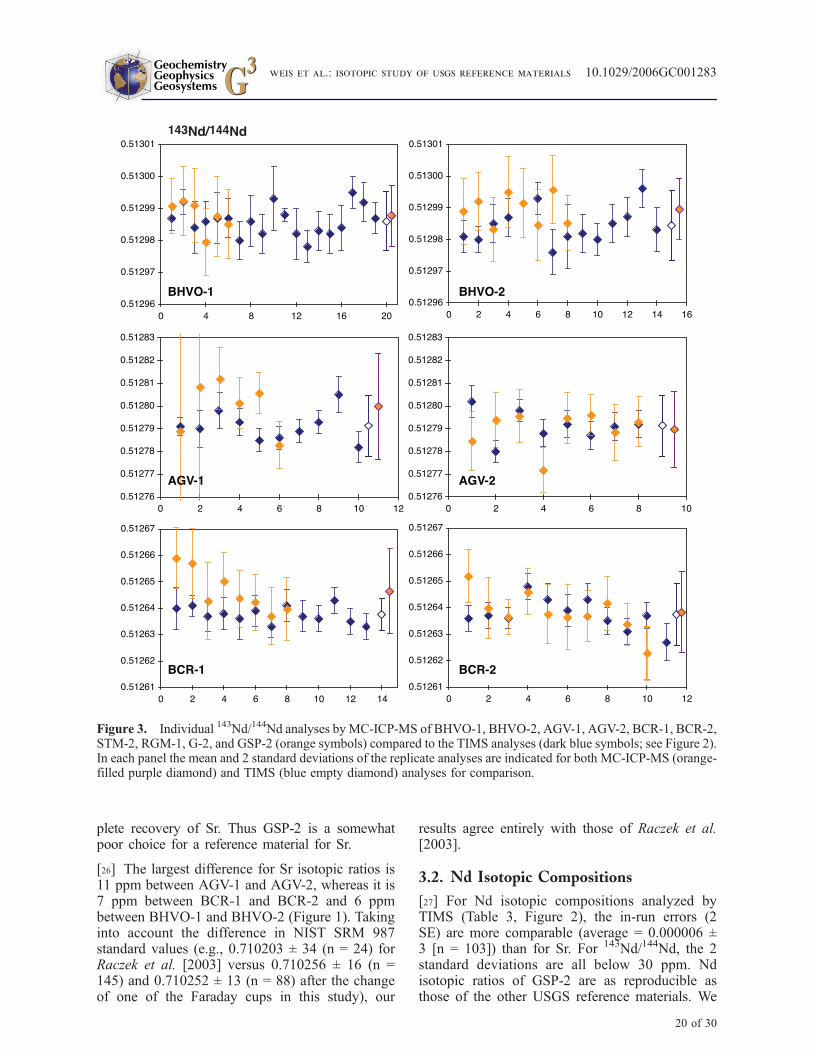
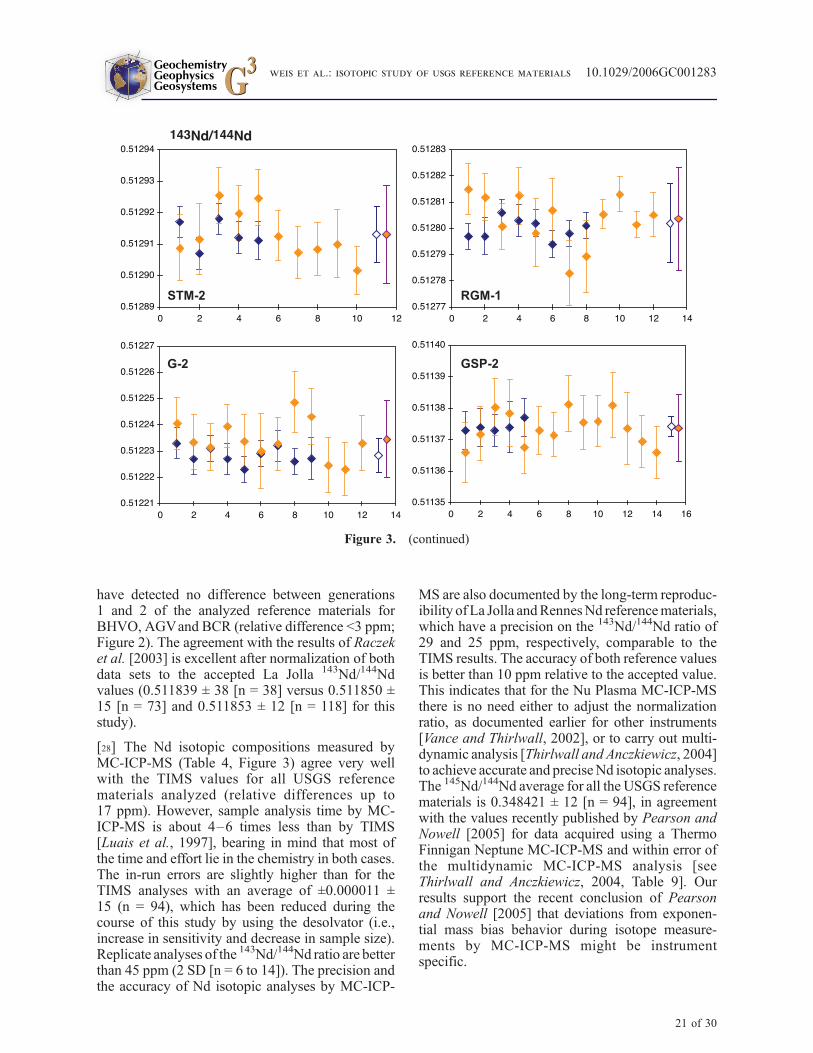
Figure 3. Individual 143Nd/144Nd analyses by MC-ICP-MS of BHVO-1, BHVO-2, AGV-1, AGV-2, BCR-1, BCR-2,STM-2, RGM-1, G-2, and GSP-2 (orange symbols) compared to the TIMS analyses (dark blue symbols; see Figure 2).In each panel the mean and 2 standard deviations of the replicate analyses are indicated for both MC-ICP-MS (orange-filled purple diamond) and TIMS (blue empty diamond) analyses for comparison.
GeochemistryGeophysicsGeosystems G3G3
weis et al.: isotopic study of usgs reference materials 10.1029/2006GC001283
20 of 30
have detected no difference between generations1 and 2 of the analyzed reference materials forBHVO, AGVand BCR (relative difference <3 ppm;Figure 2). The agreement with the results of Raczeket al. [2003] is excellent after normalization of bothdata sets to the accepted La Jolla 143Nd/144Ndvalues (0.511839 ± 38 [n = 38] versus 0.511850 ±15 [n = 73] and 0.511853 ± 12 [n = 118] for thisstudy).
[28] The Nd isotopic compositions measured byMC-ICP-MS (Table 4, Figure 3) agree very wellwith the TIMS values for all USGS referencematerials analyzed (relative differences up to17 ppm). However, sample analysis time by MC-ICP-MS is about 4–6 times less than by TIMS[Luais et al., 1997], bearing in mind that most ofthe time and effort lie in the chemistry in both cases.The in-run errors are slightly higher than for theTIMS analyses with an average of ±0.000011 ±15 (n = 94), which has been reduced during thecourse of this study by using the desolvator (i.e.,increase in sensitivity and decrease in sample size).Replicate analyses of the 143Nd/144Nd ratio are betterthan 45 ppm (2 SD [n = 6 to 14]). The precision andthe accuracy of Nd isotopic analyses by MC-ICP-
MS are also documented by the long-term reproduc-ibility of La Jolla andRennesNd referencematerials,which have a precision on the 143Nd/144Nd ratio of29 and 25 ppm, respectively, comparable to theTIMS results. The accuracy of both reference valuesis better than 10 ppm relative to the accepted value.This indicates that for the Nu Plasma MC-ICP-MSthere is no need either to adjust the normalizationratio, as documented earlier for other instruments[Vance and Thirlwall, 2002], or to carry out multi-dynamic analysis [Thirlwall and Anczkiewicz, 2004]to achieve accurate and preciseNd isotopic analyses.The 145Nd/144Nd average for all the USGS referencematerials is 0.348421 ± 12 [n = 94], in agreementwith the values recently published by Pearson andNowell [2005] for data acquired using a ThermoFinnigan Neptune MC-ICP-MS and within error ofthe multidynamic MC-ICP-MS analysis [seeThirlwall and Anczkiewicz, 2004, Table 9]. Ourresults support the recent conclusion of Pearsonand Nowell [2005] that deviations from exponen-tial mass bias behavior during isotope measure-ments by MC-ICP-MS might be instrumentspecific.
Figure 3. (continued)
GeochemistryGeophysicsGeosystems G3G3
weis et al.: isotopic study of usgs reference materials 10.1029/2006GC001283
21 of 30
3.3. Pb Isotopic Compositions
[29] Pb isotopic compositions measured on the twodifferent MC-ICP-MS instruments are in goodagreement (Figure 4) and both within error of
compositions measured by the double-spike tech-nique [Woodhead and Hergt, 2000; Baker et al.,2004]. The only exception is AGV-1 measured byTIMS by Woodhead and Hergt [2000], whichappears to be from a different batch (Table 5,Figures 5a). Comparison between the first andsecond generations of BHVO, BCR and AGVshows significant differences in Pb isotope ratios(Figures 5a and 5b) and concentrations (Table 8 andW. Pretorius et al. (Complete trace elementalcharacterization of volcanic rock (USGS BHVO-1,BHVO-2, BCR-1, BCR-2, AGV-1, AGV-2,RGM-1, STM-2) reference materials by highresolution inductively coupled plasma-mass spec-trometry, manuscript in preparation, 2006); here-inafter referred to as Pretorius et al., manuscriptin preparation, 2006), well outside of analyticalerrors. The reproducibility of repeated analysesof the volcanic USGS reference materials docu-mented in this study varies between 164 to 1298ppm. Heterogeneous Pb isotope compositions,and significantly higher Pb concentrations (Pre-torius et al., manuscript in preparation, 2006), infirst-generation reference materials confirm earlierstudies [Woodhead and Hergt, 2000; Baker et al.,2004] and indicate that these reference materialsare heterogeneous, at least for Pb. This is prob-ably a result of contamination during processing,as documented by the analysis of mortar andpestle material and leaching of some of thereference materials (see Weis et al. [2005a] fordiscussion).
[30] For felsic compositions (STM-1, STM-2,RGM-1, GSP-2, G-2 and G-3), the reproducibil-ity of the Pb isotopic compositions (Table 5,Figure 5c) is strongly related to whether or notthe rock powder was completely and properlydigested. This is reflected by the difference inisotopic composition between the samples dis-solved by hotplate digestion in Savillex1 beakersversus those dissolved in high-pressure PTFEdigestion bombs. In the case of GSP-2 and G-2,Pb isotopic compositions for hotplate-dissolvedsamples are less radiogenic than for samplesdigested in high-pressure bombs. The oppositeis observed for STM-2. The average Pb isotopiccompositions of hotplate and high-pressure bombdigestions nevertheless overlap within 2 standard
Figure 4. Comparison of the daily averages of SRM981 for the Nu 015 (blue diamonds) and Nu 021 (reddiamonds), with 2 standard deviation bars during thecourse of this study. The overall average of eachinstrument is indicated by the square symbols. Forcomparison, three published values of the SRM 981measured by the triple-spike method are also indicatedas solid black squares in the far left of each diagram[Galer and Abouchami, 1998; Eisele et al., 2003;Regelous et al., 2003].
Figure 5a. Comparison of Pb isotopic analyses of BHVO-1, BHVO-2, AGV-1, AGV-2, BCR-1, and BCR-2 byMC-ICP-MS (this study, blue diamonds), by TIMS double-spike [Woodhead and Hergt, 2000] (pale pink triangles)and by MC-ICP-MS double-spike [Baker et al., 2004] (dark pink triangles). For each group of analyses, the averageand 2 standard deviation error bars are also plotted. Also shown for BCR-1 are the values obtained by the slightlymodified Tl-normalization method of Woodhead [2002] (brown circles). All data have been normalized to the SRM981 triple-spike values of Abouchami et al. [2000].
GeochemistryGeophysicsGeosystems G3G3
weis et al.: isotopic study of usgs reference materials 10.1029/2006GC001283
22 of 30
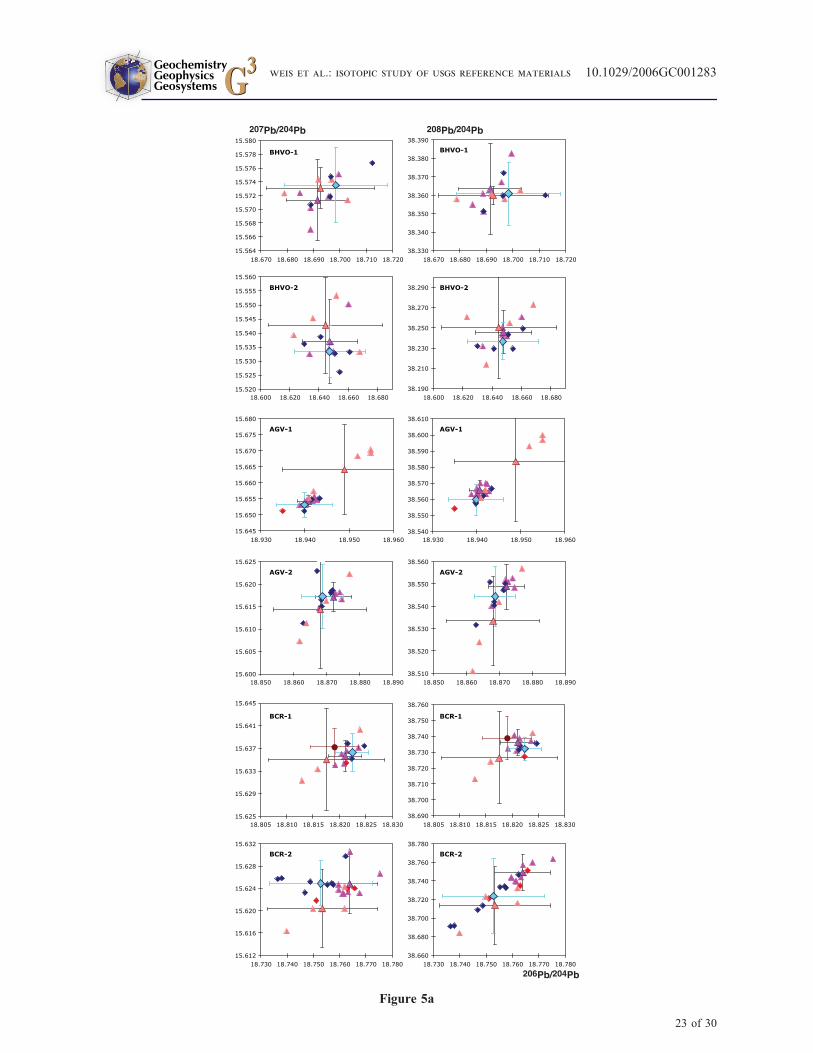
Figure 5a
GeochemistryGeophysicsGeosystems G3G3
weis et al.: isotopic study of usgs reference materials 10.1029/2006GC001283
23 of 30
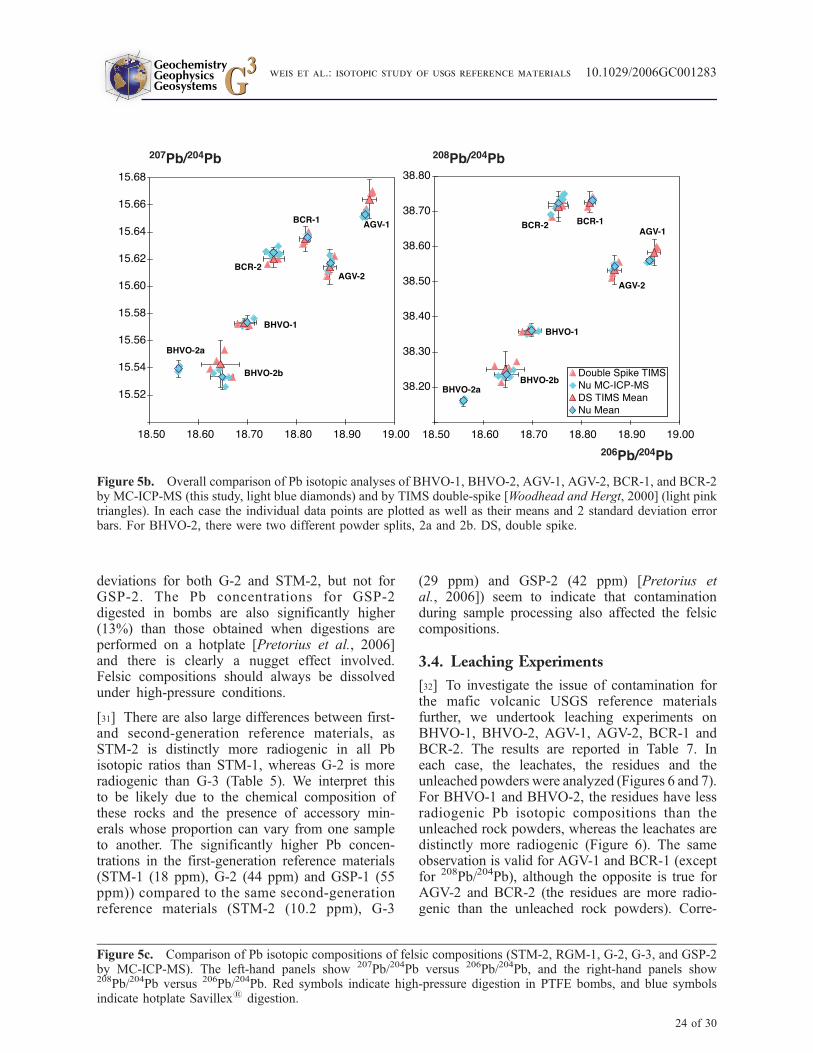
deviations for both G-2 and STM-2, but not forGSP-2. The Pb concentrations for GSP-2digested in bombs are also significantly higher(13%) than those obtained when digestions areperformed on a hotplate [Pretorius et al., 2006]and there is clearly a nugget effect involved.Felsic compositions should always be dissolvedunder high-pressure conditions.
[31] There are also large differences between first-and second-generation reference materials, asSTM-2 is distinctly more radiogenic in all Pbisotopic ratios than STM-1, whereas G-2 is moreradiogenic than G-3 (Table 5). We interpret thisto be likely due to the chemical composition ofthese rocks and the presence of accessory min-erals whose proportion can vary from one sampleto another. The significantly higher Pb concen-trations in the first-generation reference materials(STM-1 (18 ppm), G-2 (44 ppm) and GSP-1 (55ppm)) compared to the same second-generationreference materials (STM-2 (10.2 ppm), G-3
(29 ppm) and GSP-2 (42 ppm) [Pretorius etal., 2006]) seem to indicate that contaminationduring sample processing also affected the felsiccompositions.
3.4. Leaching Experiments
[32] To investigate the issue of contamination forthe mafic volcanic USGS reference materialsfurther, we undertook leaching experiments onBHVO-1, BHVO-2, AGV-1, AGV-2, BCR-1 andBCR-2. The results are reported in Table 7. Ineach case, the leachates, the residues and theunleached powders were analyzed (Figures 6 and 7).For BHVO-1 and BHVO-2, the residues have lessradiogenic Pb isotopic compositions than theunleached rock powders, whereas the leachates aredistinctly more radiogenic (Figure 6). The sameobservation is valid for AGV-1 and BCR-1 (exceptfor 208Pb/204Pb), although the opposite is true forAGV-2 and BCR-2 (the residues are more radio-genic than the unleached rock powders). Corre-
Figure 5b. Overall comparison of Pb isotopic analyses of BHVO-1, BHVO-2, AGV-1, AGV-2, BCR-1, and BCR-2by MC-ICP-MS (this study, light blue diamonds) and by TIMS double-spike [Woodhead and Hergt, 2000] (light pinktriangles). In each case the individual data points are plotted as well as their means and 2 standard deviation errorbars. For BHVO-2, there were two different powder splits, 2a and 2b. DS, double spike.
Figure 5c. Comparison of Pb isotopic compositions of felsic compositions (STM-2, RGM-1, G-2, G-3, and GSP-2by MC-ICP-MS). The left-hand panels show 207Pb/204Pb versus 206Pb/204Pb, and the right-hand panels show208Pb/204Pb versus 206Pb/204Pb. Red symbols indicate high-pressure digestion in PTFE bombs, and blue symbolsindicate hotplate Savillex1 digestion.
GeochemistryGeophysicsGeosystems G3G3
weis et al.: isotopic study of usgs reference materials 10.1029/2006GC001283
24 of 30
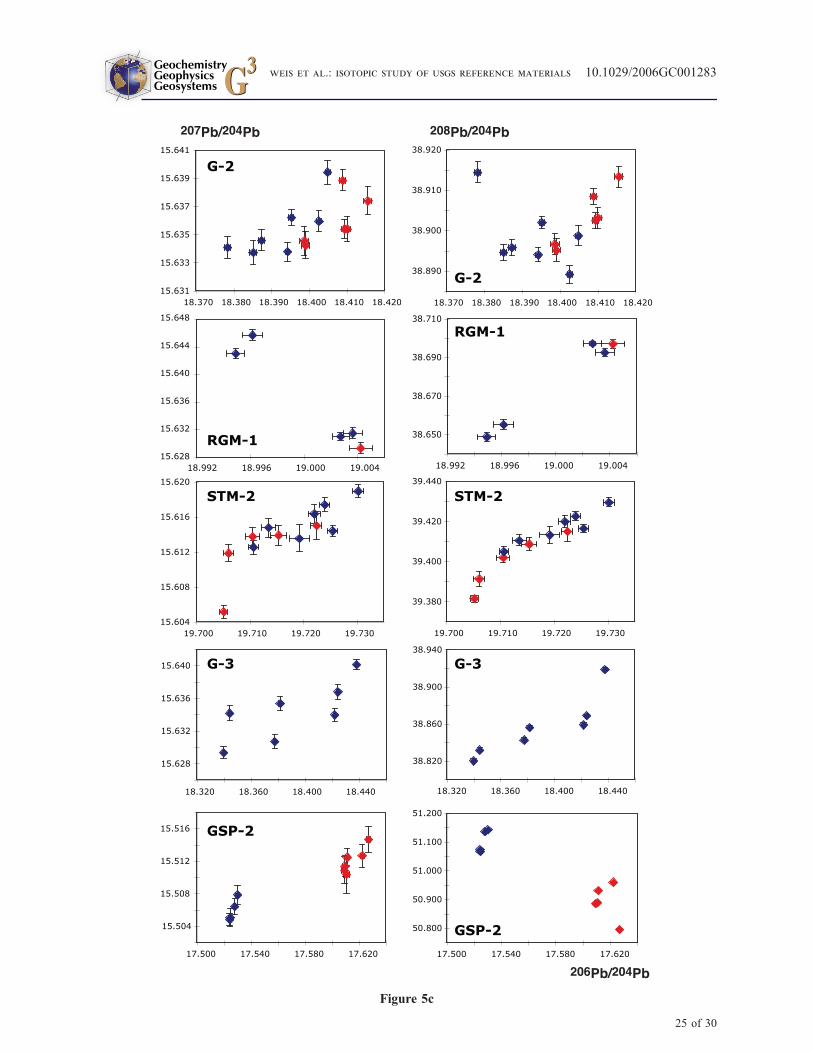
Figure 5c
GeochemistryGeophysicsGeosystems G3G3
weis et al.: isotopic study of usgs reference materials 10.1029/2006GC001283
25 of 30
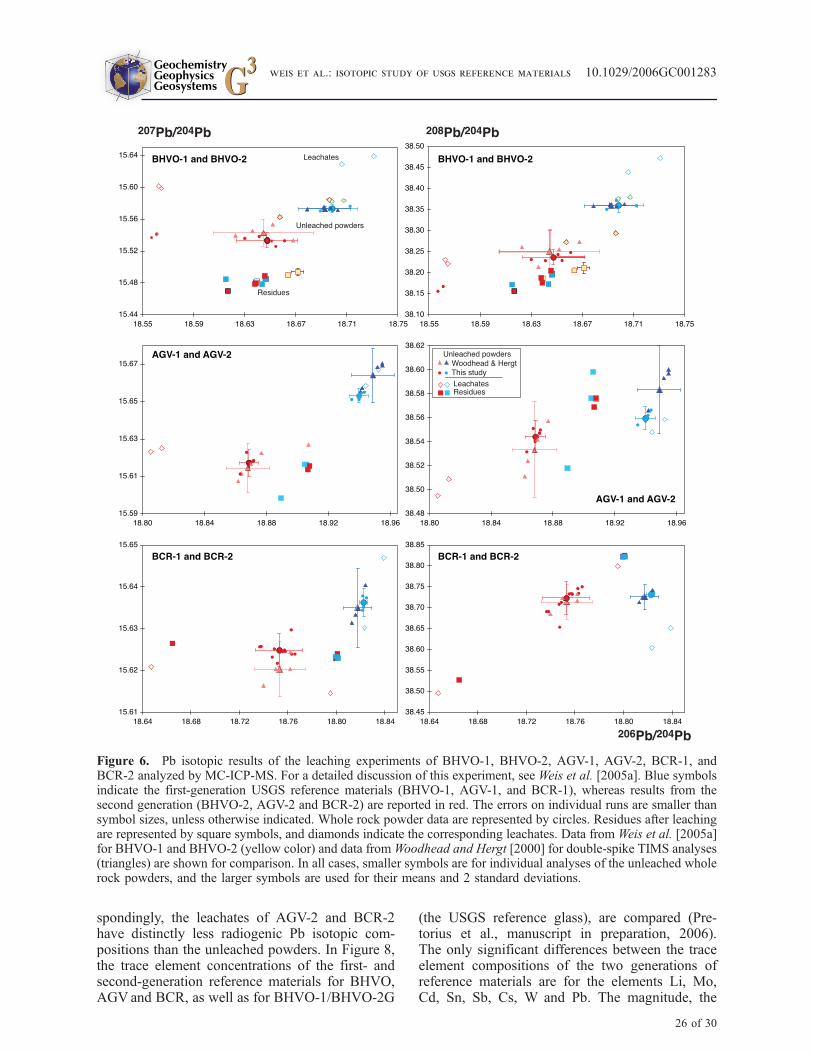
spondingly, the leachates of AGV-2 and BCR-2have distinctly less radiogenic Pb isotopic com-positions than the unleached powders. In Figure 8,the trace element concentrations of the first- andsecond-generation reference materials for BHVO,AGVand BCR, as well as for BHVO-1/BHVO-2G
(the USGS reference glass), are compared (Pre-torius et al., manuscript in preparation, 2006).The only significant differences between the traceelement compositions of the two generations ofreference materials are for the elements Li, Mo,Cd, Sn, Sb, Cs, W and Pb. The magnitude, the
Figure 6. Pb isotopic results of the leaching experiments of BHVO-1, BHVO-2, AGV-1, AGV-2, BCR-1, andBCR-2 analyzed by MC-ICP-MS. For a detailed discussion of this experiment, see Weis et al. [2005a]. Blue symbolsindicate the first-generation USGS reference materials (BHVO-1, AGV-1, and BCR-1), whereas results from thesecond generation (BHVO-2, AGV-2 and BCR-2) are reported in red. The errors on individual runs are smaller thansymbol sizes, unless otherwise indicated. Whole rock powder data are represented by circles. Residues after leachingare represented by square symbols, and diamonds indicate the corresponding leachates. Data from Weis et al. [2005a]for BHVO-1 and BHVO-2 (yellow color) and data fromWoodhead and Hergt [2000] for double-spike TIMS analyses(triangles) are shown for comparison. In all cases, smaller symbols are for individual analyses of the unleached wholerock powders, and the larger symbols are used for their means and 2 standard deviations.
GeochemistryGeophysicsGeosystems G3G3
weis et al.: isotopic study of usgs reference materials 10.1029/2006GC001283
26 of 30
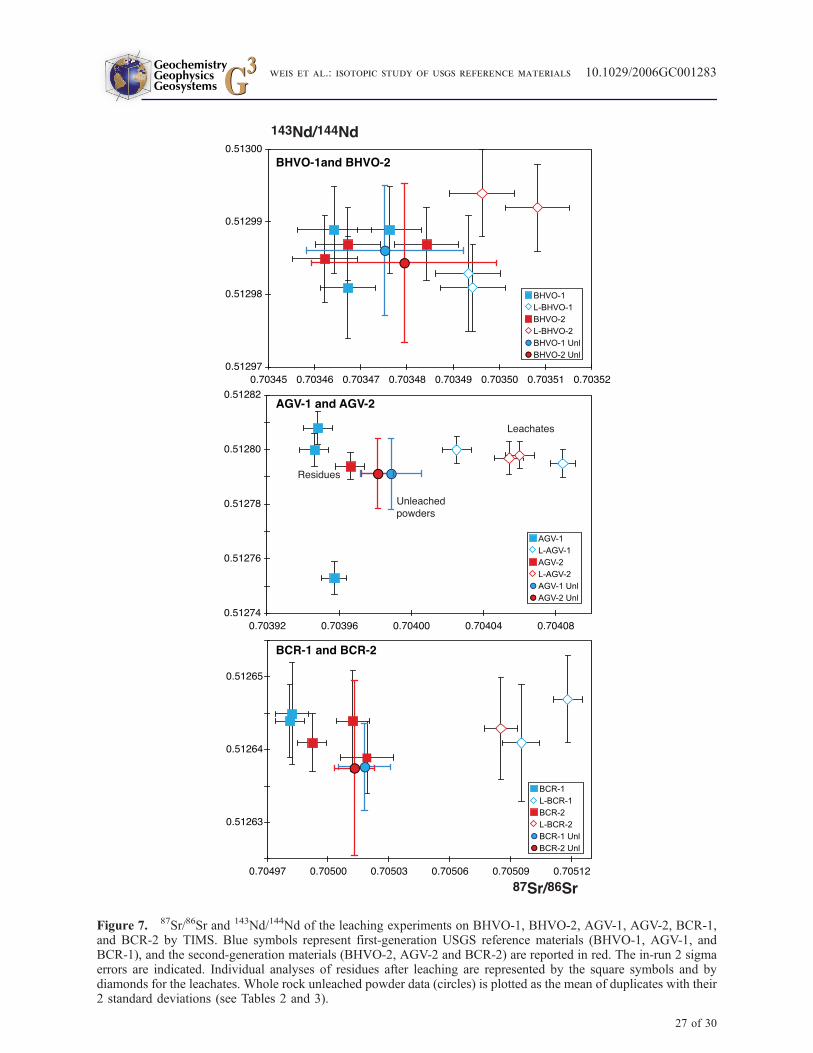
Figure 7. 87Sr/86Sr and 143Nd/144Nd of the leaching experiments on BHVO-1, BHVO-2, AGV-1, AGV-2, BCR-1,and BCR-2 by TIMS. Blue symbols represent first-generation USGS reference materials (BHVO-1, AGV-1, andBCR-1), and the second-generation materials (BHVO-2, AGV-2 and BCR-2) are reported in red. The in-run 2 sigmaerrors are indicated. Individual analyses of residues after leaching are represented by the square symbols and bydiamonds for the leachates. Whole rock unleached powder data (circles) is plotted as the mean of duplicates with their2 standard deviations (see Tables 2 and 3).
GeochemistryGeophysicsGeosystems G3G3
weis et al.: isotopic study of usgs reference materials 10.1029/2006GC001283
27 of 30
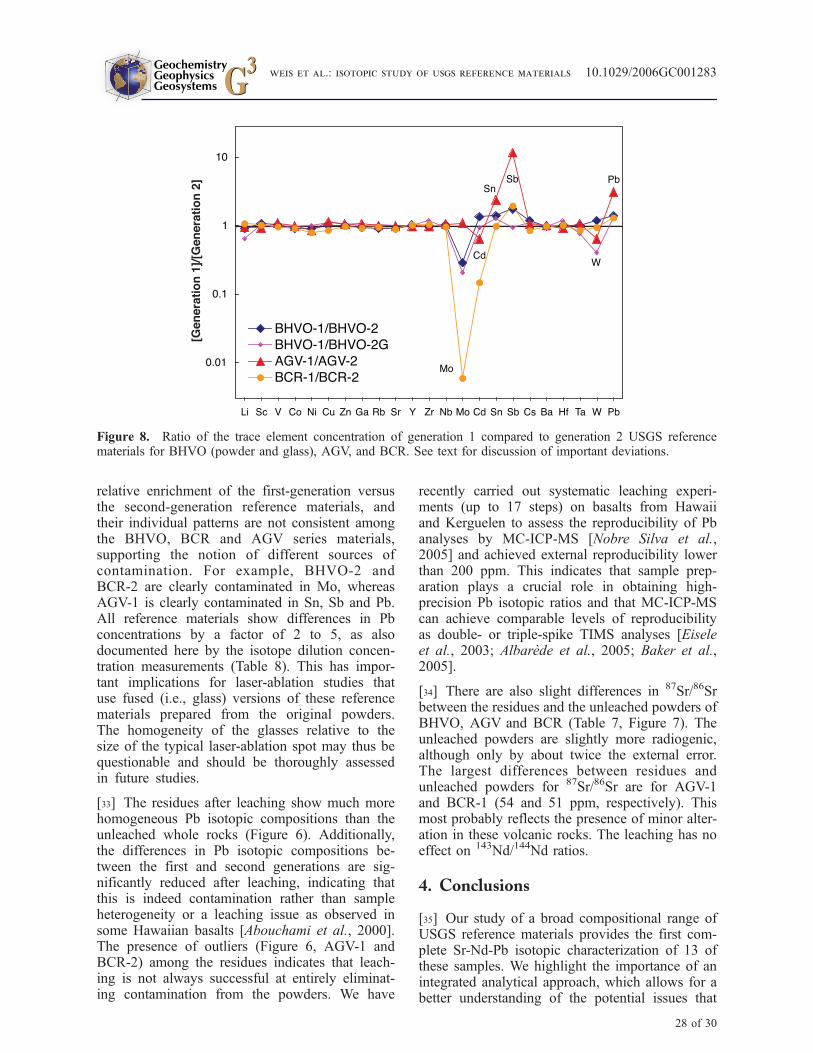
relative enrichment of the first-generation versusthe second-generation reference materials, andtheir individual patterns are not consistent amongthe BHVO, BCR and AGV series materials,supporting the notion of different sources ofcontamination. For example, BHVO-2 andBCR-2 are clearly contaminated in Mo, whereasAGV-1 is clearly contaminated in Sn, Sb and Pb.All reference materials show differences in Pbconcentrations by a factor of 2 to 5, as alsodocumented here by the isotope dilution concen-tration measurements (Table 8). This has impor-tant implications for laser-ablation studies thatuse fused (i.e., glass) versions of these referencematerials prepared from the original powders.The homogeneity of the glasses relative to thesize of the typical laser-ablation spot may thus bequestionable and should be thoroughly assessedin future studies.
[33] The residues after leaching show much morehomogeneous Pb isotopic compositions than theunleached whole rocks (Figure 6). Additionally,the differences in Pb isotopic compositions be-tween the first and second generations are sig-nificantly reduced after leaching, indicating thatthis is indeed contamination rather than sampleheterogeneity or a leaching issue as observed insome Hawaiian basalts [Abouchami et al., 2000].The presence of outliers (Figure 6, AGV-1 andBCR-2) among the residues indicates that leach-ing is not always successful at entirely eliminat-ing contamination from the powders. We have
recently carried out systematic leaching experi-ments (up to 17 steps) on basalts from Hawaiiand Kerguelen to assess the reproducibility of Pbanalyses by MC-ICP-MS [Nobre Silva et al.,2005] and achieved external reproducibility lowerthan 200 ppm. This indicates that sample prep-aration plays a crucial role in obtaining high-precision Pb isotopic ratios and that MC-ICP-MScan achieve comparable levels of reproducibilityas double- or triple-spike TIMS analyses [Eiseleet al., 2003; Albarede et al., 2005; Baker et al.,2005].
[34] There are also slight differences in 87Sr/86Srbetween the residues and the unleached powders ofBHVO, AGV and BCR (Table 7, Figure 7). Theunleached powders are slightly more radiogenic,although only by about twice the external error.The largest differences between residues andunleached powders for 87Sr/86Sr are for AGV-1and BCR-1 (54 and 51 ppm, respectively). Thismost probably reflects the presence of minor alter-ation in these volcanic rocks. The leaching has noeffect on 143Nd/144Nd ratios.
4. Conclusions
[35] Our study of a broad compositional range ofUSGS reference materials provides the first com-plete Sr-Nd-Pb isotopic characterization of 13 ofthese samples. We highlight the importance of anintegrated analytical approach, which allows for abetter understanding of the potential issues that
Figure 8. Ratio of the trace element concentration of generation 1 compared to generation 2 USGS referencematerials for BHVO (powder and glass), AGV, and BCR. See text for discussion of important deviations.
GeochemistryGeophysicsGeosystems G3G3
weis et al.: isotopic study of usgs reference materials 10.1029/2006GC001283
28 of 30
arise during sample processing and analysis, fromcrushing and pulverization, to trace element andisotopic analysis. There is no difference in Sr andNd isotopic compositions between first- and sec-ond-generation USGS reference materials analyzedin this study. The isotopic ratios in Tables 2, 3, and4 can then be used as recommended 87Sr/86Sr and143Nd/144Nd values. Nd isotopic compositions canbe measured, with comparable accuracy and preci-sion, either by TIMS or MC-ICP-MS. The situationis somewhat more delicate for Pb isotopic ratioswhere leaching appears to be necessary to removeany potential contamination introduced during theoriginal preparation of the samples. This compro-mises the use of the materials as glass referencematerials for laser-ablation studies involving Pbconcentrations or compositions.
Acknowledgments
[36] Funding for this study is from an NSERC Discovery
Grant to Weis and an NSERC Major Facility Access Grant to
the PCIGR labs. Our thanks go to J. K. Mortensen for
initiating the creation of the PCIGR facility at UBC. Andy
Burrows from Nu Instruments and Peter Stow from Isomass
(for Thermo Finnigan) are thanked for their advice and their
support in setting up our instruments at the University of
British Columbia and also in ensuring a safe move from the
Chemistry Building to the Earth and Ocean Sciences Main
Building in late 2004. We are very grateful to the USGS and to
Stephen A. Wilson for making their reference materials
available. K. P. Jochum, W. I. Ridley, and the G-Cubed editor,
V. J. M. Salters, are thanked for their supportive and construc-
tive reviews.
References
Abouchami, W., S. J. G. Galer, and A. W. Hofmann (2000),High precision lead isotope systematics of lavas from theHawaiian Scientific Drilling Project, Chem. Geol., 169,187–209.
Albarede, F., P. Telouk, J. Blichert-Toft, M. Boyet, A. Agranier,and B. K. Nelson (2004), Precise and accurate isotopic mea-surements using multiple-collector MC-ICP-MS, Geochim.Cosmochim. Acta, 68(12), 2725–2744.
Albarede, F., A. Stracke, V. J. M. Salters, D. Weis, J. Blichert-Toft, P. Telouk, and A. Agranier (2005), Comment to ‘‘Pbisotopic analysis of standards and samples using a207Pb-204Pb double spike and thallium to correct for massbias with a double-focusing MC-ICP-MS’’ by Baker et al.,Chem. Geol., 217, 171–174.
Baker, J., D. Peate, T.Waight, andC.Meysen (2004), Pb isotopicanalysis of standards and samples using a 207Pb-204Pb doublespike and thallium to correct for mass bias with a double-focusing MC-ICP-MS, Chem. Geol., 211, 275–303.
Baker, J., D. Peate, T. Waight, and M. Thirlwall (2005), Replyto the comment to ‘‘Pb isotopic analysis of standards andsamples using a 207Pb-204Pb double spike and thallium tocorrect for mass bias with a double-focusing MC-ICP-MS’’by Baker et al., Chem. Geol., 217, 175–179.
Belshaw, N. S., P. A. Freedman, R. K. O’Nions, M. Frank, andY. Guo (1998), A new variable dispersion double-focusingplasma mass spectrometer with performance illustrated forPb isotopes, Int. J. Mass Spectrom., 181, 51–58.
Blichert-Toft, J., C. Chauvel, and F. Albarede (1997), Separa-tion of Hf and Lu for high-precision isotope analysis of rocksamples by magnetic sector-multiple collector ICP-MS, Con-trib. Mineral. Petrol., 127, 248–260.
Blichert-Toft, J., D. Weis, C. Maerschalk, A. Agranier, andF. Albarede (2003), Hawaiian hot spot dynamics as inferredfrom the Hf and Pb isotope evolution of Mauna Kea volcano,Geochem. Geophys. Geosyst., 4(2), 8704, doi:10.1029/2002GC000340.
Boyet, M., J. Blichert-Toft, M. Rosing, M. Storey, P. Telouk,and F. Albarede (2003), 142Nd evidence for early Earth dif-ferentiation, Earth Planet. Sci. Lett., 214, 427–442.
Caro, G., B. Bourdon, J.-L. Birck, and S. Moorbath (2003),146Sm-142Nd evidence from Isua metamorphosed sedimentsfor early differentiation of the Earth’s mantle, Nature, 423,428–432.
Chauvel, C., and J. Blichert-Toft (2001), A hafnium isotopeand trace element perspective on melting of the depletedmantle, Earth Planet. Sci. Lett., 190, 137–151.
Eisele, J., W. Abouchami, S. J. G. Galer, and A. W. Hofmann(2003), The 320 kyr Pb isotope evolution of Mauna Kealavas recorded in the HSDP-2 drill core, Geochem. Geophys.Geosyst., 4(5), 8710, doi:10.1029/2002GC000339.
Galer, S. J. G., and W. Abouchami (1998), Practical applica-tion of lead triple spiking for correction of instrumental massdiscrimination, Mineral. Mag., 62A, 491–492.
Halliday, A.N., D. Lee, J. N. Christensen,M.Rehkamper,W.Yi,X. Luo, C. M. Hall, C. J. Ballentine, T. Pettke, and C. Stirling(1998), Applications of multiple collector-ICP-MS to cosmo-chemistry, geochemistry, and paleoceanography, Geochim.Cosmochim. Acta, 62(6), 919–940.
Luais, B., P. Telouk, and F. Albarede (1997), Precise and ac-curate neodymium isotopic measurements by plasma-sourcemass spectrometry, Geochim. Cosmochim. Acta, 61(22),4847–4854.
Lugmair, G. W., T. Shimamura, R. S. Lewis, and E. Anders(1983), Samarium-146 in the early solar system: Evidencefrom neodymium in the Allende meteorite, Science, 222,1015–1018.
McDonough, W. F., and C. Chauvel (1991), Sample contam-ination explains the Pb isotopic composition of some Rurutuisland and Sasha seamount basalts, Earth Planet. Sci. Lett.,105, 397–404.
Nobre Silva, I., D. Weis, and J. S. Scoates (2005), Reprodu-cibility of Pb isotopic compositions of ocean island basalts:From leaching to analysis, Eos Trans. AGU, 86(52), FallMeet. Suppl., Abstract V41D-1482.
Pearson, D. G., and G. M. Nowell (2005), Accuracy and pre-cision in plasma ionisation multi-collector mass spectrome-try: Constraints from neodymium and hafnium isotopemeasurements, in Plasma Source Mass Spectrometry, Cur-rent Trends and Future Developments, edited by J. G.Holland and D. Bandura, Spec. Publ. R. Soc. Chem.,301, 284–314.
Pretorius, W., D. Weis, G. Williams, D. Hanano, B. Kieffer,and J. S. Scoates (2006), Complete trace elemental charac-terization of granitoid (USGS G-2, GSP-2) reference materi-als by high resolution inductively coupled plasma-massspectrometry, Geostand. Geoanal. Res., 30, 39–54.
Raczek, I., K. P. Jochum, and A. W. Hofmann (2003), Neody-mium and strontium isotope data for USGS reference mate-rials BCR-1, BCR-2, BHVO-1, BHVO-2, AGV-1, AGV-2,
GeochemistryGeophysicsGeosystems G3G3
weis et al.: isotopic study of usgs reference materials 10.1029/2006GC001283
29 of 30
GSP-1, GSP-2 and eight MPI-DING reference glasses, Geo-stand. Newsl., 27(2), 173–179.
Regelous, M., A. W. Hofmann, W. Abouchami, and S. J. G.Galer (2003), Geochemistry of lavas from the EmperorSeamounts, and the geochemical evolution of Hawaiianmagmatism from 85 to 42 Ma, J. Petrol., 44(1), 113–140.
Richard, P. N., N. Shimizu, and C. J. Allegre (1976),143Nd/144Nd, a natural tracer: An application to oceanic ba-salts, Earth Planet. Sci. Lett., 31, 269–278.
Rosman, K. J. R., and P. D. P. Taylor (1998), Isotopic compo-sition of elements, Pure Appl. Chem., 70, 217–235.
Thirlwall, M. F., and R. Anczkiewicz (2004), Multidynamicisotope ratio analysis using MC-ICP-MS and the causes ofsecular drift in Hf, Nd and Pb isotope ratios, Int. J. MassSpectrom., 235, 59–81.
Vance, D., and M. Thirlwall (2002), An assessment of massdiscrimination in MC-ICP-MS using Nd isotopes, Chem.Geol., 185, 227–240.
Vance, D., and P. van Calsteren (1999), Precise lead isotopicanalysis by multiple collector inductively coupled plasmamass spectrometry: Long term reproducibility and compar-ison with double spike measurements, in Ninth Annual V.M.Goldschmidt Conference, LPI Contrib. 971, p. 307, Lunarand Planet. Inst., Houston, Tex.
Weis, D., and F. A. Frey (1991), Isotope geochemistry of theNinetyeast Ridge basement basalts: Sr, Nd, and Pb evidencefor involvement of the Kerguelen hot spot, Proc. OceanDrill. Program Sci. Results, 121, 591–610.
Weis, D., and F. A. Frey (1996), Role of the Kerguelen plumein generating the eastern Indian Ocean seafloor, J. Geophys.Res., 101(B6), 13,381–13,849.
Weis, D., B. Kieffer, C. Maerschalk, W. Pretorius, and J. Barling(2005a), High-precision Pb-Sr-Nd-Hf isotopic characteriza-tion of USGS BHVO-1 and BHVO-2 reference materials,Geochem. Geophys. Geosyst., 6, Q02002, doi:10.1029/2004GC000852.
Weis, D., I. Nobre Silva, B. Kieffer, J. Barling, W. Pretorius,and C. Maerschalk (2005b), Hf isotope geochemistry ofUSGS reference materials and various labware: Insight intopotential contaminant sources, Eos Trans. AGU, 86(52), FallMeet. Suppl., Abstract V41D-1477.
White, W. M., F. Albarede, and P. Telouk (2000), High-preci-sion analysis of Pb isotope ratios by multi-collector ICP-MS,Chem. Geol., 167, 257–270.
Woodhead, J. D. (2002), A simple method for obtaining highlyaccurate Pb-isotope data by MC-ICP-MS, J. Anal. At. Spec-trom., 17, 1381–1385.
Woodhead, J. D., and J. M. Hergt (2000), Pb-isotope analysis ofUSGS reference materials, Geostand. Newsl., 24(1), 33–38.
GeochemistryGeophysicsGeosystems G3G3
weis et al.: isotopic study of usgs reference materials 10.1029/2006GC001283
30 of 30


![High-precision isotopic characterization of USGS reference ... · AGV-1, AGV-2, BCR-1 and BCR-2 to further ex-tend the study of Weis et al. [2005a]. [4] The availability of both a](https://img.pdfslide.net/doc/110x75/5f7da4ddb0bf21632c111fe9/high-precision-isotopic-characterization-of-usgs-reference-agv-1-agv-2-bcr-1.jpg)