Embed Size (px)
Citation preview
2006) 119–134www.elsevier.com/locate/tecto
Tectonophysics 426 (
High precision slip distribution of the 1944 Tonankai earthquakeinferred from tsunami waveforms: Possible slip on a splay fault
Toshitaka Baba a,⁎, Phil R. Cummins b, Takane Hori a, Yoshiyuki Kaneda a
a Institute for Research on Earth Evolution, Japan Agency for Marine-Earth Science and Technology,3173-25 Showa-machi Kanazawa-ku Yokohama 236-0001, Japan
b Minerals and Geohazards Division, Geoscience Australia, GPO Box 378, Canberra, ACT 2601, Australia
Accepted 7 February 2006Available online 30 June 2006
Abstract
Inversion of tsunami waveforms is a well-established technique for estimating the slip distributions of subduction zoneearthquakes, with some of the most detailed results having been obtained for earthquakes in the Nankai Trough, SW Japan. Thepresent study, although it uses a method and tsunami waveform data set almost identical to previous study, aims to improve onprevious work by using amore precise specification of initial conditions for the calculation of tsunami Green's functions. Specifically,we incorporated four improvements in the present study: (1) we used a realistic plate model based only on seismic survey results, andassumed it to be the fault plane of the 1944 Tonankai earthquake; (2) the smallest subfaults consistent with the long wavelengthapproximation were used in the tsunami inversion analysis; (3) we included the effect of horizontal displacement of the ocean bottomon tsunami generation; and (4) we performed a checkerboard resolution test. As obtained in previous studies, a zone of high slip(N2.0 m) was resolved off the Shima Peninsula. However, the more precise calculation of tsunami Green's functions has revealedadditional detail that was not evident in previous studies, which we demonstrate is resolvable and correlates with the position ofknown faults in the accretionary prism.While there was little or no slip near the trench axis in the eastern part of the rupture zone, therewas up to 1.5 m of slip resolved within 30 km of the trough axis in the western part, along the coast of the Kii Peninsula. Thistroughward slip zone coincides with the position of a large splay fault mapped in multichannel reflection surveys. Furthermore, it isalso clear that the upper edge of the Enshu fault off Shima and Atsumi peninsulas is consistent with the up-dip limit of slip in theeastern part of our model. We tested the possibility that slip occurred on the former splay fault instead of on the plate interface duringthe 1944 Tonankai earthquake, and find that slip on this splay fault is also consistent with the data, although we cannot distinguishwhether slip was dominant on the splay fault or on the plate interface. We further suggest that the position of the Enshu fault may bedetermined by the subduction of topographic highs, and that such faults may have an important influence on the up-dip rupture limit ofthe 1944 Tonankai and, potentially, other subduction zone earthquakes.© 2006 Elsevier B.V. All rights reserved.
Keywords: 1944 Tonankai earthquake; Tsunami inversion; Splay fault; Plate irregularity
⁎ Corresponding author. Tel.: +81 45 778 5972; fax: +81 45 7785439.
E-mail address: [email protected] (T. Baba).
0040-1951/$ - see front matter © 2006 Elsevier B.V. All rights reserved.doi:10.1016/j.tecto.2006.02.015
1. Introduction
The Nankai Trough has a long history of great inter-plate earthquakes, with historical observations dating backto the 7th century (Ando, 1975). The recurrence interval
120 T. Baba et al. / Tectonophysics 426 (2006) 119–134
of great earthquakes there appears to be 100–150 years(Ishibashi and Satake, 1998). Themost recent events werethe 1944 Tonankai and 1946 Nankai earthquakes. Thesource processes of the 1944 and 1946 events have beenstudied using seismic wave data, geodetic data and tsu-nami data. A significant number of seismic surveys havebeen carried out across the margin, revealing detailedseismic velocity structure throughout the rupture area (e.g.Kodaira et al., 2000a; Nakanishi et al., 2002c). Because ofthe extensive seismic survey coverage, the Nankai Troughis an ideal region from which to understand the rela-tionship between crustal structure and interplate earth-quakes. In order to discuss the relationship betweencrustal structure and the rupture area in detail, we need anaccurate estimate of the slip distribution. Tsunami analysisis useful for detecting the static slip distribution on a faultplane, particularly near the up-dip limit. Because geodeticstudies rely mainly on data observed on land, geodeticdata cannot resolve the slip near the up-dip limit (Sagiyaand Thatcher, 1999). Seismic wave data for the 1940searthquakes are very sparse and of poor quality, renderingit difficult to resolve a detailed slip distribution. However,the tide gauge data used for tsunami analysis are particu-larly sensitive to slip near the up-dip limit of the ruptureplane, because slip on the shallow part of the subductionzone plate boundary near the up-dip limit of earthquakerupture results in pronounced seafloor deformation.
For the 1946 Nankai earthquake, Baba et al. (2002)succeeded in estimating a high precision slip distributionfrom tsunami inversions using a realistic plate model thatwas constructed by combining marine seismic surveyresults and seismicity data. Recent seismic surveys in theNankai Trough are now beginning to reveal structurewith sufficient detail that its relationship to the slip dis-tribution of the 1946 Nankai earthquake can be con-sidered. Kodaira et al. (2000a) imaged a seamountsubducting beneath the accretionary prism off CapeMuroto, and proposed that the seamount may have actedas a barrier that inhibited rupture propagation during the1946 event. Cummins et al. (2002) pointed out a possibletear in the slab that is consistent with the easternmostextent of the slip area. Cummins and Kaneda (2000) alsoinvestigated how slip on a play fault may influence therupture pattern. Nakanishi et al. (2002a) discussed thecorrelation between the up-dip limit of rupture for the1940s earthquakes and the seaward extent of the contactbetween island arc crust and the plate boundary, as de-termined from seismic surveys. The Deep Strong Reflec-tor, identified by Park et al. (2002b) in multichannelseismic reflection surveys, may also play an importantrole in the release of strain energy stored near the plateboundary. All these studies suggest that, at least for the
1946 Nankai earthquake, crustal structure has an impor-tant effect on either rupture propagation or the inter-seismic accumulation of elastic strain, or both.
Similarly, for the 1944 Toanakai earthquake, manystudies (e.g. Satake, 1993; Kato and Ando, 1997; Taniokaand Satake, 2001) estimated the slip distribution of the1944 Tonankai earthquake by inverting tsunami wave-forms. According to Tanioka and Satake (2001), a maxi-mum slip of about 3 m occurred on the plate interface offShima Peninsula. The total seismic moment is estimatedto be 2.0×10²¹ Nm. They pointed out a large discrepancybetween the moment distribution pattern from the strongmotion data and the slip distribution from the tsunamiwaveforms beneath Atsumi Peninsula, suggested that therupture might be slow. But the relationship between theslip distribution and crustal structure is still an open ques-tion. We feel that a more accurate slip distribution shouldbe estimated before this relationship can be discussed,especially since detailed structures, such as ridge sub-duction (Le Pichon et al., 1996; Kodaira et al., 2003) and asplay fault (Park et al., 2002a), have been detected underthe rupture area of the 1944 Tonankai earthquake. Limita-tions in the resolution of the previous studies include: 1)The plate model has a large degree of uncertainty off-shore, since only land-based hypocenter data were usedfor constructing the plate model. A more realistic plateshape for inversion analysis, such as that which Baba et al.(2002) used for the 1946 Nankai earthquake, should beused. 2) The effect of horizontal movement on tsunamigeneration (Tanioka and Satake, 1996) was not consid-ered in these studies. Generally, tsunami generation by anearthquake is modeled by water surface displacementidentical to the vertical deformation of the ocean bottomdue to faulting. The horizontal effect is usually neglected.However, this approximation is valid only for events thatoccur on a flat or gently dipping ocean bottom. On asteeply dipping ocean bottom, such as the Nankai Trough,horizontal displacement can also affect tsunami genera-tion. 3) The inversion did not asses the spatial resolutionof the slip distribution. Although tsunami data should bemost sensitive to slip near the up-dip limit, it is unclearhow well previous studies resolved this slip.
The first aim of this study is to estimate the slip dis-tribution of the 1944 Tonankai earthquake more reliablythan has been achieved in the past. We used analysissoftware and tsunami waveforms which were producedby Tanioka and Satake (2001) for calculations of prop-agation and inversion of tsunami waveforms. The dif-ference between the present and Tanioka and Satake(2001)'s study in the inversion procedure was the shapeof the initial tsunami waveform used in calculating theGreen's function for each subfault. Our analysis used a
121T. Baba et al. / Tectonophysics 426 (2006) 119–134
realistic plate model constructed from seismic surveyresults and includes the effect of horizontal displacementof the ocean bottom on tsunami generation. We alsochecked the resolution of the slip distribution using acheckerboard resolution test. The second aim of thisstudy is to discuss the relationship between crustal struc-ture and the rupture area of the 1944 Tonankai earth-quake. Finally, the effects of plate roughness, in particulartopographic highs, on the rupture process of a great inter-plate earthquake are discussed.
2. Tsunami analysis
This section describes the inversion method. The pre-sent inversion method incorporates four improvements incomparison with previous studies. (1) We constructed animproved plate model based only on seismic survey re-sults, and assumed it to be the fault plane of the 1944Tonankai earthquake. (2) The fault plane was dividedinto subfaults as small as was consistent with the longwavelength approximation used to calculate the tsunamiwaveforms. (3) We included the effect of horizontal dis-placement of the ocean bottom on tsunami generation. (4)We performed a checkerboard resolution test.
2.1. Improved plate model
The focal mechanism of the 1944 earthquake is con-sistent with a shallow thrust event and is generally assumedto have ruptured the interface between the overriding platein southwest Japan and the subducting Philippine Sea Plateoffshore (Kanamori, 1972). A linear inversion of tsunamiwaveforms for the slip distribution is dependent onaccurate knowledge of the actual fault surface, so we hadto accurately determine the shape of the subducting plateoffshore. A number of models for the shape of the Phil-ippine Sea Plate have been derived from the distribution ofmicro earthquakes along the subducting plate (e.g. Mizoueet al., 1983; Okano et al., 1985; Yamazaki and Ooida,1985; Ito, 1990; Nakamura et al., 1997). However, all ofthese models suffer from two fundamental flaws. Sinceonly land based datawere used, the hypocenters of offshoreseismicity were poorly determined, resulting in a largedegree of uncertainty as to where the earthquakes actuallyoccurred. Second, even when hypocenters were accuratelydetermined, is not clear atwhat depthwithin the subductingplate they occurred—they may occur in the subductingcrust, in the uppermost mantle or along the plate boundaryitself.
Baba et al. (2002) attempted to overcome these prob-lems by relying on results from marine seismic surveysto construct a model of the upper surface of the Philip-
pine Sea Plate offshore Shikoku, and re-estimated theslip distribution of the 1946 Nankai earthquake usingtsunami waveforms. Since these survey results are basedon observations of waves reflected or refracted by theplate boundary, there is little doubt that the boundarydetermined from such a seismic survey is the upper sur-face of the plate. Baba et al. (2002) compiled 11 marineseismic survey results for their plate model. In this study,we have incorporated results from three more marineseismic refracted surveys (Nishizaka, 1997; Kodairaet al., 2003) and from one land seismic reflection survey(Takeda, 2001) for the improved plate model. However,hypocenters were not used to construct the plate model,since it is not clear at what depth within the subductingplate they occur, as mentioned above. The shape of thesubducting plate offshore compiled using only the seis-mic survey results is optimum in the sense that its reso-lution is greatest for the offshore portion of the plateboundary, where the tsunami excitation is most sensitiveto slip. Although the deep, onshore portion of the plateboundary may not be so well resolved, the tsunamiwaveforms are also much less sensitive to slip there. Weassumed the top of oceanic layer 2 on the subductingplate defines the plate boundary. The depths to the top ofoceanic layer 2 obtained from the marine seismic re-fraction survey results were extrapolated to the depths ofthe seismic reflector obtained from the land seismicreflection surveys using the adjustable tension continu-ous curvature surface gridding algorithm (Smith andWessel, 1990).
Our choice of the top of oceanic layer 2 as the plateboundary may bias our result for earthquake slip, sincethe actual surface on which earthquake slip occurs maylie within the subducted sediments above this interface.In the Nankai Trough, the thickness of subducting sedi-ments varies between about 1 km and 500 m (Moore etal., 1990; Park et al., 2002b). However, this layer ap-pears to become thinner landward of the contact be-tween the subducting plate and the continental crust,because it is not a resolvable feature in models obtainedin recent wide-angle seismic refraction surveys (e.g.Nakanishi et al., 2002c). Since, as we show below, thisdeeper part of the seismogenic zone is where most of theslip associated with the 1944 Tonankai earthquake oc-curred, our assumption that seismic slip occurs at the topof oceanic layer 2 should not substantially bias our re-sult, although it could lead to a slight overestimate ofslip that occurs near the trough axis.
A contour map of the plate model is shown in Fig. 1.This model includes detailed structural features of thePhilippine Sea Plate. The depth of the plate boundarybeneath the Kii Peninsula is shallower with a gentler
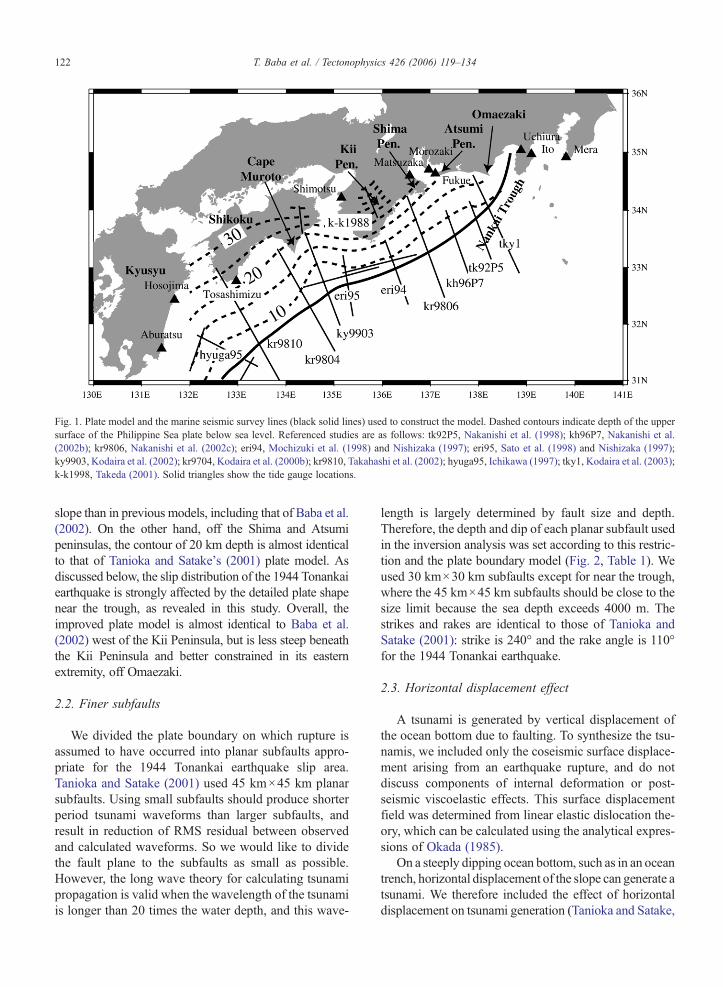
Fig. 1. Plate model and the marine seismic survey lines (black solid lines) used to construct the model. Dashed contours indicate depth of the uppersurface of the Philippine Sea plate below sea level. Referenced studies are as follows: tk92P5, Nakanishi et al. (1998); kh96P7, Nakanishi et al.(2002b); kr9806, Nakanishi et al. (2002c); eri94, Mochizuki et al. (1998) and Nishizaka (1997); eri95, Sato et al. (1998) and Nishizaka (1997);ky9903, Kodaira et al. (2002); kr9704, Kodaira et al. (2000b); kr9810, Takahashi et al. (2002); hyuga95, Ichikawa (1997); tky1, Kodaira et al. (2003);k-k1998, Takeda (2001). Solid triangles show the tide gauge locations.
122 T. Baba et al. / Tectonophysics 426 (2006) 119–134
slope than in previous models, including that of Baba et al.(2002). On the other hand, off the Shima and Atsumipeninsulas, the contour of 20 km depth is almost identicalto that of Tanioka and Satake's (2001) plate model. Asdiscussed below, the slip distribution of the 1944 Tonankaiearthquake is strongly affected by the detailed plate shapenear the trough, as revealed in this study. Overall, theimproved plate model is almost identical to Baba et al.(2002) west of the Kii Peninsula, but is less steep beneaththe Kii Peninsula and better constrained in its easternextremity, off Omaezaki.
2.2. Finer subfaults
We divided the plate boundary on which rupture isassumed to have occurred into planar subfaults appro-priate for the 1944 Tonankai earthquake slip area.Tanioka and Satake (2001) used 45 km×45 km planarsubfaults. Using small subfaults should produce shorterperiod tsunami waveforms than larger subfaults, andresult in reduction of RMS residual between observedand calculated waveforms. So we would like to dividethe fault plane to the subfaults as small as possible.However, the long wave theory for calculating tsunamipropagation is valid when the wavelength of the tsunamiis longer than 20 times the water depth, and this wave-
length is largely determined by fault size and depth.Therefore, the depth and dip of each planar subfault usedin the inversion analysis was set according to this restric-tion and the plate boundary model (Fig. 2, Table 1). Weused 30 km×30 km subfaults except for near the trough,where the 45 km×45 km subfaults should be close to thesize limit because the sea depth exceeds 4000 m. Thestrikes and rakes are identical to those of Tanioka andSatake (2001): strike is 240° and the rake angle is 110°for the 1944 Tonankai earthquake.
2.3. Horizontal displacement effect
A tsunami is generated by vertical displacement ofthe ocean bottom due to faulting. To synthesize the tsu-namis, we included only the coseismic surface displace-ment arising from an earthquake rupture, and do notdiscuss components of internal deformation or post-seismic viscoelastic effects. This surface displacementfield was determined from linear elastic dislocation the-ory, which can be calculated using the analytical expres-sions of Okada (1985).
On a steeply dipping ocean bottom, such as in an oceantrench, horizontal displacement of the slope can generate atsunami. We therefore included the effect of horizontaldisplacement on tsunami generation (Tanioka and Satake,
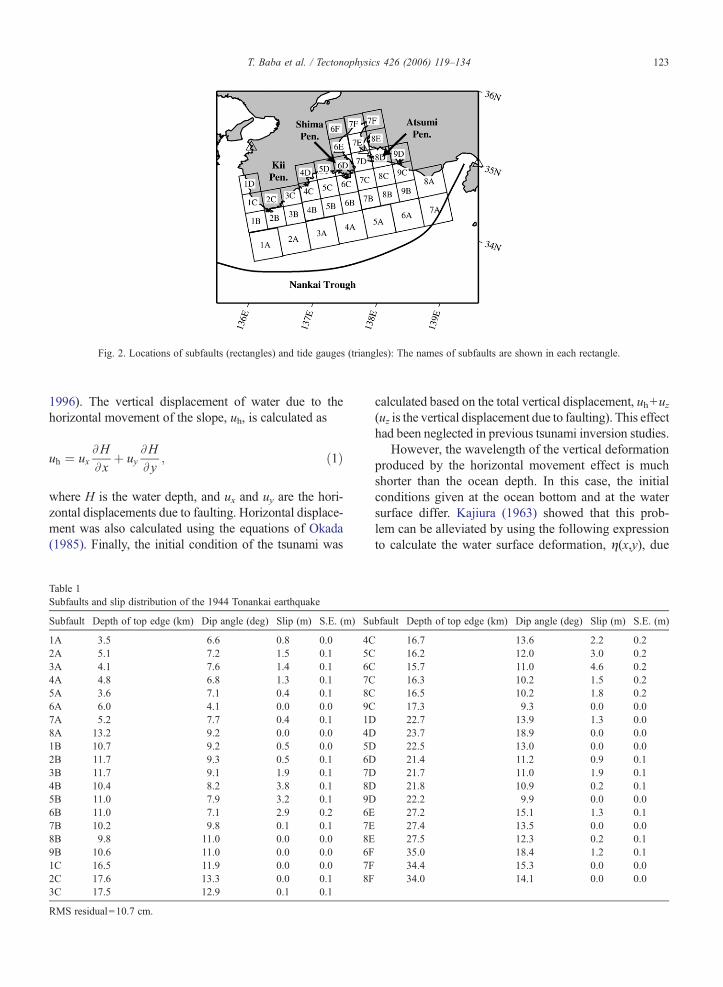
Fig. 2. Locations of subfaults (rectangles) and tide gauges (triangles): The names of subfaults are shown in each rectangle.
123T. Baba et al. / Tectonophysics 426 (2006) 119–134
1996). The vertical displacement of water due to thehorizontal movement of the slope, uh, is calculated as
uh ¼ uxAHAx
þ uyAHAy
; ð1Þ
where H is the water depth, and ux and uy are the hori-zontal displacements due to faulting. Horizontal displace-ment was also calculated using the equations of Okada(1985). Finally, the initial condition of the tsunami was
Table 1Subfaults and slip distribution of the 1944 Tonankai earthquake
Subfault Depth of top edge (km) Dip angle (deg) Slip (m) S.E. (m) Su
1A 3.5 6.6 0.8 0.0 4C2A 5.1 7.2 1.5 0.1 5C3A 4.1 7.6 1.4 0.1 6C4A 4.8 6.8 1.3 0.1 7C5A 3.6 7.1 0.4 0.1 8C6A 6.0 4.1 0.0 0.0 9C7A 5.2 7.7 0.4 0.1 1D8A 13.2 9.2 0.0 0.0 4D1B 10.7 9.2 0.5 0.0 5D2B 11.7 9.3 0.5 0.1 6D3B 11.7 9.1 1.9 0.1 7D4B 10.4 8.2 3.8 0.1 8D5B 11.0 7.9 3.2 0.1 9D6B 11.0 7.1 2.9 0.2 6E7B 10.2 9.8 0.1 0.1 7E8B 9.8 11.0 0.0 0.0 8E9B 10.6 11.0 0.0 0.0 6F1C 16.5 11.9 0.0 0.0 7F2C 17.6 13.3 0.0 0.1 8F3C 17.5 12.9 0.1 0.1
RMS residual=10.7 cm.
calculated based on the total vertical displacement, uh+uz(uz is the vertical displacement due to faulting). This effecthad been neglected in previous tsunami inversion studies.
However, the wavelength of the vertical deformationproduced by the horizontal movement effect is muchshorter than the ocean depth. In this case, the initialconditions given at the ocean bottom and at the watersurface differ. Kajiura (1963) showed that this prob-lem can be alleviated by using the following expressionto calculate the water surface deformation, η(x,y), due
bfault Depth of top edge (km) Dip angle (deg) Slip (m) S.E. (m)
16.7 13.6 2.2 0.216.2 12.0 3.0 0.215.7 11.0 4.6 0.216.3 10.2 1.5 0.216.5 10.2 1.8 0.217.3 9.3 0.0 0.022.7 13.9 1.3 0.023.7 18.9 0.0 0.022.5 13.0 0.0 0.021.4 11.2 0.9 0.121.7 11.0 1.9 0.121.8 10.9 0.2 0.122.2 9.9 0.0 0.027.2 15.1 1.3 0.127.4 13.5 0.0 0.027.5 12.3 0.2 0.135.0 18.4 1.2 0.134.4 15.3 0.0 0.034.0 14.1 0.0 0.0
124 T. Baba et al. / Tectonophysics 426 (2006) 119–134
to the ocean bottom deformation, HB(x0,y0)= [uh+uz](x0,y0):
gðx; yÞ ¼ZZ
sHBðx0; y0ÞRdx0dy0; ð2Þ
where
R ¼ ð1=pÞXln¼0
ð−1Þnð2nþ 1Þfð2nþ 1Þ2
þðx−x0Þ2 þ ðy−y0Þ2g−3=2:ð3Þ
In the above equations, the non-dimensional horizontalcoordinates x=x′/d, y=y′/d and the surface displacementη=η′/d are used. x′, y′ and η′ are dimensionalcoordinates and displacement. d is the water depth. Wenumerically computed water surface deformation, η(x,y),using the above equations, and used this as the initialwater surface condition for the tsunami.
2.4. Propagation and inversion of tsunami waveforms
Tsunamis are usually treated as long waves, which arealso referred to as shallow water waves. Long wave the-ory is valid when the wavelength of the tsunami is longerthan 20 times the water depth. When the tsunami ampli-tude h is very small compared to water depth d, we canalso use “small amplitude” approximation, h≪d. Fur-ther, if we can ignore the bottom friction, the governingequations can be linearized. This linear long wave theorywas used to calculate tsunami propagation. The equationof continuity and motion can be written as
AhAt
¼ −jd dVð Þ; ð4Þ
AVAt
¼ −gjh; ð5Þ
where d is the water depth, h is the water elevation ortsunami amplitude, V is the depth-averaged horizontalvelocity vector, and g is gravitational acceleration. Thefinite difference computations of the linear long waveequation and the equation of continuity were carried outfor the region shown in Fig. 1. A variable grid systemwas used near the tide gauge stations to incorporate de-tailed bathymetry around the stations. The grid size isalso the same as that of Tanioka and Satake (2001),which was basically 20 s (about 600 m), although finergrids of 4 sec were used near the tide gauge stations. The
computation used a time step of 1.5 s in order to satisfythe stability condition of the finite difference algorithm.
In the calculation of Green's functions, the oceanbottom deformation due to 1 m slip on each subfault wascalculated at first. The vertical displacement of the oceanbottomwas then calculated using Eq. (1), which includesthe effect of horizontal displacement of the ocean bottomdue to faulting. Finally, the initial condition of the seasurface was calculated using Kajiura's (1963) method(Eqs. (2) and (3)) to filter the vertical ocean bottomdisplacement.We followed Tanioka and Satake (2001) inassuming that the rise time for sea surface displacementover each subfault was 60 s, since this is a typical for amagnitude 8 earthquake. The tsunami Green's functionsfor inversion were computed by numerically solvingEqs. (4) and (5).
For the inversion of the 1944 Tonankai we used tsu-nami waveform data recorded at 10 tide gauge stations(Mera, Uchiura, Ito, Matsuzaka, Morozaki, Fukue, Shi-motsu, Tosashimizu, Hosojima, Aburatsu) (Fig. 1). Theobserved tsunami waveforms and time windows are sameas these of Tanioka and Satake (2001).
We used non-negative least squares (Lawson andHanson, 1974) to solve for the set of positive subfaultslips which most closely match the data. The equationrelating subfault slip to tide gauge observations is
GjkðtÞxk ¼ djðtÞ; ð6Þwhere Gjk(t) is the computed tsunami Green function atthe jth station from a unit slip on the kth subfault, dj(t) isthe observed tsunami waveform at the jth station, and xkis the slip on the kth subfault to be estimated in inver-sion. The least squares solution can be obtained byminimizing the l2 norm of the residuals with a non-negative constraint (Lawson and Hanson, 1974),
jjGjkðtÞxk−djðtÞjjYmin xkz0: ð7ÞAll the observed tsunami waveforms were equally
weighted in the inversion. The inversion scheme is es-sentially the same as described by Satake (1989) exceptfor the non-negativity constraint. The non-negative con-straint should be valid for slip on the assumed plateinterface. For error analysis, the jackknife technique(Tichelaar and Ruff, 1989) was applied.
2.5. Checkerboard resolution test
In this study, we assessed the spatial resolution of theinversion using a checkerboard inversion test, as fol-lows. First, tsunami waveforms due to a slip distributionconsisting of 1 m and 0 m on alternating subfaults, i.e. a
125T. Baba et al. / Tectonophysics 426 (2006) 119–134
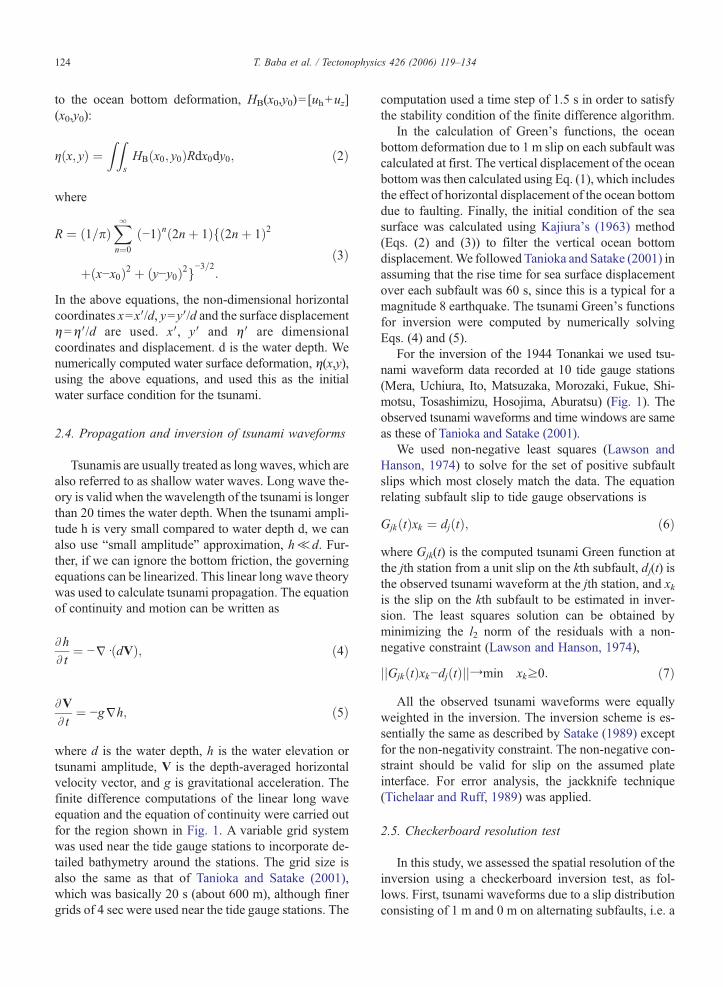
“checkerboard” pattern (Fig. 3a), were calculated. Thenthese calculated tsunami waveforms were treated asobserved data, and inverted for the slip distribution bythe same procedure described above. Finally, we com-pared the obtained slip distribution with the initial one,expecting that we should recover the checkerboardpattern on parts of the slip surface which are well re-solved, but that the checkerboard pattern will not berecovered where the station geometry was insufficient toresolve a slip variation on the scale of the subfaults.Fig. 3b shows the results of the checkerboard resolutiontest. The offshore subfaults exhibit high spatial resolu-tion, even in small (30 km×30 km) subfaults. But slipsaround Ise bay, in rows of subfaults D, E and F, are notresolved well. We also tested the complementary case ofthe initial model, where the slips were interchanged. The
Fig. 3. Results of checkerboard resolution test: (a) Initial model and (b) inveamount in m.
inversion image of the complementary case produced thesame interpretation of the original one.
2.6. Effects of improvements on the slip distribution
The present inversion method has three improvementsin comparison with previous studies of the 1944 event,which are 1) a realistic plate model, 2) finer subfaults and3) including horizontal movement effects (Tanioka andSatake, 1996). Here, we assess the influence of eachimprovement on the slip model. First, we consider howthe difference in the plate model affects the tsunami in-version result. Figs. 4 and 5a show the slip distributions ofTanioka and Satake (2001) and our inversion result, whichuses a method and data identical to Tanioka and Satake(2001), but uses the plate model we constructed from
rsion result are shown. The number in each subfault indicates the slip
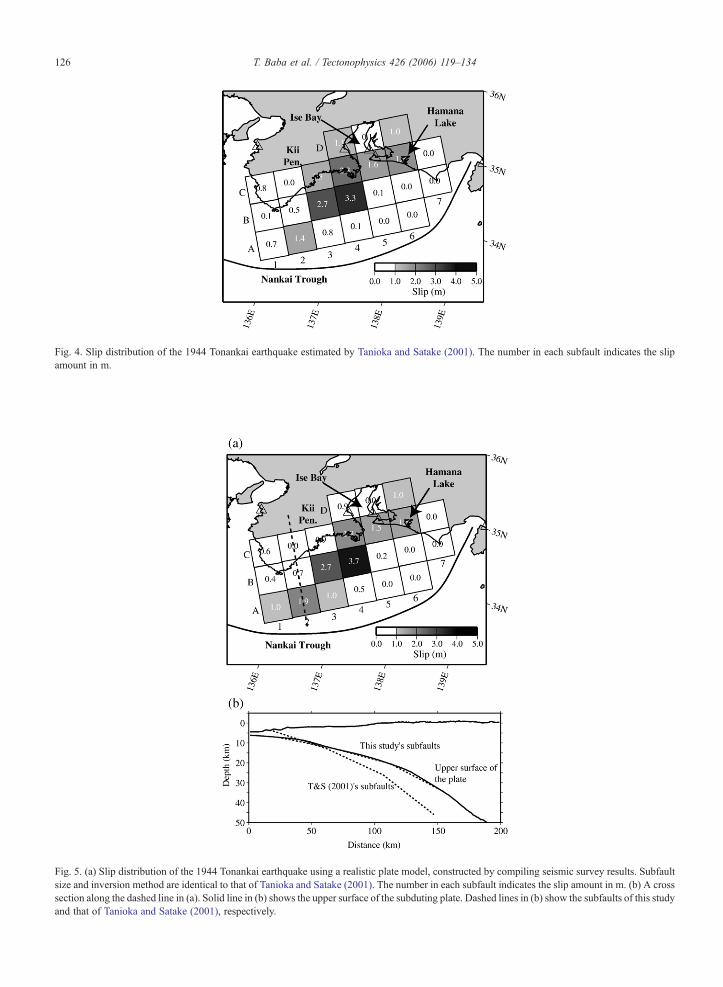
Fig. 4. Slip distribution of the 1944 Tonankai earthquake estimated by Tanioka and Satake (2001). The number in each subfault indicates the slipamount in m.
Fig. 5. (a) Slip distribution of the 1944 Tonankai earthquake using a realistic plate model, constructed by compiling seismic survey results. Subfaultsize and inversion method are identical to that of Tanioka and Satake (2001). The number in each subfault indicates the slip amount in m. (b) A crosssection along the dashed line in (a). Solid line in (b) shows the upper surface of the subduting plate. Dashed lines in (b) show the subfaults of this studyand that of Tanioka and Satake (2001), respectively.
126 T. Baba et al. / Tectonophysics 426 (2006) 119–134
127T. Baba et al. / Tectonophysics 426 (2006) 119–134
seismic survey results. A significant difference is evidenton subfaults along the trench off the Kii Peninsula, wherethe magnitude of slip amount increased by about 25% incomparison with that of Tanioka and Sataka's (2001)result. Our new model for the plate boundary generallyhas less dip than the fault plane used by Tanioka andSatake (2001). In the up-dip portion off the Kii Peninsula(subfaults 1A, 2A and 3A), the dip of our new model isgentler and the depth deeper (Fig. 5b). The greater depthand gentler dip will tend to increase the amount of sliprequired to produce a given seafloor deformation. It is forthis reason that the slips increase on the subfaults 1A, 2Aand 3A. The RMS residual is 12.3 cm which is almostidentical to the 12.1 cm of Tanioka and Satake (2001). Aprevious tsunami inversion study on the 1946 Nankaiearthquake (Baba et al., 2002) also used a realistic platemodel that was constructed by seismic survey results andseismicity data. They investigated the effect of the real-istic plate model on the slip distribution. The change onthe 1944 Tonankai slip distribution that we showed here isconsistent with their change produced by using the real-istic plate model.
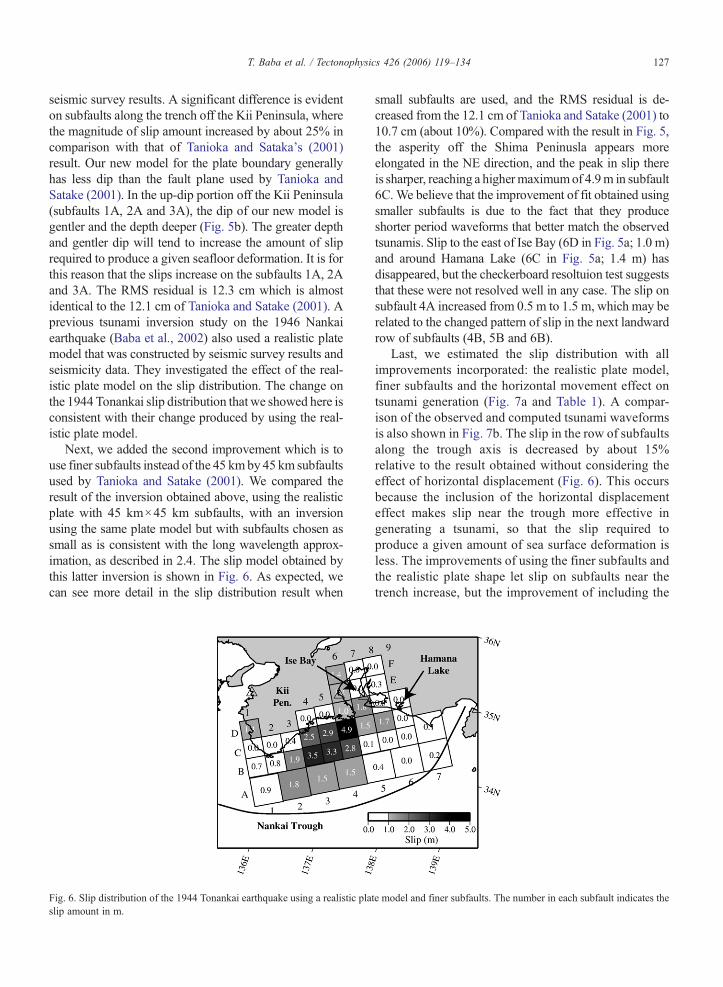
Next, we added the second improvement which is touse finer subfaults instead of the 45 kmby 45 km subfaultsused by Tanioka and Satake (2001). We compared theresult of the inversion obtained above, using the realisticplate with 45 km×45 km subfaults, with an inversionusing the same plate model but with subfaults chosen assmall as is consistent with the long wavelength approx-imation, as described in 2.4. The slip model obtained bythis latter inversion is shown in Fig. 6. As expected, wecan see more detail in the slip distribution result when
Fig. 6. Slip distribution of the 1944 Tonankai earthquake using a realistic plaslip amount in m.
small subfaults are used, and the RMS residual is de-creased from the 12.1 cm of Tanioka and Satake (2001) to10.7 cm (about 10%). Compared with the result in Fig. 5,the asperity off the Shima Peninusla appears moreelongated in the NE direction, and the peak in slip thereis sharper, reaching a highermaximumof 4.9m in subfault6C. We believe that the improvement of fit obtained usingsmaller subfaults is due to the fact that they produceshorter period waveforms that better match the observedtsunamis. Slip to the east of Ise Bay (6D in Fig. 5a; 1.0 m)and around Hamana Lake (6C in Fig. 5a; 1.4 m) hasdisappeared, but the checkerboard resoltuion test suggeststhat these were not resolved well in any case. The slip onsubfault 4A increased from 0.5 m to 1.5 m, which may berelated to the changed pattern of slip in the next landwardrow of subfaults (4B, 5B and 6B).
Last, we estimated the slip distribution with allimprovements incorporated: the realistic plate model,finer subfaults and the horizontal movement effect ontsunami generation (Fig. 7a and Table 1). A compar-ison of the observed and computed tsunami waveformsis also shown in Fig. 7b. The slip in the row of subfaultsalong the trough axis is decreased by about 15%relative to the result obtained without considering theeffect of horizontal displacement (Fig. 6). This occursbecause the inclusion of the horizontal displacementeffect makes slip near the trough more effective ingenerating a tsunami, so that the slip required toproduce a given amount of sea surface deformation isless. The improvements of using the finer subfaults andthe realistic plate shape let slip on subfaults near thetrench increase, but the improvement of including the
te model and finer subfaults. The number in each subfault indicates the
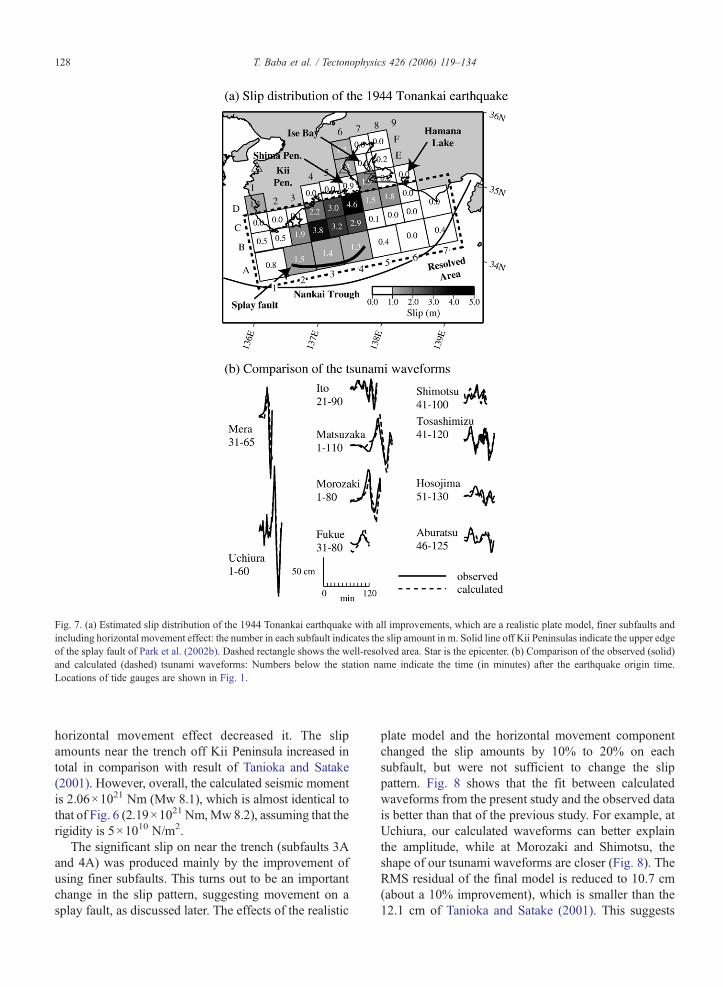
Fig. 7. (a) Estimated slip distribution of the 1944 Tonankai earthquake with all improvements, which are a realistic plate model, finer subfaults andincluding horizontal movement effect: the number in each subfault indicates the slip amount in m. Solid line off Kii Peninsulas indicate the upper edgeof the splay fault of Park et al. (2002b). Dashed rectangle shows the well-resolved area. Star is the epicenter. (b) Comparison of the observed (solid)and calculated (dashed) tsunami waveforms: Numbers below the station name indicate the time (in minutes) after the earthquake origin time.Locations of tide gauges are shown in Fig. 1.
128 T. Baba et al. / Tectonophysics 426 (2006) 119–134
horizontal movement effect decreased it. The slipamounts near the trench off Kii Peninsula increased intotal in comparison with result of Tanioka and Satake(2001). However, overall, the calculated seismic momentis 2.06×10²¹ Nm (Mw 8.1), which is almost identical tothat of Fig. 6 (2.19×10²¹ Nm,Mw 8.2), assuming that therigidity is 5×10¹⁰ N/m2.
The significant slip on near the trench (subfaults 3Aand 4A) was produced mainly by the improvement ofusing finer subfaults. This turns out to be an importantchange in the slip pattern, suggesting movement on asplay fault, as discussed later. The effects of the realistic
plate model and the horizontal movement componentchanged the slip amounts by 10% to 20% on eachsubfault, but were not sufficient to change the slippattern. Fig. 8 shows that the fit between calculatedwaveforms from the present study and the observed datais better than that of the previous study. For example, atUchiura, our calculated waveforms can better explainthe amplitude, while at Morozaki and Shimotsu, theshape of our tsunami waveforms are closer (Fig. 8). TheRMS residual of the final model is reduced to 10.7 cm(about a 10% improvement), which is smaller than the12.1 cm of Tanioka and Satake (2001). This suggests
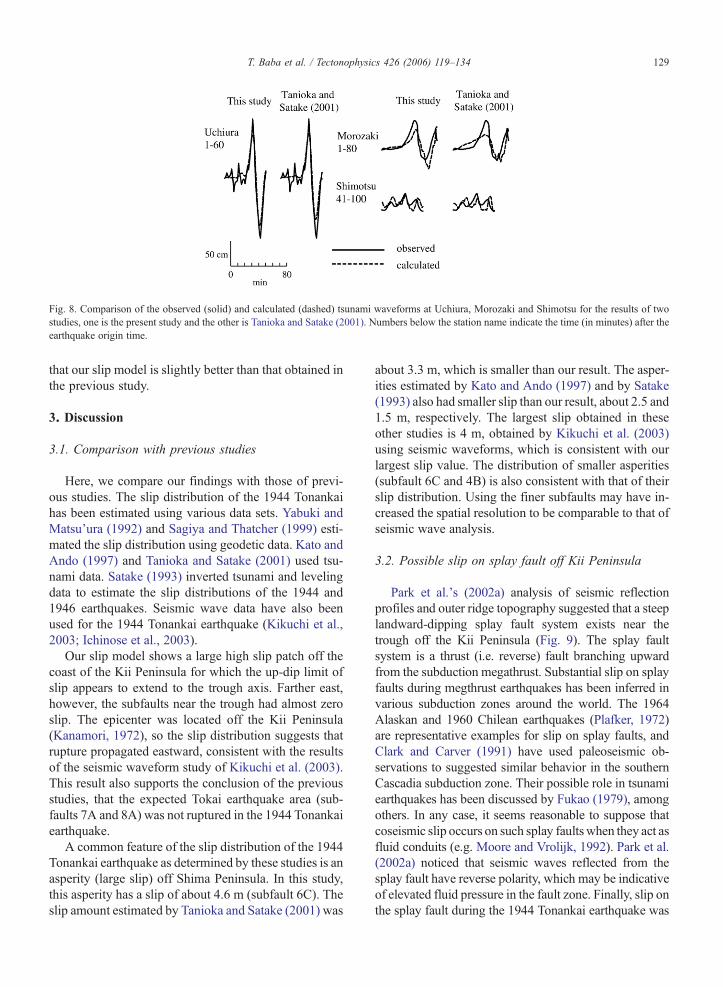
Fig. 8. Comparison of the observed (solid) and calculated (dashed) tsunami waveforms at Uchiura, Morozaki and Shimotsu for the results of twostudies, one is the present study and the other is Tanioka and Satake (2001). Numbers below the station name indicate the time (in minutes) after theearthquake origin time.
129T. Baba et al. / Tectonophysics 426 (2006) 119–134
that our slip model is slightly better than that obtained inthe previous study.
3. Discussion
3.1. Comparison with previous studies
Here, we compare our findings with those of previ-ous studies. The slip distribution of the 1944 Tonankaihas been estimated using various data sets. Yabuki andMatsu'ura (1992) and Sagiya and Thatcher (1999) esti-mated the slip distribution using geodetic data. Kato andAndo (1997) and Tanioka and Satake (2001) used tsu-nami data. Satake (1993) inverted tsunami and levelingdata to estimate the slip distributions of the 1944 and1946 earthquakes. Seismic wave data have also beenused for the 1944 Tonankai earthquake (Kikuchi et al.,2003; Ichinose et al., 2003).
Our slip model shows a large high slip patch off thecoast of the Kii Peninsula for which the up-dip limit ofslip appears to extend to the trough axis. Farther east,however, the subfaults near the trough had almost zeroslip. The epicenter was located off the Kii Peninsula(Kanamori, 1972), so the slip distribution suggests thatrupture propagated eastward, consistent with the resultsof the seismic waveform study of Kikuchi et al. (2003).This result also supports the conclusion of the previousstudies, that the expected Tokai earthquake area (sub-faults 7A and 8A) was not ruptured in the 1944 Tonankaiearthquake.
A common feature of the slip distribution of the 1944Tonankai earthquake as determined by these studies is anasperity (large slip) off Shima Peninsula. In this study,this asperity has a slip of about 4.6 m (subfault 6C). Theslip amount estimated by Tanioka and Satake (2001) was
about 3.3 m, which is smaller than our result. The asper-ities estimated by Kato and Ando (1997) and by Satake(1993) also had smaller slip than our result, about 2.5 and1.5 m, respectively. The largest slip obtained in theseother studies is 4 m, obtained by Kikuchi et al. (2003)using seismic waveforms, which is consistent with ourlargest slip value. The distribution of smaller asperities(subfault 6C and 4B) is also consistent with that of theirslip distribution. Using the finer subfaults may have in-creased the spatial resolution to be comparable to that ofseismic wave analysis.
3.2. Possible slip on splay fault off Kii Peninsula
Park et al.'s (2002a) analysis of seismic reflectionprofiles and outer ridge topography suggested that a steeplandward-dipping splay fault system exists near thetrough off the Kii Peninsula (Fig. 9). The splay faultsystem is a thrust (i.e. reverse) fault branching upwardfrom the subduction megathrust. Substantial slip on splayfaults during megthrust earthquakes has been inferred invarious subduction zones around the world. The 1964Alaskan and 1960 Chilean earthquakes (Plafker, 1972)are representative examples for slip on splay faults, andClark and Carver (1991) have used paleoseismic ob-servations to suggested similar behavior in the southernCascadia subduction zone. Their possible role in tsunamiearthquakes has been discussed by Fukao (1979), amongothers. In any case, it seems reasonable to suppose thatcoseismic slip occurs on such splay faultswhen they act asfluid conduits (e.g. Moore and Vrolijk, 1992). Park et al.(2002a) noticed that seismic waves reflected from thesplay fault have reverse polarity, which may be indicativeof elevated fluid pressure in the fault zone. Finally, slip onthe splay fault during the 1944 Tonankai earthquake was
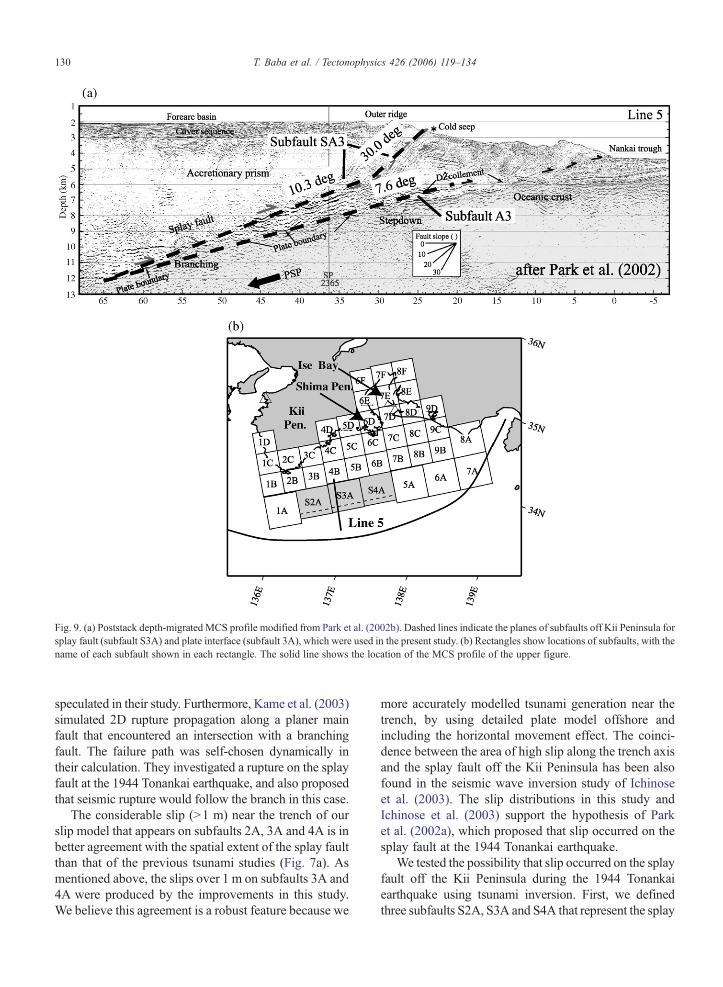
Fig. 9. (a) Poststack depth-migrated MCS profile modified from Park et al. (2002b). Dashed lines indicate the planes of subfaults off Kii Peninsula forsplay fault (subfault S3A) and plate interface (subfault 3A), which were used in the present study. (b) Rectangles show locations of subfaults, with thename of each subfault shown in each rectangle. The solid line shows the location of the MCS profile of the upper figure.
130 T. Baba et al. / Tectonophysics 426 (2006) 119–134
speculated in their study. Furthermore, Kame et al. (2003)simulated 2D rupture propagation along a planer mainfault that encountered an intersection with a branchingfault. The failure path was self-chosen dynamically intheir calculation. They investigated a rupture on the splayfault at the 1944 Tonankai earthquake, and also proposedthat seismic rupture would follow the branch in this case.
The considerable slip (N1 m) near the trench of ourslip model that appears on subfaults 2A, 3A and 4A is inbetter agreement with the spatial extent of the splay faultthan that of the previous tsunami studies (Fig. 7a). Asmentioned above, the slips over 1 m on subfaults 3A and4A were produced by the improvements in this study.We believe this agreement is a robust feature because we
more accurately modelled tsunami generation near thetrench, by using detailed plate model offshore andincluding the horizontal movement effect. The coinci-dence between the area of high slip along the trench axisand the splay fault off the Kii Peninsula has been alsofound in the seismic wave inversion study of Ichinoseet al. (2003). The slip distributions in this study andIchinose et al. (2003) support the hypothesis of Parket al. (2002a), which proposed that slip occurred on thesplay fault at the 1944 Tonankai earthquake.
We tested the possibility that slip occurred on the splayfault off the Kii Peninsula during the 1944 Tonankaiearthquake using tsunami inversion. First, we definedthree subfaults S2A, S3A and S4A that represent the splay
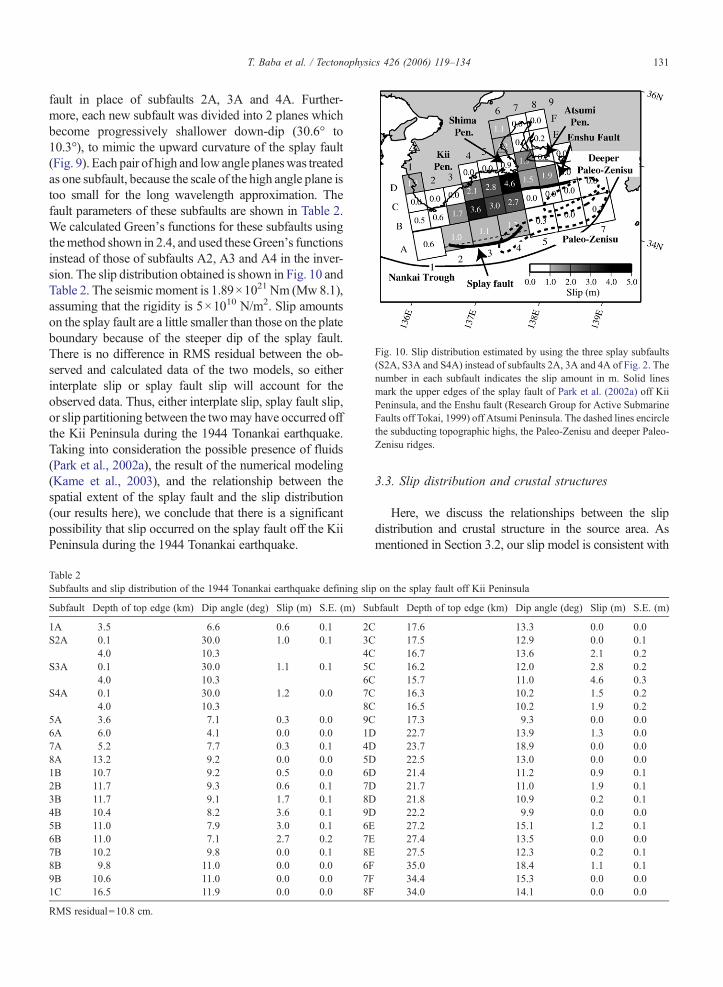
Fig. 10. Slip distribution estimated by using the three splay subfaults(S2A, S3A and S4A) instead of subfaults 2A, 3A and 4A of Fig. 2. Thenumber in each subfault indicates the slip amount in m. Solid linesmark the upper edges of the splay fault of Park et al. (2002a) off KiiPeninsula, and the Enshu fault (Research Group for Active SubmarineFaults off Tokai, 1999) off Atsumi Peninsula. The dashed lines encirclethe subducting topographic highs, the Paleo-Zenisu and deeper Paleo-Zenisu ridges.
131T. Baba et al. / Tectonophysics 426 (2006) 119–134
fault in place of subfaults 2A, 3A and 4A. Further-more, each new subfault was divided into 2 planes whichbecome progressively shallower down-dip (30.6° to10.3°), to mimic the upward curvature of the splay fault(Fig. 9). Each pair of high and lowangle planeswas treatedas one subfault, because the scale of the high angle plane istoo small for the long wavelength approximation. Thefault parameters of these subfaults are shown in Table 2.We calculated Green's functions for these subfaults usingthemethod shown in 2.4, and used theseGreen's functionsinstead of those of subfaults A2, A3 and A4 in the inver-sion. The slip distribution obtained is shown in Fig. 10 andTable 2. The seismic moment is 1.89×10²¹ Nm (Mw 8.1),assuming that the rigidity is 5×10¹⁰ N/m2. Slip amountson the splay fault are a little smaller than those on the plateboundary because of the steeper dip of the splay fault.There is no difference in RMS residual between the ob-served and calculated data of the two models, so eitherinterplate slip or splay fault slip will account for theobserved data. Thus, either interplate slip, splay fault slip,or slip partitioning between the twomay have occurred offthe Kii Peninsula during the 1944 Tonankai earthquake.Taking into consideration the possible presence of fluids(Park et al., 2002a), the result of the numerical modeling(Kame et al., 2003), and the relationship between thespatial extent of the splay fault and the slip distribution(our results here), we conclude that there is a significantpossibility that slip occurred on the splay fault off the KiiPeninsula during the 1944 Tonankai earthquake.
Table 2Subfaults and slip distribution of the 1944 Tonankai earthquake defining slip
Subfault Depth of top edge (km) Dip angle (deg) Slip (m) S.E. (m) Su
1A 3.5 6.6 0.6 0.1 2CS2A 0.1 30.0 1.0 0.1 3C
4.0 10.3 4CS3A 0.1 30.0 1.1 0.1 5C
4.0 10.3 6CS4A 0.1 30.0 1.2 0.0 7C
4.0 10.3 8C5A 3.6 7.1 0.3 0.0 9C6A 6.0 4.1 0.0 0.0 1D7A 5.2 7.7 0.3 0.1 4D8A 13.2 9.2 0.0 0.0 5D1B 10.7 9.2 0.5 0.0 6D2B 11.7 9.3 0.6 0.1 7D3B 11.7 9.1 1.7 0.1 8D4B 10.4 8.2 3.6 0.1 9D5B 11.0 7.9 3.0 0.1 6E6B 11.0 7.1 2.7 0.2 7E7B 10.2 9.8 0.0 0.1 8E8B 9.8 11.0 0.0 0.0 6F9B 10.6 11.0 0.0 0.0 7F1C 16.5 11.9 0.0 0.0 8F
RMS residual=10.8 cm.
3.3. Slip distribution and crustal structures
Here, we discuss the relationships between the slipdistribution and crustal structure in the source area. Asmentioned in Section 3.2, our slip model is consistent with
on the splay fault off Kii Peninsula
bfault Depth of top edge (km) Dip angle (deg) Slip (m) S.E. (m)
17.6 13.3 0.0 0.017.5 12.9 0.0 0.116.7 13.6 2.1 0.216.2 12.0 2.8 0.215.7 11.0 4.6 0.316.3 10.2 1.5 0.216.5 10.2 1.9 0.217.3 9.3 0.0 0.022.7 13.9 1.3 0.023.7 18.9 0.0 0.022.5 13.0 0.0 0.021.4 11.2 0.9 0.121.7 11.0 1.9 0.121.8 10.9 0.2 0.122.2 9.9 0.0 0.027.2 15.1 1.2 0.127.4 13.5 0.0 0.027.5 12.3 0.2 0.135.0 18.4 1.1 0.134.4 15.3 0.0 0.034.0 14.1 0.0 0.0
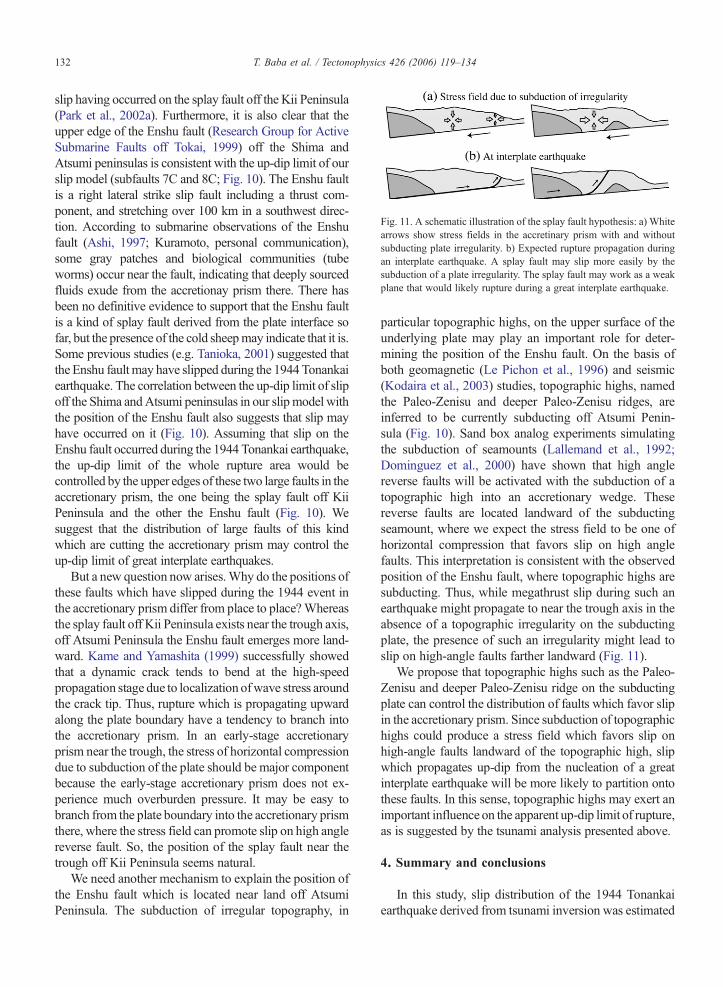
Fig. 11. A schematic illustration of the splay fault hypothesis: a) Whitearrows show stress fields in the accretinary prism with and withoutsubducting plate irregularity. b) Expected rupture propagation duringan interplate earthquake. A splay fault may slip more easily by thesubduction of a plate irregularity. The splay fault may work as a weakplane that would likely rupture during a great interplate earthquake.
132 T. Baba et al. / Tectonophysics 426 (2006) 119–134
slip having occurred on the splay fault off the Kii Peninsula(Park et al., 2002a). Furthermore, it is also clear that theupper edge of the Enshu fault (Research Group for ActiveSubmarine Faults off Tokai, 1999) off the Shima andAtsumi peninsulas is consistent with the up-dip limit of ourslip model (subfaults 7C and 8C; Fig. 10). The Enshu faultis a right lateral strike slip fault including a thrust com-ponent, and stretching over 100 km in a southwest direc-tion. According to submarine observations of the Enshufault (Ashi, 1997; Kuramoto, personal communication),some gray patches and biological communities (tubeworms) occur near the fault, indicating that deeply sourcedfluids exude from the accretionay prism there. There hasbeen no definitive evidence to support that the Enshu faultis a kind of splay fault derived from the plate interface sofar, but the presence of the cold sheepmay indicate that it is.Some previous studies (e.g. Tanioka, 2001) suggested thatthe Enshu fault may have slipped during the 1944 Tonankaiearthquake. The correlation between the up-dip limit of slipoff the Shima andAtsumi peninsulas in our slipmodel withthe position of the Enshu fault also suggests that slip mayhave occurred on it (Fig. 10). Assuming that slip on theEnshu fault occurred during the 1944 Tonankai earthquake,the up-dip limit of the whole rupture area would becontrolled by the upper edges of these two large faults in theaccretionary prism, the one being the splay fault off KiiPeninsula and the other the Enshu fault (Fig. 10). Wesuggest that the distribution of large faults of this kindwhich are cutting the accretionary prism may control theup-dip limit of great interplate earthquakes.
But a new question now arises.Why do the positions ofthese faults which have slipped during the 1944 event inthe accretionary prism differ from place to place?Whereasthe splay fault off Kii Peninsula exists near the trough axis,off Atsumi Peninsula the Enshu fault emerges more land-ward. Kame and Yamashita (1999) successfully showedthat a dynamic crack tends to bend at the high-speedpropagation stage due to localization ofwave stress aroundthe crack tip. Thus, rupture which is propagating upwardalong the plate boundary have a tendency to branch intothe accretionary prism. In an early-stage accretionaryprism near the trough, the stress of horizontal compressiondue to subduction of the plate should be major componentbecause the early-stage accretionary prism does not ex-perience much overburden pressure. It may be easy tobranch from the plate boundary into the accretionary prismthere, where the stress field can promote slip on high anglereverse fault. So, the position of the splay fault near thetrough off Kii Peninsula seems natural.
We need another mechanism to explain the position ofthe Enshu fault which is located near land off AtsumiPeninsula. The subduction of irregular topography, in
particular topographic highs, on the upper surface of theunderlying plate may play an important role for deter-mining the position of the Enshu fault. On the basis ofboth geomagnetic (Le Pichon et al., 1996) and seismic(Kodaira et al., 2003) studies, topographic highs, namedthe Paleo-Zenisu and deeper Paleo-Zenisu ridges, areinferred to be currently subducting off Atsumi Penin-sula (Fig. 10). Sand box analog experiments simulatingthe subduction of seamounts (Lallemand et al., 1992;Dominguez et al., 2000) have shown that high anglereverse faults will be activated with the subduction of atopographic high into an accretionary wedge. Thesereverse faults are located landward of the subductingseamount, where we expect the stress field to be one ofhorizontal compression that favors slip on high anglefaults. This interpretation is consistent with the observedposition of the Enshu fault, where topographic highs aresubducting. Thus, while megathrust slip during such anearthquake might propagate to near the trough axis in theabsence of a topographic irregularity on the subductingplate, the presence of such an irregularity might lead toslip on high-angle faults farther landward (Fig. 11).
We propose that topographic highs such as the Paleo-Zenisu and deeper Paleo-Zenisu ridge on the subductingplate can control the distribution of faults which favor slipin the accretionary prism. Since subduction of topographichighs could produce a stress field which favors slip onhigh-angle faults landward of the topographic high, slipwhich propagates up-dip from the nucleation of a greatinterplate earthquake will be more likely to partition ontothese faults. In this sense, topographic highs may exert animportant influence on the apparent up-dip limit of rupture,as is suggested by the tsunami analysis presented above.
4. Summary and conclusions
In this study, slip distribution of the 1944 Tonankaiearthquake derived from tsunami inversion was estimated
133T. Baba et al. / Tectonophysics 426 (2006) 119–134
using a realistic plate model constructed from seismicsurvey results. A distribution of subfaults that is finer thanconsidered in previous tsunami studies was used in theanalysis. The effect of horizontal movement due to fault-ing was also considered in tsunami generation. Further-more, the reliability of the solution was checked using acheckerboard resolution test.
The 1944 Tonankai earthquake slip distribution hasan asperity off the Shima Peninsula. There was consid-erable slip throughout the area between the coast of theKii Peninsula to the trough axis. Slip near the trough axisoff the Kii Peninsula was considerably larger than thatobtained in previous studies (Tanioka and Satake, 2001),due to the shallower dip of our plate model. On the oth-er hand, the easternmost subfaults near the trough hadalmost zero slip. The estimated seismic moment is2.06×1021 Nm (Mw 8.1), assuming that the rigidity is5×1010 N/m2. The RMS residual is 10.7 cm, which issmaller than obtained in previous studies (12.1 cm) usingtsunami waveforms.
The considerable slip (N1 m) near the trough off theKii Peninsula gives a better agreement with the spatialextent of the splay fault observed there (Park et al.,2002a) than the previous estimate of Tanioka and Satake(2001). We also tested the possibility that slip occurredon this splay fault during the 1944 Tonankai earthquake.The amount of slip decreased if it is assumed to haveoccurred on the splay fault because of its steeper dip, butthere is no difference in the RMS residual between ob-served and calculated data for the two models. Thus,either interplate slip or splay fault slip will account forthe observed data. We therefore conclude that slip nearthe trough axis during the 1944 Tonankai earthquake isjust as likely to have occurred on the splay fault as on theplate boundary. Furthermore, the position of the Enshufault off the Atsumi and Shima Peninsulas is also con-sistent with the up-dip limit of the rupture area. Thesetwo faults, on which slip may occur in preference to theplate boundary, may have played an important role indetermining the apparent up-dip limit of rupture prop-agation. We further suggest that the distribution of thesefaults may be influenced by the subduction of topo-graphic highs, which therefore may play an importantrole in determining the up-dip limit of rupture.
Acknowledgments
We deeply thank Yuichiro Tanioka for providing uswith his tsunami analysis tools and waveforms for the1944 Tonankai earthquake. We also thank Harold Tobinand Stephano Tinti for reviewing the paper. We wish tothank Yoshiteru Kono for his continuous support. We
used Generic Mapping tools (Wessel and Smith, 1995)to make the plate configuration and figures in this paper.
References
Ando, M., 1975. Source mechanisms and tectonic significance ofhistorical earthquake along the Nankai trough, Japan. Tectono-physics 27, 119–140.
Ashi, J., 1997. Distribution of cold seepage at the fault scarp of theeastern Nankai accretionary prism. JAMSTEC J. Deep Sea Res.13, 495–501.
Baba, T., Tanioka, Y., Cummins, P.R., Uhira, K., 2002. The slipdistribution of the 1946 Nankai earthquake estimated from tsunamiinversion using a new plate model. Phys. Earth Planet. Inter. 132,59–73.
Clark, S.H., Carver, G.A., 1991. Late holocene tectonics andpaleoseismicity, southern Cascadia subduction zone. Science255, 188–192.
Cummins, P.R., Kaneda, Y., 2000. Possible splay fault slip during the1946 Nankai earthquake. Geophys. Res. Lett. 27, 2725–2728.
Cummins, P.R., Baba, T., Kodaira, S., Kaneda, Y., 2002. The 1946Nankaido earthquake and segmentation of the Nankai Trough.Phys. Earth Planet. Inter. 132, 75–87.
Dominguez, S., Malavieille, J., Lallemand, S.E., 2000. Deformation ofaccretionary wedges in response to seamount subduction: Insightsfrom sandbox experiments. Tectonics 19, 182–196.
Fukao, Y., 1979. Tsunami earthquake and subduction processes neardeep-sea trenches. J. Geophys. Res. 84, 2303–2314.
Ichikawa, G., 1997. Ocean bottom seismographic experiment to studycrustal structure in Hyuga-nada (in Japanese), MSc thesis,Hokkaido University.
Ichinose, G.A., Thio, H.K., Somerville, P.G., Sato, T., Ishii, T., 2003.Rupture process of the 1944 Tonankai earthquake (Ms 8.1) fromthe inversion of teleseismic and regional seismograms. J. Geophys.Res. 108 (B10), 2497. doi:10.1029/2003JB002393.
Ito, K., 1990. Seismic activity and tectonics in southwestern Japan (inJapanese). Zisin, J. Seismol. Soc. Jpn. 43, 555–569.
Ishibashi, K., Satake, K., 1998. Problems on forecasting great earth-quakes in the subduction zones around Japan by means ofpaleoseismology (in Japanese). Zisin, J. Seismol. Soc. Jpn. 50, 1–21.
Kajiura, K., 1963. The leading wave of a tsunami. Bull. Earthq. Res.Inst. 41, 535–571.
Kame, N., Yamashita, T., 1999. Simulation of the spontaneous growthof a dynamic crack without constraints on the crack tip path.Geophys. J. Int. 139, 345–358.
Kame, N., Rice, J.R., Dmowska, R., 2003. Effects of pre-stress stateand rupture velocity on dynamic fault branching. J. Geophys. Res.108. doi:10.1029/2002JB002189.
Kanamori, H., 1972. Tectonic implications of the 1944 Tonankai and the1946 Nakaido earthquakes. Phys. Earth Planet Inter. 5, 129–139.
Kato, T., Ando, M., 1997. Source mechanisms of the 1944 Tonankaiand 1946 Nankaido earthquakes: Spatial heterogeneity of risetimes. Geophys. Res. Lett. 24, 2055–2058.
Kikuchi, M., Nakamura, M., Yoshikawa, K., 2003. Fault asperity oflarge earthquakes in Japan inferred from low-gain historicalseismograms. Earth Planets Space 55, 159–172.
Kodaira, S., Takahashi, N., Nakanishi, A., Miura, S., Kaneda, Y.,2000a. Subducted seamount imaged in the rupture zone of the1946 Nankaido Earthquake. Science 289, 104–106.
Kodaira, S., Takahashi, N., Park, J.-O., Mochizuki, K., Shinohara, M.,Kimura, S., 2000b. Western Nankai Trough seismogenic zone:
134 T. Baba et al. / Tectonophysics 426 (2006) 119–134
Results from a wide-angle ocean bottom seismic survey. J. Geophys.Res. 105, 5887–5905.
Kodaira, S., Kurashimo, E., Park, J.-O., Takahashi, N., Nakanishi, A.,Miura, S., Iwasaki, T., Hirata, N., Ito, K., Kaneda, Y., 2002.Structural factors controlling the rupture process of a megathrustearthquakes at the Nankai trough seismogenic zone. Geophys. J.Int. 149, 815–835.
Kodaira, S., Obana, K. Nakanishi, A. Park, J.-O. Ito, A. Tsuru, T., Kaneda,Y., 2003. Cyclic ridge subduction at an inter-plate locked zone offcentral Japan. Geophys. Res. Lett. 30. doi:10.1029/2002GL016595.
Lallemand, S.E., Malavieille, J., Calassou, S., 1992. Effects of oceanicridge subduction on accretionary wedges: Experimental modelingand marine observations. Tectonics 11, 1301–1313.
Lawson, C.L., Hanson, R.J., 1974. Solving Least Squares Problems.340 pp., Prentice-hall series in automatic computation.
Le Pichon, X., Lallemant, S., Tokuyama, H., Thoue, F., Huchon, P.,Henry, P., 1996. Structure and evolution of the backstop in theeastern Nankai Trough area (Japan): Implications for the soon-to-come Tokai earthquake. Isl. Arc 5, 440–454.
Mizoue, M., Nakamura, M., Seto, N., Ishiketa, Y., Yokota, T., 1983.Three-layered distribution of microearthquakes in relation to focalmechanism variation in the Kii peninsula, southwestern Honsyu,Japan. Bull. Earthq. Res. Inst. Univ. Tokyo 58, 287–310.
Moore, J.C., Vrolijk, P., 1992. Fluids in accretionary prism. Rev.Geophys. 30, 113–135.
Moore, J.C., Shipley, T.H., Stoffa, P.L., Karig, D.E., Taira, A.,Kuramoto, S., Tokuyama, H., Suehiro, K., 1990. Structure of theNankai Trough accretionary zone from multichannel seismicreflection data. J. Geophys. Res. 95, 8753–8765.
Mochizuki, K., Fujie, G., Sato, T., Kasahara, J., Hino, R., Shinohara,M., Suehiro, K., 1998. Heterogeneous crustal structure across aseismic bloc boundary along the Nankai Trough. Geophys. Res.Lett. 13, 2301–2304.
Nakamura, M., Watanabe, H., Konomi, T., Kimura, S., Miura, K.,1997. Characteristic activities of subcrustal earthquakes along theouter zone of southwestern Japan (in Japanese). Ann. Disas. Prev.Res. Inst., Kyoto Univ. 40, 1–20.
Nakanishi, A., Shiobara, H., Hino, R., Kodaira, S., Kanazawa, T.,Shimamura, H., 1998. Detail subduction structure across theeastern Nankai Trough obtained from ocean bottom seismographicprofiles. J. Geophys. Res. 103, 27151–27168.
Nakanishi, A., Kodaira, S., Park, J.-O., Kaneda, Y., 2002a. Deformablebackstop as seaward end of coseismic slip in the Nankai Troughseismogenic zone. EPSL 203, 255–263.
Nakanishi, A., Shiobara, H., Hino, R., Mochizuki, K., Sato, T.,Kasahara, J., Takahashi, N., Suehiro, K., Tokuyama, H., Segawa,J., Shiohara, M., Shimamura, H., 2002b. Deep Crustal Structure ofthe Eastern Nankai Trough and Zenisu Ridge by Dense Airgun-OBS Seismic Profiling. Mar. Geol. 187, 47–62.
Nakanishi, A., Takahashi, N., Park, J.-O., Miura, S., Kodaira, S., Kaneda,Y., Hirata, N., Iwasaki, T., Nakamura, M., 2002c. Crustal structureacross the coseismic rupture zone of the 1944 Tonankai earthquake,the central Nankai Trough seismogenic zone. J. Geophys. Res. 107.doi:10.1029/2001JB000424.
Nishizaka, H., 1997. Crustal structure of subduction zone of PhilippineSea Plate and forearc off Kii Peninsula in the Nankai trough, MScthesis, Univ Chiba.
Okada, Y., 1985. Surface deformation due to shear and tensile faults ina half-space. Bull. Seismol. Soc. Am. 75, 1135–1154.
Okano, K., Kimura, S., Konomi, T., Nakamura, M., 1985. The focaldistribution of earthquakes in Shikoku and its surrounding regions(in Japanese). Zisin, J. Seismol. Soc. Jpn. 38, 93–103.
Park, J.-O., Tsuru, T., Kodaira, S., Cummins, P.R., Kaneda, Y., 2002a.Splay fault branching from subduction megathrust. Science 297,1157–1160.
Park, J.-O., Tsuru, T., Takahasahi, N., Hori, T., Kodaira, S., Nakanishi,A., Miura, S., Kaneda, Y., 2002b. A deep strong reflector in theNankai accretionary wedge from multichannel seismic data:Implications for underplating and interseismic shear stress release.J. Geophys. Res. 107. doi:10.1029/2001JB000262.
Plafker, G., 1972. Alaskan earthquake of 1964 and Chilean earthquakeof 1960: Implications for arc tectonics. J. Geophys. Res. 77,901–924.
Reserch Group for Active Submarie Faults off Tokai, 1999. ActiveSubmarine Faults Off Tokai: Results from the Japan FranceKAIKO Tokai Project. Univ. Tokyo Press. 151pp.
Sagiya, T., Thatcher, W., 1999. Coseismic slip resolution along aplate boundary magathrust: The Nankai Trough, southwestJapan. J. Geophys. Res. 104, 1111–1129.
Satake, K., 1989. Inversion of tsunami waveforms for the estimation ofheterogeneous fault motion of large submarine earthquakes: The1968 Tokachi-Oki and 1983 Japan sea earthquakes. J. Geophys.Res. 94, 5627–5636.
Satake, K., 1993. Depth distribution of coseismic slip along the NankaiTrough, Japan, from joint inversion of geodetic and tsunami data.J. Geophys. Res. 98, 4553–4565.
Sato, T., Mochizuki, K., Kasahara, J., Fujie, G., Nishikawa, H.,Koresawa, S., 1998. Depth variation of the crustal structure of thesubducting plate along the Nankai Trough, off Kii Channel, Japan.Geophys. Res. Lett. 25, 4011–4014.
Smith, W.H.F, Wessel, P., 1990. Gridding with continuous curvaturesplines in tension. Geophysics 55, 293–305.
Takahashi, N., Kodaira, S., Nakanishi, A., Miura, S., Park, J.-O., Tsuru, T.,Kaneda, Y., Kinoshita, H., Iwasaki, T., Hirata, N., 2002. Seismicstructural model of the western end of the Nankai trough seismogeniczone. J. Geophy. Res. 107. doi:10.1029/2000JB000121.
Takeda, T., Mapping of deep crustal structure based on a new scatteredstack method: application for wide angle reflection data (inJapanese), 2001, PhD thesis, Univ Tokyo.
Tanioka, Y., 2001. Interpretation of the slip distributions estimatedusing tsunami waveforms for the 1944 Tonankai and 1946 Nankaiearthquakes (in Japanese). J. Geogr. 491–497.
Tanioka, Y., Satake, K., 1996. Tsunami generation by horizontaldisplacement of ocean bottom. Geophys. Res. Lett. 23, 861–864.
Tanioka, Y., Satake, K., 2001. Detailed coseimic slip distribution of the1944 Tonankai earthquake estimated from tsunami waveforms.Geophys. Res. Lett. 28, 1075–1078.
Tichelaar, B.W., Ruff, L.J., 1989. How good are our best models?Jackknifing, bootstrapping, and earthquake depth. Eos 70 (593),605–606.
Wessel, P., Smith, W.H.F., 1995. New version generic mapping tools(GMT) version 3.0 released. Eos Trans. AGU 76, 329.
Yabuki, T., Matsu'ura, M., 1992. Geodetic data inversion using aBayesian information criterion for spatial distribution of fault slip.Geophys. J. Int. 109, 363–375.
Yamazaki, F., Ooida, T., 1985. Configuration of subducted PhilippineSea Plate beneath the Chubu district, central Japan (in Japanese).Zisin, J. Seismol. Soc. Jpn. 38, 193–201.