Embed Size (px)
Citation preview
HIGH QUALITY BEEF PRODUCTION IN BRAZIL1
Pedro Eduardo de Felício State University of Campinas Campinas, São Paulo, Brazil
INTRODUCTION
Brazil has the largest commercial cattle herd in the world, 174 million in 2010 (ANUALPEC, 2011), occupying a huge area of pasture, 163 million hectares (IBGE, 2010). According to the Ministry of Agriculture, in the period 1975 - 2008 beef production in Brazil increased from 10.8 kg to 38.6 kg of carcass per hectare of pasture, and total milk production increased from 7.95 billion to 26.92 billion liters per year. In the same period, the area used for agriculture and cattle has increased 10%, or approximately 272 thousand hectares aggregated yearly of which 73% with pastures and the remainder with crops (Gasques, Bastos, Bacchi, 2009).
However, grasslands are already yielding land for agriculture, being 4% from 1989 -2008. This tends to happen at even greater extent, and faster than it has until now, because demand for food will grow significantly while the new Forest Code expected to be approved by the Congress before the end of this year will supposedly protect natural biomes against indiscriminate occupation with crops and livestock. Currently, agriculture uses only about 50 million hectares, and one needs to consider the growing competition for land that will be used for reforestation and crops destined for biofuels production (Aguiar, 2011).
Former Agriculture minister Rodrigues (2011), quoting OECD-FAO report says: "the demand for food in the world will grow 20% until 2020 by the combination of population growth and per capita income in emerging economies - 85% of world population growth occurs in them”. And "increases in production to meet this demand will occur in member countries of the European Union (4%), North America (up 15%), Russia, China, India and Ukraine (25%). But the agribusiness in Brazil will expand its production over the next 10 years no less than 40%".
The intensification of grazing production systems will result in a great increase in productivity, which now is a little over one animal unit (1 A.U. is equal to 454 kg) per hectare, to compensate for the land that will be released for crops, and even for larger quantities of commodity grass fed beef. Intensification of grazing is considered one of the sustainable alternatives to minimize the pressure on opening new areas for agricultural production. This model, however, should be guided by the efficient use of physical resources, including rehabilitation of degraded areas, based on knowledge and technologies that can save inputs (Barcellos et al., 2008).
Also, more intensive feeding systems based on rations with sugar cane or corn silage and concentrates made with soybean crop residues or high grain and oilseeds such as soybeans and cottonseeds will be seen more and more frequently in Brazil. Feed lots became noticeable in the country in the 1980s as a mean to supply cattle to the industries in the second semester after the dry months of June – August, in the Midwest and Southeast states. It is estimated that in 1990, more than 700,000 heads of cattle were lot fed, number that was almost doubled in 1996, and reached 2.4 million heads in 2008 (ANUALPEC, 2009). According to a survey done by the beefpoint.com.br, the following two years, 2009-2010, showed a fall in animals fed, but for 2011 the 50 largest operations added together have been feeding 1.6 million heads of cattle.
Some of the interesting things about the increments in lot fed cattle numbers in Brazil are: the stimulus for investments in the feed, equipment and other supply industries; the raise in the
1 Presented at the 4th Korea – United States International Symposium: Producing High Quality Beef for the Global
Market. November 1-2, 2011. Texas A&M University, College Station, Texas USA.
2
employment of manpower including technical personnel; the adoption of Bos taurus x Bos indicus crossbreeding programs to get the advantage of heterosis in initial weight and efficiency of gain during the feeding period, and also a motive to implement traceability with the expectation of a bonus if the industry is exporting beef to the European Union.
Thus, the objective of this presentation is to show some facts about the Brazilian domestic and export markets, and how the country is developing conditions to supply high quality beef produced, fabricated, and packaged accordingly to importers specifications. For those who need more details about the Brazilian beef cattle industry it is recommended to access the recent technical papers by Ferraz & Felicio (2010), and Millen et al. (2011).
LIVESTOCK GROSS PRODUCT VALUE
The total livestock gross product value (LGPV), which includes beef, pork and poultry, is expected to reach US$ 64.4 billion in 2011, as it has just been announced by the Brazilian Agriculture Confederation in a press release (CNA, 2011). The sector should grow approximately 13.8% over 2010, when the LGPV was US$ 56.3 billion. The rising prices stimulated growth in meat production from the three supply chains, thus providing the revenue growth in the sector. The beef production chain, which last year had a GPV of US$ 24.8 billion, expects a growth of 16.9% to reach approximately US$ 28.8 billion in 2011, considering an expansion of production to nine million tons, up 3.1% compared to 2010, and 12.7% higher prices than those obtained in the previous year.
Brazil has a meat-packing industry of technical level ranging from excellent to tolerable, operating with an estimated 40% overcapacity, and therefore the few companies still in business are closing some plants. Those as well as the other units already paralyzed by the crisis of 2008-09, are or have been among the higher level ones. However, the situation will be improved in two or three years from now with an increase in finished cattle numbers.
Finally, our country has a very high level of technology in various segments of the production chain from breeding to carcass fabrication and meat processing. And also Brazil has an important industry of medicine and vaccines of veterinary use, and supplies in general, especially animal nutrition supplements, which can meet an even greater demand with proven products.
DOMESTIC MARKET
We have a huge internal market, which already consumes 38 kg cwe (carcass equivalent) or 23 kg (63 g/day) of boneless meat per capita, not counting salted meats and other meat products and offals, according to recent research from IBGE (2011), which also shows that beef is consumed by 49% of people in at least one of the two-day survey, second only in frequency of consumption to rice, coffee, beans and bread.
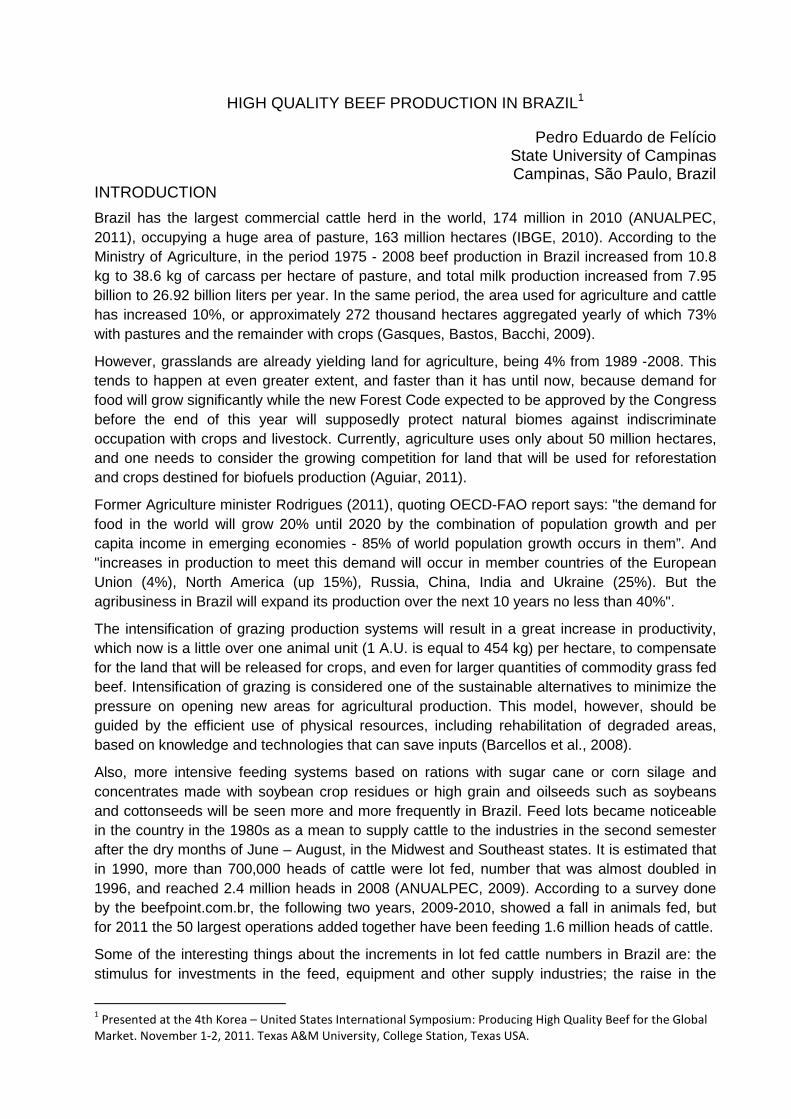
Food consumption has gone through a profound transformation in the past decade, with the social pyramid taking a diamond shape (Figure 1), with an increase of 16 million people in the classes A and B (which now account for 21% of the population or 42 million people) and 39 million in class C (now with more than 100 million people or 53% of the population), the remaining 25% are in classes D and E (48 million people).
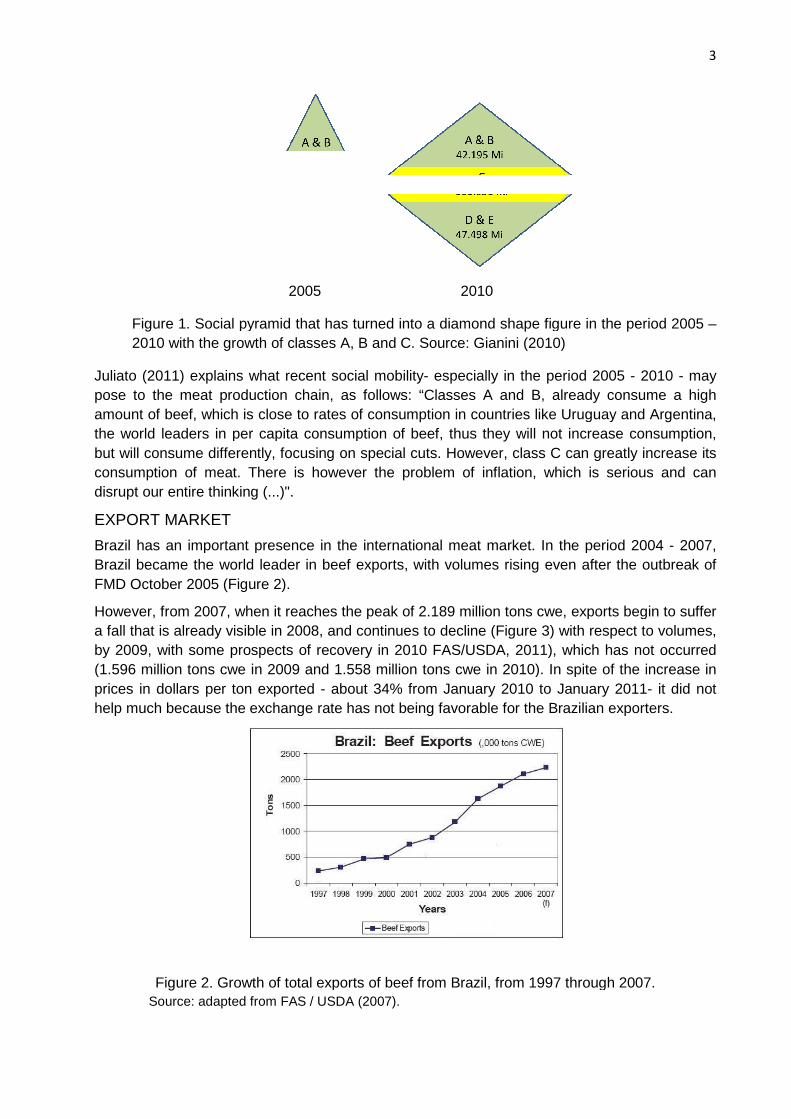
Figure 1. Social pyramid2010 with the growth of
Juliato (2011) explains what recent socialpose to the meat production chainamount of beef, which is close tothe world leaders in per capita consumption ofbut will consume differently, focusingconsumption of meat. There isdisrupt our entire thinking (...)".
EXPORT MARKET
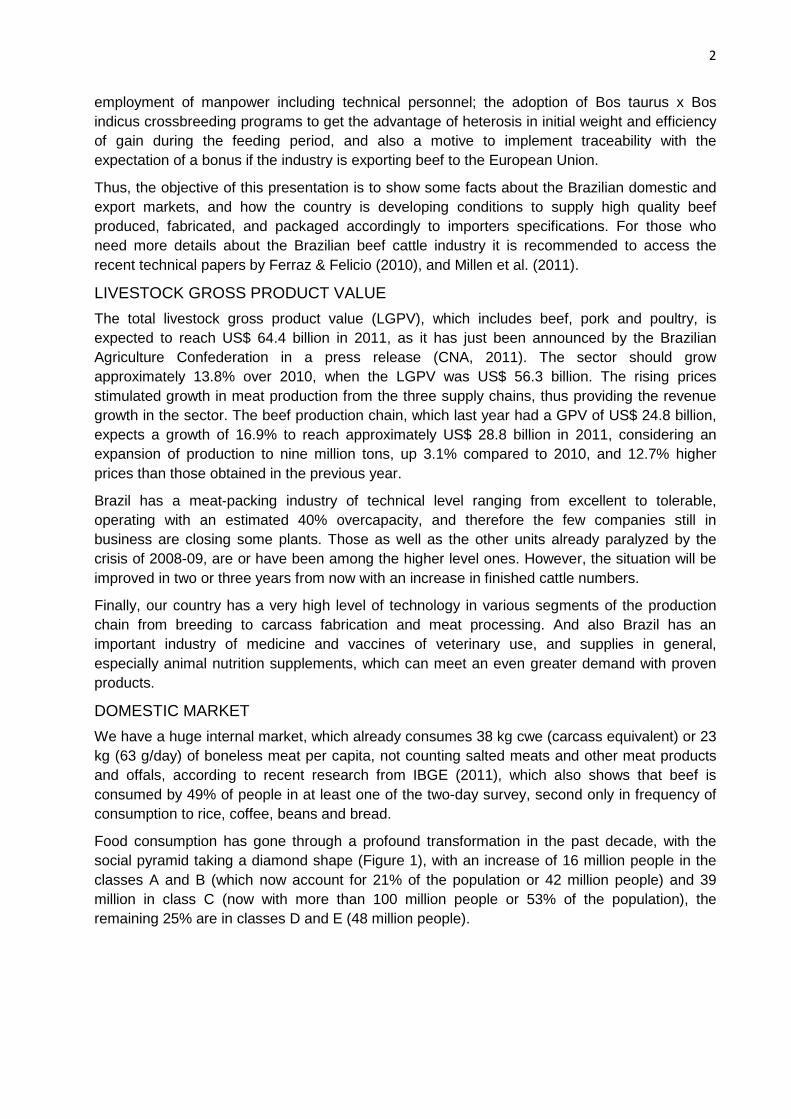
Brazil has an important presenceBrazil became the world leader inFMD October 2005 (Figure 2).
However, from 2007, when it reaches the peak of 2.189 million tons cwe, exports begin a fall that is already visible in 2008, and continues to decline (Figure 3)by 2009, with some prospects of recovery in 2010 FAS/USDA, 2011), which has not occurred (1.596 million tons cwe in 2009 and 1.558 million tonsprices in dollars per ton exported help much because the exchange rate has not being favorable for the Brazilian exporters.
Figure 2. Growth of total exports of Source: adapted from FAS
2005 2010
Social pyramid that has turned into a diamond shape figure classes A, B and C. Source: Gianini (2010)
recent social mobility- especially in the periodmeat production chain, as follows: “Classes A and B, already consume
which is close to rates of consumption in countries like Uruguay andper capita consumption of beef, thus they will not increase
differently, focusing on special cuts. However, class C cThere is however the problem of inflation, which is serious
(...)".
important presence in the international meat market. In the periodthe world leader in beef exports, with volumes rising even after
2).
However, from 2007, when it reaches the peak of 2.189 million tons cwe, exports begin a fall that is already visible in 2008, and continues to decline (Figure 3) with respect to volumes, by 2009, with some prospects of recovery in 2010 FAS/USDA, 2011), which has not occurred (1.596 million tons cwe in 2009 and 1.558 million tons cwe in 2010). In spite of the increase in prices in dollars per ton exported - about 34% from January 2010 to January 2011help much because the exchange rate has not being favorable for the Brazilian exporters.
of total exports of beef from Brazil, from 1997 through 2007.
FAS / USDA (2007).
3
figure in the period 2005 –
period 2005 - 2010 - may already consume a high
like Uruguay and Argentina, will not increase consumption,
can greatly increase its of inflation, which is serious and can
In the period 2004 - 2007, even after the outbreak of
However, from 2007, when it reaches the peak of 2.189 million tons cwe, exports begin to suffer with respect to volumes,
by 2009, with some prospects of recovery in 2010 FAS/USDA, 2011), which has not occurred cwe in 2010). In spite of the increase in
4% from January 2010 to January 2011- it did not help much because the exchange rate has not being favorable for the Brazilian exporters.
through 2007.
There have been problems with exports to the Middle East and Russia this year, 2011, which are large buyers of Brazilian beef. In the first case due to political movements and even war, in the second case due probably to a misunderstanding between Ministry of Agriculture.
Figure 3. Decrease in volume ofafter 2007. Note that the start of recoverySource: FAS/USDA (2010)
There are recent evidences that the instability in these markWhat does seem difficult and it is going to take longermarket with volumes of special cuts as it used to be until the end of 2007, becabarrier attributed to the problems we had with ournow operates under the name of Traces List, which records the farms authorized to export meat to the European market. The history of pressure tthe European Union was alreadyDirectorate General for Health and Consumer Protection (DG Sanco)"high restrictions and control on the Food Production Chain and Animal Health. January 31st, 2008, the EU would approved properties in Brazil that are fully aligned with the requirements and meet (EU, 2008). Note that this list isthose restrictions. Note also that Encephalopathy (OIE, 2011), which could justify such
The EU market is of vital importanceits member countries import, but interesting because its supermarkets are able to attract competitive prices of the Brazilian beef.
As shown in Figure 5 the Brazilian exports went through great changes in countries or regions since the beginning of 2008. The exports to EU went down from higher than 30% of participation in the period of 2005 reduction of approximately 20,000 thousand tons cuts. The exports to Russia and the Middle East which were already increasing, and at a smaller scale Venezuela, became Brazil´s predominant export markets for commodity beef.
There have been problems with exports to the Middle East and Russia this year, 2011, which are large buyers of Brazilian beef. In the first case due to political movements and even war, in the second case due probably to a misunderstanding between the Russian government and our
Decrease in volume of beef exports, and stagnation of thethe start of recovery in 2010 did not occur.
).
that the instability in these markets has already being overcome. and it is going to take longer is the return to
with volumes of special cuts as it used to be until the end of 2007, becaproblems we had with our traceability program. As a result, the barrier
now operates under the name of Traces List, which records the farms authorized to export meat The history of pressure to eliminate competition from Brazialready several years old, but was on December 19, 2007,
Directorate General for Health and Consumer Protection (DG Sanco) concededand control on imports of beef from Brazil with the support of the Committee
uction Chain and Animal Health. Member states agreed that, the EU would only permit the importation of meat from a shortlist
in Brazil that are fully aligned with the requirements and meet Note that this list is a requirement only for Brazil; no other
Note also that Brazil has never had any case of BSE , which could justify such measure.
of vital importance to the meat industry in Brazil, not only, but for the prices they pay. For the European trade
supermarkets are able to attract the consumers Brazilian beef.
5 the Brazilian exports went through great changes in since the beginning of 2008. The exports to EU went down from higher
than 30% of participation in the period of 2005 – 2007 to 5 – 10% in the following years, with a reduction of approximately 20,000 thousand tons cwe per month in the most expensive beef cuts. The exports to Russia and the Middle East which were already increasing, and at a smaller scale Venezuela, became Brazil´s predominant export markets for commodity beef.
4
There have been problems with exports to the Middle East and Russia this year, 2011, which are large buyers of Brazilian beef. In the first case due to political movements and even war, in
the Russian government and our
stagnation of the calf crop in Brazil
already being overcome. to the European Union
with volumes of special cuts as it used to be until the end of 2007, because of a trade As a result, the barrier
now operates under the name of Traces List, which records the farms authorized to export meat o eliminate competition from Brazilian beef in
, but was on December 19, 2007, that the conceded to introduce
n imports of beef from Brazil with the support of the Committee Member states agreed that, starting on
ation of meat from a shortlist of in Brazil that are fully aligned with the requirements and meet strict criteria"
other country has to meet SE - Bovine Spongiform
only for the amounts that European trade it is also very
the consumers to their stores with
5 the Brazilian exports went through great changes in its list of importer since the beginning of 2008. The exports to EU went down from higher
10% in the following years, with a per month in the most expensive beef
cuts. The exports to Russia and the Middle East which were already increasing, and at a smaller scale Venezuela, became Brazil´s predominant export markets for commodity beef.
Figure 4. Importers of Brazilian beef the total dollar revenueSource: courtesy of Sérgio Bertelli Pflanzer
WORLD DEMAND ESTIMATES ACCORDING TO THE
Figure 5. Meat production growth dominated by developing countries Production growth: by region and meaSource: adapted from OECD and FAO Outlook 2011.
. Importers of Brazilian beef in natura, from 2005 through 2010revenue from the exports of that product.
Source: courtesy of Sérgio Bertelli Pflanzer – UNICAMP.
WORLD DEMAND ESTIMATES ACCORDING TO THE OECD-FAO
Meat production growth dominated by developing countries Production growth: by region and meat type, 2020 vs. base period (cwe. or rtcSource: adapted from OECD and FAO Outlook 2011.
5
, from 2005 through 2010, in percentage of
FAO REPORT
Meat production growth dominated by developing countries Production t type, 2020 vs. base period (cwe. or rtc).
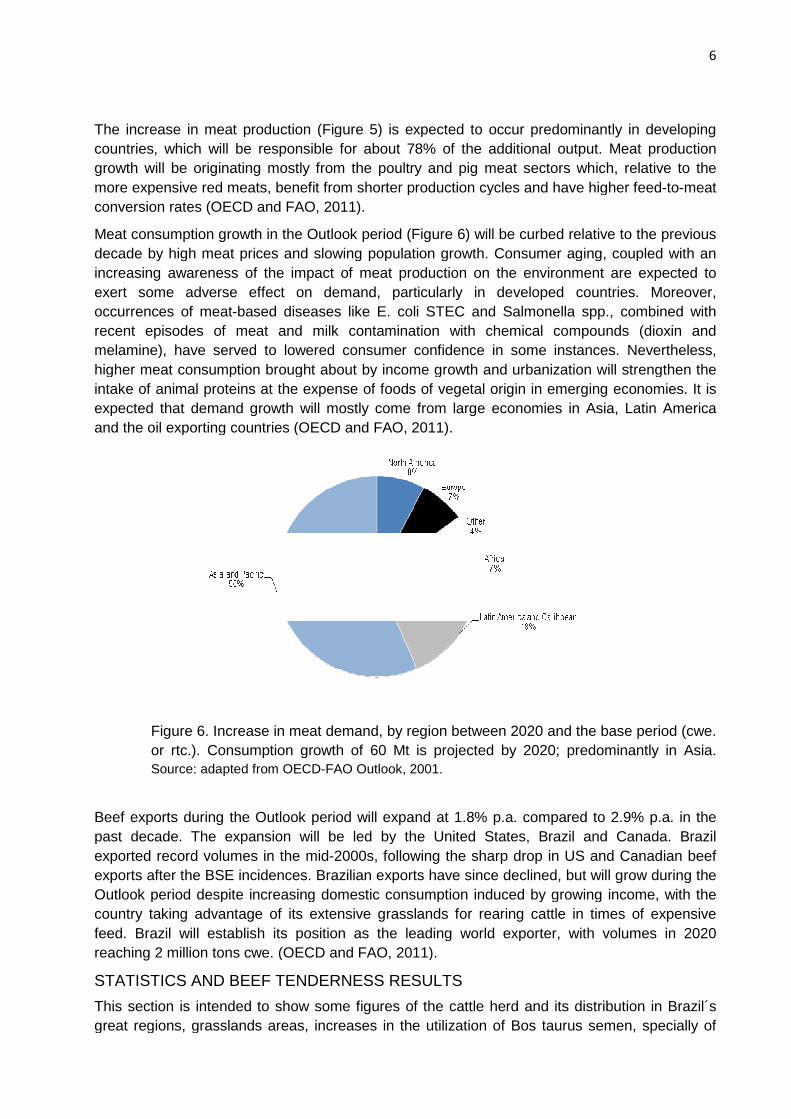
The increase in meat production (Figure countries, which will be responsible for about 78% of the additional output. Meat production growth will be originating mostly from the poultry and pigmore expensive red meats, benefit from shorterconversion rates (OECD and FAO, 2011).
Meat consumption growth in the Outlook period decade by high meat prices and slowing population growth. Consumer increasing awareness of the impact of meat production on the environment are expected to exert some adverse effect on demand, particularly in developed countries. Moreover, occurrences of meat-based diseases like E. colirecent episodes of meat and milk contamination with chemical compounds (dioxin and melamine), have served to lowered consumer confidence in some instances. Nevertheless, higher meat consumption brought about by income growth andintake of animal proteins at the expense of foods of vegetal origin in emerging economies. It is expected that demand growth will mostly and the oil exporting countries (
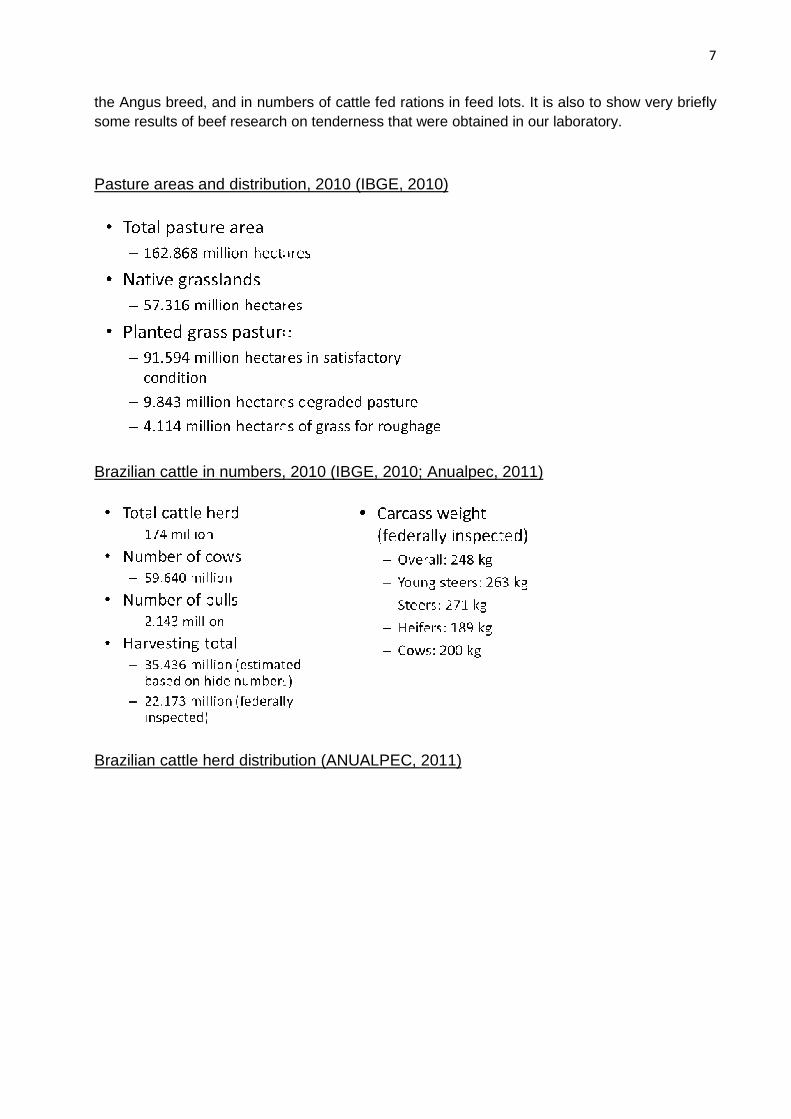
Figure 6. Increase in meat demand, by region betwor rtc.). Consumption growth of 60 Mt is projected by 2020; predominantly in Asia. Source: adapted from OECD
Beef exports during the Outlook period will expand at 1.8% p.a. compared to 2.9% p.a. in the past decade. The expansion will be led by the United States, Brazil and Canada. Brazil exported record volumes in the exports after the BSE incidences. Brazilian exports have since declined, but will grow during the Outlook period despite increasing domestic consumption induced by growing income, with the country taking advantage of its extensive grasslandsfeed. Brazil will establish its position as the leading world exporter, with volumes in 2020 reaching 2 million tons cwe. (OECD and FAO, 2011).
STATISTICS AND BEEF TENDERNESS RESULTS
This section is intended to shogreat regions, grasslands areas, increases in the utilization of
The increase in meat production (Figure 5) is expected to occur predomcountries, which will be responsible for about 78% of the additional output. Meat production growth will be originating mostly from the poultry and pig meat sectors which, relative to the more expensive red meats, benefit from shorter production cycles and have higher feedconversion rates (OECD and FAO, 2011).
Meat consumption growth in the Outlook period (Figure 6) will be curbed relative to the previous decade by high meat prices and slowing population growth. Consumer aging, coupled with an increasing awareness of the impact of meat production on the environment are expected to exert some adverse effect on demand, particularly in developed countries. Moreover,
based diseases like E. coli STEC and Salmonellarecent episodes of meat and milk contamination with chemical compounds (dioxin and melamine), have served to lowered consumer confidence in some instances. Nevertheless, higher meat consumption brought about by income growth and urbanization will strengthen the intake of animal proteins at the expense of foods of vegetal origin in emerging economies. It is expected that demand growth will mostly come from large economies in Asia, Latin America and the oil exporting countries (OECD and FAO, 2011).
. Increase in meat demand, by region between 2020 and the base period (cwe. Consumption growth of 60 Mt is projected by 2020; predominantly in Asia.
Source: adapted from OECD-FAO Outlook, 2001.
Beef exports during the Outlook period will expand at 1.8% p.a. compared to 2.9% p.a. in the past decade. The expansion will be led by the United States, Brazil and Canada. Brazil exported record volumes in the mid-2000s, following the sharp drop in US andexports after the BSE incidences. Brazilian exports have since declined, but will grow during the Outlook period despite increasing domestic consumption induced by growing income, with the country taking advantage of its extensive grasslands for rearing cattle in times of expensive feed. Brazil will establish its position as the leading world exporter, with volumes in 2020
(OECD and FAO, 2011).
TENDERNESS RESULTS
show some figures of the cattle herd and its distribution in Brazil´s great regions, grasslands areas, increases in the utilization of Bos taurus
6
) is expected to occur predominantly in developing countries, which will be responsible for about 78% of the additional output. Meat production
meat sectors which, relative to the production cycles and have higher feed-to-meat
will be curbed relative to the previous aging, coupled with an
increasing awareness of the impact of meat production on the environment are expected to exert some adverse effect on demand, particularly in developed countries. Moreover,
monella spp., combined with recent episodes of meat and milk contamination with chemical compounds (dioxin and melamine), have served to lowered consumer confidence in some instances. Nevertheless,
ation will strengthen the intake of animal proteins at the expense of foods of vegetal origin in emerging economies. It is
from large economies in Asia, Latin America
een 2020 and the base period (cwe. Consumption growth of 60 Mt is projected by 2020; predominantly in Asia.
Beef exports during the Outlook period will expand at 1.8% p.a. compared to 2.9% p.a. in the past decade. The expansion will be led by the United States, Brazil and Canada. Brazil
, following the sharp drop in US and Canadian beef exports after the BSE incidences. Brazilian exports have since declined, but will grow during the Outlook period despite increasing domestic consumption induced by growing income, with the
for rearing cattle in times of expensive feed. Brazil will establish its position as the leading world exporter, with volumes in 2020
the cattle herd and its distribution in Brazil´s Bos taurus semen, specially of
the Angus breed, and in numbers of cattle fed rations in feed lots. It is also to show very briefly some results of beef research on
Pasture areas and distribution, 2010 (IBGE, 2010)
Brazilian cattle in numbers, 2010 (IBGE, 2010; Anualpec, 2011)
Brazilian cattle herd distribution
, and in numbers of cattle fed rations in feed lots. It is also to show very briefly research on tenderness that were obtained in our laboratory
distribution, 2010 (IBGE, 2010)
Brazilian cattle in numbers, 2010 (IBGE, 2010; Anualpec, 2011)
Brazilian cattle herd distribution (ANUALPEC, 2011)
7
, and in numbers of cattle fed rations in feed lots. It is also to show very briefly obtained in our laboratory.
Participation of the breeds in the Artificial Breeding
Evolution of the Angus breed semen units sold
in the Artificial Breeding (ASBIA,, 2011)
Evolution of the Angus breed semen units sold (ASBIA,, 2011)
8
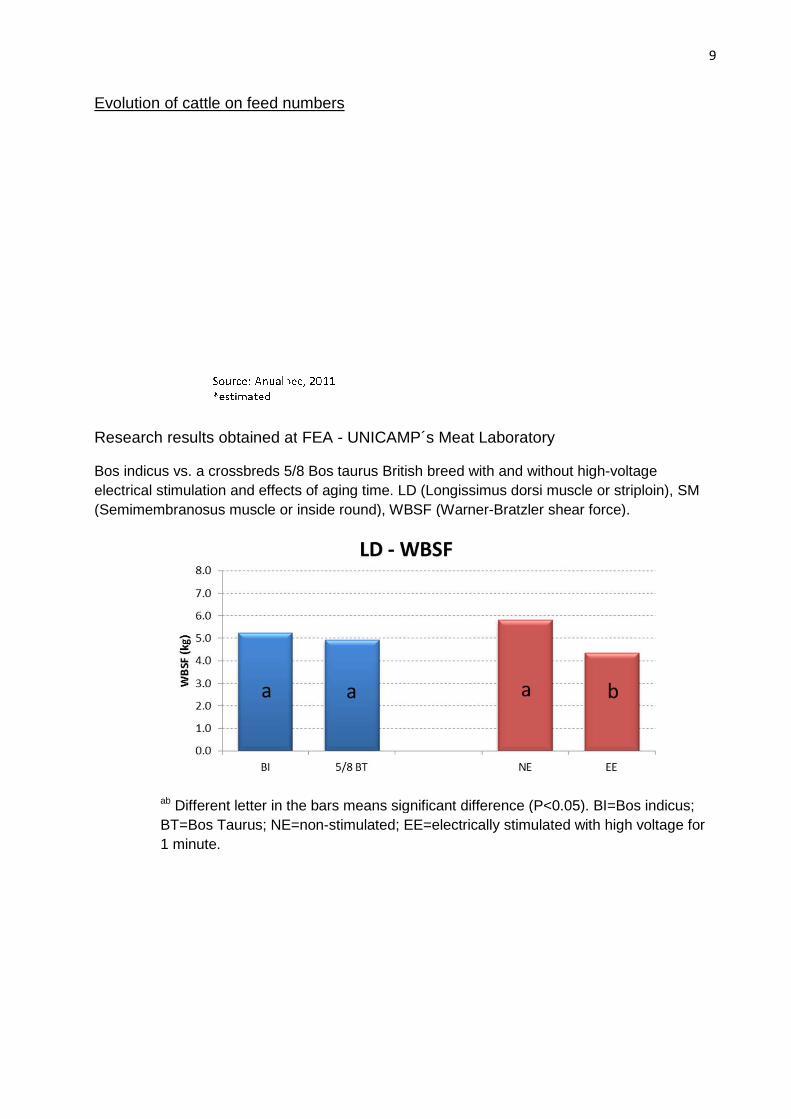
Evolution of cattle on feed numbers
Research results obtained at
Bos indicus vs. a crossbreds 5/8electrical stimulation and effects of aging time.(Semimembranosus muscle or inside round), WBSF (Warner
ab Different letter in the bars meanBT=Bos Taurus; NE=non1 minute.
numbers
obtained at FEA - UNICAMP´s Meat Laboratory
5/8 Bos taurus British breed with and without highelectrical stimulation and effects of aging time. LD (Longissimus dorsi muscle or striploin), SM (Semimembranosus muscle or inside round), WBSF (Warner-Bratzler shear force).
Different letter in the bars means significant difference (P<0.05). BI=; NE=non-stimulated; EE=electrically stimulated with high voltage for
9
with and without high-voltage dorsi muscle or striploin), SM
Bratzler shear force).
significant difference (P<0.05). BI=Bos indicus; ed with high voltage for
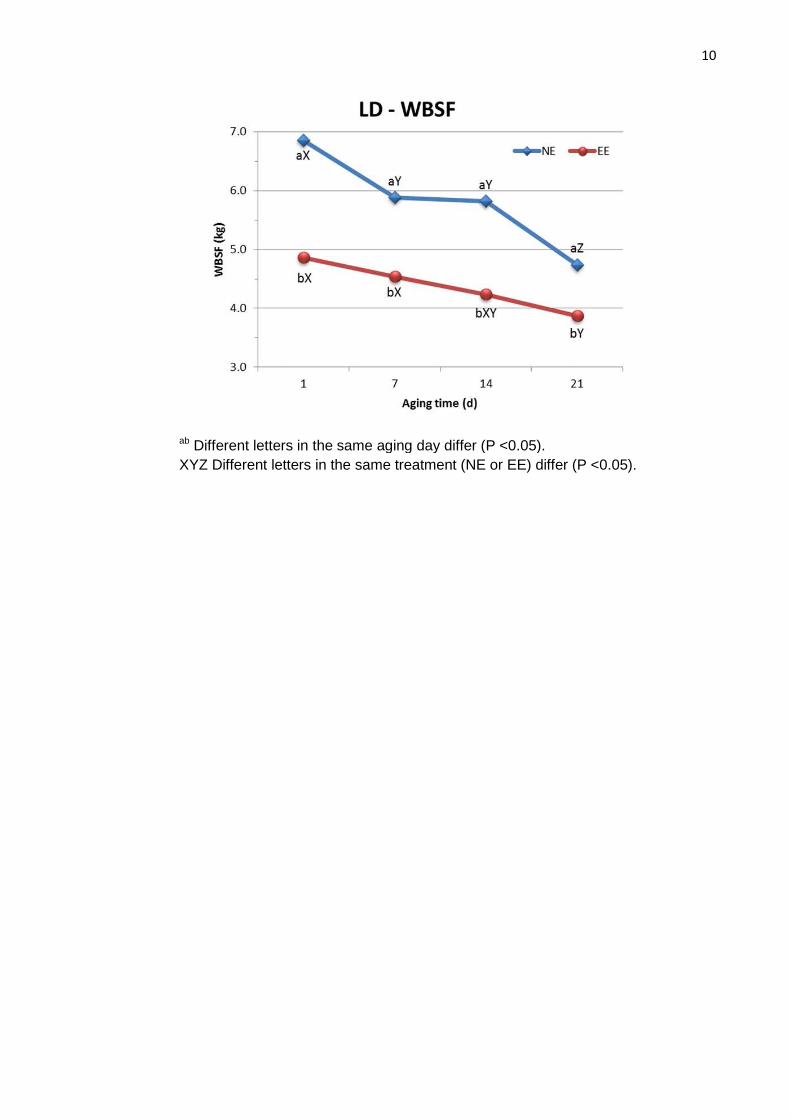
ab Different letters in the same aging day differ (P <0.05).XYZ Different letters in the same
Different letters in the same aging day differ (P <0.05). Z Different letters in the same treatment (NE or EE) differ (P <0.05).
10
differ (P <0.05).
11
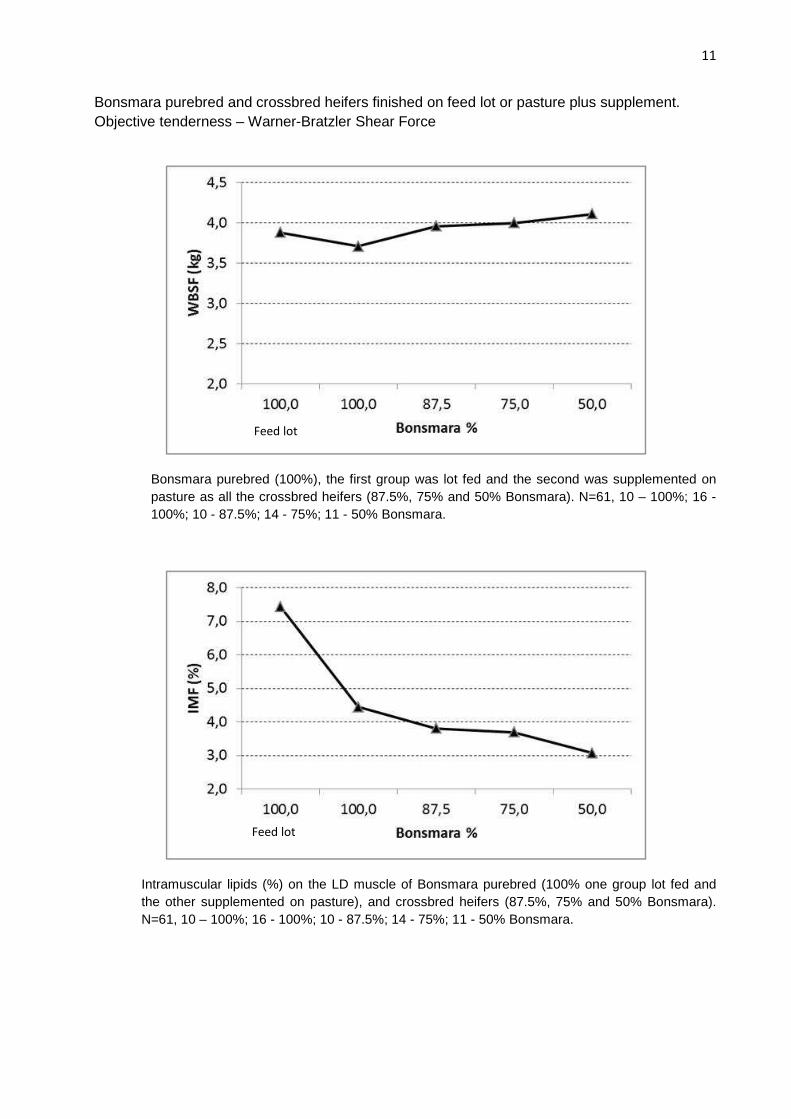
Bonsmara purebred and crossbred heifers finished on feed lot or pasture plus supplement. Objective tenderness – Warner-Bratzler Shear Force
Bonsmara purebred (100%), the first group was lot fed and the second was supplemented on pasture as all the crossbred heifers (87.5%, 75% and 50% Bonsmara). N=61, 10 – 100%; 16 - 100%; 10 - 87.5%; 14 - 75%; 11 - 50% Bonsmara.
Intramuscular lipids (%) on the LD muscle of Bonsmara purebred (100% one group lot fed and the other supplemented on pasture), and crossbred heifers (87.5%, 75% and 50% Bonsmara). N=61, 10 – 100%; 16 - 100%; 10 - 87.5%; 14 - 75%; 11 - 50% Bonsmara.
Feed lot
Feed lot
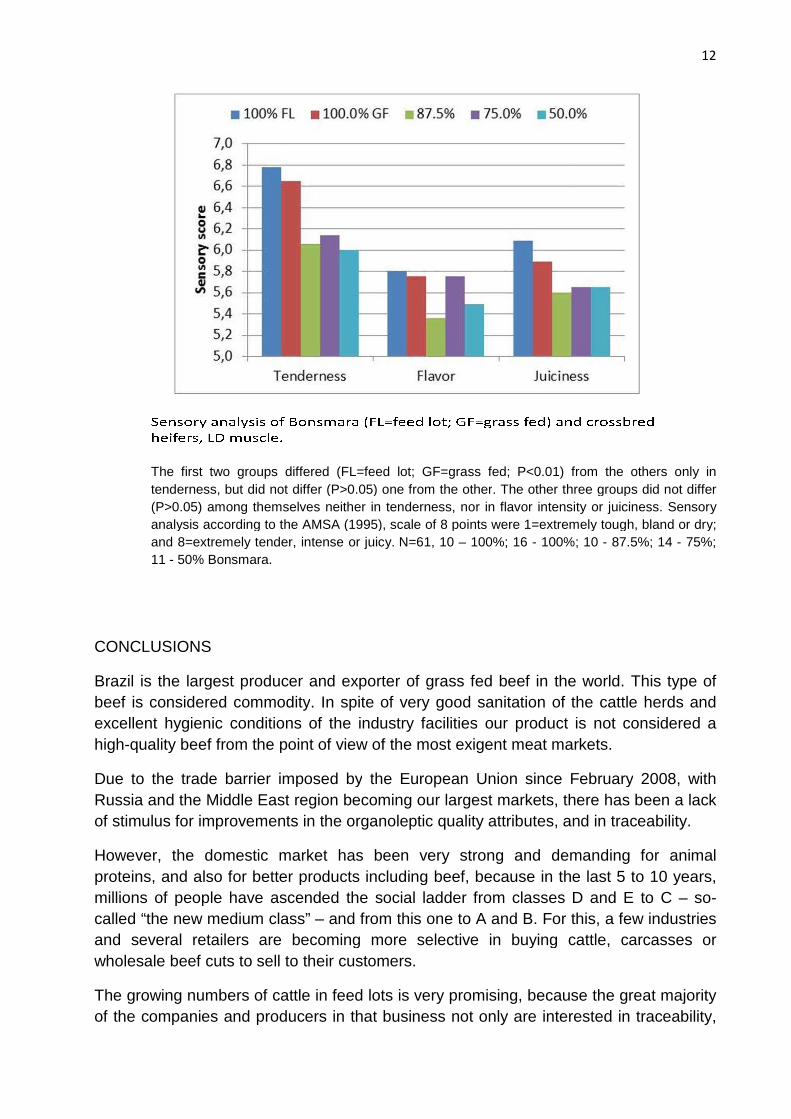
The first two groups differed (tenderness, but did not differ (P>0.05) one from the other(P>0.05) among themselves neither in tenderness, nor in analysis according to the AMSA (1995), scale of 8 points were 1=extremely tough, bland or dry; and 8=extremely tender, intense or juicy.11 - 50% Bonsmara.
CONCLUSIONS
Brazil is the largest producer and exporter of grass fed beef in the wobeef is considered commodityexcellent hygienic conditions of the industry facilities our product is not considered a high-quality beef from the point of view of the most exi
Due to the trade barrier imposed byRussia and the Middle Eastof stimulus for improvements in the organoleptic quality attributes, and in traceability.
However, the domestic market has been very proteins, and also for better products including beef, because in the last 5 to 10 yearsmillions of people have ascended the social ladder from classes D and E to C called “the new medium class” and several retailers are becoming more selective in buying cattle, carcasses or wholesale beef cuts to sell to
The growing numbers of cattle in feed lots is very promisingof the companies and producers in that business
differed (FL=feed lot; GF=grass fed; P<0.01) from the others, but did not differ (P>0.05) one from the other. The other three groups
among themselves neither in tenderness, nor in flavor intensity or analysis according to the AMSA (1995), scale of 8 points were 1=extremely tough, bland or dry; and 8=extremely tender, intense or juicy. N=61, 10 – 100%; 16 - 100%; 10
Brazil is the largest producer and exporter of grass fed beef in the wobeef is considered commodity. In spite of very good sanitation of the cattle herds and excellent hygienic conditions of the industry facilities our product is not considered a
from the point of view of the most exigent meat markets
trade barrier imposed by the European Union since FebruaryMiddle East region becoming our largest markets, there has been a lack
for improvements in the organoleptic quality attributes, and in traceability.
However, the domestic market has been very strong and demanding for animal proteins, and also for better products including beef, because in the last 5 to 10 yearsmillions of people have ascended the social ladder from classes D and E to C called “the new medium class” – and from this one to A and B. For this, a few industries and several retailers are becoming more selective in buying cattle, carcasses or
to sell to their customers.
The growing numbers of cattle in feed lots is very promising, because the great majority of the companies and producers in that business not only are interested
12
from the others only in he other three groups did not differ
lavor intensity or juiciness. Sensory analysis according to the AMSA (1995), scale of 8 points were 1=extremely tough, bland or dry;
100%; 10 - 87.5%; 14 - 75%;
Brazil is the largest producer and exporter of grass fed beef in the world. This type of very good sanitation of the cattle herds and
excellent hygienic conditions of the industry facilities our product is not considered a gent meat markets.
an Union since February 2008, with there has been a lack
for improvements in the organoleptic quality attributes, and in traceability.
strong and demanding for animal proteins, and also for better products including beef, because in the last 5 to 10 years, millions of people have ascended the social ladder from classes D and E to C – so-
A and B. For this, a few industries and several retailers are becoming more selective in buying cattle, carcasses or
because the great majority are interested in traceability,
13
which they see as a need for the global market, but they are also investing in genetics, and adequate nutrition to maximize cattle performance and add value to beef carcasses. From the science point of view, a few examples are presented in this paper on how the supply chain could improve the palatability attributes - mainly tenderness - of beef by using high voltage electrical stimulation, aging and tropically adapted breeds.
All the facts considered, especially the abundance of water, grasslands, vegetal and animal resources, and the well-developed legislation and technology for farms and industries, it is likely that Brazil will be able to meet any demand for a high-quality beef accordingly to the specifications of the importing countries as a few other players in the global market already can do.
BIBLIOGRAFIA
AGUIAR, A. Intensificação da produção animal em pasto x susten tabilidade . <http://www.bigma.com.br/artigos.asp?id=102> . Access in Feb., 2011. ANUALPEC. Anuário da pecuária brasileira . Agra FNP Pesquisas Ltda. 2011. ANUALPEC. Anuário da pecuária brasileira . Agra FNP Pesquisas Ltda. 2009. ASBIA – Associação Brasileira de Inseminação Artificial. Relatório Estatístico . 2010. http://www.asbia.org.br/novo/upload/mercado/relatorio2010.pdf. Access in Oct., 2011. BARCELLOS, A.O., RAMOS, A.K.B., VILELA, L., MARTHA Jr., G.B. Sustentabilidade da produção animal baseada em pastagens consorciadas e no emprego de leguminosas exclusivas, na forma de banco de proteína, nos trópicos brasileiros. R. Bras. Zootec. , v.37, supl, p.51-67, 2008. CNA – Brazilian Agriculture Confederation. Valor bruto da produção cresce 12,9% em 2011. http://www.canaldoprodutor.com.br/sites/default/files/VBP_AGO2011.pdf Access in Oct. 12, 2011 European Union. Member States agree to stricter requirements for Br azilian beef imports . Bruxelas. http://ec.europa.eu/ireland/press_office/media_centre/dec2007_en.htm#3. Access in Feb., 2008. FAS-USDA. Foreign Agricultural Service. Livestock and Poult ry World Markets and Trade. 2011. Washington-DC. <http://www.fas.usda.gov/dlp/circular/2011/livestock_poultry.pdf>. Access Sept., 2011. FAS-USDA. Foreign Agricultural Service. Livestock and Poultry World Markets and Trade . 2010. Washington-DC. <http://www.fas.usda.gov/dlp/circular/2010/livestock_poultryfull101510.pdf>. Access in Sept., 2011. FAS-USDA. Foreign Agricultural Service. Livestock and Poultry World Markets and Trade .2010. Washington-DC. <http://www.fas.usda.gov/dlp/circular/2007/livestock_poultry_04-2007.pdf>. Access in Sept., 2011. FERRAZ, J.B.S.; FELICIO, P.E. de. Production systems – An example from Brazil. Meat Science 84: 238–243. 2010. GASQUES, J.G., BASTOS, E.T., BACCHI, M.R.P. Produtividade e Fontes de Crescimento da Agricultura . Assessoria de Gestão Estratégica. Ministério da Agricultura, Pecuária e Abastecimento. Brasília-DF. 2009. 12p. GIANINI, F. Nova classe C transforma pirâmide social em losango . Isto é Dinheiro, São Paulo, http://www.istoedinheiro.com.br/noticias/52423_NOVA+CLASSE+C+TRANSFORMA+PIRAMIDE+SOCIAL+EM+LOSANGO Access in Mar., 2011. IBGE. Fundação Instituto Brasileiro de Geografia e Estatí stica . < http://www.sidra.ibge.gov.br/bda/tabela/listabl.asp?z=t&o=24&i=P&c=1089>. Access in Oct., 2011.
14
IBGE. Fundação Instituto Brasileiro de Geografia e Estatí stica .< http://www.ibge.gov.br/home/estatistica/populacao/condicaodevida/pof/2008_2009_analise_consumo/default.shtm>. Access in Aug., 2011. JULIATO, O. Um dos motivos sólidos para a valorização da @ do b oi em 2010 . <http://otaviojuliato.com/2011/04/04/um-dos-motivos-solidos-para-a-valorizacao-da-do-boi-em-2010-2/>. Access in Sept., 2011. MILLEN, D.D.; PACHECO, R.D.L.; MEYER, P.M.; RODRIGUES, P.H.M.; ARRIGONI, M. DE BENI. Current outlook and future perspectives of beef pro duction in Brazil . Animal Frontiers , vol. 1 no. 2 46-52. 2011. OECD-FAO. Agricultural Outlook 2011-2020 . <http://www.agri-outlook.org/pages/0,2987,en_36774715_36775671_1_1_1_1_1,00.html#publication>. Access in Jul., 2011. OIE – Organização Internacional de Epizootias . <http://www.oie.int>. Access in Sep., 2011. RODRIGUES, R. Agronegócio, um futuro notável para o Brasil. Boletim de Informação para publicitários, Rio de Janeiro, n. 578, p.4-11 Jul. 2008 < http://comercial2.redeglobo.com.br/biponline/BIP/bip_578.pdf>