Embed Size (px)
Citation preview
P026-1
High-Resolution Modeling of the Marine Environment at Forsmark
Between 0 AD and 9000 AD
Olof LIUNGMAN, Anna KARLSSON, Christin ERIKSSON and Charlotta
BORELL LÖVSTEDT
DHI Sverige, Lilla Bommen 1, Göteborg, Sweden, emails: [email protected]; [email protected]; [email protected]; [email protected]
Keywords MIKE 3 FM, coastal circulation, land rise, AD, climate change, water exchange, residence time
Abstract The Swedish Nuclear Fuel and Waste Management Co. is investigating a long-term underground repository of spent nuclear fuel in the Forsmark area on the east coast of Sweden. DHI was contracted to model the hydrodynamic conditions and especially the water exchange characteristics of the area between 6500 BC and 9000 AD. The results are used as input to a dose model. A MIKE 3 FM model was used to simulate the coastal region off Forsmark for ten representative years between 0 and 9000 AD. In order to accurately describe past and future conditions the model bathymetries have been modified according to simulated land rise. The model was forced by a combination of observations and a large-scale Baltic Sea model. The model was validated against observations of sea level, salinity and temperature. A measure of the residence time – and thus the water exchange – called the Average Age (AvA) has been calculated using the module MIKE ECO Lab. A sensitivity analysis has also been carried out in order to illuminate the importance of various forcing mechanisms. This analysis indicates how the water exchange is likely to be influenced by a changing climate and land rise. The results show that over long periods of time the coastal area off Forsmark will change from a well-ventilated open sea area, via an open-ended embayment with a barotropically forced net through-flow to a typical estuary with gradually more restricted baroclinic circulation.
P026-2
INTRODUCTION
This report describes the three-dimensional hydrodynamic modeling that has
been performed for the Forsmark marine area, an area which currently consists of a coastal estuary named Öregrundsgrepen. This report presents model results together with a discussion of the hydrodynamic properties of the area. The aim is
to describe the important hydrodynamic characteristics of the Forsmark marine area due to shoreline evolution during an interglacial period. Finally, it is
investigated how dominating forcing and governing processes change over long time scales.
The modeling study presented here is part of the ongoing assessment of
Forsmark as a site for a long-term subterranean repository for spent nuclear fuel, carried out by the Swedish Nuclear Fuel and Waste Management Co.
The Baltic Sea and Öregrundsgrepen
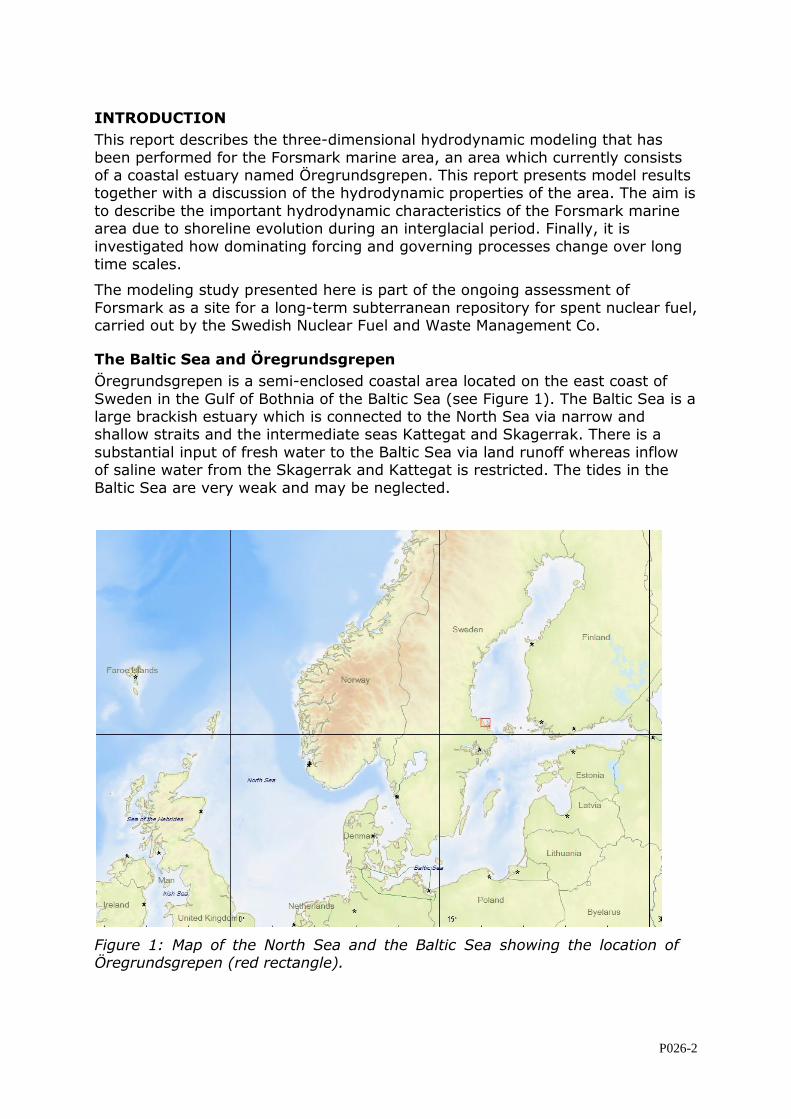
Öregrundsgrepen is a semi-enclosed coastal area located on the east coast of
Sweden in the Gulf of Bothnia of the Baltic Sea (see Figure 1). The Baltic Sea is a large brackish estuary which is connected to the North Sea via narrow and shallow straits and the intermediate seas Kattegat and Skagerrak. There is a
substantial input of fresh water to the Baltic Sea via land runoff whereas inflow of saline water from the Skagerrak and Kattegat is restricted. The tides in the
Baltic Sea are very weak and may be neglected.
Figure 1: Map of the North Sea and the Baltic Sea showing the location of Öregrundsgrepen (red rectangle).
P026-3
Öregrundsgrepen is funnel-shaped and open-ended with a northern and southern open boundary to the Baltic Sea. The northern opening is wide, approximately 15
km, and relatively deep. Öregrundsgrepen then narrows towards the south-southeast to a long and narrow strait called Öregrundssund, about 15 km long and in several places less than a kilometer wide, which eventually opens out into
the Baltic Sea. To the east the island of Gräsö separates the estuary from the Baltic Sea. There are two main discharges of freshwater in the area, the rivers
Olandsån and Forsmarksån.
Overview of present hydrodynamic conditions
The Öregrundsgrepen estuary is mostly relatively shallow – less than 20 m deep
– but with a deeper channel in the east with depths exceeding 40 m that runs approximately in a north-south direction. Since the depth of the halocline in the
Baltic Sea is about 60-70 m, the salinity stratification is generally weak in Öregrundsgrepen. Local fresh water runoff produces slightly lower salinities in
Öregrundsgrepen compared to the Gulf of Bothnia (Wijnbladh, Aquilonius, & Floderus, 2008).
Through the large northern opening the area is highly influenced by Baltic Sea
conditions. Variations in sea level and stratification will easily penetrate into the estuary from the north, but less so from the south due to the long and narrow
strait. However, because of the limited high-frequency sea level variations in the Baltic Sea – tides are virtually nonexistent – and the weak stratification, the external forcing does not necessarily dominate the circulation. Of course,
extreme events such as storm surges may temporarily give rise to large sea level changes.
There are three major types of forcing mechanisms that drive the water exchange: sea level differences (barotropic forcing), horizontal density differences (baroclinic forcing) and local wind.
Due to the limited sea level variations the magnitude of the barotropically forced water exchange would be small for a closed estuary. Since Öregrundsgrepen is
open in both ends, a through-flow is possible. A small sea level difference between the northern and southern boundaries is enough to drive a flow through Öregrundsgrepen producing a noticeable water exchange. As a result of the
freshwater supply to the Baltic Sea and the rotation of the earth, there is a net flow of water towards the south along the Swedish coast (Fonselius, 1996). This
is forced by a sea level gradient along the coast, which in turn drives a net flow through Öregrundsgrepen. The direction of this through-flow varies from time to time, but should on average be directed in the southward direction.
The baroclinic water exchange has two forcing mechanisms: the freshwater discharge due to land runoff and the existence of more saline, and thus dense,
Baltic Sea water at the open boundaries. However, this mode of circulation does not appear to dominate the conditions in Öregrundsgrepen. The land runoff is not sufficiently large in relation to the volume of the estuary and the cross-sectional
area of the northern boundary. Also, the open-ended nature of Öregrundsgrepen complicates the picture. Nevertheless, variations in stratification in the Gulf of
Bothnia, particularly at the large northern boundary, do cause large flows across the boundaries. Particularly in the deeper parts of Öregrundsgrepen, regional upwelling events will force denser water from outside into the deeper parts of
Öregrundsgrepen, flushing out the resident water and causing fairly large
P026-4
exchanges. In short, the stratification inside Öregrundsgrepen is dominated by the stratification outside the estuary.
The local wind is most likely an important factor influencing the circulation and exchange in Öregrundsgrepen. Because Öregrundsgrepen is relatively shallow with a large surface area, the local wind will not only generate surface currents but also extensive vertical mixing, reducing vertical gradients in temperature and salinity. Because the estuary is semi-enclosed, local wind setup may result in a two-layer circulation, i.e. a surface flow in the direction of the wind and a compensating counter-flow along the bottom.
METHODS
The overall methodology was as follows. Ten years at 1000 year intervals from 0 AD to 9000 AD have been chosen to achieve a minimum time resolution required to resolve the gradual modification and eventual disappearance of the different marine basins as a result of shoreline advance.
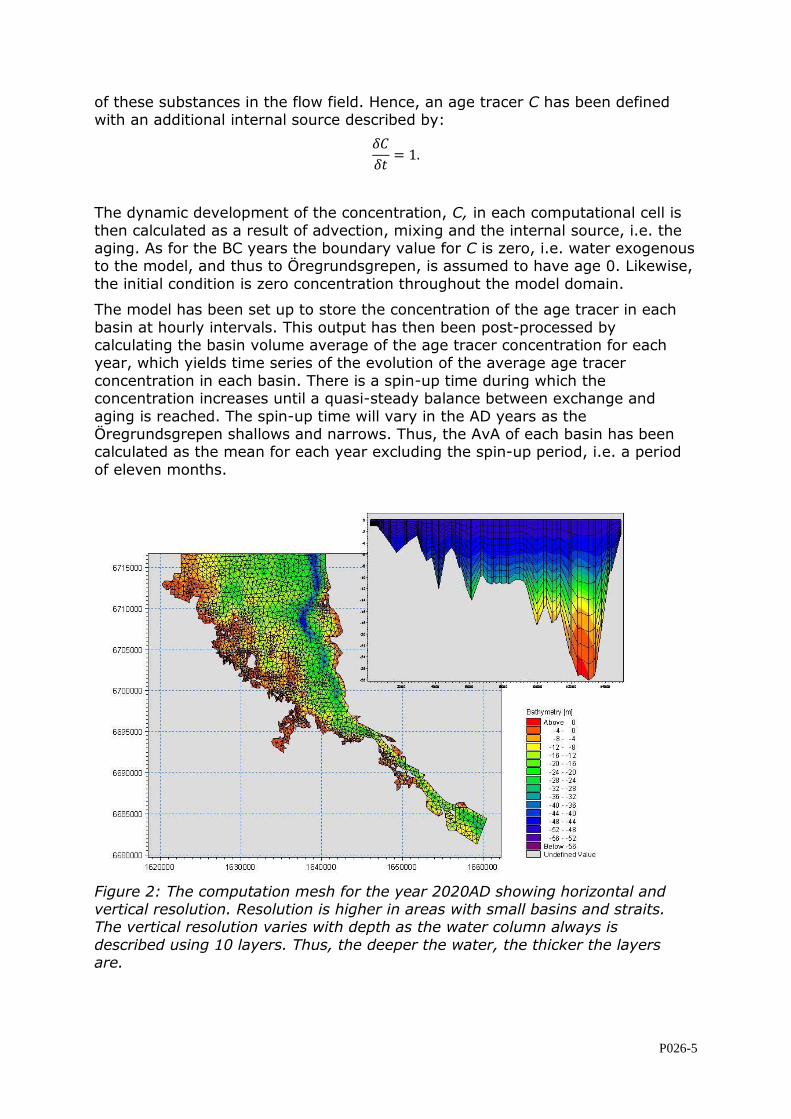
For each of the 10 years during the period from 0 to 9000 AD a hydrodynamic model was run for one year using the same external forcing from the atmosphere, the surrounding sea and land runoff. The difference between the models lies in the bathymetry – depths and shoreline location (see Figure 3) – which was determined from a digital elevation model (Brydsten, 2006).
Average Age
One measure of residence time, and thus of the water exchange, is the so-called Average Age (AvA). This describes the average time that water parcels have spent within a given volume (see, e.g., (Engqvist, Döös, & Andrejev, 2006)). To calculate this for the basins in Öregrundsgrepen an age tracer is used. Outside Öregrundsgrepen the tracer concentration is set to zero, i.e. water from outside the modeled basins is assumed to have age zero and is termed exogenous. In each point the concentration increases linearly with time, i.e. for a closed basin the concentration will increase monotonously at the same rate as the passing of time. This age tracer is transported and mixed in the model just as any other substance, e.g. salinity. Thus the concentration of the age tracer represents the age of the water, relative the water outside Öregrundsgrepen, at that particular point in space and time. After an initial increase (the spin-up period) a balance will be reached between aging and mixing with exogenous water. Thus the age tracer concentration will eventually fluctuate around some long-term mean value. Taking this mean value – defined as the temporal average over the simulated period excluding the spin-up period – and averaging over each basin volume, yields the AvA for each basin relative the exogenous water
Description of model
A high-resolution flexible mesh model, MIKE 3 FM, has been applied to calculate
the circulation and exchange of water.
The MIKE 3 FM model has a built-in tool for calculating the net volume flow through a cross-section defined by a straight line in the horizontal plane. Using this facility hourly time series of volume flow for each connection between neighboring basins have been stored.
To calculate the AvA, the MIKE ECO Lab module (MIKE by DHI, 2008) has been used. This is an add-on module in which arbitrary internal processes can be defined for arbitrary substances, which is coupled to the hydrodynamics and the advection
P026-5
of these substances in the flow field. Hence, an age tracer C has been defined with an additional internal source described by:
The dynamic development of the concentration, C, in each computational cell is
then calculated as a result of advection, mixing and the internal source, i.e. the aging. As for the BC years the boundary value for C is zero, i.e. water exogenous to the model, and thus to Öregrundsgrepen, is assumed to have age 0. Likewise,
the initial condition is zero concentration throughout the model domain.
The model has been set up to store the concentration of the age tracer in each
basin at hourly intervals. This output has then been post-processed by calculating the basin volume average of the age tracer concentration for each year, which yields time series of the evolution of the average age tracer
concentration in each basin. There is a spin-up time during which the concentration increases until a quasi-steady balance between exchange and
aging is reached. The spin-up time will vary in the AD years as the Öregrundsgrepen shallows and narrows. Thus, the AvA of each basin has been calculated as the mean for each year excluding the spin-up period, i.e. a period
of eleven months.
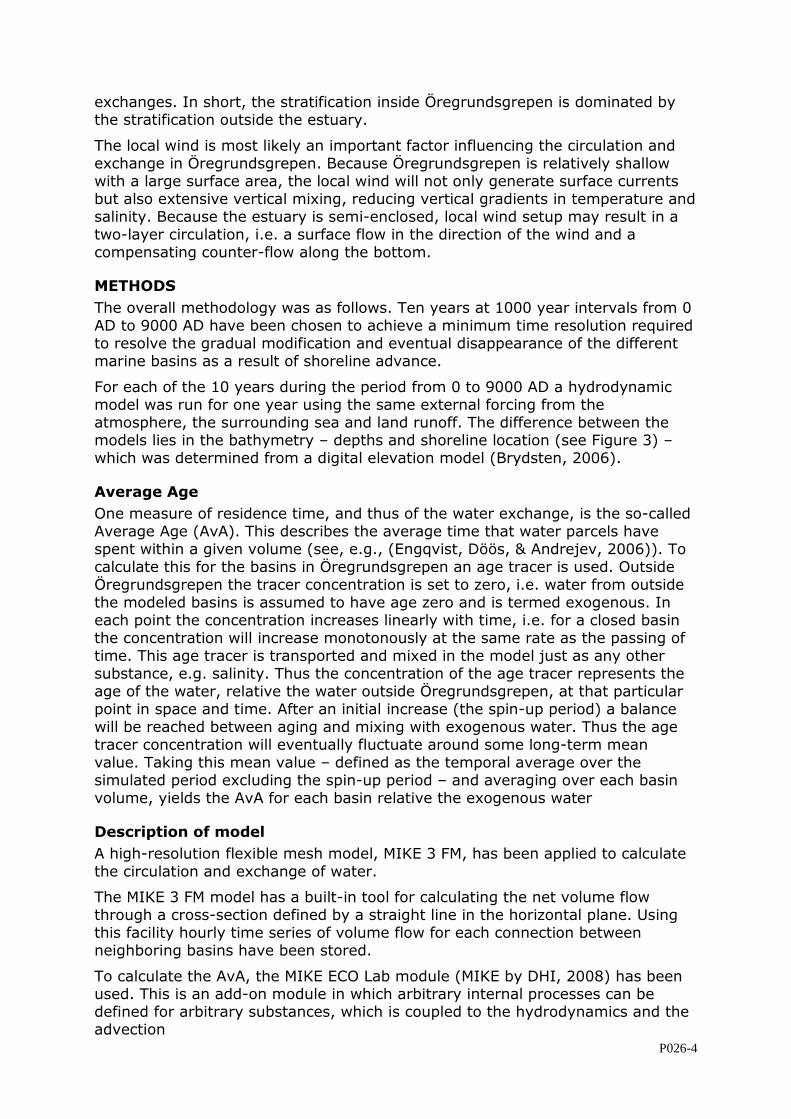
Figure 2: The computation mesh for the year 2020AD showing horizontal and vertical resolution. Resolution is higher in areas with small basins and straits. The vertical resolution varies with depth as the water column always is
described using 10 layers. Thus, the deeper the water, the thicker the layers are.
P026-6
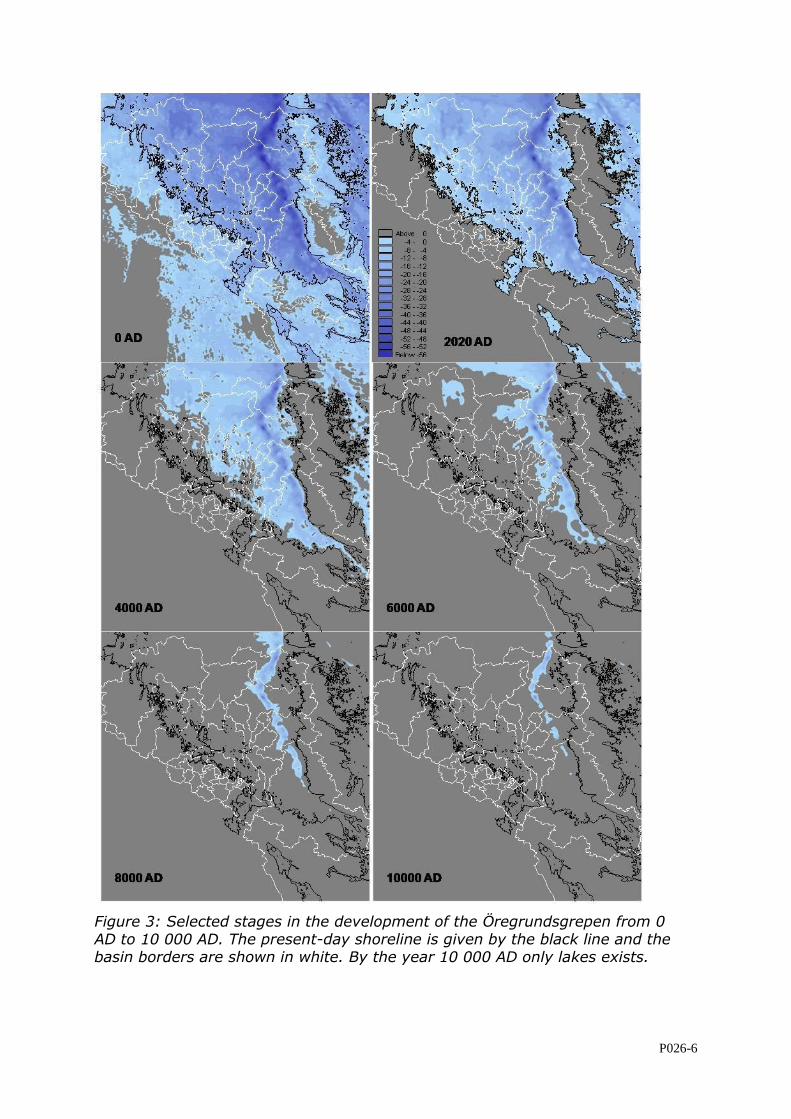
Figure 3: Selected stages in the development of the Öregrundsgrepen from 0 AD to 10 000 AD. The present-day shoreline is given by the black line and the basin borders are shown in white. By the year 10 000 AD only lakes exists.
P026-7
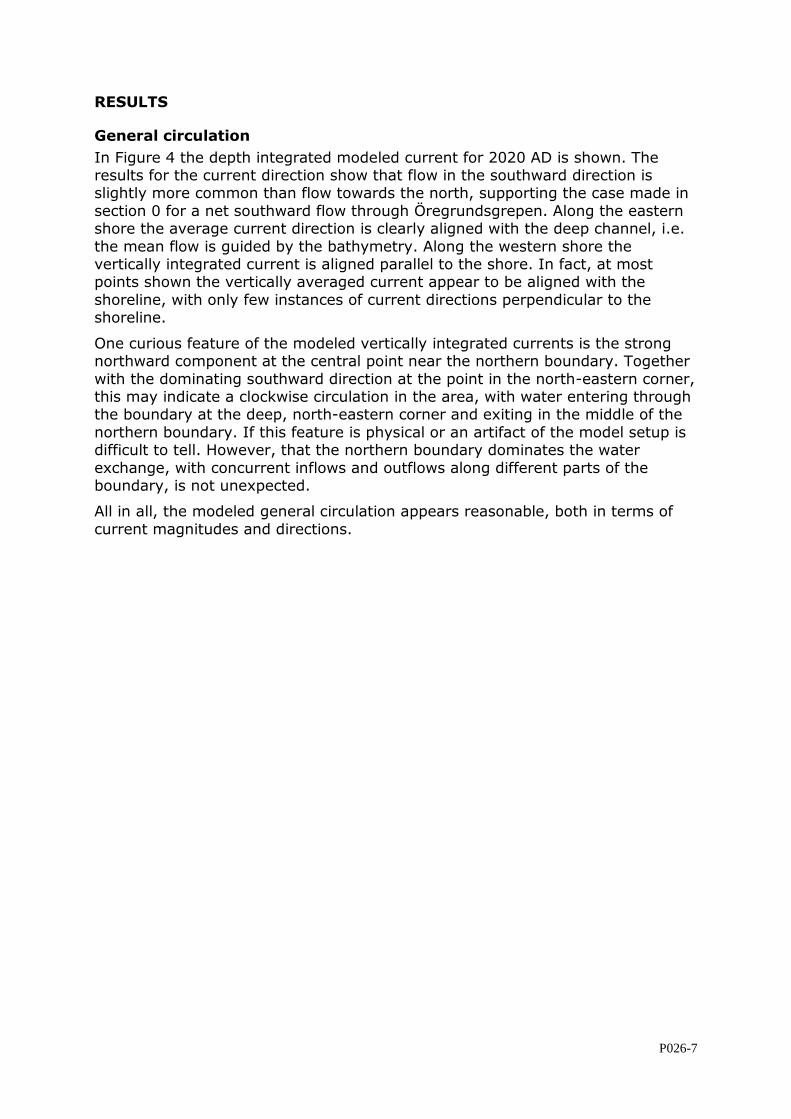
RESULTS
General circulation
In Figure 4 the depth integrated modeled current for 2020 AD is shown. The results for the current direction show that flow in the southward direction is slightly more common than flow towards the north, supporting the case made in
section 0 for a net southward flow through Öregrundsgrepen. Along the eastern shore the average current direction is clearly aligned with the deep channel, i.e.
the mean flow is guided by the bathymetry. Along the western shore the vertically integrated current is aligned parallel to the shore. In fact, at most points shown the vertically averaged current appear to be aligned with the
shoreline, with only few instances of current directions perpendicular to the shoreline.
One curious feature of the modeled vertically integrated currents is the strong northward component at the central point near the northern boundary. Together
with the dominating southward direction at the point in the north-eastern corner, this may indicate a clockwise circulation in the area, with water entering through the boundary at the deep, north-eastern corner and exiting in the middle of the
northern boundary. If this feature is physical or an artifact of the model setup is difficult to tell. However, that the northern boundary dominates the water
exchange, with concurrent inflows and outflows along different parts of the boundary, is not unexpected.
All in all, the modeled general circulation appears reasonable, both in terms of
current magnitudes and directions.
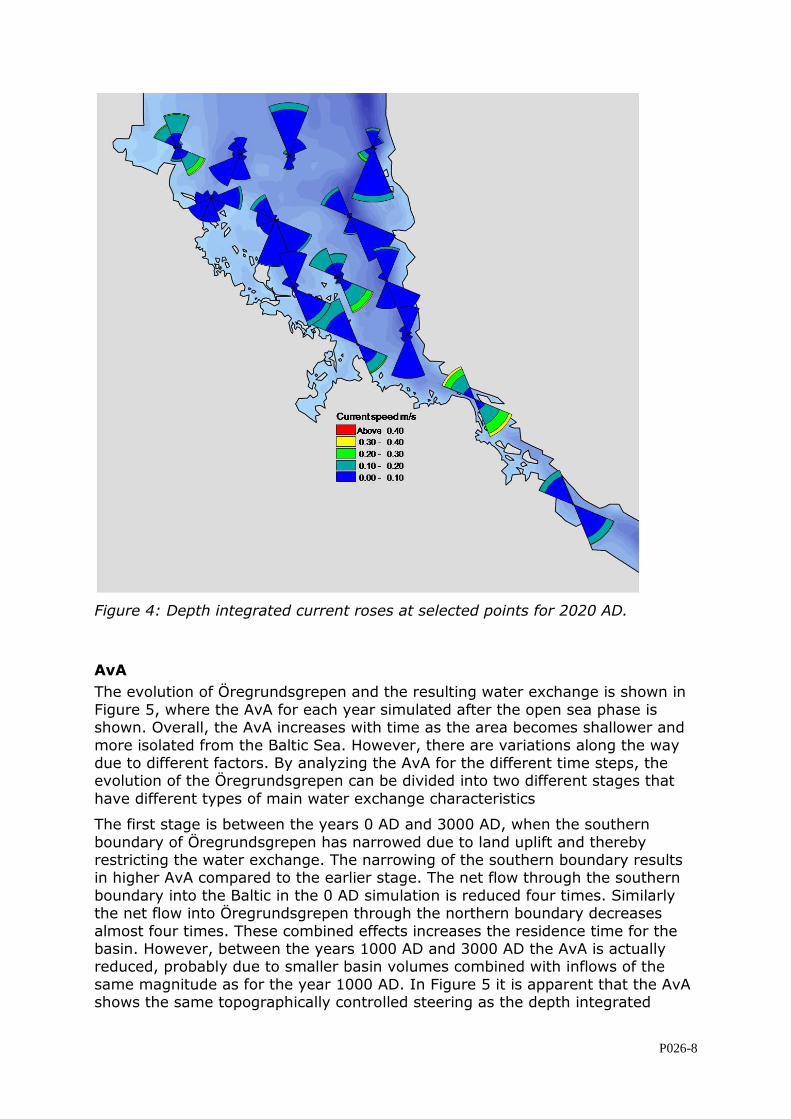
P026-8
Figure 4: Depth integrated current roses at selected points for 2020 AD.
AvA
The evolution of Öregrundsgrepen and the resulting water exchange is shown in
Figure 5, where the AvA for each year simulated after the open sea phase is shown. Overall, the AvA increases with time as the area becomes shallower and
more isolated from the Baltic Sea. However, there are variations along the way due to different factors. By analyzing the AvA for the different time steps, the evolution of the Öregrundsgrepen can be divided into two different stages that
have different types of main water exchange characteristics
The first stage is between the years 0 AD and 3000 AD, when the southern
boundary of Öregrundsgrepen has narrowed due to land uplift and thereby restricting the water exchange. The narrowing of the southern boundary results in higher AvA compared to the earlier stage. The net flow through the southern
boundary into the Baltic in the 0 AD simulation is reduced four times. Similarly the net flow into Öregrundsgrepen through the northern boundary decreases
almost four times. These combined effects increases the residence time for the basin. However, between the years 1000 AD and 3000 AD the AvA is actually reduced, probably due to smaller basin volumes combined with inflows of the
same magnitude as for the year 1000 AD. In Figure 5 it is apparent that the AvA shows the same topographically controlled steering as the depth integrated
P026-9
current in Figure 4. The AvA is by its definition heavily influenced by the dominating current pattern.
The last stage of the Öregrundsgrepen begins in the year 4000 AD when the land has risen enough to close the southern boundary. From now on the AvA starts to increase again since exchange only can occur over the northern boundary. As an
effect of the change into a one-ended system the inner parts of Öregrundsgrepen only experience very restricted water exchange.
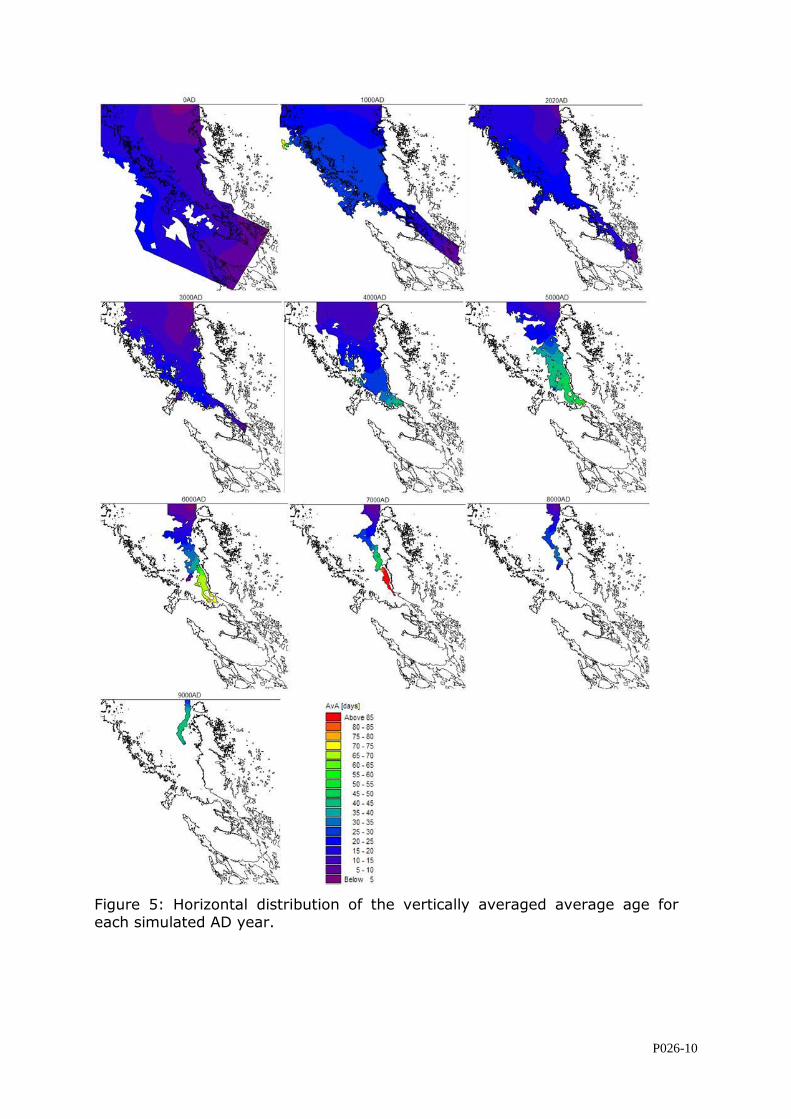
P026-10
Figure 5: Horizontal distribution of the vertically averaged average age for each simulated AD year.
P026-11
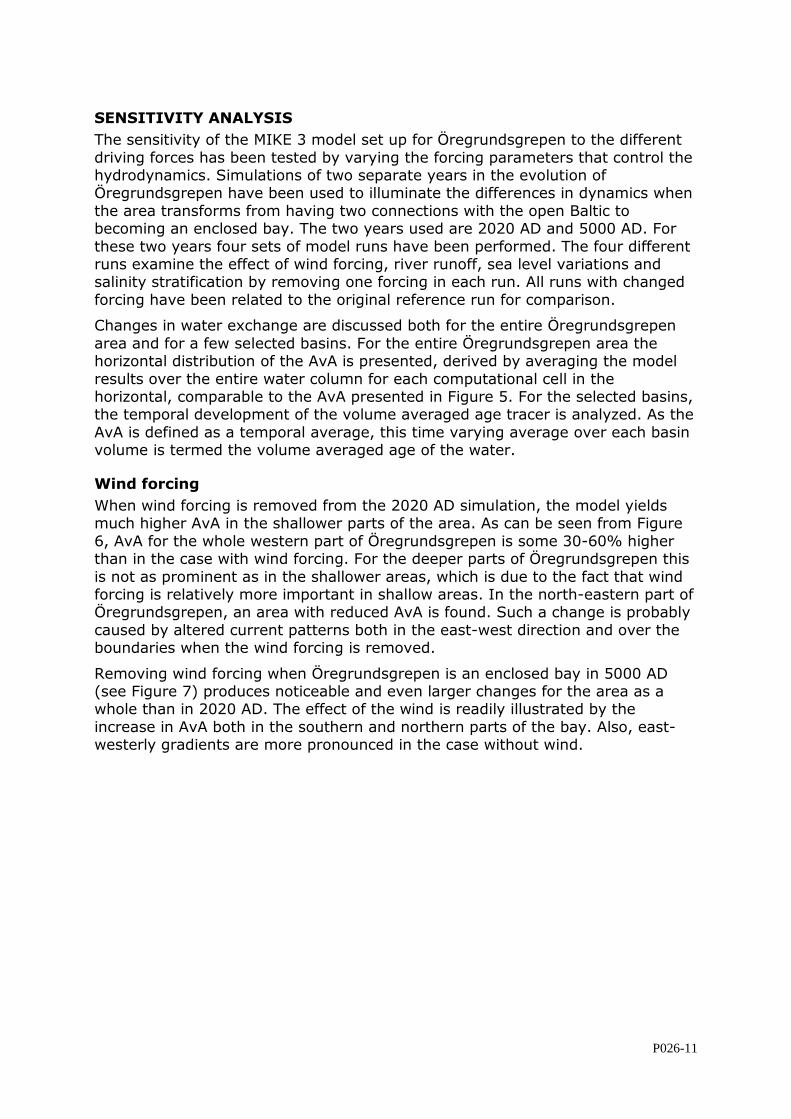
SENSITIVITY ANALYSIS
The sensitivity of the MIKE 3 model set up for Öregrundsgrepen to the different
driving forces has been tested by varying the forcing parameters that control the hydrodynamics. Simulations of two separate years in the evolution of Öregrundsgrepen have been used to illuminate the differences in dynamics when
the area transforms from having two connections with the open Baltic to becoming an enclosed bay. The two years used are 2020 AD and 5000 AD. For
these two years four sets of model runs have been performed. The four different runs examine the effect of wind forcing, river runoff, sea level variations and salinity stratification by removing one forcing in each run. All runs with changed
forcing have been related to the original reference run for comparison.
Changes in water exchange are discussed both for the entire Öregrundsgrepen
area and for a few selected basins. For the entire Öregrundsgrepen area the horizontal distribution of the AvA is presented, derived by averaging the model
results over the entire water column for each computational cell in the horizontal, comparable to the AvA presented in Figure 5. For the selected basins, the temporal development of the volume averaged age tracer is analyzed. As the
AvA is defined as a temporal average, this time varying average over each basin volume is termed the volume averaged age of the water.
Wind forcing
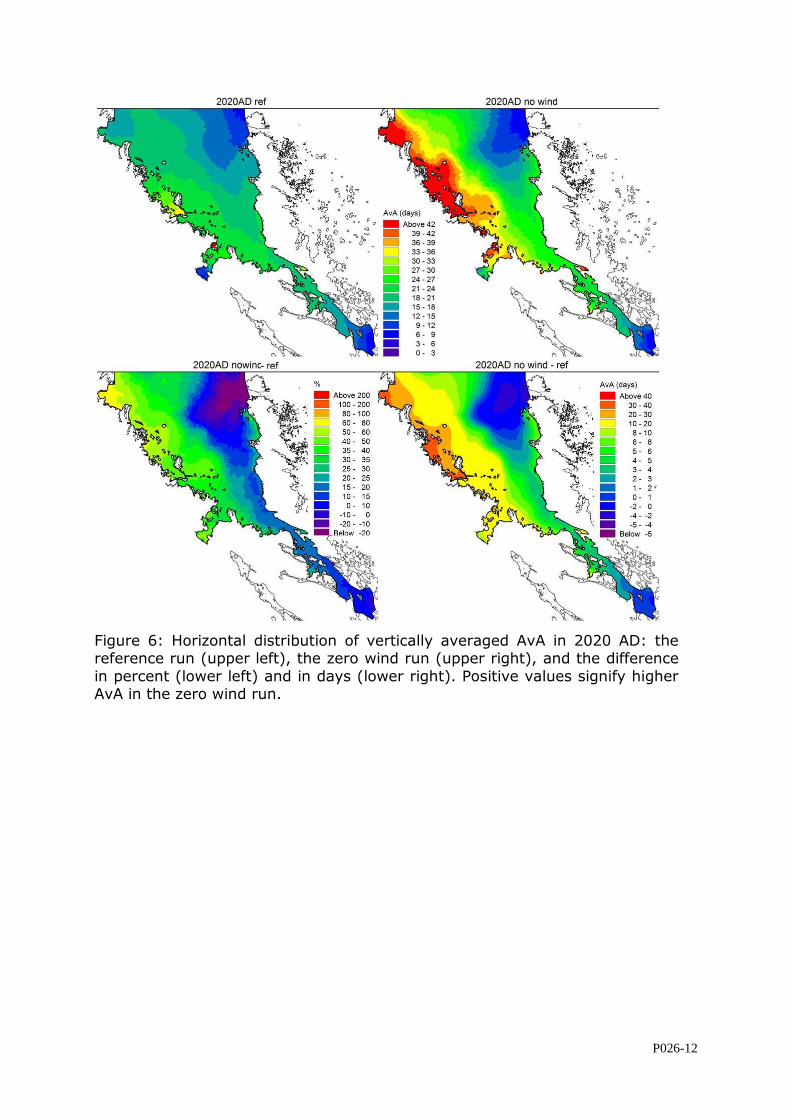
When wind forcing is removed from the 2020 AD simulation, the model yields much higher AvA in the shallower parts of the area. As can be seen from Figure
6, AvA for the whole western part of Öregrundsgrepen is some 30-60% higher than in the case with wind forcing. For the deeper parts of Öregrundsgrepen this
is not as prominent as in the shallower areas, which is due to the fact that wind forcing is relatively more important in shallow areas. In the north-eastern part of Öregrundsgrepen, an area with reduced AvA is found. Such a change is probably
caused by altered current patterns both in the east-west direction and over the boundaries when the wind forcing is removed.
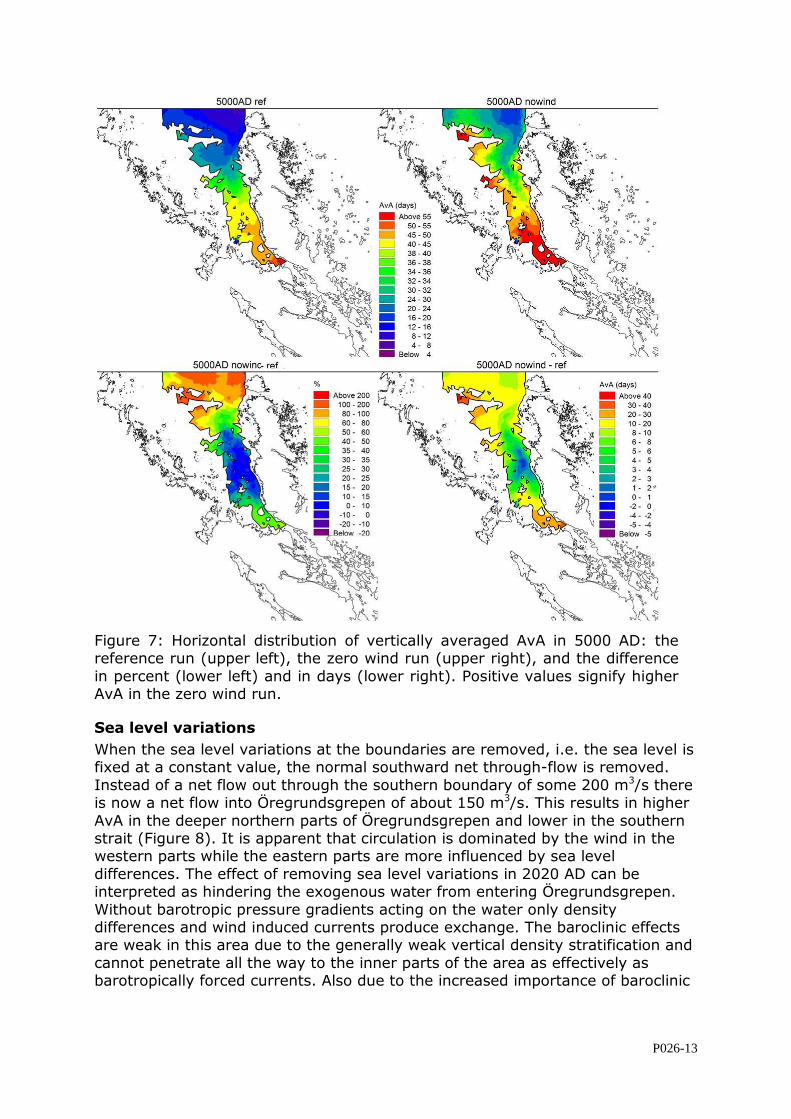
Removing wind forcing when Öregrundsgrepen is an enclosed bay in 5000 AD (see Figure 7) produces noticeable and even larger changes for the area as a whole than in 2020 AD. The effect of the wind is readily illustrated by the
increase in AvA both in the southern and northern parts of the bay. Also, east-westerly gradients are more pronounced in the case without wind.
P026-12
Figure 6: Horizontal distribution of vertically averaged AvA in 2020 AD: the reference run (upper left), the zero wind run (upper right), and the difference
in percent (lower left) and in days (lower right). Positive values signify higher AvA in the zero wind run.
P026-13
Figure 7: Horizontal distribution of vertically averaged AvA in 5000 AD: the reference run (upper left), the zero wind run (upper right), and the difference
in percent (lower left) and in days (lower right). Positive values signify higher AvA in the zero wind run.
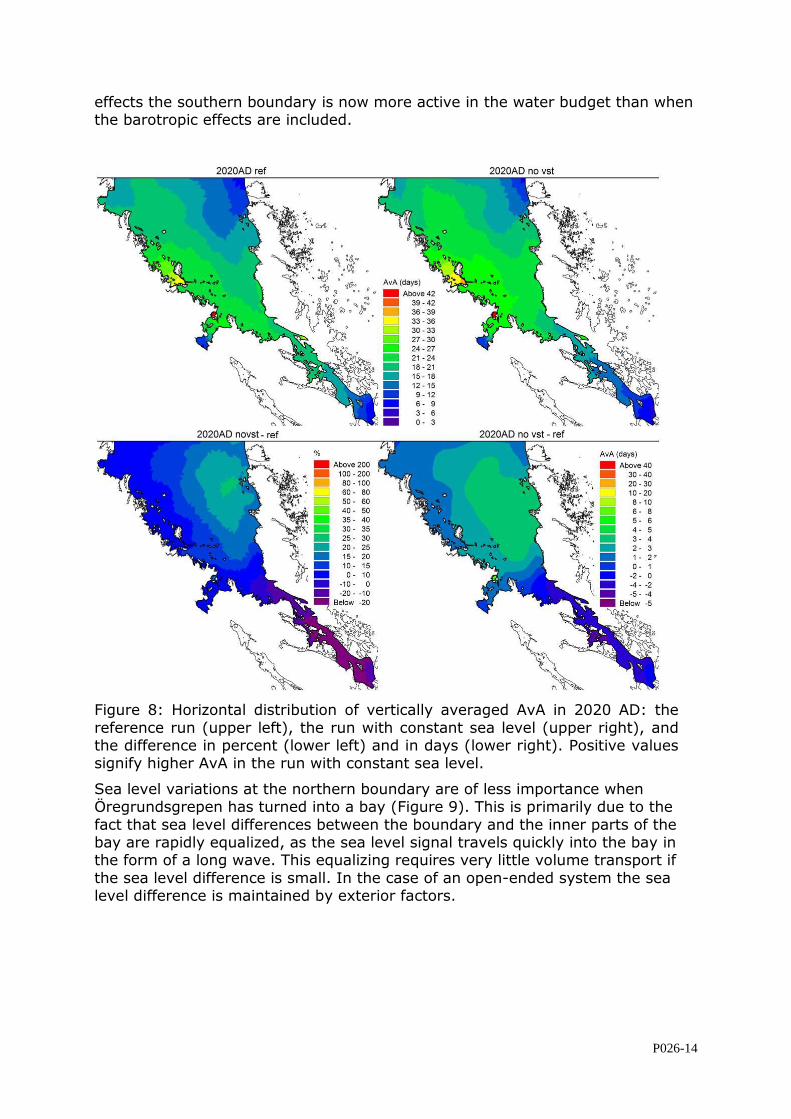
Sea level variations
When the sea level variations at the boundaries are removed, i.e. the sea level is fixed at a constant value, the normal southward net through-flow is removed.
Instead of a net flow out through the southern boundary of some 200 m3/s there is now a net flow into Öregrundsgrepen of about 150 m3/s. This results in higher
AvA in the deeper northern parts of Öregrundsgrepen and lower in the southern strait (Figure 8). It is apparent that circulation is dominated by the wind in the western parts while the eastern parts are more influenced by sea level
differences. The effect of removing sea level variations in 2020 AD can be interpreted as hindering the exogenous water from entering Öregrundsgrepen.
Without barotropic pressure gradients acting on the water only density differences and wind induced currents produce exchange. The baroclinic effects are weak in this area due to the generally weak vertical density stratification and
cannot penetrate all the way to the inner parts of the area as effectively as barotropically forced currents. Also due to the increased importance of baroclinic
P026-14
effects the southern boundary is now more active in the water budget than when the barotropic effects are included.
Figure 8: Horizontal distribution of vertically averaged AvA in 2020 AD: the
reference run (upper left), the run with constant sea level (upper right), and the difference in percent (lower left) and in days (lower right). Positive values signify higher AvA in the run with constant sea level.
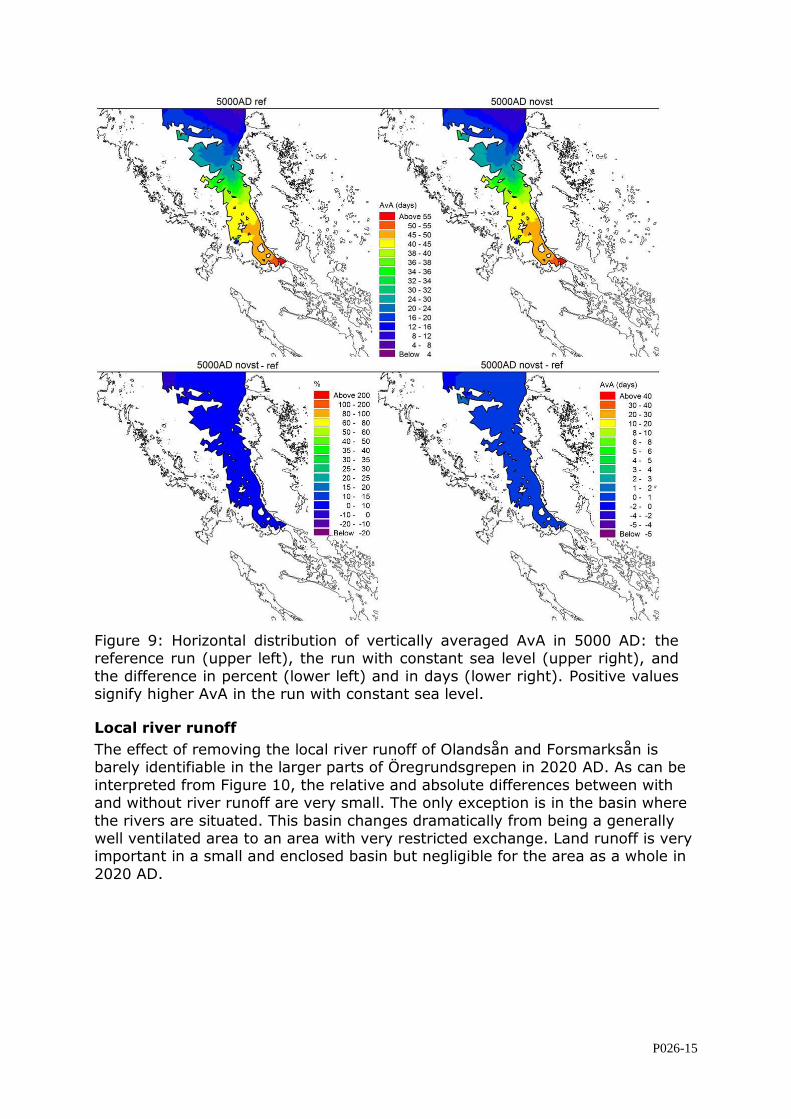
Sea level variations at the northern boundary are of less importance when Öregrundsgrepen has turned into a bay (Figure 9). This is primarily due to the
fact that sea level differences between the boundary and the inner parts of the bay are rapidly equalized, as the sea level signal travels quickly into the bay in the form of a long wave. This equalizing requires very little volume transport if
the sea level difference is small. In the case of an open-ended system the sea level difference is maintained by exterior factors.
P026-15
Figure 9: Horizontal distribution of vertically averaged AvA in 5000 AD: the reference run (upper left), the run with constant sea level (upper right), and
the difference in percent (lower left) and in days (lower right). Positive values signify higher AvA in the run with constant sea level.
Local river runoff
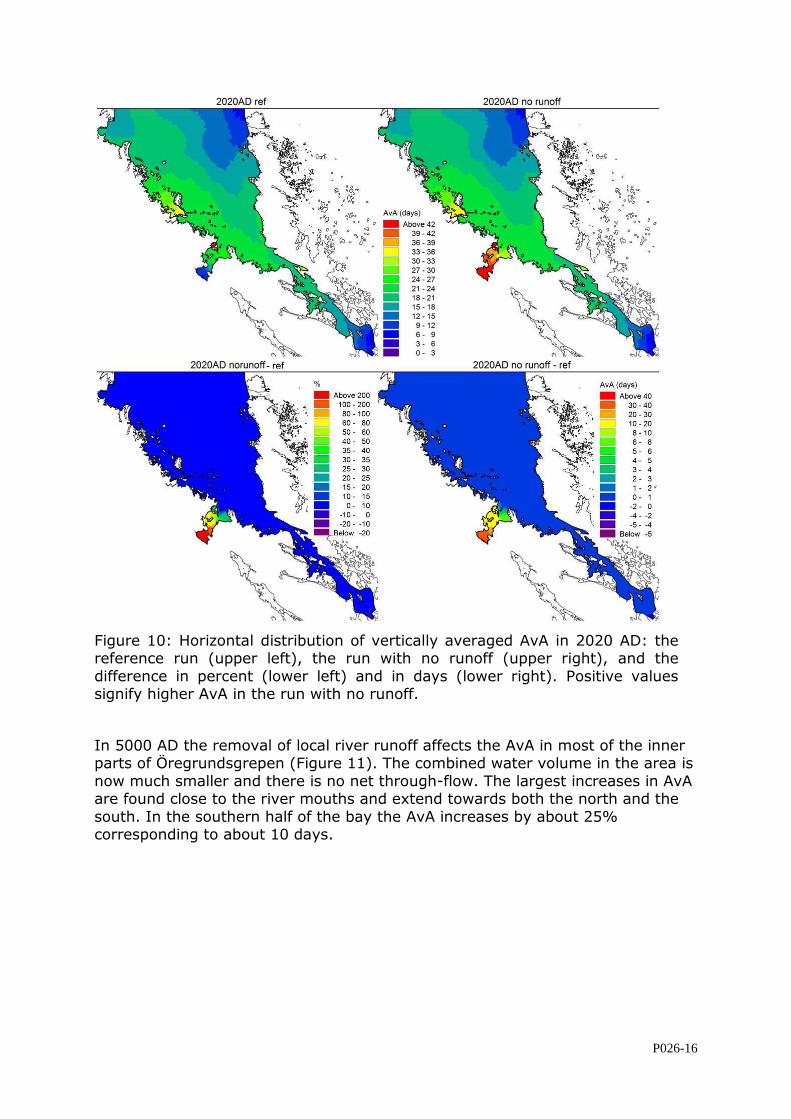
The effect of removing the local river runoff of Olandsån and Forsmarksån is barely identifiable in the larger parts of Öregrundsgrepen in 2020 AD. As can be
interpreted from Figure 10, the relative and absolute differences between with and without river runoff are very small. The only exception is in the basin where
the rivers are situated. This basin changes dramatically from being a generally well ventilated area to an area with very restricted exchange. Land runoff is very important in a small and enclosed basin but negligible for the area as a whole in
2020 AD.
P026-16
Figure 10: Horizontal distribution of vertically averaged AvA in 2020 AD: the reference run (upper left), the run with no runoff (upper right), and the
difference in percent (lower left) and in days (lower right). Positive values signify higher AvA in the run with no runoff.
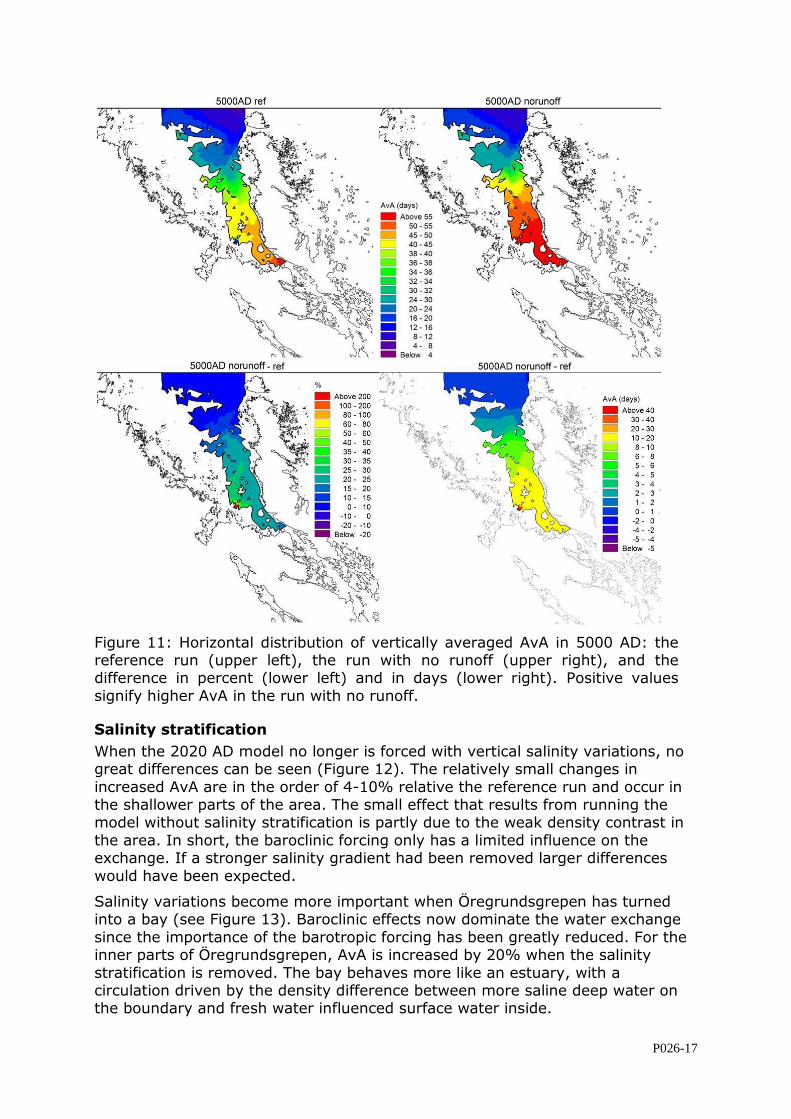
In 5000 AD the removal of local river runoff affects the AvA in most of the inner parts of Öregrundsgrepen (Figure 11). The combined water volume in the area is
now much smaller and there is no net through-flow. The largest increases in AvA are found close to the river mouths and extend towards both the north and the
south. In the southern half of the bay the AvA increases by about 25% corresponding to about 10 days.
P026-17
Figure 11: Horizontal distribution of vertically averaged AvA in 5000 AD: the reference run (upper left), the run with no runoff (upper right), and the difference in percent (lower left) and in days (lower right). Positive values
signify higher AvA in the run with no runoff.
Salinity stratification
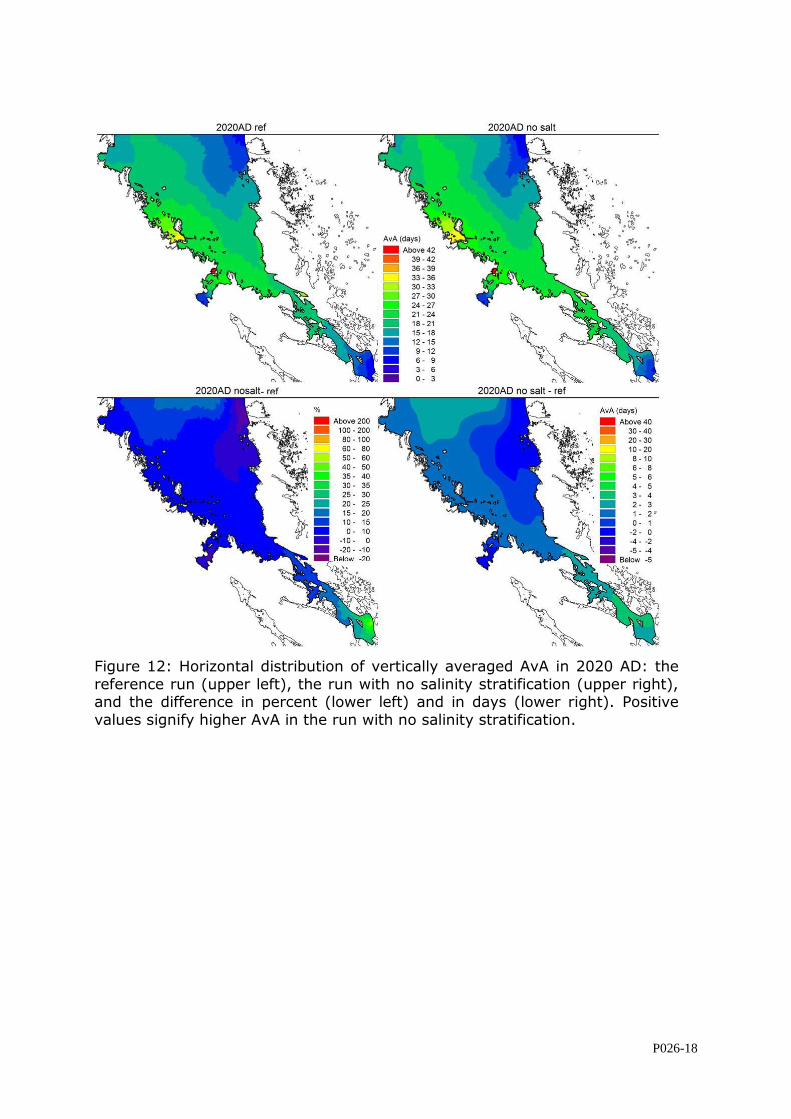
When the 2020 AD model no longer is forced with vertical salinity variations, no great differences can be seen (Figure 12). The relatively small changes in
increased AvA are in the order of 4-10% relative the reference run and occur in the shallower parts of the area. The small effect that results from running the model without salinity stratification is partly due to the weak density contrast in
the area. In short, the baroclinic forcing only has a limited influence on the exchange. If a stronger salinity gradient had been removed larger differences
would have been expected.
Salinity variations become more important when Öregrundsgrepen has turned into a bay (see Figure 13). Baroclinic effects now dominate the water exchange
since the importance of the barotropic forcing has been greatly reduced. For the inner parts of Öregrundsgrepen, AvA is increased by 20% when the salinity
stratification is removed. The bay behaves more like an estuary, with a circulation driven by the density difference between more saline deep water on the boundary and fresh water influenced surface water inside.
P026-18
Figure 12: Horizontal distribution of vertically averaged AvA in 2020 AD: the
reference run (upper left), the run with no salinity stratification (upper right), and the difference in percent (lower left) and in days (lower right). Positive
values signify higher AvA in the run with no salinity stratification.
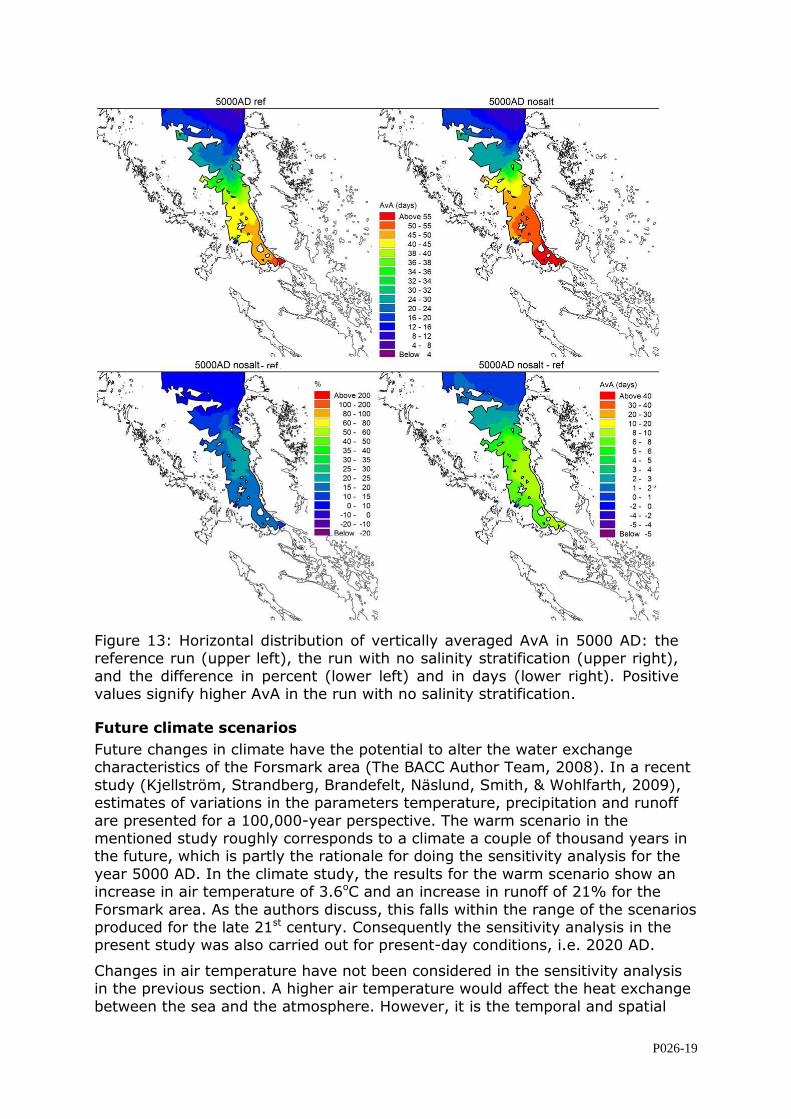
P026-19
Figure 13: Horizontal distribution of vertically averaged AvA in 5000 AD: the reference run (upper left), the run with no salinity stratification (upper right),
and the difference in percent (lower left) and in days (lower right). Positive values signify higher AvA in the run with no salinity stratification.
Future climate scenarios
Future changes in climate have the potential to alter the water exchange characteristics of the Forsmark area (The BACC Author Team, 2008). In a recent
study (Kjellström, Strandberg, Brandefelt, Näslund, Smith, & Wohlfarth, 2009), estimates of variations in the parameters temperature, precipitation and runoff
are presented for a 100,000-year perspective. The warm scenario in the mentioned study roughly corresponds to a climate a couple of thousand years in the future, which is partly the rationale for doing the sensitivity analysis for the
year 5000 AD. In the climate study, the results for the warm scenario show an increase in air temperature of 3.6oC and an increase in runoff of 21% for the
Forsmark area. As the authors discuss, this falls within the range of the scenarios produced for the late 21st century. Consequently the sensitivity analysis in the present study was also carried out for present-day conditions, i.e. 2020 AD.
Changes in air temperature have not been considered in the sensitivity analysis in the previous section. A higher air temperature would affect the heat exchange
between the sea and the atmosphere. However, it is the temporal and spatial
P026-20
variations that influence the water exchange. The average temperature change is thus not expected to be of large importance to the exchange, unless it in turn
affects the variability. A temperature change of 3.6 oC has approximately the same effect on the density as a salinity difference of about 0.7 psu. As discussed below, the Baltic Sea salinities may very well change more than this over long
time scales, as it has in the past (Gustafsson & Westman, 2002). However, the temperature signal is expected to be manifested in winter, resulting in a new
seasonal cycle that approximates the present-day period March-November. In short, present-day winter conditions would no longer exist. Examining the monthly evolution of the volume averaged age (not shown) shows no clear
indication that the winter months February and December are different in terms of water exchange. Hence, it would seem that differences in the average air
temperature would not create large changes in the average water exchange. It should be mentioned that the model does not include ice. It would be reasonable
to assume that ice cover during the winter would reduce the influence of the wind, reducing water exchange. Less ice in the future would then cause a higher water exchange during the winter
As for the projected changes in river runoff for present-day elevations it is readily seen that the amount of freshwater entering Öregrundsgrepen really only
affects a very small area in the south-eastern corner (Figure 10). A projected increase of 20% would probably not change the present situation much. For the year 5000 AD the situation is different (Figure 11). River runoff dominates the
volume-averaged age in large parts of the area and an increase would probably be noticeable, although small, resulting in higher water exchange and lower AvA.
Future scenarios are very vague in their projections of wind changes, but typical estimates lie around +20%. Increased windiness over the area, for both 2020 AD and 5000 AD, would likely result in decreased AvA, particularly in shallow areas.
Salinity is also a highly dynamical variable that has proven very difficult to project future changes of. The changes presented in the Baltic Sea assessment
report lie in the order of an 8 to 50% decrease. Just as for the air temperature, mean changes in salinity will only have a noticeable impact on the AvA if they alter the gradients in salinity. A higher fresh water runoff could sharpen the
vertical gradients, but could also – if large enough – push the halocline to depths below the bottom depths of Öregrundsgrepen. As discussed in (Gustafsson B. G.,
2004), the salinity stratification is to a greater degree determined by short-term variability in meteorological conditions. Should the vertical stratification decrease, the sensitivity analysis points to a reduced water exchange (higher
AvA), particularly for the enclosed bay of 5000 AD. Completely removing stratification produces a reduction in the AvA by about 25%, or about 5 days
(Figure 13).
All in all it may be relatively safe to state that all the projected changes in climatic variables would induce a higher rate of water exchange, the only
exception being if the stratification at depths above approximately 30 m in the Baltic Sea is reduced.
P026-21
CONCLUSIONS
The hydrodynamic conditions of the Forsmark marine area (present-day
Öregrundsgrepen) have successfully been modeled and validated against hydrographic observations and compared to an earlier model study.
The AvA shows how the Forsmark marine area evolves through the two major
stages: an open-ended coastal area (0-3000 AD) and a bay with only one open boundary (3000-9000 AD). During the first stage, a net through-flow is possible.
The AvA increases and then decreases as a result of a complex interplay between a narrower southern boundary, decreasing basin volume and decreasing cross-sectional areas. The AvA varies between 8 and 34 days, with the mean for the
entire area increasing from 13 up to 25 and then decreasing down to 14 days again. In general, the shallow western parts have higher AvA than then deeper
eastern parts. During the third stage, basins are gradually becoming more enclosed and are one by one transformed into lakes. The AvA for the entire area
increases from 14 to 43 days, but with a wide spread between different parts, varying from 13 to 105 days, where the innermost areas in the system have the highest AvA.
A validation of the local model showed good agreement between modeled and observed sea levels. A reasonable good agreement was found for the
temperature at a station in the centre of Öregrundsgrepen, except that the model does not completely capture the magnitude of the temperature decrease in the deeper water during an upwelling event. The agreement for salinity is not
entirely satisfactory, as there is an offset between observed and modeled temperatures of about 0.5 psu. However, the variability is fairly well captured by
the model. The validation also clearly demonstrated how the model is sensitive to the forcing on the open boundaries, particularly the wide northern boundary. As this forcing has been generated using a Baltic Sea model, it cannot be expected
to mirror reality exactly.
A sensitivity analysis has also been performed for the local model for the years
2020 and 5000 AD. This was carried out by completely removing one of the major forcing mechanisms at a time and comparing the results for the AvA with the reference simulation. The results show that the present-day stage, when
Öregrundsgrepen is open-ended, is primarily forced by the wind and sea levels. After the southern entrance has closed and Öregrundsgrepen has been
transformed into a bay, the baroclinic forcing due to variations in stratification and runoff from land come into play, whereas the barotropic forcing becomes insignificant. Wind still plays an important role, though. As can be expected the
AvA increases when a forcing mechanism is removed, with some local exceptions. Overall, the sensitivity of the AvA values to the complete removal of
a forcing mechanism was less than 50% in relative terms, or less than about 10 days in absolute terms. Some specific basins could show higher sensitivity, at least for parts of the year and typically when the wind was removed.
As for future climate scenarios, the only relevant scenario, on the time scales considered in this study for which any predictions are available, is a warmer
climate with increased rainfall. A higher average air temperature is on its own not expected to significantly alter the water exchange. However, reduced ice cover in winter may produce higher exchange in the winter months and thus a
lower AvA. Increased land runoff would also cause lower AvA, but probably only
P026-22
in directly affected basins and is unlikely to cause any changes in the order of magnitude if the projected increase of about 20% is realistic.
It is difficult to estimate changes in the water exchange due to climate-induced changes in the wind or Baltic Sea salinity, as projections for these variables are very vague. Particularly in the case of the salinity stratification, the projections
are for the Baltic Sea mean salinity, whereas it is strength of the stratification that primarily induces water exchange. A projected increase in wind should result
in an increased water exchange and lower AvA. If the vertical salinity stratification decreases, the sensitivity analysis indicates an increase in AvA, with the greatest effect when Öregrundsgrepen is an enclosed bay. Even so,
completely removing salinity stratification only increases the AvA by about 25% in the present model.
P026-23
REFERENCES
Brydsten, L. (2006). SKB TR-06-40: A model for landscape development in terms of shoreline displacement, sediment dynamics, lake formation, and lake choke-up processes. Svensk Kärnbränslehantering AB. Engqvist, A., & Andrejev, O. (2000). SKB TR-00-01: Sensitivity analysis with regard to variations of physical forcing including two possible future hydrographic regimes for the Öregrundsgrepen. A follow-up baroclinic 3D-model study. Svensk Kärnbränslehantering AB. Engqvist, A., & Andrejev, O. (2008). SKB TR-08-01 Validation of coastal oceanographic models at Forsmark. Site descriptive modelling SDM-Site Forsmark. Svensk Kärnbränslehantering AB. Engqvist, A., & Andrejev, O. (1999). SKB TR-99-11: Water exchange of Öregrundsgrepen. A baroclinic 3D-model study. Svensk Kärnbränslehantering AB. Engqvist, A., & Andrejev, O. (2003). Water exchange of the Stockholm archipelago – A cascade framework modeling approach. Journal of Sea Research , 49, 275-294. Engqvist, A., Döös, K., & Andrejev, O. (2006). Modeling water exchange and contaminant transport through a Baltic coastal region. Ambio , 35 (8), 435-447. Fonselius, S. (1996). Västerhavets och Östersjöns oceanografi. SMHI. Gustafsson, B. G. (2004). Millenial changes of the Baltic Sea salinity. Studies of the sensitivity of the salinity to climate change. Stockholm: Svesnk Kärnbränslehantering AB. Gustafsson, B. G., & Westman, P. (2002). On the causes for salinity variations in the Baltic Sea during the last 8500 years. Paleoceanography , 17 (3), doi:10.1029/2000PA000572. Kjellström, E., Strandberg, G., Brandefelt, J., Näslund, J.-O., Smith, B., & Wohlfarth, B. (2009). TR-09-04:Climate conditions in Sweden in a 100,000-year time perspective. Stockholm: Svensk Kärnbränslehantering AB. MIKE by DHI. (2008). MIKE ECO-Lab - Short Scientific Description . MIKE by DHI. (2008). MIKE21 & MIKE3 Flowmodel FM - Hydrodynamic and transport Module. Scientific Documentation. Persson, J., Wallin, M., & Wallström, K. (1993). Kustvatten i Uppsala län 1993. Uppsalastiftelsen. SKB. (2006). SKB R-06-82: The biosphere at Forsmark. Data, assumptions and models used in the SR-Can assessment. Svensk Kärnbränslehantering AB. Stigebrandt, A. (1990). On the response of horizontal mean vertical density distribution in a fjord to low-frequency density fluctuations in the coastal water. Tellus , 42A, ss. 605-614. Strömgren, M., & Brydsten, L. (2008). SKB R-08-62: Digital elevation models of Forsmark. Site descriptive modelling SDM-Site Forsmark. Svensk Kärnbränslehantering AB. Söderbäck, B. (Ed.). (2008). SKB R-08-19: Geological evolution, palaeoclimate and historical development of the Forsmark and Laxemar-Simpevarp areas. Site descriptive modelling. SDM-Site. Svensk Kärnbränslehantering AB. The BACC Author Team. (2008). Assesment of Climate Change for the Baltic Sea Basin. (H.-J. Bolle, M. Menenti, & I. Rasool, Eds.) Berlin, Heidelberg: Springer. Westman, P., Wastegård, S., Schoning, K., Gustafsson, B., & Omstedt, A. (1999). SKB TR-99-38: Salinity change in the Baltic Sea during the last 8,500 years: evidence, causes and models. Svensk Kärnbränslehantering AB.

P026-24
Wijnbladh, E., Aquilonius, K., & Floderus, S. (2008). SKB R-08-03 The marine ecosystems at Forsmark and Laxemar-Simpevarp. Site descriptive modelling
SDM-Site. Svensk Kärnbränslehantering AB .