Embed Size (px)
Citation preview

BIOMEDICAL ENGINEERING
HIGH RESOLUTION ULTRASONIC VESSEL IMAGING AND REPEATABILITY
OF BLOOD FLOW MODELING USING AN ULTRASOUND CONTRAST AGENT
MARY ELIZABETH LOVELESS
Thesis under the direction of Professor Thomas E. Yankeelov
Cancer is a complex and adaptable disease, and knowledge of the mechanisms that
cause its progression is vital to creating and monitoring anti-cancer therapies. As a tumor
grows beyond a few mm3, blood vessels are recruited to provide additional nutrients in a
process called angiogenesis. Some novel drug therapies specifically target this process,
and the efficacy of these drugs can in principle be monitored by a technique called
angiography. 3D angiography, a method of imaging the vasculature, can be performed
by several imaging modalities typically with the use of a contrast agent.
A technique is introduced which uses high resolution ultrasound in conjunction with
an ultrasound contrast agent to produce 3D images of the vasculature. This method offers
a faster, more accessible, and cheaper alternative to assess the efficacy of anti-angiogenic
drugs in preclinical cancer models. In addition to vessel imaging, modeling the kinetic
behavior of the contrast agent in the vasculature can elucidate parameters such as blood
flow, which can also serve as an indicator of drug treatment efficacy. The repeatability
of a commonly used mono-exponential model is assessed in order to determine thresholds
for inter/intra-subject error.
ii
The 3D vessel imaging technique presented in this thesis correlated with other
measures of blood flow (r = 0.55 ± 0.04, p < 0.01) and shows an increased sensitivity to
microvasculature within tumors. Also, preliminary repeatability analysis (n = 6) on the
modeling parameter which is proportional to contrast agent velocity shows a mean
difference of 0.061 ± 0.298 between independent measurements, and the limits of
agreement range from -0.536 and 0.656. The developments exhibited provide additional
methods for monitoring longitudinal anti-angiogenic cancer treatments in preclinical
models.
Approved:
Professor Thomas E. Yankeelov

iii
HIGH RESOLUTION ULTRASONIC VESSEL IMAGING AND REPEATABILITY
OF BLOOD FLOW MODELING USING AN ULTRASOUND CONTRAST AGENT
By
Mary Elizabeth Loveless
Thesis
Submitted to the Faculty of the
Graduate School of Vanderbilt University
in partial fulfillment of the requirements
for the degree of
MASTER OF SCIENCE
in
Biomedical Engineering
December, 2007
Nashville, TN
Approved:
Professor Thomas E. Yankeelov
Professor John C. Gore
iv
ACKNOWLEDGMENTS
I would like to thank my funding sources for their support during the investigation of
this work. The National Institute of Health (NIH) pre-doctoral training grant (NIH 5 T32
EB003817), the American Institute of Ultrasound in Medicine (AIUM) Endowment for
Education and Research grant, and the NIH/National Cancer Institute (NCI) U24
CA126588 grant generously provided the funding for materials and time to produce the
work presented in this thesis.
I would also like give a huge thanks to those individuals that have contributed time
and effort to this work. Specifically, I appreciate the efforts of Jessica Huamani and Dr.
Dennis Hallahan for providing the animal models of cancer used to develop the
methodology. To Dr. Xia Li and Dr. Benoit Dawant, I extend my gratitude for the help
with imaging processing and registration. Dr. Andrej Lyshchik graciously gave his time
in developing procedures to make this work possible. I thank Mr. Jarrod True for
assistance for animal handling and Dr. Tuhin Sinha and Dr. Jeff Luci for analytical and
technical consults. Thanks also go to Dr. Leena Choi who assisted in statistical
analysis. To those members of the Vanderbilt Cancer Imaging Group (VCIG), I
appreciate all the ideas and discussions to help progress this work. Last but certainly not
least, I would like to thank Dr. John Gore and Dr. Thomas Yankeelov for their continued
advice and support.
On a more specific note, a huge debt of gratitude is owed to my advisor Dr. Thomas
Yankeelov. Not only was his knowledge and experience continually sought after during
the development and analysis of the work presented here, but his sense of humor and

v
willingness to help at any time were invaluable. Many thanks go to him for providing an
interesting and engaging learning environment. You're the coolest.
Saving the best for last, I would like to thank my husband, Daniel Loveless, who
probably knows more about this work than he ever anticipated. He has provided not only
enlightening discussions but moral support and patience throughout this whole process.
This work would not have been possible without all his encouragement and
understanding. And to my family, I thank you all for your patience and understanding.
Your unconditional love provides the cornerstone for my success. Thanks to all of you; I
would not be where I am today without you.
vi
TABLE OF CONTENTS
ACKNOWLEDGMENT.................................................................................................... iv
LIST OF FIGURES .......................................................................................................... vii
LIST OF TABLES............................................................................................................. ix
Chapter
I. INTRODUCTION ......................................................................................................1
Cancer and Angiogenesis.........................................................................................1
Angiography ............................................................................................................2
Ultrasound................................................................................................................3
Ultrasound Contrast Agents.....................................................................................4
Kinetic Modeling of Ultrasound Contrast Agents ...................................................5
II. DEVELOPMENT OF HIGH RESOLUTION CONTRAST ENHANCED VESSEL
IMAGING USING ULTRASOUND .........................................................................7
Introduction..............................................................................................................7
Materials and Methods.............................................................................................9
Results....................................................................................................................14
Discussion ..............................................................................................................19
III. REPEATABILITY OF BLOOD FLOW MODELING USING CONTRAST
ENHANCED SONOGRAPHY ................................................................................23
Introduction............................................................................................................23
Materials and Methods...........................................................................................25
Results....................................................................................................................26
Discussion ..............................................................................................................28
IV. CONCLUSIONS.......................................................................................................31
Appendix............................................................................................................................33
Additional Figures .................................................................................................33
REFERENCES ..................................................................................................................44

vii
LIST OF FIGURES
Figure Page
1. Synopsis of Microbubble Behavior ...............................................................................5
2. Time Intensity Curves for Reperfusion Data .................................................................6
3. Duration of Ultrasound Enhancement Time Intensity Curves.....................................15
4. Reperfusion Repeatability Time Intensity Curves .......................................................16
5. Correlation of Contrast Enhanced Vessel Imaging and Power Doppler......................18
6. 3D Contrast-Enhanced Vessel Imaging Results ..........................................................19
7. Plot of B Parameters ....................................................................................................27
8. Plot of β Parameters .....................................................................................................27
9. Bland-Altman Plot of β Parameters within Subjects ...................................................28
10. Duration of Ultrasound Enhancement Plots for Mouse 1............................................33
11. Duration of Ultrasound Enhancement Plots for Mouse 3............................................34
12. Duration of Ultrasound Enhancement Plots for Mouse 4............................................34
13. Duration of Ultrasound Enhancement Plots for Mouse 5............................................35
14. Duration of Ultrasound Enhancement Plots for Mouse 6............................................35
15. Duration of Ultrasound Enhancement Plots for Mouse 7............................................36
16. Duration of Ultrasound Enhancement Plots for Mouse 8............................................36
17. Reperfusion Repeatability Plots for Mouse 1 ..............................................................37
18. Reperfusion Repeatability Plots for Mouse 3 ..............................................................37
19. Reperfusion Repeatability Plots for Mouse 5 ..............................................................38
20. Reperfusion Repeatability Plots for Mouse 6 ..............................................................38
viii
21. Reperfusion Repeatability Plots for Mouse 7 ..............................................................39
22. Reperfusion Repeatability Plots for Mouse 8 ..............................................................39
23. β Parameters for Mice 1-3 ...........................................................................................40
24. β Parameters for Mice 4-6 ...........................................................................................41
25. B Parameters for Mice 1-3...........................................................................................42
26. B Parameters for Mice 4-6...........................................................................................43

ix
LIST OF TABLES
Table Page
1. Results from the Duration of UCA Enhancement Study......................................... 14
2. Results from the Reperfusion Repeatability Study.................................................. 17
3. Results from the CEVI and Power Doppler ROI Correlation.................................. 17

1
CHAPTER I
INTRODUCTION
Cancer and Angiogenesis
While no single definition can characterize all forms of cancer, for the sake of
simplicity, a usefule general definition of cancer is "a set of diseases characterized by
unregulated cell growth leading to invasion of surrounding tissues and spread
(metastasis) to other parts of the body" [1]. This definition is insufficient due to the many
different types of cancers in existence (e.g., lung, breast, pancreas, skin melanoma, etc)
that all express varying attributes that govern growth rate, metastatic state, and lethality.
While prevention is the best defense against cancer, understanding the mechanisms
responsible for the behaviors of various cancers can elucidate methods of early detection
and treatment.
One specific characteristic of cancer that has been exploited for monitoring tumor
growth and treatment response is angiogenesis. Angiogenesis is the recruitment of blood
vessels by the primary cancer site in order to provide additional nutrients. As the tumor
grows beyond approximately one mm3, diffusion can no longer provide essential
nutrients for the tumor cells thus creating hypoxic regions. Growth factors such as
platelet-derived growth factor, fibroblast growth factor (FGF), and vascular endothelial
growth factor (VEGF) are then secreted to promote the migration of endothelial cells to
the site through a chemotactic response to the growth factor concentration [1]. However,
the vessels produced differ from normal vasculature; the vessels are typically tortuous,

2
leaky, and poorly constructed. Thus, monitoring angiogenesis provides insight into
tumor growth and anti-angiogenic treatment response [2-3].
Angiography
Imaging can provide a non-invasive means for examining the tumor
microenvironment for both pre-clinical and clinical applications. Biopsies are invasive
and challenging during longitudinal studies of cancer. Imaging provides non-invasive in
vivo monitoring of the progression, growth and functionality of the cancer. Different
imaging modalities provide methods of measuring angiogenesis in vivo; angiography, or
the mapping of vasculature, is typically accomplished by the use of an exogenous
contrast agent. In magnetic resonance imaging (MRI), a paramagnetic agent, such as
gadolinium, is injected into the blood stream. The agent changes the relaxation time of
the surrounding tissue and thereby affects the tissue contrast. In computed tomography
(CT), iodine based contrast agent is typically used because of its ability to attenuate more
X-rays than the surround tissue. However, these modalities have both strengths and
weaknesses. While MRI uses non-ionizing radiation, the process can be time-consuming
and costly. CT requires a dose of radiation for every visit so longitudinal studies are
limited. This thesis presents a safe, cost-effective, and time-saving alternative to these
methods using contrast enhanced ultrasound (CEUS) as a method for high resolution 3D
vessel imaging in small animal models of cancer.

3
Ultrasound
Ultrasound imaging exploits the acoustic properties of tissue. The technique utilizes
a transducer that transforms electrical energy into mechanical energy to produce a sound
wave that can propagate through a medium (tissue). This longitudinal wave will cause
elements of the medium to vibrate at individual velocities (u(x,t)). For a planar wave, the
ratio of the acoustic pressure and the particle velocity (u(x,t)) is the acoustic impedance
(Z) a characteristric of the medium. As the waves continue through the tissue, the energy
can be absorbed, scattered or reflected back to the source. The sound wave obeys Snell’s
Law of Refraction:
Z1sin(θ1) = Z2sin(θ2) (Equation 1)
where θ is the angle of incidence of the first medium and the angle of refraction within
the second medium, and Z1 and Z2 are the acoustic impedances of the first and second
media, respectively. The intensity of the reflected wave (R) at normal incidence depends
on the change in Z of the tissue and incident intensity (I):
IZZ
ZZR ⋅
+
−=
2
21
21. (Equation 2)
The acoustic impedance depends on the density and elastic stiffness of the medium and
varies between different biological tissues. Consequently, changes in Z produce
backscattered ultrasound (echoes), and they are the basis of the contrast seen in
ultrasound images.

4
Ultrasound Contrast Agents (UCAs)
According to Equation 2, the larger the difference in impedance between two sections
of tissue, the more reflection occurs at the interface between those two media. UCAs are
composed of air or high density gas surrounded by a stabilization shell [4-8] yielding an
acoustic impedance value of approximately 0.0004 x 10⁶ rayls while the Z value for
blood is 1.65 x 10⁶ rayls [9]. Delivering UCAs into the bloodstream creates a significant
reflected signal that can indicate spatial information about where the contrast agent is
distributed. As acoustic energy is deposited, the UCA begin to expand and contract at a
certain frequency. The natural frequency or resonance frequency ( 0f ), at which the
bubble oscillates is related to its radius (r):
0
0
0
3
2
1
ρ
γ
π
P
rf = (Equation 3)
where P0 is ambient fluid pressure, γ is the adiabatic ideal gas constant, and 0ρ is
ambient fluid density [10].
For microbubbles with sizes less than 10 µm, the natural frequency falls within the
diagnostic ultrasound range of 1 – 20 MHz. The increased reflectance of the resonating
UCA is due to the expansion (followed by a contraction) of the bubble size. As shown in
Figure 1, at low power input, the microbubbles behave in a linear fashion, resonating at
the natural frequency. However, at higher power input, the contrast agent begins to
demonstrate nonlinear resonance, producing harmonics of the natural frequency [10]. At
even higher power, the bubbles can be destroyed by extreme expansion and contraction,
which can be advantageous in some applications.

5
Kinetic Modeling of Ultrasound Contrast Agents
In order to provide quantitative measurements with UCAs, two main assumptions are
required. The first assumption requires that the UCA do not have a hemodynamic effect
(i.e., no influence on blood flow or circulation) [12-13], and secondly, the UCAs are
assumed to remain in constant flow and are not metabolized in any way [14]. With these
assumptions, mathematical models have been produced to assess such properties as tissue
blood flow, vascular integrity, branching pattern, and density using UCA [11,15-17].
Since UCAs can be destroyed at a high mechanical index (M.I.), imaging reperfusion
of an area allows for repeated measurements of the contrast dynamics. After a certain
time following a contrast agent infusion, the concentration of contrast reaches a steady-
state within the blood. By destroying the microbubbles in a section of vasculature, the
Figure 1. Microbubble behavior changes as a function acoustic power. As the
mechanical index (MI) increases, the microbubbles oscillate at different frequencies until
disruption [11].

6
replenishment of contrast agent can reflect cross sectional area, UCA velocity, and blood
flow [17]. Plotting the time course before, during and after a bolus of contrast is injected
or destruction sequence yields a time intensity curve (TIC) such as in Figure 2.
This TIC can be described mathematically by examining the shape of the curve produced
with the following equation:
)]exp(1[)( tBtVI ⋅−−⋅= β , (Equation 4)
where VI(t) is backscattered intensity at time t, B is the asymptotic plateau, and β is the
rate of replenishment of microbubble concentration. For each pixel within an ultrasound
image, the intensity changes based on the concentration of the agent present [12,18]. The
curve is fit to Equation 4 which provides parameters of B and β, estimates of vessel
cross-sectional area and UCA velocity, respectively. The product of these two
parameters provides an estimate of blood flow.
Figure 2. Panel a represents a time intensity curve produced from the region of interest
(ROI) selected in panel b. Panel b is a B-mode image of a subcutaneous tumor in a
mouse. The green overlay indicates the increased signal intensity from UCA. The signal
intensity increases mono-exponentially as the UCA enters the field.
a b

7
CHAPTER II
DEVELOPMENT OF HIGH RESOLUTION CONTRAST ENHANCED
VESSEL IMAGING USING ULTRASOUND
Introduction
Non-invasive imaging methods that can quantitatively evaluate tumor
microvasculature in pre-clinical models of cancer can provide valuable information on
both tumor growth and treatment response. In particular, treatments that affect the
vasculature of a tumor (e.g., anti-angiogenic drugs) can be monitored using vessel
imaging techniques. Several imaging modalities can be used to generate 3D angiograms
for monitoring vessel distribution and anti-angiogenic treatment effects, and each
modality has both strengths and weakness. While CT techniques can approach
resolutions on the order of 50 µm, each scan requires the use of ionizing radiation and
injections of relatively large volumes (300-400 µL in mice) of contrast agent, thereby
limiting the number of repeat studies that can be performed. Magnetic resonance
angiography (MRA) requires no ionizing radiation and provides a spatial resolution of
approximately 80 µm in reasonable time [19], but the technique is costly, time
consuming, and not always reliable in the presence of physiological motion. Ultrasound
methods have been proposed for vessel imaging by exploiting the Doppler effect.
Changes in the frequency of the ultrasound signal caused by the movement of the flowing
blood through static tissue allow Doppler ultrasound techniques to isolate vasculature.
However, this type of analysis is known to have significant user-dependence. In
particular, if the angle of the imaging plane is not perpendicular to the vessel, a true
8
cross-section of the vessel may not be measured thereby introducing significant errors
[20]. Here we report our experience in imaging tumor vasculature using an alternative
approach based on ultrasound contrast agents. UCAs provide a highly sensitive method
of imaging microvasculature at the capillary level without the limitations of the above
mentioned techniques [20].
As previously mentioned, UCAs are an intravascular contrast agent and can
produce replenishment (wash-in) curves repeatedly during a single scan to characterize
parameters such as blood flow in a particular area of interest [17]. These replenishment
curves are time courses that characterize the intensity of the contrast produced as agent
flows into a region of tissue and can be repeated by taking advantage of microbubble
behavior under high power. By utilizing these characteristics, UCAs are attractive
candidates for developing ultrasound contrast enhanced vessel imaging (CEVI), and their
kinetic behavior can provide boundary parameters for the development of such a
technique.
Once the UCAs are destroyed in a slice, the contrast agent reperfuses the region
of interest. The image gathered immediately after the destruction pulse, which contains
no contrast agent, can be subtracted from a later image that contains UCA to create an
image that represents only the contrast enhanced vasculature. A 3D image of the
vasculature can be created by incrementing through the tumor and repeatedly imaging the
destruction and replenishment cycle in each slice. By examining how long the UCA
remains in circulation as well as by obtaining the maximum number of destruction pulses
that can be applied while maintaining significant enhancement, we develop a CEUS
approach to generate high-resolution 3D images of tumor vasculature.

9
Materials and Methods
Data Acquisition
Duration of UCA Enhancement
All procedures adhered to our Institution’s Animal Care and Use Committee
guidelines. Eight female mice were injected subcutaneously with 106 67NR breast cancer
cells in the hind limb. Eight days postinjection, they were imaged on a Visualsonics
Vevo 770 (Toronto, Canada) system using a 40 MHz transducer mounted to a 3D motor
on a rail system. Two days prior to imaging, 26G jugular catheters were surgically
implanted for delivery of the contrast agent. During the imaging session, the animals
were anesthetized with a 2%/98% isoflurane/oxygen mixture, and body temperature was
monitored and maintained at 37o C by a warming plate. Heart rate was also monitored
and remained approximately 350 – 400 bpm.
Coupling gel was applied to the area of interest, and 2D B-mode and power Doppler
scout images established a slice of tumor with vascularity present. The field of view
varied from 9 mm X 9 mm to 12 mm X 12 mm depending on tumor size, establishing an
in plane pixel size of less than or equal to ~25 µm X 25 µm. Image acquisition began
immediately prior to a 50 µl bolus of Visualsonics Micromarker UCA (1.0 x 10⁸
microbubbles/50 µL injection) injected via a jugular catheter. This UCA is specifically
designed for high frequency (30 – 45 MHz) ultrasound imaging, and the diameter of the
microbubbles range from 2 to 3 µm. Images were obtained within Visualsonics Contrast
mode at a frame rate of 6-8 frames/second at 50% power (mechanical index (M.I.) of

10
0.14) for 10 minutes with no respiratory gating. This process was repeated for each
mouse after 30 minutes which allowed for the clearance of any residual contrast [21].
Reperfusion repeatability
Animal preparation and field of view were identical to the duration of UCA
enhancement study. Once the 50 µl bolus of Visualsonics Micromarker UCA injected
reached steady state (approximately 45 seconds) [17,22], imaging began using the
Visualsonics Contrast mode at a frame rate of 14 frames/second at 50% power. A 100%
power destruction pulse (M.I. of 0.59) was administered, and images were collected for
approximately 15-20 seconds in order to characterize the reperfusion curve. Twelve to
eighteen sets of reperfusion images were collected using multiple destruction pulses over
the maximum time dictated by the duration of UCA enhancement study described above.
This process was then repeated for each subject after a 30 minute period of time.
3D CEVI
Using the preparation described in the previous studies, B-mode scout images
established the most posterior slice of the region of interest. A 50 µl bolus of UCA was
injected and allowed to reach equilibrium within the blood stream. Imaging at 50%
power began after equilibrium was reached, and a destruction pulse was administered,
followed by 15-20 seconds of image acquisition with no respiratory gating. Images were
obtained within Visualsonics Contrast mode at a frame rate of 14 frames/second. The
transducer was calibrated to fix on the next slice of tissue 330 µm in the anterior direction
by manually incrementing a translation stage. A destruction pulse was administered
followed by another 15-20 seconds of image acquisition. This process was repeated for
each slice of tissue until the entire tumor was covered. Additional (up to three) injections

11
of UCA were utilized based on the maximum number of destructions determined in the
reperfusion repeatability study described above.
3D power Doppler images were also obtained to compare the proposed vessel
imaging method to an accepted ultrasound method of detecting flow. Using the same
field of view and step size as the CEVI technique, 3D power Doppler and B-mode images
of the tumor were also collected. Respiratory gating was used, and the power was set to
100% with the scan speed of 2.0 mm/s. The wall filter was set to 2.5 mm/s to eliminate
echoes from the vessel wall movement.
Data Analysis
Duration of UCA Enhancement
Data analyses were performed using Visualsonics software, Microsoft Excel 2003
(Redmond, WA, USA), and Matlab R2006a (The Mathworks, Natick, MA, USA). ROIs
of the entire tumor area were manually drawn, and the average intensity for each frame
was computed in order to construct a time intensity curve for each mouse. Eight sets of
TICs, two injections for each subject (one set), were exported to Excel, and the minimum
intensity value was subtracted from all points in the time course to eliminate baseline
noise. For each set, the TIC obtained from the first injection was plotted against the
second injection TIC in order to assess the repeatability of the study. Additionally, each
TIC was exported to Matlab to determine the time during washout in which enhancement
from the UCA is no longer above 20% of the baseline during imaging.
12
Reperfusion repeatability
Data analyses were performed using Visualsonics software, Microsoft Excel 2003,
and Matlab R2006a. ROIs of the entire tumor area were manually drawn, and the
average intensity for each frame was computed in order to form a TIC for each subject.
The data were then exported to Matlab. Each data segment containing a destruction pulse
and subsequent reperfusion frames were separated into individual files, and the minimum
intensity value was subtracted from all points in the time course. Time course data were
smoothed temporally by using a moving window filter with a window size of three. Each
time course for an injection contained anywhere from 12 to 18 segments.
3D CEVI
Data analyses were performed using Matlab R2006a. The maximum duration for
UCA image enhancement and the number of destruction pulses allowed before
insignificant enhancement were determined from the two studies described above, and
the results were applied to determine data acquisition boundary parameters for 3D CEVI.
The data were then exported to Matlab, and each frame within a time course was
downsampled to a 256 X 256 image matrix. Frames within a data set were co-registered
to the baseline time course frame using a rigid-body algorithm to eliminate any motion
artifacts [23-24]. The registration algorithm relies on mutual information shared between
each image set. A transformation is applied to the reference image that maximizes shared
information with the target image file. The registered images were processed using a
maximum intensity pixel (MIP) algorithm. The last slice was subtracted from the first
post-destruction image to eliminate baseline intensity, and any pixel displaying intensity

13
less than 20% of the maximum was eliminated (i.e., set to zero intensity). In addition, a
maximum change in intensity map was created. The mean and standard deviation were
found from an ROI containing rapidly enhancing voxels, which are characteristic of the
presence of an UCA. Any voxel below the mean of the ROI minus one standard
deviation was not considered rapidly enhancing and was set to zero intensity. Finally, the
images were filtered for stray pixels that had less than three enhancing pixels surrounding
the pixel being interrogated. The process was repeated for each slice within a volume.
Processed CEVI slices and anatomical slices were fused into separate volume images.
Anatomical volumes from the 3D CEVI region of interest were co-registered to
anatomical volumes collected using the 3D power Doppler technique. The
transformation was applied to the power Doppler data thereby registering it with the 3D
CEVI data. Logical masks, where 1 represented vasculature signal and 0 represented no
vasculature signal, were created for both the CEVI slice and the corresponding power
Doppler slice in all data sets. 2D Pearson correlation coefficients for each slice were
found using the corr2 command in Matlab.

14
Results
Duration of UCA Enhancement
Time course images were obtained for each injection at an in plane pixel size of ~25
µm X 25 µm. ROIs were drawn and TICs were analyzed using this native resolution.
Plots of the TIC were created in Excel, and visual inspection was used to predict the
maximum clearance time of the UCA for the reperfusion repeatability study.
TABLE 1
Results from the Duration of UCA Enhancement Study
Mouse Injection # Time (min) Slope r p-value
1 3.80 1
2 4.20 1.96 0.97 < 0.05
1 4.20 2
2 5.60 1.16 0.99 < 0.05
1 3.60 3
2 4.50 1.31 0.95 < 0.05
1 5.30 4
2 4.70 1.29 0.98 < 0.05
1 4.10 5
2 5.30 0.49 0.93 < 0.05
1 4.80 6
2 3.90 0.80 0.98 < 0.05
1 1.90 7
2 3.20 0.68 0.67 < 0.05
1 3.30 8
2 6.60 0.85 0.96 < 0.05
Table 1 presents the time each injection took to return to approximately 20% above
baseline level. Baseline levels were described to be the average intensity immediately
prior to contrast uptake. The mean time of UCA image enhancement was found to be
4.30 minutes ± of 1.09 minutes.

15
For each mouse, the TIC from injection one was plotted against the injection two TIC
as demonstrated in Figure 3. Data were cropped such that it included only the wash out
from each injection because possible variation in injection rate introduced unstable wash-
in curves.
Table 1 describes the slope and r-values corresponding to each set plotted. P-values for
all sets of injections were computed using ANOVA and found to be less than 0.05 in all
cases.
Reperfusion repeatability
Results were obtained from six mice; data from two mice were discarded due to
errors in UCA injection; however, all eight mice were successfully used in the other
studies described. Images produced were the same in plane resolution as described
above. Time courses were exported to Excel to estimate the number of destructions
Figure 3. Panel a demonstrates the entire pre- and post-injection TIC with the highlighted
region that was compared in panel b. The linearity seen in panel b depicts the
repeatability of the washout curve.

16
delivered before enhancement was insignificant. Example TICs resulting from this study
are presented in Figure 4.
These estimated values were used during CEVI data acquisition to determine how many
pulses can be administered and still maintain microbubble enhancement. Baseline levels
were found for each injection, and the time after a destruction pulse was found where the
maximum enhancement fell below 20% of the baseline. The number of destruction
pulses were counted within that time and reported in Table 2. The average number of
destructions was four pulses with a standard deviation of two pulses.
Figure 4. Panels a and b demonstrate two examples of multiple destructions applied to
one slice of tissue. The arrows indicate several examples of the applied destruction pulse
followed by the reperfusion of the UCA.

17
TABLE 2
Results from the Reperfusion Repeatability Study
Mouse Injection # # of Dest. Pulses
1 4 1
2 7
1 4 2
2 7
1 N/A 3
2 N/A
1 N/A 4
2 N/A
1 7 5
2 6
1 1 6
2 2
1 2 7
2 4
1 5 8
2 4
3D CEVI
Correlation coefficients for all slices were averaged and listed for each animal in
Table 3.
TABLE 3
Results from the CEVI and Power Doppler ROI Correlation
Mouse
Average r
value
Standard
Deviation
Maximum r
value
Minimum r
value
p-
value
1 0.603 0.058 0.676 0.413 < 0.01
2 0.535 0.086 0.674 0.372 < 0.01
3 0.594 0.081 0.784 0.448 < 0.01
4 0.511 0.056 0.616 0.373 < 0.01
5 0.524 0.069 0.642 0.385 < 0.01
6 0.508 0.085 0.665 0.285 < 0.01
7 0.52 0.148 0.729 0.179 < 0.01
8 0.602 0.096 0.717 0.314 < 0.01
18
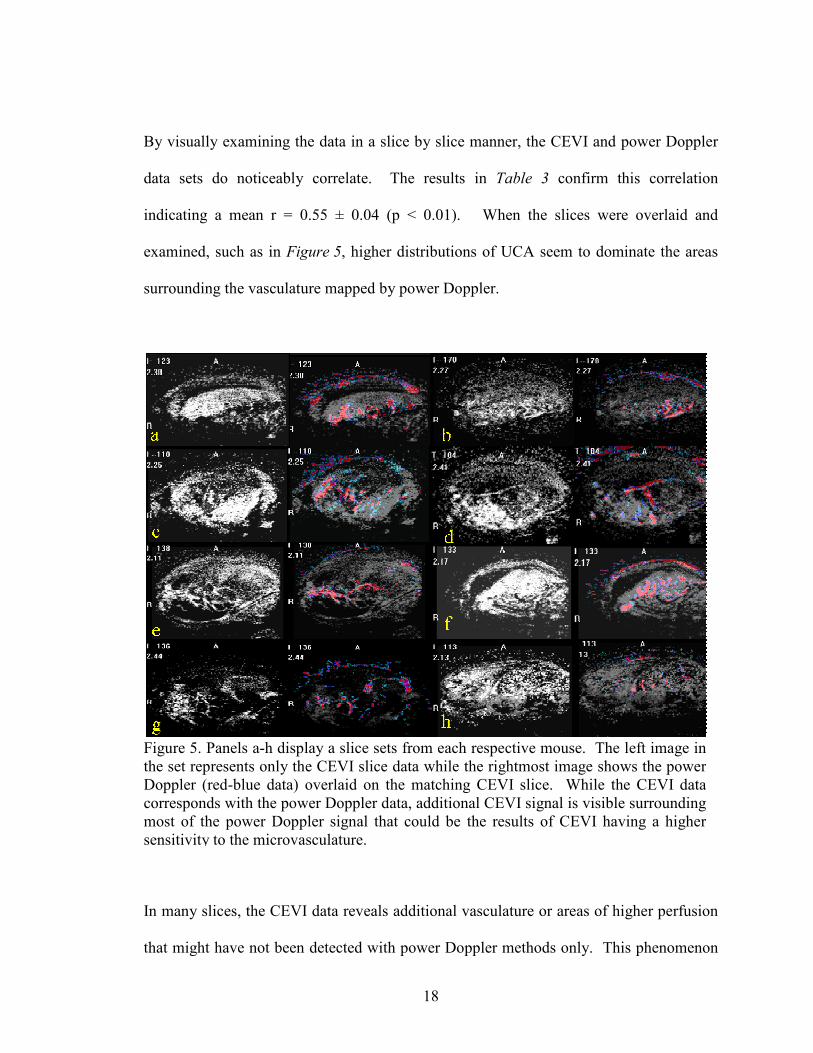
By visually examining the data in a slice by slice manner, the CEVI and power Doppler
data sets do noticeably correlate. The results in Table 3 confirm this correlation
indicating a mean r = 0.55 ± 0.04 (p < 0.01). When the slices were overlaid and
examined, such as in Figure 5, higher distributions of UCA seem to dominate the areas
surrounding the vasculature mapped by power Doppler.
In many slices, the CEVI data reveals additional vasculature or areas of higher perfusion
that might have not been detected with power Doppler methods only. This phenomenon
Figure 5. Panels a-h display a slice sets from each respective mouse. The left image in
the set represents only the CEVI slice data while the rightmost image shows the power
Doppler (red-blue data) overlaid on the matching CEVI slice. While the CEVI data
corresponds with the power Doppler data, additional CEVI signal is visible surrounding
most of the power Doppler signal that could be the results of CEVI having a higher
sensitivity to the microvasculature.

19
is not unexpected since CEUS is known to be more sensitive than power Doppler to
microvasculature at the capillary level [25]. Figure 6 depicts the final reconstructed 3D
CEVI volumes overlaid on the respective B-mode slices of each mouse.
Discussion
The mean time of UCA image enhancement found in this study corresponds to values
previously reported in the literature [26]. This parameter provides a temporal boundary
for application in imaging studies involving UCAs. With a fixed 50% power applied, the
washout curve appears reasonably consistent when repeated. In order to optimize
repeatability, an automated syringe pump should be used in future studies. With an
automated syringe pump both the amount of contrast injected as well as rate of injection
are controlled across multiple injections and multiple subjects.
Figure 5. Panels a-h demonstrate the final 3D CEVI surface rendering overlaid on 3D B-
mode slices for each mouse. A display filter isolated 80% of the signal and was applied
such that vasculature from the skin would not be included in the 3D surface rendering.
These 3D renderings provide spatial information about areas that are well-perfused
within the tumor.
20
The reperfusion repeatability study provides the second essential boundary for
developing a 3D CEVI technique. In order to isolate only contrast enhancement, a
baseline image must be subtracted from each slice. This baseline image can be obtained
by examining a slice absent of UCA; this state can be achieved by applying a destruction
pulse. However, with each administered destruction pulse, a certain amount of UCA,
which varies based on the vascularity of the ROI, are destroyed from circulation. This
study has revealed an upper bound that is not only dependent on how long the UCA
remains in circulation, but also how many destruction pulses can be administered until
enhancement is not longer significant.
Upon visual inspection of the curves produced during this study, some data sets
appeared to lose a significant percentage of enhancement after the first pulse while other
data sets maintained an exponential decay of signal with each administered pulse. This
observation could have been due to (at least) two factors. If a section of tissue was highly
vascularized, a larger amount of the contrast could be destroyed, thereby reducing total
enhancement of the entire tumor region. Another reason could be that the UCA did not
reach steady-state in the blood stream. Care was taken to ensure that a pulse was not
delivered until 45 seconds after injection, but if the UCA had not fully dispersed or the
rate of injection was varied, the destruction of a large bolus could have affected the
maximum number of pulses allotted to a volume of data.
The results of the 3D CEVI technique have shown potential for utilizing this
technique for future vessel imaging related studies. While there does exist a noticeable
correlation between CEVI and power Doppler, correlation is limited by the inherent flaws
in the power Doppler measurement. The strong enhancement surrounding the power
21
Doppler signal could suggest the UCAs are more sensitive to the microvasculature
surrounding or branching from primary vessels; this attribute has been noticed in
previous reports [25,27]. While this finding needs to be confirmed with histology, it
suggests that power Doppler is underestimating the extent of the vasculature while UCAs
appear to be more sensitive to the vasculature neglected by the power Doppler
measurement.
Multiple filters were applied to the collected data in order to isolate the contrast
enhancement. Intra-slice registration aided in eliminating motion artifacts. Following
the criteria from the reperfusion repeatability study, an intensity based filter was applied
to the data in order to isolate all signal intensity higher than 20% of the maximum in the
final MIP slice. However, during data acquisition a visual estimation of the number of
destruction pulses allotted to one injection was found to be ~ 10 pulses. Only after
quantitative analysis was this value found to be grossly overestimated, so slices imaged
after the maximum number of destruction pulses may have lost significant contrast. This
inherent issue might have increased the amount of signal being filtered during post-
processing. Another filter was applied to eliminate spurious artifacts due to speckle.
UCAs rapidly enhance intensity; so, by eliminating pixels that do not significantly
change over time, other motion or speckle artifacts are removed. Finally, a filter was
applied that isolated groups of enhancing pixels.
Automated rigid registration between the final volume sets provided a voxel by voxel
comparison of the two data sets. However, interpolation between slices as well as errors
during manual incremental stepping in the CEVI technique required adjustment of initial
parameters, making the applied registration semi-automated. Utilizing a motor with a
22
fixed step size in future studies would eliminate registration issues due to errors in
stepping between slices.
While this work demonstrates promising preliminary results, limitations in this study
require future work. Refining methods of isolating the ultrasound contrast signal is
necessary to provide more quantifiable results. Tracking the change in intensity not just
temporally but spatially may provide very specific borders within the microvasculature.
In addition, further studies are needed to validate this technique to other accepted
angiography methods such as MRA or CT. Since UCAs can be targeted to specific
intravascular receptors, this approach could be applied in constructing 3D representations
of receptor distribution to further elucidate other molecular properties of the tumor
involved in cancer progression [26,28].
To the best of our knowledge, the 3D CEVI approach presented here is the first
attempt at a high resolution 3D vessel imaging technique using ultrasound contrast
agents. This method provides a fast and accessible way of determining the progression of
tumor growth or therapeutic efficacy of anti-angiogenic drugs. In addition, this technique
allows ultrasound to become a 3D molecular imaging modality with the use of targeted
ultrasound contrast agents. These advances presented further enable ultrasound to move
from a structural imaging technique to a functional and molecular approach for
quantitative cancer imaging.

23
CHAPTER III
REPEATABILITY OF BLOOD FLOW MODELING USING CONTRAST
ENHANCED SONOGRAPHY
Introduction
The quantification of tissue function has become an important element in assessing
tumor growth and cancer treatment efficacy. As treatments target specific aspects of the
cancer, qualitative evaluation is no longer adequate in determining the value of a
treatment option. For example, methods are needed to assess blood flow and tissue
perfusion for drugs that target the tumor vasculature (i.e., anti-angiogenic treatments).
Contrast agents have been used to exploit functional elements of the tumor milieu such as
blood flow, pH, and matrix metalloprotease (MMP) activity in an array of different
imaging modalities [29-36]. Some parameters, such as blood flow, have been measured
using multiple modalities, including CEUS [17]. Relative to the other methods such as
dynamic contrast enhanced magnetic resonance imaging (DCE-MRI) or contrast
enhanced computed tomography (CT), CEUS presents a fast, cost effective, and safe
option.
While many models exploit the kinetic behavior of UCAs to extract information
about blood flow and vascularity, the model used in this study has been modified to
examine blood flow in high frequency, high resolution CEUS [37]. High resolution
CEUS has a lower signal to noise per voxel due to less UCA within an ROI. Therefore,
TICs obtained from high resolution CEUS tend to be noisy and difficult to fit accurately.

24
Described below is the model used in this study; a more detailed description is available
by Yeh, et al [37].
Adapted from Wei, et al [17], the reperfusion curve can be fit to a mono-exponential
model described previously:
)1)(()( teABAtR β−−−+= , (Equation 4)
where A represents intensity immediately after the destruction pulse (background
intensity), B represents the steady-state intensity after contrast equilibration and β is a rate
constant proportional to contrast velocity. If the image obtained immediately after the
destruction pulse is subtracted from the subsequent reperfusion images,
0=A
so that
)1(*)( teBtR β−−= . (Equation 5)
In order to reduce parametric sensitivity to local noise error, a running average of the
time intensity curve is utilized by integrating both sides and dividing by the time:
Bet
B
t
dRt
t
+−= −∫
)1(
)(0 β
β
ττ (Equation 6)
For each pixel, the integrative TIC (ITIC) can be fit to Equation 6 to form maps of β, B,
and β·B, the latter has been shown to indicate blood flow [17,37]. For multiple
destruction pulses on the same section of tissue, the β maps are expected to be equal until
the UCA is destroyed and intensity returns to baseline. This study presents preliminary
results regarding the repeatability of β measures for approximately five pulses produced
from two separate injections in six mice.

25
Materials and Methods
Data Acquisition
All procedures adhered to our Institution’s Animal Care and Use Committee
guidelines. Eight female mice were injected subcutaneously with 106 67NR breast cancer
cells in the hind limb. Eight days postinjection, they were imaged on a Visualsonics
Vevo 770 (Toronto, Canada) system using a 30 MHz transducer mounted to a 3D motor
on a rail system. Two days prior to imaging, jugular catheters were surgically implanted
for delivery of the contrast agent. During the imaging session, the animals were
anesthetized with a 2%/98% isoflurane/oxygen mixture, and body temperature was
monitored and maintained at 37o C by a warming plate. Heart rate was also monitored
and remained approximately 350 – 400 bpm.
Coupling gel was applied to the area of interest, and 2D B-mode and power Doppler
scout images established a slice of tumor with moderate vascularity. The field of view
varied from 9 mm X 9 mm to 12 mm X 12 mm depending on tumor size, establishing an
in plane pixel size of less than or equal to ~25 µm X 25 µm. Image acquisition began
immediately prior to a 50 µl bolus of Visualsonics Micromarker microbubbles injected
via a jugular catheter. These microbubbles are specifically designed for high frequency
(30 – 45 MHz) ultrasound imaging, and the diameter of the microbubbles range from 2 to
3 µm. Once the 50 µl bolus of Visualsonics Micromarker microbubbles injected reached
steady state (approximately 45 seconds) [11,27], imaging began using the Visualsonics
Contrast mode at a frame rate of 14 frames/second at 50% power (mechanical index
(M.I.) of 0.14) . A 100% power destruction pulse (M.I. of 0.59) was administered, and
images were collected for approximately 15-20 seconds in order to characterize the

26
reperfusion curve. Twelve to eighteen sets of reperfusion images were collected using
multiple destruction pulses over ten minutes. This process was then repeated for each
subject after a 30 minute period of time to allow for clearance of residual contrast agent.
Data Analysis
From a previous study, it was found that approximately four ± two destruction pulses
can be administered before the enhancement due to the UCA becomes insignificant.
Using this finding as a guide, five sets of reperfusion data from each mouse and each
injection were used to examine the repeatability of the parameters produced from
Equation 6. Using the Visualsonics (Toronto, Canada) Vevo 770 software, ROIs were
manually drawn around the entire tumor and TICs were exported to Matlab (The
Mathworks, Natick, MA, USA) for each injection on each mouse. A Matlab algorithm fit
the data to Equation 6 using the command lsqcurvefit. Fit parameters were then
exported to Matlab for statistical analysis.
For each injection for each mouse, B and β were plotted for five destruction pulses.
The five β measurements were averaged for each injection for each subject, and Bland
Altman plots were created using the differences between the averages for each injection
[38].
Results
Plots of both the B and β parameters, as in Figures 7 and 8, reveal significant
variation between subsequent destruction pulses. B appears to rely on the concentration

27
of the UCA in circulation and was not tested for repeatability. However, it is noted that it
follows the general exponential decay of UCA seen in the Figure 3.
The β parameter was plotted and assessed for repeatability, and a Bland Altman plot is
shown in Figure 9.
Number of Destruction Pulses
B V
alues
(ar
bitra
ry u
nits)
Number of Destruction Pulses
B V
alues
(ar
bitra
ry u
nits)
Figure 7. Five B parameters for one mouse with panel a shows the measurements for
injection 1 while panel b plots injection 2. The error bars represent 1 standard deviation.
Number of destruction pulses
βV
alues
(ar
bitra
ry u
nit
s)
Number of destruction pulses
βV
alues
(ar
bitra
ry u
nit
s)
Figure 8. Five β parameters for one mouse with panel a showing the measurements for
injection 1 while panel b plots injection 2. The dotted line represents the mean β value
for the sample while the error bars represent 1 standard deviation of error.
a b
a b

28
The mean difference between the average β for each injection was found to be 0.061 ±
0.2980. The 95% lines of agreement fall on 0.656 and -0.536; thus, differences between
injections for each animal would be expected to fall between these values with 95%
confidence
.
Discussion
Upon initial interrogation into the variation among subsequent fit parameters, it was
concluded that a repeatability assessment of the model must be performed. Theory
regarding the model suggests that the β parameter, proportional to contrast velocity,
Figure 9. Bland Altman plot of the six mice. The dotted line represents the mean
difference between injections on the same animal while the solid lines represent the 95%
confidence interval.
29
should change minimally throughout multiple destruction pulses. Although more
subjects are needed to conclude the threshold for inter-/intra-subject error over repeated
measurements, it is clear by the 95% range in Figure 9 that the β parameter seems to have
a greater fluctuation than anticipated for multiple measurements of the same section of
tissue.
Some of the variation could be due to errors during acquisition. The UCA was
injected via a jugular catheter manually over a 15 second interval and 45 seconds elapsed
until the first destruction in order for the UCA to reach equilibrium in circulation.
However, an automated syringe could have facilitated a more constant infusion rate,
leading to a higher probability of the UCA reaching steady-state after the 45 second
period of time post-injection. If steady state was not reached, a bolus of UCA could have
been problematic when fitting to a model that assumes uniform distribution; thus, false or
incorrect fit parameters could have introduced error in this study. As discussed
previously, contrast-enhanced high frequency ultrasound imaging suffers from a lower
signal to noise ratio (SNR). This lower SNR reflects less CA per voxel because of the
increased spatial resolution. While using a model that eliminates much of the noise by
integrating the signal over time provides better model fits, we can not assume that noise
does not affect the output parameters. Thus, the low SNR could also affect the
discrepancies in parametric repeatability. Tumor vasculature is inherently leaky and
poorly constructed. These physiological variations could contribute to the disparity in
parameter measurements as well.
This study has shown the preliminary findings that suggest poor repeatability of a
clinically accepted method of blood flow modeling. In future studies, six more mice will

30
be incorporated into this study in order to determine a more adequate assessment.
Further analysis will be used to determine the sources for any differences in kinetic
modeling of the tumor microvasculature using high-resolution US imaging.

31
CHAPTER IV
CONCLUSIONS
This thesis has demonstrated a novel technique in monitoring tumor growth and anti-
angiogenic cancer treatments. High resolution contrast enhanced vessel imaging is safe
and cost-effective alternative to other 3D angiography techniques and provides higher
sensitivity about vascularity and perfusion than current ultrasound blood flow measures.
While this technique shows promise, some limitations require additional study.
First and foremost, methods in UCA tracking must be explored. Current filtering
techniques need to be expanded to include a tracking algorithm that will examine both
temporal and spatial changes in image intensity to further determine the UCA patterns.
Developing a technique such as UCA tracking could provide better boundaries for
microvasculature and reduce artifacts from motion.
The development of targeted microbubbles enables ultrasound to provide information
about a region of tissue on a molecular level. For example, by targeting UCAs to VEGF
receptors 1 and 2 (VEGF R1 and VEGF R2), molecular information can be obtained
regarding the distribution of these receptors within tumors. This 2D methodology has
been used to examine the efficacy of antiangiogenic and cytotoxic drugs in pancreatic
cancer mouse models [39-40]. However, by using similar techniques as the 3D CEVI
technique described, 3D molecular imaging can be achieved using ultrasound. 3D
information regarding VEGF receptor distribution could not only provide additional
insight to monitoring tumor growth and cancer treatments, but could also be integrated

32
into multi-parametric studies to assess many aspects of the same tumor over a long period
of time.
In addition, preliminary results from the repeatability study of the commonly used
mono-exponential model show greater change in values than anticipated. While more
subjects are necessary to absolutely conclude the repeatability of this model, these initial
findings allude to re-examination of the model when measuring microvascular blood
flow.
This study has provided a reasonable alternative to other methods of angiography as
well as a potential method for creating 3D representations of endothelial proteins; thus
ultrasound has become a candidate for multi-modal and multi-parametric studies of the
tumor microenvironment.

33
APPENDIX
ADDITIONAL FIGURES
Duration of UCA Enhancement plots for the 7 other subjects.
Figure 10. Time intensity curves from the duration of UCA enhancement study for
Mouse 1. Panel a demonstrates the entire pre- and post-injection TIC with the
highlighted region that was compared in panel b. The linearity seen in panel b depicts
the repeatability of the washout curve.
34
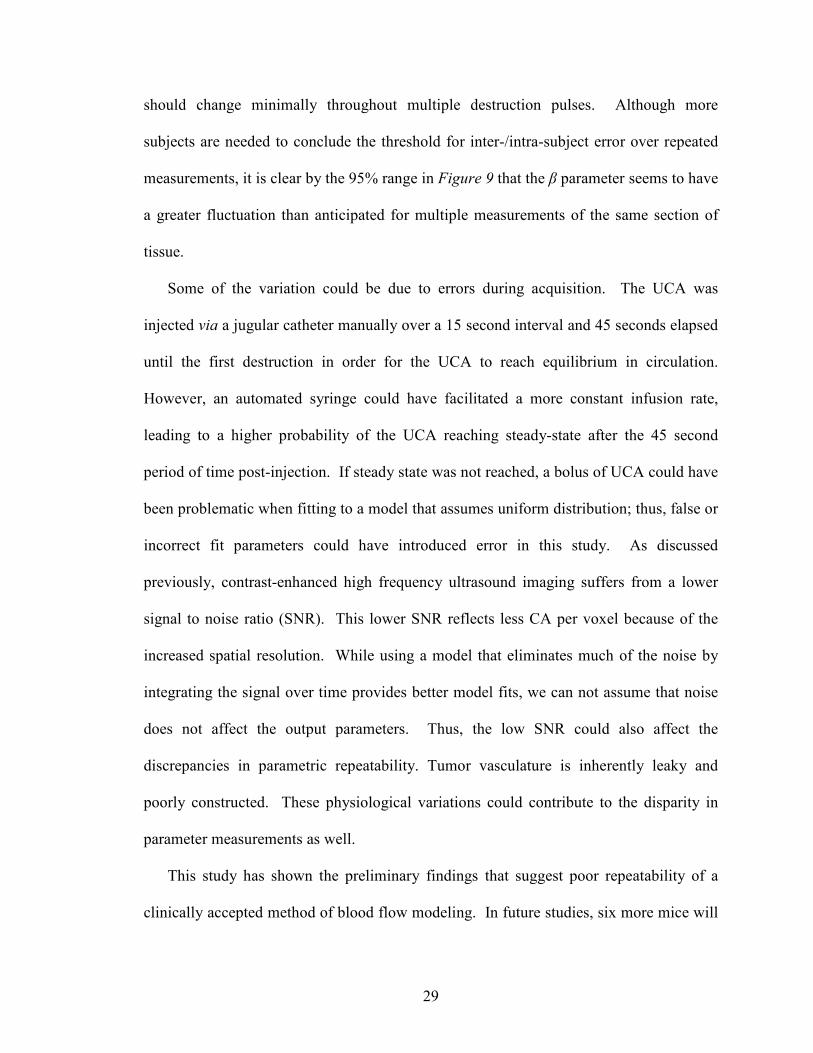
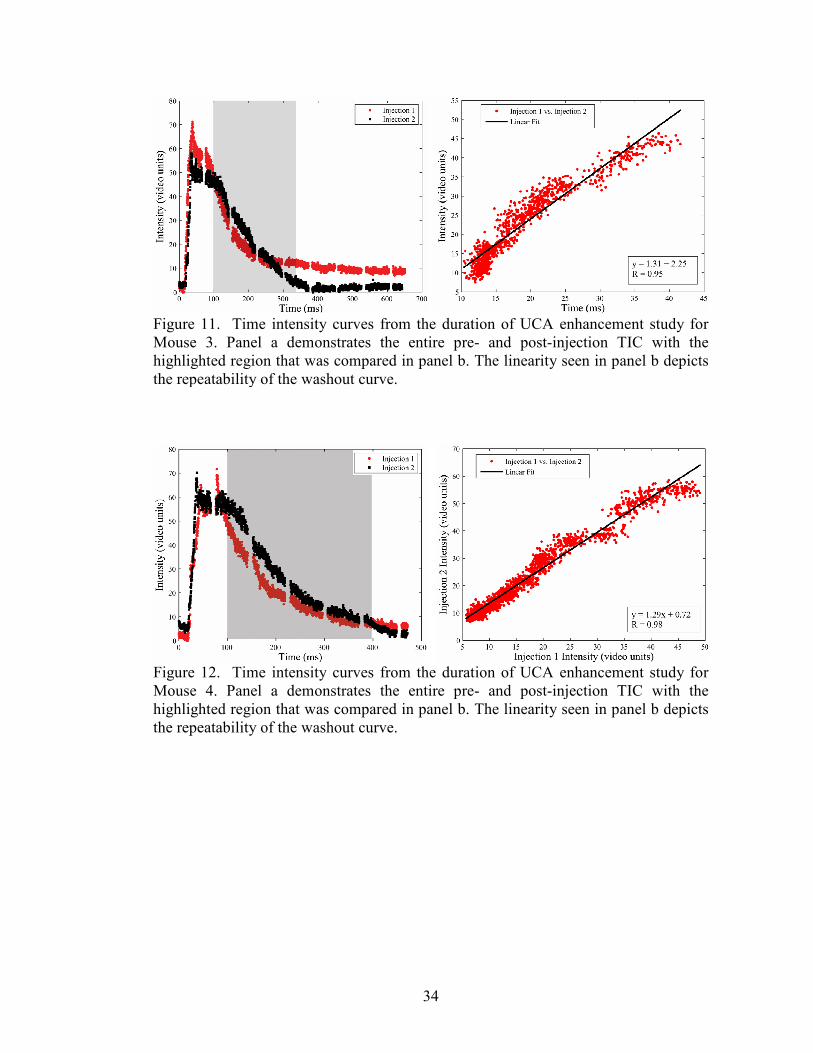
Figure 12. Time intensity curves from the duration of UCA enhancement study for
Mouse 4. Panel a demonstrates the entire pre- and post-injection TIC with the
highlighted region that was compared in panel b. The linearity seen in panel b depicts
the repeatability of the washout curve.
Figure 11. Time intensity curves from the duration of UCA enhancement study for
Mouse 3. Panel a demonstrates the entire pre- and post-injection TIC with the
highlighted region that was compared in panel b. The linearity seen in panel b depicts
the repeatability of the washout curve.

35
Figure 14. Time intensity curves from the duration of UCA enhancement study for
Mouse 6. Panel a demonstrates the entire pre- and post-injection TIC with the
highlighted region that was compared in panel b. The linearity seen in panel b depicts
the repeatability of the washout curve.
Figure 13. Time intensity curves from the duration of UCA enhancement study for
Mouse 5. Panel a demonstrates the entire pre- and post-injection TIC with the
highlighted region that was compared in panel b. The linearity seen in panel b depicts
the repeatability of the washout curve.

36
Figure 16. Time intensity curves from the duration of UCA enhancement study for
Mouse 8. Panel a demonstrates the entire pre- and post-injection TIC with the
highlighted region that was compared in panel b. The linearity seen in panel b depicts
the repeatability of the washout curve.
Figure 15. Time intensity curves from the duration of UCA enhancement study for
Mouse 7. Panel a demonstrates the entire pre- and post-injection TIC with the
highlighted region that was compared in panel b. The linearity seen in panel b depicts
the repeatability of the washout curve.

37
Reperfusion repeatability plots for the 6 other subjects; however, mouse 3 was not used
in study due to the lack of UCA enhancement and the data taken from mouse 4 was
corrupted.
Figure 17. Time intensity curves from the reperfusion repeatability study for Mouse 1.
Multiple destruction pulses were administered followed by imaging of the reperfusion
of the contrast into the field of view. These figures show the intensity of the image
increases after the destruction pulse destroyed all contrast.
Figure 18. Time intensity curves from the reperfusion repeatability study for Mouse 3.
Multiple destruction pulses were administered followed by imaging of the reperfusion
of the contrast into the field of view. These figures show the intensity of the image
increases after the destruction pulse destroyed all contrast.

38
Figure 20. Time intensity curves from the reperfusion repeatability study for Mouse 6.
Multiple destruction pulses were administered followed by imaging of the reperfusion
of the contrast into the field of view. These figures show the intensity of the image
increases after the destruction pulse destroyed all contrast.
Figure 19. Time intensity curves from the reperfusion repeatability study for Mouse 5.

39
Figure 22. Time intensity curves from the reperfusion repeatability study for Mouse 8.
Multiple destruction pulses were administered followed by imaging of the reperfusion
of the contrast into the field of view. These figures show the intensity of the image
increases after the destruction pulse destroyed all contrast.
Figure 21. Time intensity curves from the reperfusion repeatability study for Mouse 7.
Multiple destruction pulses were administered followed by imaging of the reperfusion
of the contrast into the field of view. These figures show the intensity of the image
increases after the destruction pulse destroyed all contrast.

40
Additional plots of the kinetic parameters derived from the blood flow modeling.
Number of Destruction Pulses
βPar
am
eter
Valu
e (a
rbitra
ry u
nits)
Number of Destruction Pulses
βPar
am
eter
Valu
e (a
rbitra
ry u
nits)
Figure 23. Five β measurements for each injection on mice 1-3. Error bars represent 1
standard deviation while the dotted line is the β value.

41
Number of Destruction Pulses
βP
aram
eter
Valu
e (a
rbitra
ry u
nits)
Number of Destruction Pulses
βP
aram
eter
Valu
e (a
rbitra
ry u
nits)
Figure 24. Five β measurements for each injection on mice 4-6. Error bars represent 1
standard deviation while the dotted line is the β value.

42
Number of Destruction Pulses
B P
aram
ete
r V
alu
e (a
rbitra
ry u
nits)
Number of Destruction Pulses
B P
aram
ete
r V
alu
e (a
rbitra
ry u
nits)
Figure 25. Five B measurements for each injection on mice 1-3. Error bars represent 1
standard deviation.

43
Number of Destruction Pulses
B P
aram
eter
Valu
e (a
rbitra
ry u
nits)
Number of Destruction Pulses
B P
aram
eter
Valu
e (a
rbitra
ry u
nits)
Figure 26. Five B measurements for each injection on mice 4-6. Error bars represent 1
standard deviation.

44
REFERENCES
1. King, J Roger. Cancer Biology 2nd
ed. Harlow, England: Prentice Hall, 2000.
2. Hanahan D and RA Weinberg. The hallmarks of cancer. Cell 2000; 100(1): 57–
70.
3. Kerbel R and J Folkman. Clinical translation of angiogenesis inhibitors. Nat Rev
Cancer 2002; 2(10): 727–39.
4. Schlief R. Development in echo-enhancing agents. Clin Radiol 1996; 51(Supple
1): 5-7.
5. Ayida G, P Harris, S Kennedy, M Seif, D Barlow, P Chamberlain.
Hysterosalpingo-contrast sonography (Hy-CoSy) using Echovis-200 in the
outpatient investigation of infertility patients. Br J. Radiol 1996; 69(826): 910-
913.
6. Quay SC. Ultrasound contrast agent development: phast shift colloids. J
Ultrasound Med 1994; 13(Supple): S9.
7. Schneider M, M Arditi, MB Barrau, J Brochot, A Broillet, R Ventrone, F Yan.
BR1: a new ultrasonographic contrast agent based on sulfur hexachloride-filled
microbubbles. Invest Radiol 1995; 30(8): 451-457.
8. Bauer A, Mahler M, et al. Microvascular imaging: results from a phase 1 study of
the novel polmeric contrast agent SHU 563 A. In: Nanda N N, Schlief R, et al
Advances in echo imaging using contrast enhancement, 2nd
edn. Lancaster,
England: Kluwer; 1997:39-64.
9. J Bushberg, JA Seibert, EM Leidholdt Jr., JM Boone. The Essential Physics of
Medical Imaging 2nd
ed. Philedelphia, PA: Lippincott Williams & Wilkins: 2002.
10. McCulloch M, C Gresser, S Moos, J Odabashian, S Jaspar, J Bednarz P Burgess,
D Carney, V Moore, E Sisk, A Waggoner, S Witt, D Adams. Ultrasound Contrast
Physics: A Series on Contrast Echocardiography, Article 3. J of Am S of
Echocard 2000; 13(10): 959-967.
11. Harvey CJ, MJ Blomley, RJ Eckersley, DO Cosgrove. Developments in
ultrasound contrast media. Eur Radiol. 2001; 11(4): 675–689.
12. Schwarz KQ, GP Bezante, X Chen, D Phillips, R Schlief. Hemodynamic effects of
microbubble echo contrast. J Am Soc Echocardiogr 1996; 9(6): 795–804.

45
13. Skyba DM, G Camarano, NC Goodman, RJ Price, TC Skalak, S Kaul.
Hemodynamic characteristics, myocardial kinetics and microvascular rheology of
FS-069, a second-generation echocardiographic contrast agent capable of
producing myocardial opacification from a venous injection. J Am Coll Cardiol
1996; 28(1): 1292–1300.
14. Cosgrove D, R Eckersley, M Blomley, C Harvey. Quantification of blood flow.
Eur Radiol 2001; 11(8): 1338-1344.
15. Yeh CK, MJ Yang, PC Li. Contrast-specific ultrasonic flow measurements based
on both input and output time intensities. Ultrasound Med Biol 2003; 29(5): 671–
678.
16. Krix M, F Kiessling, S Vosseler, I Kiessling, M Le-Huu, NE Fusenig, S Delorme.
Comparison of intermittent-bolus contrast imaging with conventional power
Doppler sonography: quantification of tumour perfusion in small animals.
Ultrasound Med Biol 2003; 29(8): 1093–1103.
17. Wei K, AR Jayaweera, S Firoozan, A Linka, DM Skyba, S Kaul. Quantification
of myocardial blood flow with ultrasound-induced destruction of microbubbles
administered as a constant venous infusion. Circ. 1998; 97(5): 473-483.
18. Blomley MJ, T Albrecht, DO Cosgrove, JC Bamber. Can relative contrast agent
concentration be measured in vivo with color Doppler US? letter on Can relative
contrast agent concentration be measured in vivo with color Doppler US?
Radiology 1997; 204(1): 279-281.
19. Kiessling F, S Greschus, MP Lichy, M Bock, C Fink, S Vosseler, J Moll, MM
Mueller, NE Fusenig, H Traupe, W Semmler. Volumetric computed tomography
(VCT): a new technology for noninvasive, high-resolution monitoring of tumor
angiogenesis. Nat Med 2004; 10(10): 1133-8.
20. Evans DH,WN McDicken, R Skidmore, TP Woodcock. Doppler Ultrasound:
Physics, Instrumentation and Clinical Applications 2nd
ed. Chichester, England:
John Wiley & Sons; 1989.
21. Lindner JR, PA Dayton, MP Coggins, K Ley, J Song, K Ferrara, S Kaul.
Noninvasive imaging of inflammation by ultrasound detection of phagocytosed
microbubbles. Circ. 2000; 102(5): 531-8.
22. O Lucidarme, Y Kono, J Corbeil, SH Choi, JL Golmard, J Varner, RF Mattrey.
Angiogenesis: Noninvasive quantitative assessment with contrast-enhanced
functional US in murine model. Radiology 2006; 239(3): 730 – 739.

46
23. Maes F, A Collignon, D Vandermeulen, G Marchal, P Suetens. Multimodality
image registration by maximization of mutual information. IEEE Trans Med
Imaging 1997; 16(2): 187-198.
24. Li R. Automatic placement of regions of interest in medical images using image
registration, MS Thesis, Vanderbilt Univeristy, 2001.
25. Cosgrove, D. Angiogenesis Imaging – Ultrasound. The British Journal of
Radiology 2003; 76(1): S43-S49.
26. Leong-Poi H, J Christiansen, AL Klibanov, S Kaul, JR Lindner. Noninvasive
assessment of angiogenesis by ultrasound and microbubbles targeted to α(v)-
integrins. Circ. 2003; 107(3): 455-60.
27. Lagalla R, G Caruso, R Urso, G Bizzini, L Marasa, V Miceli. The correlation
between color Doppler using a contrast medium and the neoangiogenesis of small
prostatic carcinomas. Radiol Med 200; 99(4): 270-275.
28. Bloch SH, PA Dayton, KW Ferrara. Targeted imaging using ultrasound contrast
agents. IEEE Engineering in Medicine and Biology 2004; 23(5): 18-29.
29. Tofts PS. Modeling tracer kinetics in dynamic Gd-DTPA MR imaging. J. Magn.
Reson. Imag. 1997; 7(1): 91–101.
30. Parker GJ, PS Tofts. Pharmacokinetic analysis of neoplasms using contrast-
enhanced dynamic magnetic resonance imaging. Top.Magn. Reson. Imag. 1999;
10(2): 130–142.
31. Kruse DE, RH Silverman, RJ Fornaris, DJ Coleman, KW Ferrara, A swept-
scanning mode for estimation of blood velocity in the microvasculature. IEEE
Trans. Ultrason. Ferroelect. Freq. Contr. 1998; 45: 1437–1440.
32. Goertz DE, DA Christopher, JL Yu, RS Kerbel, PN Burns, FS Foster, High-
frequency color flow imaging of the microcirculation. Ultrasound. Med. Biol.
2000; 26(1): 63–71.
33. Gillies RJ, N Raghunand, GS Karczmar, ZM Bhujwalla. MRI of the tumor
microenvironment. J Magn Reson Imaging 2002; 16(4): 430-50.
34. Mikawa M, N Miwa, M Brautigam, T Akaike, A Maruyama. Gd(3+)-loaded
polyion complex for pH depiction with magnetic resonance imaging. J Biomed
Mater Res 2000; 49(3): 390–395.
35. Zhang S, K Wu, AD Sherry. A novel pH-Sensitive MRI contrast agent.
Angewandte Chemie Int Ed 1999; 38(21): 3192–3194.

47
36. Li WP and CJ Anderson. Imaging matrix metalloproteinase expression in tumors.
Q. J. Nucl. Med 2003; 47: 201–208.
37. Yeh CK, KW Ferrara, DE Kruse. High-resolution functional vascular assessment
with ultrasound. IEEE Trans Med Imaging 2004; 23(10): 1263-75.
38. Bland JM, DG Altman. Statistical methods for assessing agreement between two
methods of clinical measurement. Lancet 1986; 307-310.
39. Marret H, S Sauget, B Giraudeau, M Brewer, J Ranger-Moore, G Body, F
Tranquart. Contrast-enhanced sonography helps in discrimination of benign from
malignant adnexal masses. J Ultrasound Med 2004; 23(12): 1629-1639.
40. Korpanty G, JG Carbon, PA Grayburn, JB Fleming, RA Brekken. Monitoring
response to anticancer therapy by targeting microbubbles to tumor vasculature.
Clin Cancer Res 2007; 13(1): 323-330.


![BIBLIOGRAPHY Archival Sources Archivo Dominicano [BogotÆ]etd.library.vanderbilt.edu/ETD-db/available/etd-07222005-085639/... · BIBLIOGRAPHY Archival Sources Archivo Dominicano](https://img.pdfslide.net/doc/110x75/5ae447c37f8b9a0d7d8ecc85/bibliography-archival-sources-archivo-dominicano-bogotetd-archival-sources-archivo.jpg)