Embed Size (px)
Citation preview

High-Rise Building Fires
November 2016
Marty Ahrens
©November 2016 National Fire Protection Association

Abstract
In 2009-2013, U.S. fire departments responded to an estimated average of 14,500
reported structure fires in high-rise buildings per year. These fires caused an average of
40 civilian deaths, 520 civilian injuries, and $154 million in direct property damage per
year. Five property classes account for almost three-quarters of high-rise fires: apartment
buildings or multi-family housing, hotels, dormitories, office buildings, and facilities that
care for the sick. Automatic fire protection equipment and fire-resistive construction are
more common in high-rise buildings that have fires than in other buildings of the same
property use that have fires. The fire death rate per 1,000 fires and average loss per fire
tend to be lower in high-rise buildings than in shorter buildings of the same property use.
Keywords: fire statistics, high-rise, apartments, care of sick, office, hotel, fire
protection, hospital, clinic, doctor’s office, dormitory
Acknowledgements
The National Fire Protection Association thanks all the fire departments and state fire
authorities who participate in the National Fire Incident Reporting System (NFIRS)
and the annual NFPA fire experience survey. These firefighters are the original
sources of the detailed data that make this analysis possible. Their contributions allow
us to estimate the size of the fire problem.
We are also grateful to the U.S. Fire Administration for its work in developing,
coordinating, and maintaining NFIRS.
For more information about the National Fire Protection Association, visit www.nfpa.org
or call 617-770-3000. To learn more about the One-Stop Data Shop go to
www.nfpa.org/osds or call 617-984-7451.
Copies of this report are available from:
National Fire Protection Association
One-Stop Data Shop
1 Batterymarch Park
Quincy, MA 02169-7471
www.nfpa.org
e-mail: [email protected]
phone: 617-984-7461
NFPA No. USS30
Copyright © 2016, National Fire Protection Association, Quincy, MA

High-Rise Building Fires, 11/16 i NFPA Fire Analysis & Research, Quincy, MA
Table of Contents
Page
Table of Contents i
List of Tables and Figures ii
U.S. High-Rise Building Fires Fact Sheet iv
High-Rise Building Fires Overview 1
Appendix A – Deadliest High-Rise Building Fires in History 25
Appendix B – How National Estimates Statistics Are Calculated 26
Appendix C – Methodology and Definitions Used in “Leading Cause” Tables 31

High-Rise Building Fires, 11/16 ii NFPA Fire Analysis & Research, Quincy, MA
List of Tables and Figures
Figure 1. High-rise fires by occupancy 2
Figure 2. Percent of high-rise fires and losses by occupancy 2
Figure 3. High-rise fires starting on the 7 floor or higher th 2
Figure 4. High-rise building fires by level of origin 3 A. Apartments or other multi-family housing 3
B. Hotels or motels 3
C. Dormitories 3
D. Office buildings 3
E. Care of sick 3
Figure 5. Top five areas of origin in high-rise fires and their share in shorter 3
building fires A. Apartments or other multi-family housing 3
B. Hotels or motels 3
C. Dormitories 4
D. Office Buildings 4
E. Facilities that care for the sick 4
Figure 6. Leading causes of high-rise fires and their share in shorter building fires 5 A. Apartments of other multi-family housing 5
B. Hotels or motels 5
C. Dormitories 5
D. Office buildings 5
E. Facilities that care for the sick 5
Figure 7. Fire spread beyond the room and floor of origin 6 A. Beyond room of origin 6
B. Beyond floor of origin 6
Figure 8. Presence of fire protection in fires 6 A. Fire detection 6
B. Wet pipe sprinklers, excluding buildings under construction and partial systems 6
Figure 9. Presence of fire-resistive construction in fires 7

High-Rise Building Fires, 11/16 iii NFPA Fire Analysis & Research, Quincy, MA
List of Tables and Figures (Continued)
Table 1. High-rise fires by occupancy 8
Table 2. Percentage of fires and fire losses in the five occupancies in high-rise buildings 8
Table 3. Risk of fire casualty per thousand reported fires and average loss per fire 9 A. High-Rise Buildings 9
B. Buildings that Were Not High-Rise 9
Table 4. Fires in selected properties, by number of stories above ground 10 A. Apartments or other multi-family housing 10
B. Hotels or motels 11
C. Dormitories 12
D. Office buildings 13
E. Facilities that care for the sick 14
Table 5. High-rise and shorter building fires, by leading areas of origin 15 A. Apartments or other multi-family housing 15
B. Hotels or motels 16
C. Dormitories 17
D. Offices 18
E. Facilities that care for the sick 19
Table 6. High-rise and shorter building fires, by leading causes 20 A. Apartments or other multi-family housing 20
B. Hotels 21
C. Dormitories 22
D. Offices 23
E. Facilities that care for the sick 24

High-Rise Building Fires, 11/16 iv NFPA Fire Analysis & Research, Quincy, MA
U.S. HIGH-RISE BUILDING FIRES FACT SHEET
In 2009-2013, U.S. fire departments responded to an average of 14,500 structure fires per year in high-rise buildings.1 These fires caused an annual average of:
40 civilian fire deaths
520 civilian fire injuries
$154 million in direct property damage
Five property use groups account for almost three-quarters (73%) of high-rise fires:
Apartments or other multi-family housing (62% of all high-rise fires)
Hotels (4% of high-rise fires)
Dormitories (4% of high-rise fires)
Offices (2% of high-rise fires)
Facilities that care for the sick (2% of high-rise fires) Most of the remaining fires occurred in mixed-use residential or office buildings (such as restaurants, stores, and parking garages) or probable miscodes of properties that cannot be high-rise (such as one- or two-family homes and sheds).
The fire death rate per 1,000 fires and the average loss per fire are generally lower in high-rise buildings than in other buildings of the same property use.
High-rise buildings have lower percentages of fires with flame damage beyond room of origin, providing further evidence of impact from fire protection systems and features:
Apartments (4% of high-rise fires vs. 10% in shorter buildings)
Hotels (4% of high-rise fires vs. 11% in shorter buildings)
Dormitories (2% of high-rise vs. 1% in shorter buildings)
Offices (10% of high-rise fires vs. 21% in shorter buildings)
Facilities that care for the sick (4% of high-rise fires vs. 9% in shorter buildings)
High-rise buildings are more likely than shorter building to have fire-resistive construction and wet pipe sprinklers. These types of protection help prevent fire spread.
1 “High-rise” is defined here as 7 stories above grade. This is roughly consistent with the Life Safety Code definition
of high rise as 75 feet (23 meters) in height, measured from the lowest level of fire department vehicle access to the floor of the highest occupiable story.
22%
10%
23%
12%
6%
33%
32%
52%
48%
50%
0% 10% 20% 30% 40% 50% 60%
Care of sick facilities
Offices
Dormitories
Hotels
Apartments
Presence of Fire-Resistive Construction in Fires, 1994-1998
High-riseNot high-rise
61%
28%
45%
49%
15%
80%
52%
61%
62%
42%
0% 20% 40% 60% 80% 100%
Care of sick facilities
Offices
Dormitories
Hotels
Apartments
Presence of Wet-Pipe Sprinklers in Fires Excluding Partial Systems and
Buildings Under Construction, 2009-2013
High-rise
Not high-rise

High-Rise Building Fires, 11/16 1 NFPA Fire Analysis & Research, Quincy, MA
High-Rise Building Fires
When American adults think of high-rise fires, we often think first of the September 11, 2001
terrorist attacks on New York City’s iconic World Trade Center, the deadliest high-rise fire in
world history. As part of a terrorist attack, two hijacked airplanes flew into the 110 story towers,
setting them on fire and compromising the towers’ structural integrity. The fires and ensuing
building collapses killed 2,666 civilians and firefighters. The 157 passengers and crew on the
airplanes also perished.2
The second deadliest U.S. high-rise fire, and the third deadliest in the world, also resulted from
terrorism, in this case domestic terrorism. On April 19, 1995, a bomb in a rented truck exploded
outside a nine-story federal office building in Oklahoma City, Oklahoma. The blast and ensuing
fire killed 169 people. See Appendix A for a list of the ten deadliest high rise fires in history.
While these tragic events are etched in our memory, high-rise buildings are more likely to
have fire protection that makes them safer than other buildings in the event of fire. This
analysis focuses on the causes and circumstances of high-rise building fires compared to shorter
buildings. The estimates in this report were derived from the U.S. Fire Administration’s National
Fire Incident Reporting System (NFIRS) and NFPA’s annual fire experience survey. In this
analysis, any structure (NFIRS incident type codes 110-123) with seven stories or more above
ground is considered high-rise. Shorter, non-high-rise buildings have one to six stories above
ground. Stories below ground were not included in these definitions. Fires in which the number
of stories above ground were coded as zero, or more than 100, were considered to have unknown
data. Unknowns were allocated proportionally. Only fires reported to local fire departments are
included. See Appendix B for a description of the methodology used.
In 2009-2013, U.S. fire departments responded to an estimated average of 14,500 reported
structure fires in high-rise buildings per year. These fires caused an average of 40 civilian
deaths, 520 civilian injuries, and $154 million in direct property damage per year. Three percent
of structure fires reported in 2009-2013 occurred in high-rise buildings. In this analysis,
structures are considered high-rise if they have at least seven stories above grade.
Five property classes account for three-quarters (73%) of high-rise fires: apartments or
other multi-family housing, hotels, dormitories or dormitory-type properties, offices, and
facilities that care for the sick. Some property uses – such as stores, restaurants or one- or two-
family homes – may represent only a single floor or part of a floor in a tall building primarily
devoted to other uses. Some property uses – such as grain elevators and factories – can be as tall
as a high-rise building even though they do not have a large number of separate floors or stories.
This report focuses on the five property classes mentioned above. In these five property classes
combined, an average of 10,600 high-rise structure fires were reported per year during 2009-
2013. These fires caused an average of 27 civilian deaths (65% of high-rise fire deaths), 418
civilian injuries (81%), and $54 million (35%) in direct property damage per year. These five
2 Robert S. McCarthy. Catastrophic Multiple-Death Fires in the United States – 2001, Quincy, MA: NFPA, 2002,
p. 19.

High-Rise Building Fires, 11/16 2 NFPA Fire Analysis & Research, Quincy, MA
property classes are the focus of this analysis. In this report, the term “apartment” also includes
other multi-family housing.
Figure 1 shows the average number of high-
rise fires in these properties per year during
2009-2013. More than three out of five (62%)
high-rise fires occurred in apartments or other
multi-family housing. Hotels and dormitories
or related properties each accounted for 4%,
and office buildings and facilities that care for
the sick each accounted for 2%. Table 1 also
shows the average civilian deaths, civilian
injuries, and direct property damage per year
from these fires.
Figure 2 shows that 15% of hotel fires occurred
in high-rise buildings, as did 14% of the fires in
facilities that care for the sick, 13% of
dormitory fires, 9% of office building fires, and
8% of fires in apartments or multi-family
homes. Table 2 also shows the percent of
casualties and property damage from high-rise
fires in each of the five property classes.
Table 3 shows that the risk of fire death per 1,000 fires was lower in high-rise buildings
overall and in four of the five specific property groups. Average direct property damage loss
per fire was lower in high-rise buildings overall and in all five property groups than in
comparable lower-rise buildings. Hotels were the only occupancy of the five studied to have a
lower fire injury rate in high-rise buildings than in shorter properties.
Most high-rise building fires begin on floors no
higher than the 6th story. Figure 3 and Table 4
show that 47% of dormitory high-rise fires began
on the 7th floor or higher, as did 41% of the
apartment high-rise fires, 35% of the office
building high-rise fires, 31% of the hotel high-rise
fires, and 19% of the high-rise fires in facilities
that care for the sick.
Ten percent of hotel and office building high-rise fires actually started below grade. Figure 4
shows a general breakdown of level of origin for the five different occupancies. Hotels, office
buildings and facilities that care for the sick often have restaurants or cafeterias, small stores and
other types of activities on the first floor. This may explain the higher percentages (25-35%)
occurring on the first floor in these properties. Only 5% of the high-rise dormitory fires and 13%
of the high-rise apartment fires began on the first floor.
260
290
510
540
8,970
0 2,000 4,000 6,000 8,000 10,000
Care of sick
Office
Dormitories
Hotels
Apartments
Figure 1. High-rise fires by occupancy2009-2013 annual averages
18%
35%
47%
29%
41%
0% 10% 20% 30% 40% 50%
Care of sick
Office
Dormitories
Hotels
Apartments
Figure 3. High-rise fires starting
on the 7th floor or higher: 2009-2013
14%
9%
13%
15%
8%
0% 5% 10% 15% 20%
Care of sick
Office
Dormitories
Hotels
Apartments
Figure 2. Percent of high-rise fires and
losses by occupancy: 2009-2013

High-Rise Building Fires, 11/16 3 NFPA Fire Analysis & Research, Quincy, MA
Figure 4. High-Rise Building Fires by Level of Fire Origin 2009-2013
A. Apartments B. Hotels or motels C. Dormitories
D. Office buildings E. Care of sick
The kitchen or cooking area was the leading area of origin in all five occupancies,
regardless of height. Figure 5 and Table 5 show that roughly two-thirds to three quarters of fires
in apartments or other multi-family homes or in dormitory-type properties started in the kitchen
or cooking area. All means of egress are grouped together in the figures but listed separately in
Table 5.
Figure 5.
Top five areas of origin in high-rise fires and their share in shorter building fires 2009-2013
A. Apartments or other multi-family B. Hotels or motels
7th floor or higher, 41%
Below grade, 3%
1st floor, 13%
2nd to 6th floor, 43%
7th floor or higher, 29%
Below grade, 10%
1st floor, 31%
2nd to 6th floor, 31% 7th floor or
higher, 47%
Below grade, 6%
1st floor, 5%
2nd to 6th floor, 42%
7th floor or higher, 35%
Below grade, 10%
1st floor, 25%
2nd to 6th floor, 31%
7th floor or higher, 18%
Below grade, 8%
1st floor, 35%
2nd to 6th
floor, 39%
2%
3%
5%
1%
70%
3%
3%
3%
5%
76%
0% 20% 40% 60% 80%
Living room
All means of egress
Bedroom
Trash chute, area orcontainer
Kitchen or cookingarea
High-rise
Not high-rise
1%
4%
13%
7%
42%
4%
7%
7%
8%
40%
0% 10% 20% 30% 40% 50%
Trash chute, area orcontainer
All means of egress
Bedroom
Laundry room
Kitchen or cookingarea
High-riseNot high-rise

High-Rise Building Fires, 11/16 4 NFPA Fire Analysis & Research, Quincy, MA
Figure 5. Top five areas of origin in high-rise fires and their share in shorter building fires
2009-2013 (Continued)
C. Dormitories D. Office buildings
E. Facilities that care for the sick
Certain types of areas, such as machinery
rooms; trash chutes, areas or containers; and
service or equipment areas are more frequent
areas of origin in high-rise buildings. It is
possible that shorter buildings have a smaller
share of their area devoted exclusively to these
functions.
Means of egress fires tended to account for a
slightly larger share of fires in high-rise
buildings. This was not true for office
buildings.
Cooking equipment was the leading cause of fires in both high-rise and shorter buildings in
all of the occupancies studied. Figure 6 and Table 6 show that building height makes little
difference in the causes that have a strong human component, such as cooking, smoking
materials, and intentional. Heating equipment was a less common cause of fires in high-rise
buildings than in shorter buildings. High-rise buildings are more likely to have centrally
controlled and maintained heating systems. The leading causes were derived from details
collected in several data elements. See Appendix C for a description of how these causes were
calculated.
4%
2%
3%
9%
69%
4%
4%
6%
7%
65%
0% 20% 40% 60% 80%
Bathroom
Common room, livingroom or lounge
Alll means of egress
Bedroom
Kitchen or cookingarea
High-riseNot high-rise
2%
2%
4%
6%
39%
3%
4%
5%
6%
39%
0% 10% 20% 30% 40%
Bedroom or patientroom
Common room, loungeor living room
All means of egress
Bathroom or lockerroom
Kitchen or cooking area
High riseNot high-rise
6%
2%
0%
13%
22%
4%
6%
9%
12%
31%
0% 10% 20% 30% 40%
All means of egress
Unclassifiedequipment area
Machinery room orarea
Office
Kitchen or cookingarea
High-riseNot high-rise
High-Rise Building Fires, 11/16 5 NFPA Fire Analysis & Research, Quincy, MA
Figure 6. Leading causes of high-rise fires and their share in shorter building fires
2009-2013
A. Apartments or other multi-family B. Hotels or motels
C. Dormitories D. Office buildings
E. Facilities that care for the sick
3%
6%
5%
6%
72%
2%
3%
3%
7%
75%
0% 20% 40% 60% 80%
Electrical dist orlighting
Heating equipment
Intentional
Smoking materials
Cooking equipment
High-rise
Not high-rise
5%
10%
8%
7%
8%
8%
48%
3%
4%
4%
6%
7%
10%
45%
0% 10% 20% 30% 40% 50%
Air conditioner or fan
Heating equipment
Intentional
Electrical dist or lighting
Clothes dryer or washer
Smoking materials
Cooking equipment
High-rise
Not high-rise
1%
3%
5%
76%
4%
6%
8%
73%
0% 20% 40% 60% 80%
Candles
Smoking materials
Intentional
Cooking equipment
High-rise
Not high-rise
1%
9%
8%
46%
3%
7%
9%
51%
0% 20% 40% 60%
Electronic, office orentertainment
equipment
Electrical dist or lighting
Intentional
Cooking equipment
High-rise
Not high-rise
8%
9%
9%
11%
14%
26%
4%
5%
7%
7%
15%
36%
0% 10% 20% 30% 40%
Air conditioner or fan
Smoking materials
Intentional
Heating equipment
Electrical dist or lighting
Cooking equipment
High-rise
Not high-rise

High-Rise Building Fires, 11/16 6 NFPA Fire Analysis & Research, Quincy, MA
Fires in high-rise buildings are less likely to spread beyond the room and floor of origin
than were fires in shorter buildings. Figure 7 shows that the fire was roughly twice as likely to
spread beyond the room of origin in shorter buildings and two to four times as likely to spread
beyond the floor of origin in non-high-rise buildings as in high-rise buildings. The fire was more
likely to spread in office buildings than in other occupancies.
Figure 7.
Fire spread beyond the room and floor of origin 2009-2013
A. Beyond room of origin. B. Beyond floor of origin
The usage of wet pipe sprinklers and fire detection equipment is higher in high-rise
buildings than in other buildings, for each property use group. Figure 8 shows that the vast
majority of properties had some type of fire detection, with office buildings having the smallest
percentages, 68% and 88%, of shorter buildings and high-rise buildings, respectively.
Figure 8.
Presence of fire protection in fires 2009-2013
A. Fire detection. B. Wet pipe sprinklers, excluding buildings under construction and partial systems
Wet pipe sprinkler protection was much less common than fire detection. Figure 8 shows
that facilities that care for the sick were most likely to have this protection in buildings of all
heights. Excluding properties under construction and those with only partial systems, wet pipe
systems were present in 61% the shorter facilities and 81% of the high-rise facilities.
89%
68%
98%
90%
87%
94%
88%
99%
93%
92%
0% 20% 40% 60% 80% 100%
Care of sick
Office
Dormitories
Hotels or motels
Apartments
61%
28%
45%
49%
15%
81%
52%
61%
62%
42%
0% 20% 40% 60% 80% 100%
Care of sick
Office
Dormitories
Hotels ormotels
Apartments High-riseNot high-rise
9%
21%
2%
11%
10%
4%
10%
1%
4%
4%
0% 5% 10% 15% 20% 25%
Care of sick
Office
Dormitories
Hotels or motels
Apartments High-riseNot high-rise
6%
17%
1%
8%
7%
1%
5%
1%
2%
2%
0% 5% 10% 15% 20% 25%
Care of sick
Office
Dormitories
Hotels or motels
Apartments High-rise
Not high-rise

High-Rise Building Fires, 11/16 7 NFPA Fire Analysis & Research, Quincy, MA
Although high-rise apartments or multi-family housing were almost three times as likely to have
wet pipe sprinklers as shorter buildings (42% vs. 15%), they were the least likely of the five
high-rise occupancies to have sprinklers.
Fire-resistive construction is also more common in high-rise buildings. Fire-resistive
construction is either concrete or fire-resistant covered steel construction. It is designed to keep a
fire from burning through it in less than two hours. Earlier versions of NFIRS captured the
building’s type of construction. This data element was dropped from Version 5.0 of NFIRS.
Consequently, our most recent data on the subject is for the five-year period of 1994-1998.
Figure 9 shows that roughly half of the high-
rise building fires in apartments, hotels, or
dormitories had fire-resistive construction,
compared to 6%, 12%, and 23% of the fires
in shorter buildings in the same three
occupancies. One-third of the high-rise fires
in office buildings and facilities that care for
the sick were in fire-resistive properties
compared to 10% and 22% in the
corresponding non-high-rise buildings.
Because high-rise buildings tend to have more occupants and a longer distance to the exit
discharge, fire prevention and fire protection are essential. Great strides have been made in
ensuring that the residential properties have fire detection. High-rise buildings are also much
more likely to have wet pipe sprinklers and fire-resistive construction. The importance of these
measures is seen in the lower overall fire death rate and average loss per fire and in the fact that
fires in high rise buildings are much less likely to spread beyond the room or floor of origin.
Even so, too many fires are occurring in high-rise properties without sprinklers. Retrofitting
these properties will make them safer. NFPA 101®, Life Safety Code®, details fire protection
requirements for the different occupancies for new and existing high-rise buildings. Despite the
best efforts at fire prevention, a fire will occasionally start. The early warning from smoke
detectors, automatic fire sprinklers that can control a fire and other building features are
necessary to ensure that these fires stay small and building occupants are safe.
Most of us are not responsible for the design, construction or code enforcement in a high-rise
building. See NFPA’s additional resources about high-rise fire safety for the public to learn how
to plan for a high-rise evacuation or read about fires that occurred in high-rise properties.
22%
10%
23%
12%
6%
33%
32%
52%
48%
50%
0% 20% 40% 60%
Care of sick
Offices
Dormitories
Hotels or motels
Apartments
Figure 9. Presence of fire-resistive
construction in fires, 1994-1998
High-riseNot high-rise

High-Rise Building Fires, 11/16 8 NFPA Fire Analysis & Research, Quincy, MA
Table 1. High-Rise Fires by Occupancy
2009-2013 Annual Averages
Occupancy Fires
Civilian
Deaths
Civilian
Injuries
Direct Property
Damage (in Millions)
Apartment or other
multi-family housing 8,970 (62%) 26 (64%) 387 (75%) $39 (25%)
Hotel 540 (4%) 0 (0%) 11 (2%) $7 (4%)
Dormitory 510 (4%) 0 (1%) 7 (1%) $1 (0%)
Office building 290 (2%) 0 (0%) 6 (1%) $6 (4%)
Care of the sick 260 (2%) 0 (0%) 7 (1%) $2 (1%)
Subtotal 10,570 (73%) 27 (65%) 418 (81%) $54 (35%)
All other occupancies 3,970 (27%) 14 (35%) 100 (19%) $100 (65%)
Total 14,540 (100%) 41 (100%) 518 (100%) $154 (100%)
Note: These are fires reported to U.S. municipal fire departments and so exclude fires reported only to Federal or state agencies
or industrial fire brigades. Estimates include proportional shares of fire with number of stories above ground coded as unknown,
blank, zero, less than zero or greater than 100. Fires are rounded to the nearest ten, civilian deaths and injuries to the nearest one,
and direct property damage to the nearest million dollars without adjustment for inflation. Estimates of deaths, injuries, or
property damage can be significantly affected by the inclusion or exclusion of one unusually serious fire. Sums may not equal
totals due to rounding errors.
Source: NFIRS and NFPA Fire Experience Survey.
Table 2. Percentage of Fires and Fire Losses in the Five Occupancies
in High-Rise Buildings 2009-2013
Occupancy Fires
Civilian
Deaths
Civilian
Injuries
Direct Property
Damage
Apartment or other
multi-family housing 8% 7% 9% 3%
Hotel 15% 0% 10% 8%
Dormitory 13% 33% 23% 5%
Office building 9% 0% 15% 6%
Care of the sick 14% 0% 15% 7%
Note: Percentages were calculated by dividing the total reported structure fires in each occupancy by the reported high-rise fires
in these occupancies. These are fires reported to U.S. municipal fire departments and so exclude fires reported only to Federal or
state agencies or industrial fire brigades. Estimates include proportional shares of fire with number of stories above ground coded
as unknown, blank, zero, less than zero or greater than 100. Estimates of deaths, injuries, or property damage can be significantly
affected by the inclusion or exclusion of one unusually serious fire.
Source: NFIRS and NFPA Fire Experience Survey.

High-Rise Building Fires, 11/16 9 NFPA Fire Analysis & Research, Quincy, MA
Table 3.
Risk of Fire Casualty per Thousand Reported Fires and Average Loss per Fire
2009-2013 Annual Averages
A. High-Rise Buildings
Occupancy
Civilian Deaths per
1,000 Fires
Civilian
Injuries per
1,000 Fires
Average Loss
per Fire
Apartment or other multi-family
housing 2.9 43.1 $4,300
Hotel 0.0 20.9 $12,600
Dormitory 0.7 14.3 $1,300
Office building 0.0 19.3 $19,800
Care of the sick 0.0 25.0 $8,800
Average of the five occupancy
groups 2.5 39.5 $5,100
Note: These are fires reported to U.S. municipal fire departments and so exclude fires reported only to Federal or state agencies
or industrial fire brigades. Average loss per fire is rounded to the nearest hundred dollars and not adjusted for inflation. Estimates
of deaths, injuries, or property damage can be significantly affected by the inclusion or exclusion of one unusually serious fire.
Source: NFIRS and NFPA Fire Experience Survey.
Table 3.
Risk of Fire Casualty per Thousand Reported Fires and Average Loss per Fire
2009-2013 Annual Averages
B. Buildings that Were Not High-Rise
Occupancy
Civilian Deaths
per 1,000 Fires
Civilian Injuries
per 1,000 Fires
Average loss
per fire
Apartment or other multi-family
housing 3.9 40.0 $12,500
Hotel 3.1 35.3 $25,800
Dormitory 0.2 7.3 $3,900
Office building 0.4 11.8 $33,600
Care of the sick 0.6 24.1 $20,000
Average of the five occupancy
groups 3.6 37.9 $13,300
Note: These are fires reported to U.S. municipal fire departments and so exclude fires reported only to Federal or state agencies
or industrial fire brigades. Average loss per fire is rounded to the nearest hundred dollars and not adjusted for inflation. Estimates
of deaths, injuries, or property damage can be significantly affected by the inclusion or exclusion of one unusually serious fire.
Source: NFIRS and NFPA Fire Experience Survey.

High-Rise Building Fires, 11/16 10 NFPA Fire Analysis & Research, Quincy, MA
Table 4.
Fires in Selected Properties, by Number of Stories above Ground
2009-2013 Annual Averages
A. Apartments or other multi-family housing
Number of Stories Fires
Civilian
Deaths
Civilian
Injuries
Direct Property
Damage
(in Millions)
Not high-rise
(1-6 stories)
1 17,590 (17%) 69 (17%) 501 (12%) $127 (10%)
2 42,030 (40%) 199 (50%) 1,813 (42%) $636 (51%)
3 27,070 (25%) 74 (19%) 1,081 (25%) $360 (29%)
4 6,280 (6%) 16 (4%) 250 (6%) $64 (5%)
5 2,370 (2%) 7 (2%) 89 (2%) $18 (1%)
6 2,100 (2%) 10 (2%) 165 (4%) $15 (1%)
Subtotal- 97,430 (92%) 376 (93%) 3,900 (91%) $1,219 (97%)
High-rise
(7-100 stories)
7 1,250 (1%) 4 (1%) 65 (2%) $3 (0%)
8 980 (1%) 2 (0%) 31 (1%) $2 (0%)
9 670 (1%) 2 (0%) 19 (0%) $2 (0%)
10 1,010 (1%) 3 (1%) 27 (1%) $2 (0%)
11 630 (1%) 3 (1%) 18 (0%) $7 (1%)
12 870 (1%) 2 (1%) 25 (1%) $3 (0%)
13 or more 3,570 (3%) 10 (3%) 202 (5%) $18 (1%)
Subtotal 8,970 (8%) 26 (7%) 387 (9%) $39 (3%)
Total 106,400 (100%) 402 (100%) 4,287 (100%) $1,258 (100%)
Note: These are fires reported to U.S. municipal fire departments and so exclude fires reported only to Federal or state agencies
or industrial fire brigades. Estimates include proportional shares of fire with number of stories above ground coded as unknown,
blank, zero, less than zero or greater than 100. Fires are rounded to the nearest ten, civilian deaths and injuries to the nearest one,
and direct property damage to the nearest million dollars without adjustment for inflation. Estimates of deaths, injuries, or
property damage can be significantly affected by the inclusion or exclusion of one unusually serious fire. Sums may not equal
totals due to rounding errors.
Source: NFIRS and NFPA Fire Experience Survey.

High-Rise Building Fires, 11/16 11 NFPA Fire Analysis & Research, Quincy, MA
Table 4.
Fires in Selected Properties, by Number of Stories above Ground
2009-2013 Annual Averages (Continued)
B. Hotels or motels
Number of Stories Fires
Civilian
Deaths
Civilian
Injuries
Direct Property
Damage
(in Millions)
Not high-rise
(1-6 stories)
1 630 (18%) 2 (23%) 23 (19%) $14 (17%)
2 740 (21%) 6 (62%) 45 (39%) $30 (36%)
3 870 (25%) 1 (8%) 18 (15%) $21 (25%)
4 420 (12%) 1 (7%) 14 (12%) $9 (10%)
5 200 (6%) 0 (0%) 4 (3%) $1 (1%)
6 120 (3%) 0 (0%) 2 (2%) $2 (2%)
Subtotal- 2,980 (85%) 9 (100%) 105 (90%) $77 (92%)
High-rise
(7-100 stories)
7 60 (2%) 0 (0%) 1 (1%) $1 (1%)
8 50 (1%) 0 (0%) 0 (0%) $0 (0%)
9 60 (2%) 0 (0%) 3 (2%) $1 (1%)
10 60 (2%) 0 (0%) 0 (0%) $0 (0%)
11 20 (0%) 0 (0%) 1 (1%) $2 (2%)
12 40 (1%) 0 (0%) 0 (0%) $1 (1%)
13 or more 250 (7%) 0 (0%) 5 (5%) $2 (2%)
Subtotal 540 (15%) 0 (0%) 11 (10%) $7 (8%)
Total 3,520 (100%) 9 (100%) 117 (100%) $84 (100%)
Note: These are fires reported to U.S. municipal fire departments and so exclude fires reported only to Federal or state agencies
or industrial fire brigades. Estimates include proportional shares of fire with number of stories above ground coded as unknown,
blank, zero, less than zero or greater than 100. Fires are rounded to the nearest ten, civilian deaths and injuries to the nearest one,
and direct property damage to the nearest million dollars without adjustment for inflation. Estimates of deaths, injuries, or
property damage can be significantly affected by the inclusion or exclusion of one unusually serious fire. Sums may not equal
totals due to rounding errors.
Source: NFIRS and NFPA Fire Experience Survey.
High-Rise Building Fires, 11/16 12 NFPA Fire Analysis & Research, Quincy, MA
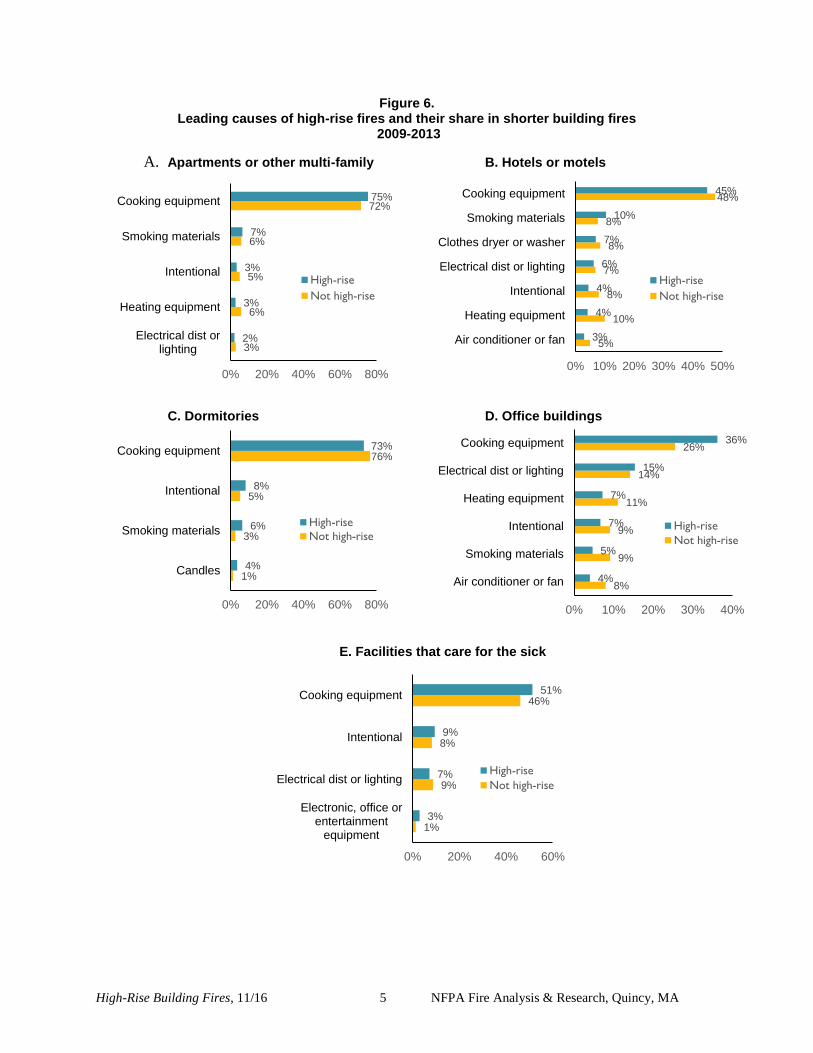
Table 4.
Fires in Selected Properties, by Number of Stories above Ground
2009-2013 Annual Averages (Continued)
C. Dormitories
Number of Stories Fires
Civilian
Deaths
Civilian
Injuries
Direct Property
Damage
(in Millions)
Not high-rise
(1-6 stories)
1 420 (11%) 0 (34%) 4 (12%) $2 (13%)
2 890 (23%) 0 (32%) 7 (23%) $3 (22%)
3 1,150 (30%) 0 (0%) 10 (30%) $3 (20%)
4 610 (16%) 0 (0%) 2 (6%) $5 (37%)
5 170 (4%) 0 (0%) 1 (3%) $0 (1%)
6 120 (3%) 0 (0%) 1 (2%) $0 (1%)
Subtotal- 3,360 (87%) 1 (67%) 25 (77%) $13 (95%)
High-rise
(7-100 stories)
7 70 (2%) 0 (0%) 0 (0%) $0 (1%)
8 110 (3%) 0 (0%) 4 (12%) $0 (1%)
9 30 (1%) 0 (33%) 2 (5%) $0 (0%)
10 50 (1%) 0 (0%) 0 (0%) $0 (0%)
11 20 (1%) 0 (0%) 0 (0%) $0 (1%)
12 30 (1%) 0 (0%) 1 (2%) $0 (0%)
13 or more 210 (5%) 0 (0%) 1 (3%) $0 (1%)
Subtotal 510 (13%) 0 (33%) 7 (23%) $1 (5%)
Total 3,870 (100%) 1 (100%) 32 (100%) $14 (100%)
Note: These are fires reported to U.S. municipal fire departments and so exclude fires reported only to Federal or state agencies
or industrial fire brigades. Estimates include proportional shares of fire with number of stories above ground coded as unknown,
blank, zero, less than zero or greater than 100. Fires are rounded to the nearest ten, civilian deaths and injuries to the nearest one,
and direct property damage to the nearest million dollars without adjustment for inflation. Estimates of deaths, injuries, or
property damage can be significantly affected by the inclusion or exclusion of one unusually serious fire. Sums may not equal
totals due to rounding errors.
Source: NFIRS and NFPA Fire Experience Survey.

High-Rise Building Fires, 11/16 13 NFPA Fire Analysis & Research, Quincy, MA
Table 4.
Fires in Selected Properties, by Number of Stories above Ground
2009-2013 Annual Averages (Continued)
D. Office buildings
Number of Stories Fires
Civilian
Deaths
Civilian
Injuries
Direct Property
Damage
(in Millions)
Not high-rise
(1-6 stories)
1 1,460 (47%) 0 (19%) 20 (53%) $40 (40%)
2 710 (23%) 0 (39%) 5 (14%) $29 (29%)
3 330 (11%) 0 (0%) 4 (11%) $7 (7%)
4 160 (5%) 0 (42%) 2 (6%) $7 (7%)
5 80 (2%) 0 (0%) 0 (1%) $6 (6%)
6 50 (2%) 0 (0%) 0 (1%) $4 (4%)
Subtotal- 2,800 (91%) 1 (100%) 33 (85%) $94 (94%)
High-rise
(7-100 stories)
7 30 (1%) 0 (0%) 0 (0%) $0 (0%)
8 20 (1%) 0 (0%) 0 (0%) $1 (1%)
9 10 (0%) 0 (0%) 0 (0%) $0 (0%)
10 20 (1%) 0 (0%) 0 (0%) $0 (0%)
11 10 (0%) 0 (0%) 0 (0%) $0 (0%)
12 30 (1%) 0 (0%) 1 (4%) $0 (0%)
13 or more 170 (5%) 0 (0%) 4 (11%) $5 (5%)
Subtotal 290 (9%) 0 (0%) 6 (15%) $6 (6%)
Total 3,090 (100%) 1 (100%) 39 (100%) $100 (100%)
Note: These are fires reported to U.S. municipal fire departments and so exclude fires reported only to Federal or state agencies
or industrial fire brigades. Estimates include proportional shares of fire with number of stories above ground coded as unknown,
blank, zero, less than zero or greater than 100. Fires are rounded to the nearest ten, civilian deaths and injuries to the nearest one,
and direct property damage to the nearest million dollars without adjustment for inflation. Estimates of deaths, injuries, or
property damage can be significantly affected by the inclusion or exclusion of one unusually serious fire. Sums may not equal
totals due to rounding errors.
Source: NFIRS and NFPA Fire Experience Survey.

High-Rise Building Fires, 11/16 14 NFPA Fire Analysis & Research, Quincy, MA
Table 4.
Fires in Selected Properties, by Number of Stories above Ground
2009-2013 Annual Averages (Continued)
E. Facilities that care for the sick
Number of Stories Fires
Civilian
Deaths
Civilian
Injuries
Direct Property
Damage
(in Millions)
Not high-rise
(1-6 stories)
1 680 (37%) 0.5 (52%) 13 (29%) $19 (57%)
2 280 (15%) 0.2 (26%) 3 (7%) $6 (18%)
3 190 (10%) 0.0 (0%) 4 (9%) $3 (8%)
4 170 (9%) 0.0 (0%) 10 (23%) $2 (6%)
5 130 (7%) 0.2 (23%) 4 (9%) $1 (3%)
6 120 (6%) 0.0 (0%) 3 (7%) $0 (1%)
Subtotal- 1,560 (86%) 1.0 (100%) 38 (85%) $31 (93%)
High-rise
(7-100 stories)
7 50 (3%) 0.0 (0%) 1 (1%) $0 (0%)
8 90 (5%) 0.0 (0%) 1 (3%) $1 (2%)
9 40 (2%) 0.0 (0%) 3 (7%) $0 (0%)
10 30 (2%) 0.0 (0%) 0 (0%) $1 (4%)
11 10 (1%) 0.0 (0%) 0 (0%) $0 (0%)
12 0 (0%) 0.0 (0%) 0 (0%) $0 (0%)
13 or more 40 (2%) 0.0 (0%) 1 (3%) $0 (1%)
Subtotal 260 (14%) 0.0 (0%) 7 (15%) $2 (7%)
Total 1,820 (100%) 1.0 (100%) 44 (100%) $33 (100%)
Note: These are fires reported to U.S. municipal fire departments and so exclude fires reported only to Federal or state agencies
or industrial fire brigades. Estimates include proportional shares of fire with number of stories above ground coded as unknown,
blank, zero, less than zero or greater than 100. Fires are rounded to the nearest ten, civilian deaths and injuries to the nearest one,
and direct property damage to the nearest million dollars without adjustment for inflation. Estimates of deaths, injuries, or
property damage can be significantly affected by the inclusion or exclusion of one unusually serious fire. Sums may not equal
totals due to rounding errors.
Source: NFIRS and NFPA Fire Experience Survey.

High-Rise Building Fires, 11/16 15 NFPA Fire Analysis & Research, Quincy, MA
Table 5.
High-Rise and Shorter Building Fires, by Leading Areas of Origin
2009-2013 Annual Averages
A. Apartments or other multi-family housing
High-Rise Not High-Rise
Area of Origin Fires Area of Origin Fires
Kitchen or cooking area 6,830 (76%) Kitchen or cooking area 68,500 (70%)
Trash or rubbish chute, area or
container 410 (5%) Bedroom 4,420 (5%)
Bedroom 310 (3%) All Means of Egress 2,550 (3%)
All Means of Egress 260 (3%) Exterior stairway 670 (1%)
Hallway or corridor 90 (1%) Interior stairway 510 (1%)
Interior stairway 80 (1%) Unclassified means of egress 470 (0%)
Unclassified means of egress 40 (0%) Hallway or corridor 450 (0%)
Lobby or entrance way 30 (0%) Lobby or entrance way 420 (0%)
Exterior stairway 20 (0%) Escalator 20 (0%)
Escalator 0 (0%) Living room, family room or den 2,300 (2%)
Living room, family room or den 230 (3%)
Exterior balcony or unenclosed
porch 2,180 (2%)
Laundry room or area 1,820 (2%)
Bathroom 1,730 (2%)
Note: These are fires reported to U.S. municipal fire departments and so exclude fires reported only to Federal or state agencies
or industrial fire brigades. Estimates include proportional shares of fire with number of stories above ground coded as unknown,
blank, zero, less than zero or greater than 100. Fires are rounded to the nearest ten, civilian deaths and injuries to the nearest one,
and direct property damage to the nearest million dollars without adjustment for inflation. Estimates of deaths, injuries, or
property damage can be significantly affected by the inclusion or exclusion of one unusually serious fire. Sums may not equal
totals due to rounding errors.
Source: NFIRS and NFPA Fire Experience Survey.

High-Rise Building Fires, 11/16 16 NFPA Fire Analysis & Research, Quincy, MA
Table 5.
High-Rise and Shorter Building Fires, by Leading Areas of Origin
2009-2013 Annual Averages (Continued)
B. Hotels or Motels
High-Rise Not High-Rise
Area of Origin Fires Area of Origin Fires
Kitchen or cooking area 210 (40%) Kitchen or cooking area 1,250 (42%)
Laundry room or area 40 (8%) Bedroom 400 (13%)
Bedroom 40 (7%) Laundry room or area 220 (7%)
All Means of Egress 40 (7%)
Lavatory, bathroom, locker room
or check room 120 (4%)
Hallway or corridor 10 (3%) All Means of Egress 110 (4%)
Lobby or entrance way 10 (2%) Hallway or corridor 40 (1%)
Interior stairway 10 (1%) Exterior stairway 20 (1%)
Unclassified means of egress 0 (1%) Lobby or entrance way 20 (1%)
Escalator 0 (0%)
Unclassified means of
egress 20 (1%)
Exterior stairway 0 (0%) Interior stairway 10 (0%)
Trash chute, area or container 20 (4%) Escalator 0 (0%)
Machinery room or area or elevator
machinery room 10 (2%)
Common room, living room,
family room, lounge or den 70 (2%)
Lavatory, bathroom, locker room or
check room 10 (2%) Heating equipment room 60 (2%)
Common room, living room, family
room, lounge or den 10 (2%) Confined chimney or flue fire 60 (2%)
Unclassified equipment or service
area 10 (2%) Unclassified function area 50 (2%)
Unclassified storage area 10 (2%) Unclassified area of origin 40 (2%)
Exterior roof surface 10 (2%)
Unclassified function area 10 (2%)
Note: These are fires reported to U.S. municipal fire departments and so exclude fires reported only to Federal or state agencies
or industrial fire brigades. Estimates include proportional shares of fire with number of stories above ground coded as unknown,
blank, zero, less than zero or greater than 100. Fires are rounded to the nearest ten, civilian deaths and injuries to the nearest one,
and direct property damage to the nearest million dollars without adjustment for inflation. Estimates of deaths, injuries, or
property damage can be significantly affected by the inclusion or exclusion of one unusually serious fire. Sums may not equal
totals due to rounding errors.
Source: NFIRS and NFPA Fire Experience Survey.

High-Rise Building Fires, 11/16 17 NFPA Fire Analysis & Research, Quincy, MA
Table 5.
High-Rise and Shorter Building Fires, by Leading Areas of Origin
2009-2013 Annual Averages (Continued)
C. Dormitories
High-Rise Not High-Rise
Area of Origin Fires Area of Origin Fires
Kitchen or cooking area 330 (65%) Kitchen or cooking area 2,310 (69%)
Bedroom 40 (7%) Bedroom 300 (9%)
All Means of Egress 30 (6%)
Lavatory, bathroom, locker room or
check room 120 (4%)
Hallway or corridor 20 (3%) All Means of Egress 100 (3%)
Lobby or entrance way 10 (2%) Hallway or corridor 60 (2%)
Unclassified means of egress 10 (1%) Exterior stairway 20 (1%)
Interior stairway 0 (0%) Interior stairway 10 (0%)
Exterior stairway 0 (0%) Lobby or entrance way 10 (0%)
Escalator 0 (0%) Unclassified means of egress 10 (0%)
Common room, living room,
family room, lounge or den 20 (4%) Escalator 0 (0%)
Lavatory, bathroom, locker room
or check room 20 (4%) Unclassified area of origin 70 (2%)
Trash or rubbish chute, area or
container 10 (3%)
Common room, living room, family
room, lounge or den 60 (2%)
Unclassified outside area 10 (2%) Laundry room or area 50 (2%)
Unclassified function area 50 (2%)
Note: These are fires reported to U.S. municipal fire departments and so exclude fires reported only to Federal or state agencies
or industrial fire brigades. Estimates include proportional shares of fire with number of stories above ground coded as unknown,
blank, zero, less than zero or greater than 100. Fires are rounded to the nearest ten, civilian deaths and injuries to the nearest one,
and direct property damage to the nearest million dollars without adjustment for inflation. Estimates of deaths, injuries, or
property damage can be significantly affected by the inclusion or exclusion of one unusually serious fire. Sums may not equal
totals due to rounding errors.
Source: NFIRS and NFPA Fire Experience Survey.

High-Rise Building Fires, 11/16 18 NFPA Fire Analysis & Research, Quincy, MA
Table 5.
High-Rise and Shorter Building Fires, by Leading Areas of Origin
2009-2013 Annual Averages (Continued)
D. Office Buildings
High-Rise Not High-Rise
Area of Origin Fires Area of Origin Fires
Kitchen or cooking area 90 (31%) Kitchen or cooking area 620 (22%)
Office 40 (12%) Office 370 (13%)
Machinery room or area or
elevator machinery room 30 (9%) All Means of Egress 160 (6%)
Unclassified equipment or service
area 20 (6%) Lobby or entrance way 60 (2%)
All Means of Egress 10 (4%) Unclassified means of egress 50 (2%)
Lobby or entrance way 10 (2%) Exterior stairway 30 (1%)
Unclassified means of egress 0 (1%) Hallway or corridor 20 (1%)
Exterior stairway 0 (1%) Interior stairway 10 (0%)
Hallway or corridor 0 (1%) Escalator 0 (0%)
Interior stairway 0 (1%)
Lavatory, bathroom, locker room or
check room 120 (4%)
Escalator 0 (0%) Heating equipment room 110 (4%)
Lavatory, bathroom, locker room
or check room 10 (3%) Unclassified outside area 110 (4%)
Exterior roof surface 10 (3%) Exterior wall surface 90 (3%)
Duct for HVAC, cable, exhaust,
heating, or AC 10 (3%) Exterior roof surface 80 (3%)
Small assembly area, less than
100 person capacity 10 (2%)
Attic or ceiling/roof assembly or
concealed space 80 (3%)
Switchgear area or transformer
vault 10 (2%) Unclassified area of origin 70 (3%)
Trash or rubbish chute, area or
container 10 (2%)
Trash or rubbish chute, area or
container 50 (2%)
Wall assembly or concealed space 50 (2%)
Unclassified equipment or service
area 50 (2%)
Note: These are fires reported to U.S. municipal fire departments and so exclude fires reported only to Federal or state agencies
or industrial fire brigades. Estimates include proportional shares of fire with number of stories above ground coded as unknown,
blank, zero, less than zero or greater than 100. Fires are rounded to the nearest ten, civilian deaths and injuries to the nearest one,
and direct property damage to the nearest million dollars without adjustment for inflation. Estimates of deaths, injuries, or
property damage can be significantly affected by the inclusion or exclusion of one unusually serious fire. Sums may not equal
totals due to rounding errors.
Source: NFIRS and NFPA Fire Experience Survey.

High-Rise Building Fires, 11/16 19 NFPA Fire Analysis & Research, Quincy, MA
Table 5.
High-Rise and Shorter Building Fires, by Leading Areas of Origin
2009-2013 Annual Averages (Continued)
E. Facilities that care for the sick
High-Rise Not High-Rise
Area of Origin Fires Area of Origin Fires
Kitchen or cooking area 100 (39%) Kitchen or cooking area 600 (39%)
Lavatory, bathroom, locker room
or check room 20 (6%)
Lavatory, bathroom, locker room or
check room 100 (6%)
All Means of Egress 10 (5%) Office 80 (5%)
Hallway or corridor 10 (3%) Heating equipment room 60 (4%)
Unclassified means of egress 0 (2%) All Means of Egress 60 (4%)
Lobby or entrance way 0 (0%) Lobby or entrance way 20 (2%)
Exterior stairway 0 (0%) Hallway or corridor 20 (1%)
Interior stairway 0 (0%) Exterior stairway 10 (0%)
Escalator 0 (0%) Unclassified means of egress 10 (0%)
Common room, living room,
family room, lounge or den 10 (4%) Interior stairway 0 (0%)
Bedroom 10 (3%) Escalator 0 (0%)
Trash chute, area or container 10 (3%) Laundry room or area 40 (3%)
Machinery room or area or
elevator machinery room 10 (3%) Bedroom 40 (2%)
Office 10 (3%)
Common room, living room, family
room, lounge or den 40 (2%)
Unclassified equipment or service
area 10 (3%) Exterior roof surface 30 (2%)
Laboratory 10 (3%) Unclassified equipment or service area 30 (2%)
Unclassified function area 10 (3%)
Dining room, bar or beverage area,
cafeteria 30 (2%)
Storage room, area, tank, or bin 10 (2%) Unclassified area of origin 30 (2%)
Unclassified area of origin 10 (2%)
Machinery room or area or elevator
machinery room 30 (2%)
Unclassified service facility 10 (2%) Unclassified function area 20 (2%)
Note: These are fires reported to U.S. municipal fire departments and so exclude fires reported only to Federal or state agencies
or industrial fire brigades. Estimates include proportional shares of fire with number of stories above ground coded as unknown,
blank, zero, less than zero or greater than 100. Fires are rounded to the nearest ten, civilian deaths and injuries to the nearest one,
and direct property damage to the nearest million dollars without adjustment for inflation. Estimates of deaths, injuries, or
property damage can be significantly affected by the inclusion or exclusion of one unusually serious fire. Sums may not equal
totals due to rounding errors.
Source: NFIRS and NFPA Fire Experience Survey.

High-Rise Building Fires, 11/16 20 NFPA Fire Analysis & Research, Quincy, MA
Table 6.
High-Rise and Shorter Building Fires, by Leading Causes
2009-2013 Annual Averages
A. Apartments or other multi-family housing
High-Rise Not High-Rise
Cause Fires Cause Fires
Cooking equipment 6,770 (75%) Cooking equipment 69,670 (72%)
Smoking materials 590 (7%) Smoking materials 5,750 (6%)
Intentional 300 (3%) Heating equipment 5,650 (6%)
Heating equipment 250 (3%) Intentional 4,910 (5%)
Electrical distribution and lighting
equipment 190 (2%)
Electrical distribution and lighting
equipment 2,770 (3%)
Candles 170 (2%) Exposure 1,920 (2%)
Clothes dryer or washer 1,850 (2%)
Candles 1,820 (2%)
Note: These are fires reported to U.S. municipal fire departments and so exclude fires reported only to Federal or state agencies
or industrial fire brigades. Estimates include proportional shares of fire with number of stories above ground coded as unknown,
blank, zero, less than zero or greater than 100. Fires are rounded to the nearest ten, civilian deaths and injuries to the nearest one,
and direct property damage to the nearest million dollars without adjustment for inflation. Estimates of deaths, injuries, or
property damage can be significantly affected by the inclusion or exclusion of one unusually serious fire. Sums may not equal
totals due to rounding errors.
Source: NFIRS and NFPA Fire Experience Survey.

High-Rise Building Fires, 11/16 21 NFPA Fire Analysis & Research, Quincy, MA
Table 6.
High-Rise and Shorter Building Fires, by Leading Causes
2009-2013 Annual Averages (Continued)
B. Hotels or motels
High-Rise Not High-Rise
Cause Fires Cause Fires
Cooking equipment 240 (45%) Cooking equipment 1,420 (48%)
Smoking materials 60 (10%) Heating equipment 290 (10%)
Clothes dryer or washer 40 (7%) Clothes dryer or washer 250 (8%)
Electrical distribution and lighting
equipment 30 (6%) Intentional 230 (8%)
Intentional 20 (4%) Smoking materials 200 (8%)
Heating equipment 20 (4%)
Electrical distribution and lighting
equipment 160 (7%)
Air conditioner or fan 20 (3%) Air conditioner or fan 160 5%
Spontaneous combustion or
chemical reaction 10 (2%) Candles 60 (5%)
Candles 10 (2%) (2%)
Note: These are fires reported to U.S. municipal fire departments and so exclude fires reported only to Federal or state agencies
or industrial fire brigades. Estimates include proportional shares of fire with number of stories above ground coded as unknown,
blank, zero, less than zero or greater than 100. Fires are rounded to the nearest ten, civilian deaths and injuries to the nearest one,
and direct property damage to the nearest million dollars without adjustment for inflation. Estimates of deaths, injuries, or
property damage can be significantly affected by the inclusion or exclusion of one unusually serious fire. Sums may not equal
totals due to rounding errors.
Source: NFIRS and NFPA Fire Experience Survey.

High-Rise Building Fires, 11/16 22 NFPA Fire Analysis & Research, Quincy, MA
Table 6.
High-Rise and Shorter Building Fires, by Leading Causes
2009-2013 Annual Averages (Continued)
C. Dormitories
High-Rise Not High-Rise
Cause Fires Cause Fires
Cooking equipment 370 (73%) Cooking equipment 2,570 (76%)
Intentional 40 (8%) Intentional 180 (5%)
Smoking materials 30 (6%) Heating equipment 90 (3%)
Candles 20 (4%) Smoking materials 90 (3%)
Playing with heat source 10 (2%)
Electrical distribution and lighting
equipment 60 (2%)
Electrical distribution and lighting
equipment 10 (2%)
Note: These are fires reported to U.S. municipal fire departments and so exclude fires reported only to Federal or state agencies
or industrial fire brigades. Estimates include proportional shares of fire with number of stories above ground coded as unknown,
blank, zero, less than zero or greater than 100. Fires are rounded to the nearest ten, civilian deaths and injuries to the nearest one,
and direct property damage to the nearest million dollars without adjustment for inflation. Estimates of deaths, injuries, or
property damage can be significantly affected by the inclusion or exclusion of one unusually serious fire. Sums may not equal
totals due to rounding errors.
Source: NFIRS and NFPA Fire Experience Survey.

High-Rise Building Fires, 11/16 23 NFPA Fire Analysis & Research, Quincy, MA
Table 6.
High-Rise and Shorter Building Fires, by Leading Causes
2009-2013 Annual Averages (Continued)
D. Office buildings
High-Rise Not High-Rise
Cause Fires Cause Fires
Cooking equipment 110 (36%) Cooking equipment 720 (26%)
Electrical distribution and lighting
equipment 50 (15%)
Electrical distribution and lighting
equipment 400 (14%)
Heating equipment 20 (7%) Heating equipment 310 (11%)
Intentional 20 (7%) Smoking materials 260 (9%)
Smoking materials 10 (5%) Intentional 250 (9%)
Air conditioner or fan 10 (4%) Air conditioner of fan 220 8%
Torch, burner, or soldering iron 10 (3%) Exposure 120 (4%)
Electronic, office or entertainment
equipment 10 (3%)
Electronic, office or entertainment
equipment 90 (3%)
Shop tools and industrial equipment
excluding torches, burners or
soldering irons 10 (3%) Candles 60 (2%)
Shop tools and industrial
equipment excluding torches,
burners or soldering irons 50 (2%)
Torch, burner, or soldering iron 50 (2%)
Note: These are fires reported to U.S. municipal fire departments and so exclude fires reported only to Federal or state agencies
or industrial fire brigades. Estimates include proportional shares of fire with number of stories above ground coded as unknown,
blank, zero, less than zero or greater than 100. Fires are rounded to the nearest ten, civilian deaths and injuries to the nearest one,
and direct property damage to the nearest million dollars without adjustment for inflation. Estimates of deaths, injuries, or
property damage can be significantly affected by the inclusion or exclusion of one unusually serious fire. Sums may not equal
totals due to rounding errors.
Source: NFIRS and NFPA Fire Experience Survey.

High-Rise Building Fires, 11/16 24 NFPA Fire Analysis & Research, Quincy, MA
Table 6.
High-Rise and Shorter Building Fires, by Leading Causes
2009-2013 Annual Averages (Continued)
E. Facilities that care for the sick
High-Rise Not High-Rise
Cause Fires Cause Fires
Cooking equipment 130 (51%) Cooking equipment 720 46%
Intentional 20 (9%) Heating equipment 140 9%
Electrical distribution and lighting
equipment 20 (7%)
Electrical distribution and
lighting equipment 140 9%
Electronic, office or entertainment
equipment 10 (3%) Intentional 130 8%
Shop tools and industrial equipment
excluding torches, burners or
soldering irons 10 (2%) Air conditioner or fan 70 5%
Medical equipment 10 (2%) Smoking materials 50 3%
Medical equipment 40 3%
Clothes dryer or washer 30 2%
Note: These are fires reported to U.S. municipal fire departments and so exclude fires reported only to Federal or state agencies
or industrial fire brigades. Estimates include proportional shares of fire with number of stories above ground coded as unknown,
blank, zero, less than zero or greater than 100. Fires are rounded to the nearest ten, civilian deaths and injuries to the nearest one,
and direct property damage to the nearest million dollars without adjustment for inflation. Estimates of deaths, injuries, or
property damage can be significantly affected by the inclusion or exclusion of one unusually serious fire. Sums may not equal
totals due to rounding errors.
Source: NFIRS and NFPA Fire Experience Survey.

High-Rise Building Fires, 11/16 25 NFPA Fire Analysis and Research, Quincy, MA
Appendix A.
Deadliest High-Rise Building Fires in History
Incident
Civilian and
Firefighter Deaths
Height
in Stories
Floor
of Origin
1. Office Towers (2 Towers)
New York, September 2001
2,666 110
94-98 (tower 1)
78-84 (tower 2)
2. Office
Brazil, February 1974
179 25 12
3. Office
Oklahoma, April 1995
168 9 Outside
4. Hotel
South Korea, December 1971
163 21 2
5. Clothing Manufacture
New York, March 1911
146 10 8
6. Hotel
Georgia, December 1946
119 15 3
7. Multiple Occupancy Building
Japan, May 1972
118 7 3
8. Garment Factory
Bangladesh, November 2012
112 9 1
9. Department Store
Japan, November 1973
104 9 Unknown
10.Hotel
Puerto Rico, December 1986
97 20 1
Source: NFPA’s Fire Incident Data Organization (FIDO), Fire Investigations database and other records.
Please notify us of any corrections or additions.

High-Rise Building Fires, 11/16 26 NFPA Fire Analysis & Research, Quincy, MA
Appendix B.
How National Estimates Statistics Are Calculated
The statistics in this analysis are estimates derived from the U.S. Fire
Administration’s (USFA’s) National Fire Incident Reporting System (NFIRS) and
the National Fire Protection Association’s (NFPA’s) annual survey of U.S. fire
departments. NFIRS is a voluntary system by which participating fire departments
report detailed factors about the fires to which they respond. Roughly two-thirds
of U.S. fire departments participate, although not all of these departments provide
data every year. Fires reported to federal or state fire departments or industrial fire
brigades are not included in these estimates.
NFIRS provides the most detailed incident information of any national database not
limited to large fires. NFIRS is the only database capable of addressing national
patterns for fires of all sizes by specific property use and specific fire cause. NFIRS
also captures information on the extent of flame spread, and automatic detection
and suppression equipment. For more information about NFIRS visit
http://www.nfirs.fema.gov/. Copies of the paper forms may be downloaded from
http://www.nfirs.fema.gov/documentation/design/NFIRS_Paper_Forms_2008.pdf.
NFIRS has a wide variety of data elements and code choices. The NFIRS
database contains coded information. Many code choices describe several
conditions. These cannot be broken down further. For example, area of origin
code 83 captures fires starting in vehicle engine areas, running gear areas or wheel
areas. It is impossible to tell the portion of each from the coded data.
Methodology may change slightly from year to year. NFPA is continually
examining its methodology to provide the best possible answers to specific
questions, methodological and definitional changes can occur. Earlier editions of
the same report may have used different methodologies to produce the same
analysis, meaning that the estimates are not directly comparable from year to
year.
NFPA’s fire department experience survey provides estimates of the big
picture. Each year, NFPA conducts an annual survey of fire departments which
enables us to capture a summary of fire department experience on a larger scale.
Surveys are sent to all municipal departments protecting populations of 50,000 or
more and a random sample, stratified by community size, of the smaller
departments. Typically, a total of roughly 3,000 surveys are returned, representing
about one of every ten U.S. municipal fire departments and about one third of the
U.S. population.
The survey is stratified by size of population protected to reduce the uncertainty
of the final estimate. Small rural communities have fewer people protected per
department and are less likely to respond to the survey. A larger number must be
surveyed to obtain an adequate sample of those departments. (NFPA also makes
follow-up calls to a sample of the smaller fire departments that do not respond, to
confirm that those that did respond are truly representative of fire departments

High-Rise Building Fires, 11/16 27 NFPA Fire Analysis & Research, Quincy, MA
their size.) On the other hand, large city departments are so few in number and
protect such a large proportion of the total U.S. population that it makes sense to
survey all of them. Most respond, resulting in excellent precision for their part of
the final estimate.
The survey includes the following information: (1) the total number of fire
incidents, civilian deaths, and civilian injuries, and the total estimated property
damage (in dollars), for each of the major property use classes defined in NFIRS;
(2) the number of on-duty firefighter injuries, by type of duty and nature of
illness; 3) the number and nature of non-fire incidents; and (4) information on the
type of community protected (e.g., county versus township versus city) and the
size of the population protected, which is used in the statistical formula for
projecting national totals from sample results. The results of the survey are
published in the annual report Fire Loss in the United States. To download a free
copy of the report, visit Fire Loss in the U.S. 2010.
PROJECTING NFIRS TO NATIONAL ESTIMATES
As noted, NFIRS is a voluntary system. Different states and jurisdictions have
different reporting requirements and practices. Participation rates in NFIRS are
not necessarily uniform across regions and community sizes, both factors
correlated with frequency and severity of fires. This means NFIRS may be
susceptible to systematic biases. No one at present can quantify the size of these
deviations from the ideal, representative sample, so no one can say with
confidence that they are or are not serious problems. But there is enough reason
for concern so that a second database -- the NFPA survey -- is needed to project
NFIRS to national estimates and to project different parts of NFIRS separately.
This multiple calibration approach makes use of the annual NFPA survey where
its statistical design advantages are strongest.
Scaling ratios are obtained by comparing NFPA’s projected totals of residential
structure fires, non-residential structure fires, vehicle fires, and outside and other
fires, and associated civilian deaths, civilian injuries, and direct property damage
with comparable totals in NFIRS. Estimates of specific fire problems and
circumstances are obtained by multiplying the NFIRS data by the scaling ratios.
Reports for incidents in which mutual aid was given are excluded from NFPA’s
analyses.
Analysts at the NFPA, the USFA and the Consumer Product Safety Commission
developed the specific basic analytical rules used for this procedure. “The
National Estimates Approach to U.S. Fire Statistics,” by John R. Hall, Jr. and
Beatrice Harwood, provides a more detailed explanation of national estimates. A
copy of the article is available online at http://www.nfpa.org/osds or through
NFPA's One-Stop Data Shop.
Version 5.0 of NFIRS, first introduced in 1999, used a different coding structure for
many data elements, added some property use codes, and dropped others. The essentials
High-Rise Building Fires, 11/16 28 NFPA Fire Analysis & Research, Quincy, MA
of the approach described by Hall and Harwood are still used, but some modifications
have been necessary to accommodate the changes in NFIRS 5.0.
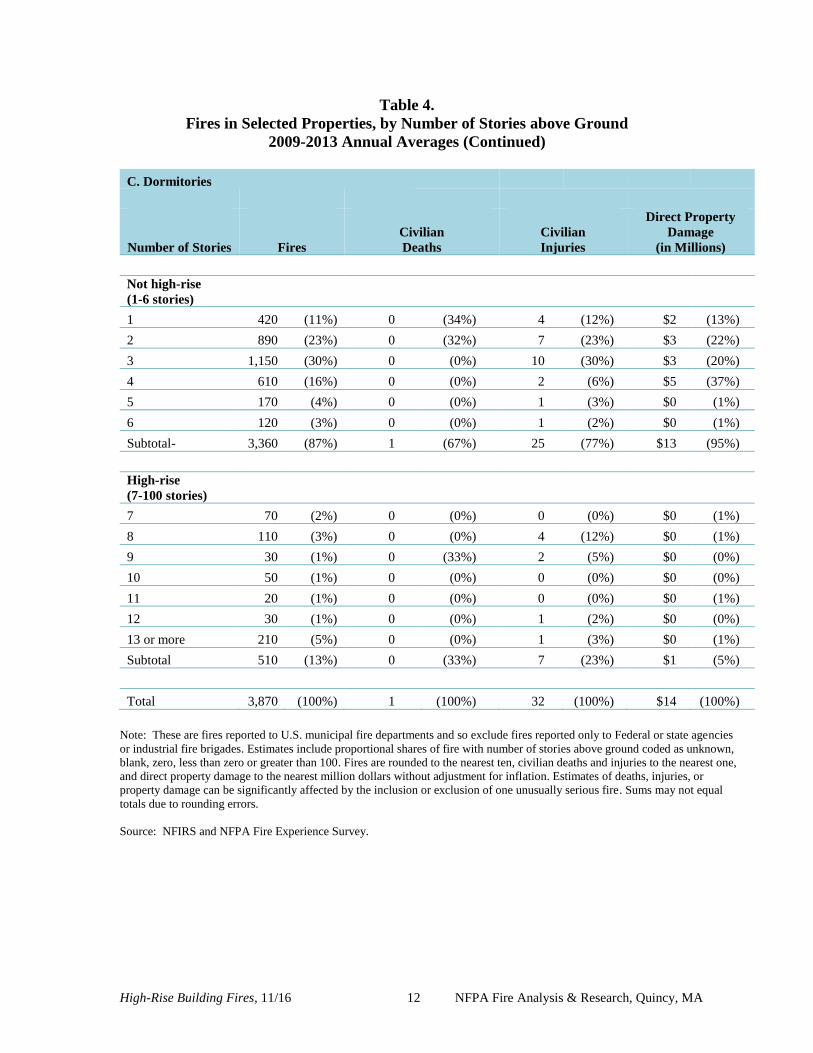
Figure A.1 shows the percentage of fires originally collected in the NFIRS 5.0 system.
Each year’s release version of NFIRS data also includes data collected in older versions
of NFIRS that were converted to NFIRS 5.0 codes.
Figure A.1. Fires Originally Collected in NFIRS 5.0 by Year
From 1999 data on, analyses are based on scaling ratios using only data originally
collected in NFIRS 5.0:
NFPA survey projections
NFIRS totals (Version 5.0)
For 1999 to 2001, the same rules may be applied, but estimates for these years in this form will
be less reliable due to the smaller amount of data originally collected in NFIRS 5.0; they should
be viewed with extreme caution.
NFIRS 5.0 introduced six categories of confined structure fires, including:
cooking fires confined to the cooking vessel,
confined chimney or flue fires,
confined incinerator fire,
confined fuel burner or boiler fire or delayed ignition,
confined commercial compactor fire, and
trash or rubbish fires in a structure with no flame damage to the structure or its
contents.
Although causal and other detailed information is typically not required for these
incidents, it is provided in some cases. Some analyses, particularly those that examine
cooking equipment, heating equipment, fires caused by smoking materials, and fires
started by playing with fire, may examine the confined fires in greater detail. Because the
confined fire incident types describe certain scenarios, the distribution of unknown data
differs from that of all fires. Consequently, allocation of unknowns must be done
separately.
Some analyses of structure fires show only non-confined fires. In these tables,
percentages shown are of non-confined structure fires rather than all structure fires. This
7%
21%
48%
65%
79%88%
94% 94% 97% 99% 100%100%100%100%100%
0%
20%
40%
60%
80%
100%
1999 2000 2001 2002 2003 2004 2005 2006 2007 2008 2009 2010 2011 2012 2013

High-Rise Building Fires, 11/16 29 NFPA Fire Analysis & Research, Quincy, MA
approach has the advantage of showing the frequency of specific factors in fire causes,
but the disadvantage of possibly overstating the percentage of factors that are seldom
seen in the confined fire incident types and of understating the factors specifically
associated with the confined fire incident types.
Other analyses include entries for confined fire incident types in the causal tables and
show percentages based on total structure fires. In these cases, the confined fire incident
type is treated as a general causal factor.
For most fields other than Property Use and Incident Type, NFPA allocates unknown
data proportionally among known data. This approach assumes that if the missing data
were known, it would be distributed in the same manner as the known data. NFPA makes
additional adjustments to several fields. Casualty and loss projections can be heavily
influenced by the inclusion or exclusion of unusually serious fire.
In the formulas that follow, the term “all fires” refers to all fires in NFIRS on the dimension
studied. The percentages of fires with known or unknown data are provided for non-confined
fires and associated losses, and for confined fires only.
Cause of Ignition: This field is used chiefly to identify intentional fires. “Unintentional” in this
field is a specific entry and does not include other fires that were not intentionally set: failure of
equipment or heat source, act of nature, or “other” (unclassified).” The last should be used for
exposures but has been used for other situations as well. Fires that were coded as under
investigation and those that were coded as undetermined after investigation were treated as
unknown.
Factor Contributing to Ignition: In this field, the code “none” is treated as an unknown and
allocated proportionally. For Human Factor Contributing to Ignition, NFPA enters a code for
“not reported” when no factors are recorded. “Not reported” is treated as an unknown, but the
code “none” is treated as a known code and not allocated. Multiple entries are allowed in both of
these fields. Percentages are calculated on the total number of fires, not entries, resulting in sums
greater than 100%. Although Factor Contributing to Ignition is only required when the cause of
ignition was coded as: 2) unintentional, 3) failure of equipment or heat source; or 4) act of
nature, data is often present when not required. Consequently, any fire in which no factor
contributing to ignition was entered was treated as unknown.
Heat Source. In NFIRS 5.0, one grouping of codes encompasses various types of open flames
and smoking materials. In the past, these had been two separate groupings. A new code was
added to NFIRS 5.0, which is code 60: “Heat from open flame or smoking material, other.”
NFPA treats this code as a partial unknown and allocates it proportionally across the codes in the
61-69 range, shown below.
61. Cigarette;
62. Pipe or cigar;
63. Heat from undetermined smoking material;
64. Match;
65. Lighter: cigarette lighter, cigar lighter;
66. Candle;
67 Warning or road flare, fuse;

High-Rise Building Fires, 11/16 30 NFPA Fire Analysis & Research, Quincy, MA
68. Backfire from internal combustion engine. Excludes flames and sparks from an exhaust
system, (11); and
69. Flame/torch used for lighting. Includes gas light and gas-/liquid-fueled lantern.
In addition to the conventional allocation of missing and undetermined fires, NFPA multiplies
fires with codes in the 61-69 range by
All fires in range 60-69
All fires in range 61-69
The downside of this approach is that heat sources that are truly a different type of open flame or
smoking material are erroneously assigned to other categories. The grouping “smoking
materials” includes codes 61-63 (cigarettes, pipes or cigars, and heat from undetermined
smoking material, with a proportional share of the code 60s and true unknown data.
Equipment Involved in Ignition (EII). NFIRS 5.0 originally defined EII as the piece of
equipment that provided the principal heat source to cause ignition if the equipment
malfunctioned or was used improperly. In 2006, the definition was modified to “the piece of
equipment that provided the principal heat source to cause ignition.” However, much of the data
predates the change. Individuals who have already been trained with the older definition may not
change their practices. To compensate, NFPA treats fires in which EII = NNN and heat source is
not in the range of 40-99 as an additional unknown.
To allocate unknown data for EII, the known data is multiplied by
All fires
(All fires – blank – undetermined – [fires in which EII =NNN and heat source <>40-99])
In addition, the partially unclassified codes for broad equipment groupings (i.e., code 100 -
heating, ventilation, and air conditioning, other; code 200 - electrical distribution, lighting and
power transfer, other; etc.) were allocated proportionally across the individual code choices in
their respective broad groupings (heating, ventilation, and air conditioning; electrical
distribution, lighting and power transfer, other; etc.). Equipment that is totally unclassified is not
allocated further. This approach has the same downside as the allocation of heat source 60
described above. Equipment that is truly different is erroneously assigned to other categories.
Equipment was not analyzed separately for confined fires. Instead, each confined fire incident
type was listed with the equipment or as other known equipment.
Area of Origin. Two areas of origin: bedroom for more than five people (code 21) and bedroom
for less than five people (code 22) are combined and shown as simply “bedroom.” Chimney is
no longer a valid area of origin code for non-confined fires.
Rounding and percentages. The data shown are estimates and generally rounded. An entry of
zero may be a true zero or it may mean that the value rounds to zero. Percentages are calculated
from unrounded values. It is quite possible to have a percentage entry of up to 100% even if the
rounded number entry is zero. The same rounded value may account for a slightly different
percentage share. Because percentages are expressed in integers and not carried out to several
decimal places, percentages that appear identical may be associated with slightly different
values.

High-Rise Building Fires, 11/16 31 NFPA Fire Analysis & Research, Quincy, MA
Appendix C.
Methodology and Definitions Used in “Leading Cause” Tables
The cause table reflects relevant causal factors that accounted for at least 2% of the fires
in a given occupancy. Only those causes that seemed to describe a scenario are included.
Because the causal factors are taken from different fields, some double counting is
possible. Percentages are calculated against the total number of structure fires, including
both confined and non-confined fires. Bear in mind that every fire has at least three
“causes” in the sense that it could have been prevented by changing behavior, heat
source, or ignitability of first fuel, the last an aspect not reflected in any of the major
cause categories. For example, several of the cause categories in this system refer to types
of equipment (cooking, heating, electrical distribution and lighting, clothes dryers and
washers, torches). However, the problem may be not with the equipment but with the
way it is used. The details in national estimates are derived from the U.S. Fire
Administration’s National Fire Incident Reporting System (NFIRS). This methodology is
based on the coding system used in Version 5.0 of NFIRS. The NFIRS 5.0 Reference
Guide, containing all of the codes, can be downloaded from
http://www.nfirs.fema.gov/documentation/reference/.
Cooking equipment and heating equipment are calculated by summing fires identified
by equipment involved in ignition and relevant confined fires. Confined fires will be
shown if they account for at least 2% of the incidents. Confined cooking fires (cooking
fires involving the contents of a cooking vessel without fire extension beyond the vessel)
are identified by NFIRS incident type 113.
Confined heating equipment fires include confined chimney or flue fires (incident
type 114) and confined fuel burner or boiler fires (incident type 116). The latter
includes delayed ignitions and incidents where flames caused no damage outside the fire
box. The two types of confined heating fires may be combined or listed separately,
depending on the numbers involved.
Intentional fires are identified by fires with a “1” (intentional) in the field “cause.” The
estimate includes a proportional share of fires in which the cause was undetermined after
investigation, under investigation, or not reported. All fires with intentional causes are
included in this category regardless of the age of the person involved. Earlier versions of
NFIRS included codes for incendiary and suspicious. Intentional fires were deliberately
set; they may or may not be incendiary in a legal sense. No age restriction is applied.
Fires caused by playing with heat source (typically matches or lighters) are identified by
code 19 in the field “factor contributing to ignition.” Fires in which the factor
contribution to ignition was undetermined (UU), entered as none (NN) or left blank are
considered unknown and allocated proportionally. Because factor contributing to ignition
is not required for intentional fires, the share unknown, by these definitions, is somewhat
larger than it should be.
The heat source field is used to identify fires started by: smoking materials (cigarette, code 61; pipe or cigar, code 62; and heat from undetermined smoking material,

High-Rise Building Fires, 11/16 32 NFPA Fire Analysis & Research, Quincy, MA
code 63); candles (code 66), lightning (code 73); and spontaneous combustion or
chemical reaction (code 72). Fires started by heat from unclassified open flame or
smoking materials (code 60) are allocated proportionally among the “other open flame or
smoking material” codes (codes 61-69) in an allocation of partial unknown data. This
includes smoking materials and candles. This approach results in any true unclassified
smoking or open flame heat sources such as incense being inappropriately allocated.
However, in many fires, this code was used as an unknown.
The equipment involved in ignition field is used to find several cause categories. This
category includes equipment that functioned properly and equipment that malfunctioned.
Cooking equipment Non-confined fire refers to equipment used to cook, heat or
warm food (codes 620-649 and 654). Fire in which ranges, ovens or microwave
ovens, food warming appliances, fixed or portable cooking appliances, deep fat
fryers, open fired charcoal or gas grills, grease hoods or ducts, or other cooking
appliances) were involved in the ignition are said to be caused by cooking equipment.
Food preparation devices that do not involve heating, such as can openers or food
processors, are not included here. As noted in Appendix A, a proportional share of
unclassified kitchen and cooking equipment (code 600) is included here.
Heating equipment Non-confined fire (codes 120-199) includes central heat,
portable and fixed heaters (including wood stoves), fireplaces, chimneys, hot water
heaters, and heat transfer equipment such as hot air ducts or hot water pipes. Heat
pumps are not included. As noted in Appendix A, a proportional share of unclassified
heating, ventilation and air condition equipment (code 100) is included here.
Confined fires are excluded from the tallies of the remaining categories of fires involving
equipment.
Electrical distribution and lighting equipment (codes 200-299) include: fixed
wiring; transformers; associated overcurrent or disconnect equipment such as fuses or
circuit breakers; meters; meter boxes; power switch gear; switches, receptacles and
outlets; light fixtures, lamps, bulbs or lighting; signs; cords and plugs; generators,
transformers, inverters, batteries and battery charges.
Torch, burner or soldering iron (codes 331-334) includes welding torches, cutting
torches, Bunsen burners, plumber furnaces, blowtorches, and soldering equipment. As
noted in Appendix A, a proportional share of shop tools and industrial equipment
(code 300) is included here.
Clothes dryer or washer (codes 811, 813 and 814) includes clothes dryers alone,
washer and dryer combinations within one frame, and washing machines for clothes.
As noted in Appendix A, a proportional share of unclassified personal and household
equipment (code 800) is included here.
Electronic, office or entertainment equipment (codes 700-799) includes:
computers and related equipment; calculators and adding machines; telephones or
answering machines; copiers; fax machines; paper shredders; typewriters; postage
meters; other office equipment; musical instruments; stereo systems and/or

High-Rise Building Fires, 11/16 33 NFPA Fire Analysis & Research, Quincy, MA
components; televisions and cable TV converter boxes,, cameras, excluding
professional television studio cameras, video equipment and other electronic
equipment. Older versions of NFIRS had a code for electronic equipment that
included radar, X-rays, computers, telephones, and transmitter equipment.
Shop tools and industrial equipment excluding torches, burners or soldering
irons (codes 300-330, 335-399) includes power tools; painting equipment;
compressors; atomizing equipment; pumps; wet/dry vacuums; hoists, lifts or cranes;
powered jacking equipment; water or gas drilling equipment; unclassified hydraulic
equipment; heat-treating equipment; incinerators, industrial furnaces, ovens or kilns;
pumps; compressors; internal combustion engines; conveyors; printing presses;
casting, molding; or forging equipment; heat treating equipment; tar kettles; working
or shaping machines; coating machines; chemical process equipment; waste recovery
equipment; power transfer equipment; power takeoff; powered valves; bearings or
brakes; picking, carding or weaving machines; testing equipment; gas regulators;
separate motors; non-vehicular internal combustion engines; and unclassified shop
tools and industrial equipment. As noted in Appendix A, a proportional share of shop
tools and industrial equipment (code 300) is included here.
Medical equipment (codes 410-419) includes: dental, medical or other powered
bed, chair or wheelchair; dental equipment; dialysis equipment; medical monitoring
and imaging equipment; oxygen administration equipment; radiological equipment;
medical sterilizers, therapeutic equipment and unclassified medical equipment. As
noted in Appendix A, a proportional share of commercial and medical equipment
(code 400) is included here.
Air conditioners or fans (codes 111 and 113) are self explanatory. As noted in
Appendix A, a proportional share of unclassified heating, ventilation and air
condition equipment (code 100) is included here.
Exposures are fires that are caused by the spread of or from another fire. These were
identified by factor contributing to ignition code 71. This code is automatically applied
when the exposure number is greater than zero.


![Design Fires for Means of Egress in Office Buildings based ... · Requirements for design fires are established in several engineering design guidelines, for example, NFPA 92B [1],](https://img.pdfslide.net/doc/110x75/5edc76dcad6a402d66672194/design-fires-for-means-of-egress-in-office-buildings-based-requirements-for.jpg)


![High Rise Fires - The Operational Aspect of High Rise Fire Fighting[1]](https://img.pdfslide.net/doc/110x75/577cde371a28ab9e78aea2df/high-rise-fires-the-operational-aspect-of-high-rise-fire-fighting1.jpg)