Embed Size (px)
Citation preview

2012-2013
Weld County School District 6 Learning Services 1025 9th Avenue Greeley, CO 80631 970/348-6000
Curriculum Guides
High School Math


Greeley-Evans School District 6 Page 1 of 17 2012-2013 Algebra I Curriculum Guide
Greeley/Evans School District 6 Algebra I Curriculum Guide
Unit 1: Relationships Between Quantities and Reasoning with Equations Timeline: Aug 16 – October 16 42 days 1 day = 43 minutes
Enduring Concept: Equations can be used to model situations and solve problems in our world.
Grade Level Expectations (GLE): • Reason quantitatively and use units to solve problems. • Interpret the structure of expressions. • Create equations that describe numbers or relationships. • Understand solving equations as a process of reasoning and explain the reasoning. • Solve equations and inequalities in one variable.
Vocabulary: represent evaluate expression equation term
coefficient inequality constraint sequence recursive explicit
Inquiry Questions: 1. When is it appropriate to simplify expressions? 2. What are some similarities in solving all types of equations? 3. Why do different types of equations require different types of solution processes? 4. Can computers solve algebraic problems that people cannot solve? Why?
Materials needed for this unit: beans algebra tiles card stock cups library books: One Grain of Rice or The King’s Chessboard
Evidence Outcomes Instructional Plan By the end of eighth grade students have learned to solve linear equations in one variable and have applied graphical and algebraic methods to analyze and solve systems of linear equations in two variables. This unit builds on these earlier experiences by asking students to analyze and explain the process of solving an equation. Students develop fluency writing, interpreting, and translating between various forms of linear equations and inequalities, and using them to solve problems. They master the solution of linear equations and apply related solution techniques and the laws of exponents to the creation and solution of simple exponential equations. All of this work is grounded on understanding quantities and on relationships between them. SKILLS TO MAINTAIN Reinforce understanding of the properties of integer exponents. The initial experience with exponential expressions, equations, and functions involves integer exponents and builds on this understanding. Reason quantitatively and use units to solve problems. Working with quantities and the relationships between them provides grounding for work with
1 day 3 days 4 days
Administer Unit 1 Pre-assessment (measures multi-step problem solving; reasoning with linear and exponential equations and inequalities; solving systems of equations) Score with Mathematics Scoring Rubric; share and analyze results in data teams. This assessment does not get recorded in the grade book, nor should students be expected to correct their mistakes. It is an assessment to let you know what students know before beginning the unit. Solve multi-step problems involving units of measurement. Exploration Problems:
• Leaky Faucet converts rates using dimensional analysis. • Yogurt converts measures using dimensional analysis and reviews percent of and percent
increase. • Giantburger explores scientific notation within the percent and unit conversion
discussions. • A Golden Crown works with guess and check strategies and the fact that
min6011
1min60 hrhr
== just as kgcm
cmkg
1501
501 3
3 == in this problem.
In the context of working the problems above, students should learn how to use dimensional analysis. Don’t pre-teach dimensional analysis; rather teach it once it’s needed in the context of solving problems. An example of dimensional analysis is given below.
Dimensional Analysis: week
dropsweekdaysx
dayhrx
hrxxdrop 400,302
17
124
1min60
min1sec60
sec21
=
Scatterplots Open with the Birds’ Eggs problem. Relate the scatterplot to correlation (+ or -), slope, average or mean, and ratios. Point out that the regression line, or line-of-best-fit, always

Greeley-Evans School District 6 Page 2 of 17 2012-2013 Algebra I Curriculum Guide
expressions, equations, and functions. CO-HS.1.NPO.2.a.i-iii; CCSS-HS.N.Q.1-3 • Solve multi-step problems that require choosing
appropriate units, estimating with appropriate units, and describing limitations of measurements.
• Create scatterplots from real data by choosing correct units, scales and intervals.
Interpret the structure of expressions. Limit to linear expressions and to exponential expressions with integer exponents. CO-HS.2.PFA.3.a.i; CCSS-HS.A.SSE.1.a-b • Interpret both linear and exponential expressions
as they relate to a particular context. • Use chunking to identify parts of expressions.
1 day 5 days
goes through the coordinates of the means of the two variables. How Tall? from Illuminations is a good example of a lesson that has students collect data, create scatterplots, and draw conclusions from the plots. Though students could create the scatterplots by hand, it would be very tedious and time-consuming. Consider having students use graphing calculators to enter the data in STATS, create scatterplots that fit their assigned data, manually choose the window to fit their data (not zoomstat), draw the regression line, report the correlation coefficient r, discuss the slope of the lines, and determine which measures are most highly correlated (r is closest to 1). The complete lesson can be found at http://illuminations.nctm.org/LessonDetail.aspx?id=L776 . Judgment Day: How Tall is the Criminal? This is an activity based on a season 2 Numb3rs episode. It is a good follow-up to the How Tall? lesson. The activity can be found at http://education.ti.com/calculators/downloads/US/Activities/Detail?id=5915. Let’s Go to the Mall Students should create a scatterplot for simple data by hand on a blank grid. They should create the title, decide on the scales and intervals, label the axes appropriately, find the mean of each variable (centroid), plot it on the graph, draw a line-of-best-fit that goes through the centroid, and create some questions that require others to analyze the graph. Performance Assessment 1.1 (measures problem solving with units and scatterplots) Score with Mathematics Scoring Rubric; share and analyze results in data teams. Counting Beans (Exponential Decay) Use a marker to put a black dot on one side of each bean. Be sure that each group of students has at least 35 beans so that they can do the experiment repeatedly. Students will pour the beans onto a plate, remove the ones that have the black dot face up, and put the rest of the beans back into the cup. Doing this repeatedly yields an exponential decay function. Remind the student not to eat the beans, and that they have been used by other students in other classes. Students should enter the data into STAT lists, graph the relationship with STAT PLOT, and determine whether to calculate the LinReg or ExpReg equation. Be sure not to record the last data point with 0 plain beans as this will create ERR: DOMAIN. Students should determine what the coefficient and base of the equation mean in the context of the problem and compare and contrast equations during the summary. Linear Matching Cards let students solidify their thinking about linear equations, graphs, tables of values, slope and y-intercept. One card set per group; should not take a whole day. Stacking Cups (Linear growth) Navigating Through Algebra in Grades 6-8, p.41-43. Materials: stacking cups of different kinds – divided into sets of cups of the same kind. Students should determine what the coefficient and constant of the equation mean in the context of the problem and compare and contrast equations during the summary.

Greeley-Evans School District 6 Page 3 of 17 2012-2013 Algebra I Curriculum Guide
Create equations that describe numbers or relationships. CO-HS.2.PFA.4.a.i-iv; CCSS-HS.A.CED.1-4 • Solve problems by creating and solving linear and
exponential equations and inequalities in one variable.
• Create linear and exponential equations in two or more variables from contexts; graph on coordinate axes with labels and scales.
Understand solving equations as a process of reasoning and explain the reasoning. Students should focus on and master for linear equations and be able to extend and apply their reasoning to other types of equations in future
1 day 1 day
Interpreting Algebraic Expressions This activity comes from the Shell Centre, found at www.mathshell.org/materials/lessons.php. Students match verbal descriptions, pictures, tables, and graphs with expressions. It does not address exponential expressions and does include some power functions, but it builds on work in 8th grade with algebra tiles and is worth the time. Matching Linear and Exponential Situations Problems should include matching expressions to specific situations and explaining why they match. This set of cards would be one possible way. Consider reading the book One Grain of Rice: A Mathematical Folktale by Demi or The King’s Chessboard by David Birch with your students as you explore exponential growth. Each is a story of payments of rice involving powers of two. The Wizard and the King is a comparable replacement activity if you can’t find a book. An Introduction to Exponential Functions use with Khan Academy video below. Linear/Quadratic/Exponential Models Khan Academy Video http://www.khanacademy.org/math/algebra/ck12-algebra-1/v/linear--quadratic--and-exponential-models Looks at patterns in data tables to compare models. The quadratic portion is last, short, and a good introduction to these functions, though students will only be held accountable for linear and exponential at this point. 8:15 minutes Descriptions of graphs Begin to help students be specific in their descriptions of graphs, using words such as increasing/decreasing at a constant rate, increasing/decreasing at a(n) increasing/decreasing rate. Training students to analyze every graph with these words will help their understanding as they fit mathematical models to real-world situations. Performance Assessment 1.2 (measures identifying key chunks of expressions and their significance in given situations) Score with Mathematics Scoring Rubric; share and analyze results in data teams. Reuse the Matching Linear and Exponential Situations cards to challenge students to find solutions. This is a skill that was developed in 7th and 8th grades, so have students work in groups to find solutions for as many situations as they can. Have students share solution strategies during the lesson summary to determine what instruction is needed in properties of equality. For the Andre’s satellite bill problem, students might enter y1 = 68.27, y2 = 52.35(1.09)x, and calculate the intersection. Strategies that students used in 7th and 8th grades include the “cover up” technique (2x+3=7, cover up 2x, what plus 3 is 7?, so 2x=4, cover up x, 2 times something =4, so x must be 2), the “undoing” technique (3x – 42 = -27, enter -27 on calculator, enter, add 42, enter, divide by 3), “reasoning with the symbols” technique (using properties of equality, may or may not show every step), and the “guess and check” technique. Your students should learn how to solve with algebraic reasoning and to solve with a graphing calculator as in Andre’s bill above using either graphs or tables. Emphasis should be placed on checking answers for reasonableness.
Greeley-Evans School District 6 Page 4 of 17 2012-2013 Algebra I Curriculum Guide
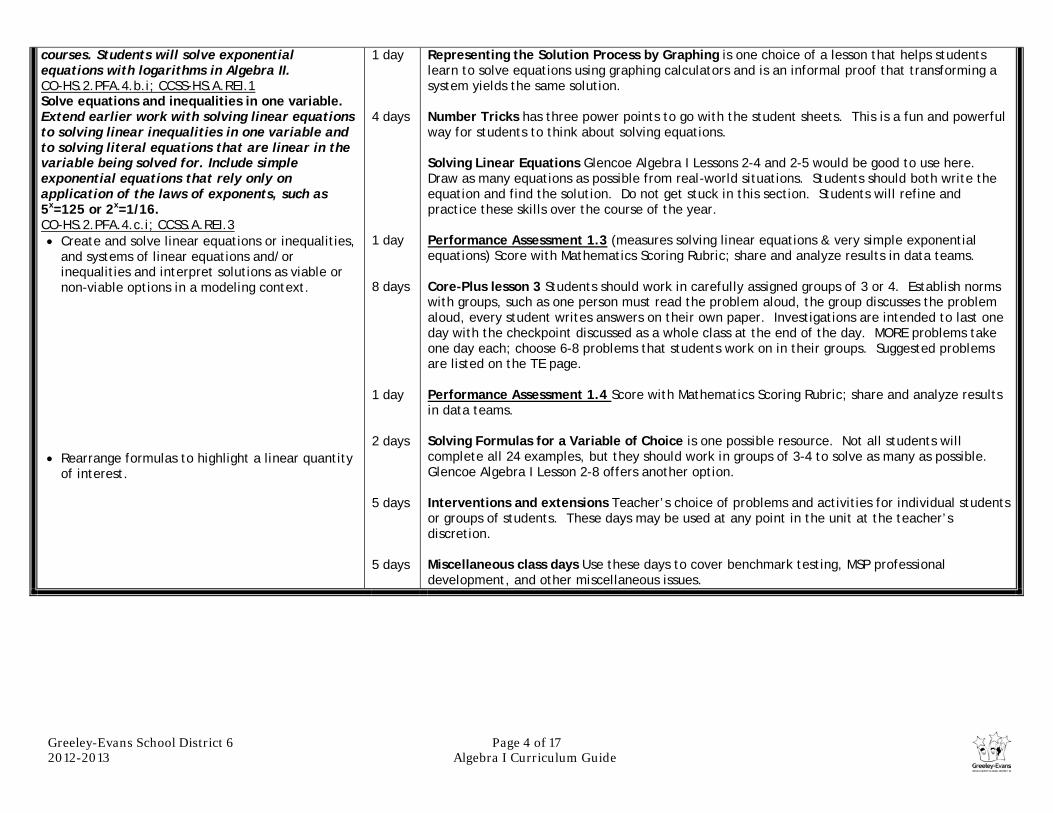
courses. Students will solve exponential equations with logarithms in Algebra II. CO-HS.2.PFA.4.b.i; CCSS-HS.A.REI.1 Solve equations and inequalities in one variable. Extend earlier work with solving linear equations to solving linear inequalities in one variable and to solving literal equations that are linear in the variable being solved for. Include simple exponential equations that rely only on application of the laws of exponents, such as 5x=125 or 2x=1/16. CO-HS.2.PFA.4.c.i; CCSS.A.REI.3 • Create and solve linear equations or inequalities,
and systems of linear equations and/or inequalities and interpret solutions as viable or non-viable options in a modeling context.
• Rearrange formulas to highlight a linear quantity
of interest.
1 day 4 days 1 day 8 days 1 day 2 days 5 days 5 days
Representing the Solution Process by Graphing is one choice of a lesson that helps students learn to solve equations using graphing calculators and is an informal proof that transforming a system yields the same solution. Number Tricks has three power points to go with the student sheets. This is a fun and powerful way for students to think about solving equations. Solving Linear Equations Glencoe Algebra I Lessons 2-4 and 2-5 would be good to use here. Draw as many equations as possible from real-world situations. Students should both write the equation and find the solution. Do not get stuck in this section. Students will refine and practice these skills over the course of the year. Performance Assessment 1.3 (measures solving linear equations & very simple exponential equations) Score with Mathematics Scoring Rubric; share and analyze results in data teams. Core-Plus lesson 3 Students should work in carefully assigned groups of 3 or 4. Establish norms with groups, such as one person must read the problem aloud, the group discusses the problem aloud, every student writes answers on their own paper. Investigations are intended to last one day with the checkpoint discussed as a whole class at the end of the day. MORE problems take one day each; choose 6-8 problems that students work on in their groups. Suggested problems are listed on the TE page. Performance Assessment 1.4 Score with Mathematics Scoring Rubric; share and analyze results in data teams. Solving Formulas for a Variable of Choice is one possible resource. Not all students will complete all 24 examples, but they should work in groups of 3-4 to solve as many as possible. Glencoe Algebra I Lesson 2-8 offers another option. Interventions and extensions Teacher’s choice of problems and activities for individual students or groups of students. These days may be used at any point in the unit at the teacher’s discretion. Miscellaneous class days Use these days to cover benchmark testing, MSP professional development, and other miscellaneous issues.

Greeley-Evans School District 6 Page 5 of 17 2012-2013 Algebra I Curriculum Guide
Greeley/Evans School District 6 Algebra I Curriculum Guide
Unit 2: Linear and Exponential Relationships 60 days Timeline: Oct 17 to Jan 31 1 day = 43 minutes
Enduring Concept: Many patterns in our world are organized into function families. Analyzing these families allows us to make informed decisions about what is best.
Grade Level Expectations (GLE): • Extend the properties of exponents to rational exponents. • Solve systems of equations. • Represent and solve equations and inequalities graphically. • Understand the concept of a function and use function notation. • Interpret functions that arise in applications in terms of a context. • Analyze functions using different representations. • Build a function that models a relationship between two quantities. • Build new functions from existing functions. • Construct and compare linear and exponential models and solve problems. And in • Interpret expressions for functions in terms of the situation they model.
Vocabulary: radical rational exponent function notation slope intercept domain
range system of equations recursive rule explicit rule boundary half-plane
Materials needed for this unit: ribbon or adding machine tape card stock
Inquiry Questions: 1. Why are relations and functions represented in multiple ways? 2. How can a table, graph, and function notation be used to explain how one function family is different from and/or similar to another? 3. How are patterns and functions similar and different? 4. Which financial applications can be modeled with exponential functions? Linear functions? (PFL) 5. What elementary function or functions best represent a given scatter plot of two-variable data? 6. How much would today’s purchase cost tomorrow? (PFL) 7. Why do different types of equations require different types of solution processes?
Evidence Outcomes Instructional Plan In earlier grades, students define, evaluate, and compare functions, and use them to model relationships between quantities. In this unit, students will learn function notation and develop the concepts of domain and range. They move beyond viewing functions as processes that take inputs and yield outputs and start viewing functions as objects in their own right. They explore many examples of functions, including sequences; they interpret functions given graphically, numerically, symbolically, and verbally, translate between representations, and understand the limitations of various representations. They work with functions given by graphs and tables, keeping in mind that, depending upon the context, these representations are likely to be approximate and incomplete. Their work includes functions that can be described or approximated by formulas as well as those that cannot. When functions describe relationships between quantities arising from a
1 day 3 days
2 days 1 day
Administer Unit 2 Pre-Assessment (measures system, function notation, laws of exponents, graphing line) Score with Mathematics Scoring Rubric; share and analyze results in data teams. This assessment does not get recorded in the grade book, nor should students be expected to correct their mistakes. It is an assessment to let you know what students know before beginning the unit. Laws of Exponents were not taught in middle school. A list of appropriate laws is given here for your use. Students will explore the laws through the example problems. Teach all
laws from a conceptual standpoint, i.e. ( )( ) 742 3333333333 =⋅⋅⋅⋅⋅=⋅ . Rational and Irrational Numbers I from the Shell Centre. Be sure to read the teacher pages carefully before beginning the lesson. Students must complete the classification pre-assessment prior to beginning the lesson. You might consider using it as a homework page. http://map.mathshell.org/materials/lessons.php?taskid=424&subpage=concept Sorting Equations and Identities from the Shell Centre gives an opportunity to extend student thinking in number properties. Students may need algebra tiles to explore or they

Greeley-Evans School District 6 Page 6 of 17 2012-2013 Algebra I Curriculum Guide
context, students reason with the units in which those quantities are measured. Students explore systems of equations and inequalities, and they find and interpret their solutions. Students build on and informally extend their understanding of integer exponents to consider exponential functions. They compare and contrast linear and exponential functions, distinguishing between additive and multiplicative change. They interpret arithmetic sequences as linear functions and geometric sequences as exponential functions. Extend the properties of exponents to rational exponents. CO-HS.1.NPO.1.a.i-ii; CCSS-HS.N.RN.1-2 • Explain and use the properties of exponents. • Rewrite expressions involving radicals and rational
exponents using the properties of exponents.
Represent and solve equations and inequalities graphically.
CO-HS.2.PFA.4.e.i-iii; CCSS-HS.A.REI.10-12 Analyze functions using different representations. CO-HS.2.PFA.1.c.i-vi; CCSS-HS.F.IF.7,9 Interpret functions that arise in applications in terms of a
context. CO-HS.2.PFA.1.b.i-iii; CCSS-HS.F.IF.4-6 Build a function that models a relationship between two
quantities. CO-HS.2.PFA.1.d.i-ii; CCSS-HS.F.BF.1-2 Construct and compare linear and exponential models and
solve problems. CO-HS.2.PFA.2.a.i-iii; CCSS-HS.F.LE.1-3 Interpret expressions for functions in terms of the
situation they model. CO-HS.2.PFA.2.b.i; CCSS-HS.F.LE.5 Model personal financial situations CO-HS.2.PFA.2.d.i-iii Build new functions from existing functions. CO-HS.2.PFA.1.e.i; CCSS-HS.F.BF.3 Understand the concept of a function and use function
notation. CO-HS.2.PFA.1.a.i-iii; CCSS-HS.F.IF.1-3 • Understand the meaning of function. • Graph linear and exponential functions expressed
symbolically and show key features of the graph, by hand
1 day 8 days
might plug in numbers to guess and check. http://map.mathshell.org/materials/lessons Performance Assessment 2.1 (measures laws of exponents; using properties of arithmetic) Score with Mathematics Scoring Rubric; share and analyze results in data teams. In this section, pay particular attention to slope, y-intercept, writing linear equations in slope-intercept form y = a + bx or y = mx + b, and the meaning of each part of the equation in the context of the problem situation. Please teach skills through contexts, rather than as isolated skills. Glencoe Algebra lessons 4-1 to 4-5 and 3-1 to 3-5 list specific concepts, but should not be the sole focus of this section. See list of skills in the Evidence Outcomes
column. Slope should be taught conceptually first, i.e. runrise
, amount up or down for each
run to the right. Only then are students ready to look at the formula for slope and relate it
to the distance between coordinates. Introduce xy
∆∆
as a different way to think of slope
very soon in the process. Middle school students studied slope as a ratio and as an angle. They explored slopes using staircases, or drawing repeated up/down-and-right triangles. Exponential equations will be built with tables of values. Use y = mx + b and f(x) = mx + b interchangeably so students become comfortable with either. The web address to find complete lesson plans is listed below each 9-12 algebra Illuminations lesson. Counting for Slope from Illuminations (Rise-Run Triangles) reintroduces students to the concept of slope. http://illuminations.nctm.org/LessonDetail.aspx?id=L728 Equations of Attack Students play this game in pairs. One chooses odd y-intercepts, one chooses even. Take turns drawing a slope card, beginning at one of their y-intercepts, and drawing lines to sink partner’s ships. http://illuminations.nctm.org/LessonDetail.aspx?id=L782 Bike Weights and Jump Heights (Exploring Linear Data) students graph data on scatterplot, look at correlation, slope, rate of change, and answer questions about the graph. http://illuminations.nctm.org/LessonDetail.aspx?id=L298 Linear Alignment This lesson allows students to explore linear equations and the effects of changing the slope and y-intercept on a line. http://illuminations.nctm.org/LessonDetail.aspx?id=L771 Height of Corn over Time (Determining Functions Using Regression) Students use calculators to write the equation of the line. It will be helpful if students use 8:LinReg(a+bx) rather than 4:LinReg(ax+b) since this intuitively matches a starting point

Greeley-Evans School District 6 Page 7 of 17 2012-2013 Algebra I Curriculum Guide
in simple cases and using technology for more complicated cases.
• Key features include: intercepts; intervals where the function is increasing, decreasing, positive, or negative, and end behavior.★
• Interpret the parts of linear y = a + bx or y = mx + b and exponential y = abx functions in terms of a context.
• Calculate and interpret the average rate of change of a linear function (presented symbolically or as a table) over a specified interval. Estimate the rate of change from a graph.★
• Compare properties of two functions each represented in a different way (algebraically, graphically, numerically in tables, or by verbal descriptions).
• Write arithmetic and geometric sequences both recursively and with an explicit formula, use them to model situations, and translate between the two forms.★
• Observe using graphs and tables that a quantity increasing exponentially eventually exceeds a quantity increasing linearly.
• Identify domain and range; relate to independent and dependent variables.
• Construct linear functions given two input-output pairs (including reading these from a table).
• Identify the effect on the graph of adding k to f(x) for specific values of k (both positive and negative); find the value of k given the graphs. Experiment with cases and illustrate an explanation of the effects on the graph using technology.
• Use function notation, evaluate functions for inputs in their domains, and interpret statements that use function notation in terms of a context.
1 day 10 days
plus constant change. http://illuminations.nctm.org/LessonDetail.aspx?ID=L725 Movie Lines This problem is a good example two linear situations, one of which is proportional (y=bx) and one that is not (y=a+bx). http://illuminations.nctm.org/LessonDetail.aspx?id=L629 Bike Graphs (Pedal Power) explores slope with links to pictures of Haleakala National Park where the bike trip takes place. http://illuminations.nctm.org/LessonDetail.aspx?id=L586 Weight and Drug Doses gives students another opportunity to work with slope and linear rules while exploring usual and maximum dosages for a drug. http://illuminations.nctm.org/lessons/9-12/explorelinear/ExpLin-AS-Weights.pdf Too Hot to Handle, Too Cold to Enjoy allows students to collect data in groups of 3 or 4 from a video of a cooling cup of coffee, graph and analyze the data. It also provides an introduction to domain and range. http://illuminations.nctm.org/LessonDetail.aspx?id=L852 Performance Assessment 2.2 (measures graphing and interpreting a linear situation) Score with Mathematics Scoring Rubric; share and analyze results in data teams. In this section, pay particular attention to y-intercept, writing linear equations in slope-intercept form y = a + bx or y = mx + b, writing exponential equations in y = abx form, and drawing comparisons between the two types of situations. Rates of Change (Growth Rate) has students calculate rates of change from growth graphs by choosing two points that are close together. They then graph the changing rates after multiple opportunities to use the slope formula. When students finish this activity, take the time to share with them that they have just worked on a calculus problem. Plant the seed! http://illuminations.nctm.org/LessonDetail.aspx?id=L668 Linear and Exponential Equations to Represent Arithmetic and Geometric Sequences affords an opportunity for students to build on middle school experiences and Navigator intervention units. The two examples provide an opportunity for whole class work before partners work together to solve the remaining problems. Have students share strategies for finding the addend or multiplier and for finding the a and b in the equations. This could happen in the middle of the lesson if many students are unsuccessful, or during the summary to lock in the learning for every student. Two ideas should be brought forward: Recursive equations ( nNOWNEXT += , starting at a, or nNOWNEXT ⋅= , starting at a, as well as baaorbaa nnnn ⋅=+= −− 11 ) and
explicit equations ( bxay += or xbay ⋅= ). Students may find it helpful to write both
Greeley-Evans School District 6 Page 8 of 17 2012-2013 Algebra I Curriculum Guide
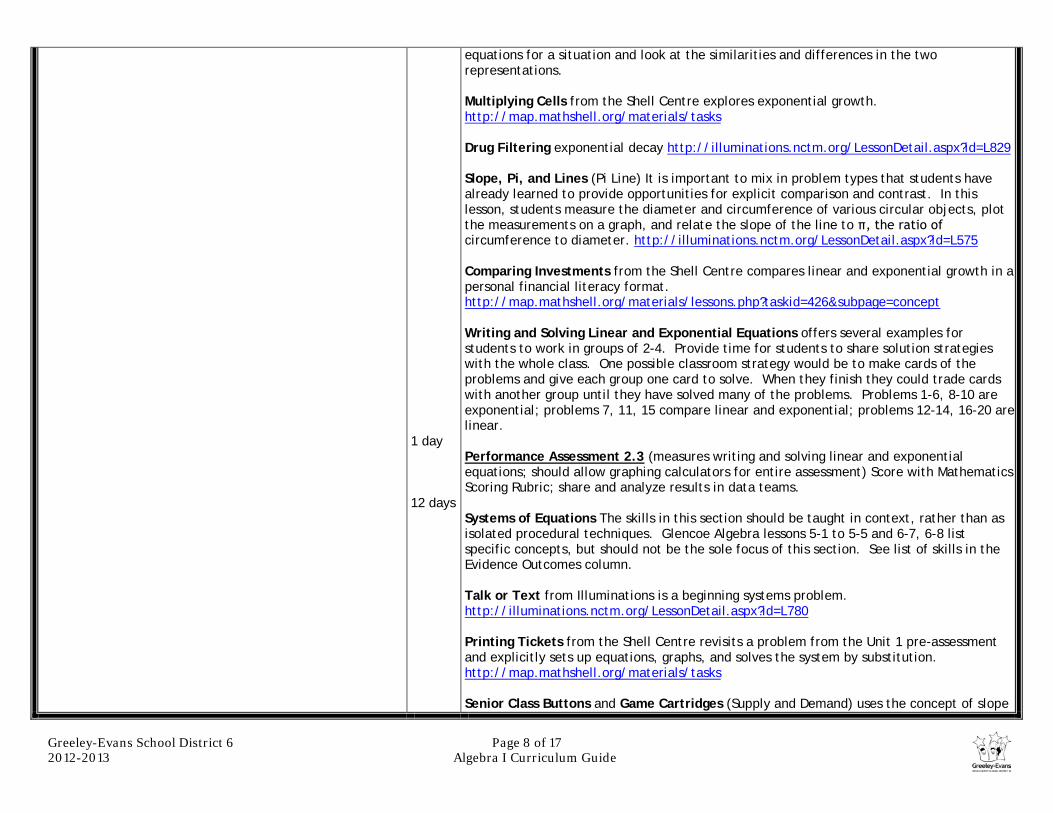
1 day 12 days
equations for a situation and look at the similarities and differences in the two representations. Multiplying Cells from the Shell Centre explores exponential growth. http://map.mathshell.org/materials/tasks Drug Filtering exponential decay http://illuminations.nctm.org/LessonDetail.aspx?id=L829 Slope, Pi, and Lines (Pi Line) It is important to mix in problem types that students have already learned to provide opportunities for explicit comparison and contrast. In this lesson, students measure the diameter and circumference of various circular objects, plot the measurements on a graph, and relate the slope of the line to π, the ratio of circumference to diameter. http://illuminations.nctm.org/LessonDetail.aspx?id=L575 Comparing Investments from the Shell Centre compares linear and exponential growth in a personal financial literacy format. http://map.mathshell.org/materials/lessons.php?taskid=426&subpage=concept Writing and Solving Linear and Exponential Equations offers several examples for students to work in groups of 2-4. Provide time for students to share solution strategies with the whole class. One possible classroom strategy would be to make cards of the problems and give each group one card to solve. When they finish they could trade cards with another group until they have solved many of the problems. Problems 1-6, 8-10 are exponential; problems 7, 11, 15 compare linear and exponential; problems 12-14, 16-20 are linear. Performance Assessment 2.3 (measures writing and solving linear and exponential equations; should allow graphing calculators for entire assessment) Score with Mathematics Scoring Rubric; share and analyze results in data teams. Systems of Equations The skills in this section should be taught in context, rather than as isolated procedural techniques. Glencoe Algebra lessons 5-1 to 5-5 and 6-7, 6-8 list specific concepts, but should not be the sole focus of this section. See list of skills in the Evidence Outcomes column. Talk or Text from Illuminations is a beginning systems problem. http://illuminations.nctm.org/LessonDetail.aspx?id=L780 Printing Tickets from the Shell Centre revisits a problem from the Unit 1 pre-assessment and explicitly sets up equations, graphs, and solves the system by substitution. http://map.mathshell.org/materials/tasks Senior Class Buttons and Game Cartridges (Supply and Demand) uses the concept of slope

Greeley-Evans School District 6 Page 9 of 17 2012-2013 Algebra I Curriculum Guide
Solve systems of equations. Build on student experiences graphing and solving systems of linear equations from middle school and Unit 1 to focus on justification of the methods used. CO-HS.2.PFA.4.d.i-ii; CCSS-HS.A.REI.5-6
• Solve systems of linear equations exactly and approximately (with graphs), focusing on pairs of linear equations in two variables.
• Solve systems with one, infinite, or no solutions. • Explain why the intersection of two functions (linear
or exponential) reveals the solution to the system. • Graph the solutions to one or more linear
inequalities in two variables as a half-plane (dotted or solid lines) or intersection of two half-planes.
1 day 9 days 9 days
with two situations. http://illuminations.nctm.org/LessonDetail.aspx?id=L724 There has to be a System for this Sweet Problem uses the problems Want to Rent a Movie? and The Candy Problem to explore systems. http://illuminations.nctm.org/LessonDetail.aspx?id=L766 Solving Linear Equations in Two Variables from the Shell Centre would be good to use after students have completed some lessons on systems. http://map.mathshell.org/materials/lessons Dirt Bike Dilemma allows students to discover the algorithm for solving linear programming problems and gain conceptual understanding by solving a real-world problem and using graphing calculator applications. http://illuminations.nctm.org/LessonDetail.aspx?id=L685 Defining Regions Using Inequalities is systems of inequalities in a game format. http://map.mathshell.org/materials/tasks Optimization Problems: Boomerangs uses systems of inequalities to solve a business problem (linear programming). http://map.mathshell.org/materials/lessons Performance Assessment 2.4 (measures systems of equations and inequalities) Score with Mathematics Scoring Rubric; share and analyze results in data teams. Interventions and extensions Teacher’s choice of problems and activities for individual students or groups of students. These days may be used at any point in the unit at the teacher’s discretion. Miscellaneous class days Use these days to cover benchmark testing, MSP professional development, and other miscellaneous issues.

Greeley-Evans School District 6 Page 10 of 17 2012-2013 Algebra I Curriculum Guide
Greeley/Evans School District 6 Algebra I Curriculum Guide
Unit 3: Descriptive Statistics Timeline: 19 days 1 day = 43 minutes Will not be taught in 2012-13; added back in 2013-14
Enduring Concept: Visual displays and summary statistics condense the information in data sets into usable knowledge allowing us to solve problems and make decisions that depend on understanding, explaining, and quantifying the variability in data.
Grade Level Expectations (GLE): • Summarize, represent, and interpret data on a single count or measurement variable. • Summarize, represent, and interpret data on two categorical and quantitative variables. • Interpret linear models.
Vocabulary regression residuals standard deviation outlier
categorical data relative frequency correlation coefficient causation
Inquiry Questions: 1. What makes data meaningful or actionable? 2. Why should attention be paid to an unexpected outcome? 3. How can summary statistics or data displays be accurate but misleading? 4. What are some connections between algebra and statistics?
Materials needed for this unit: poster paper deck of cards per group Rockies data rubber bands
Evidence Outcomes Instructional Plan Experience with descriptive statistics began as early as Grade 6. Students were expected to display numerical data and summarize it using measures of center and variability. By the end of middle school they were creating scatterplots and recognizing linear trends in data. This unit builds upon that prior experience, providing students with more formal means of assessing how a model fits data. Students use regression techniques to describe approximately linear relationships between quantities. They use graphical representations and knowledge of the context to make judgments about the appropriateness of linear models. With linear models, they look at residuals to analyze the goodness of fit. Summarize, represent, and interpret data on a single count or measurement variable. In grades 6 – 8, students describe center and spread in a data distribution using median/interquartile range or mean/mean absolute deviation. Here they choose a summary statistic appropriate to the characteristics of the data distribution, such as the shape of the distribution or the existence of extreme data points. Summarize, represent, and interpret data on two categorical and quantitative variables. Students take a more sophisticated look at using a linear function to model the relationship between two numerical variables. In addition to fitting a line to data, students assess how well the model fits by analyzing residuals. Interpret linear models. Build on students’ work with linear relationships in eighth
1 day 3 days 1 day 1 day 2 days
Administer Unit 3 Pre-Assessment (measures descriptive statistics) Score with Mathematics Scoring Rubric; share and analyze results in data teams. This assessment does not get recorded in the grade book, nor should students be expected to correct their mistakes. It is an assessment to let you know what students know before beginning the unit. Discrimination or Not? comes from Navigating through Data Analysis 9-12. It looks at random sampling, simulations, dot plots, histograms, categorical data tables, and measures of center and spread. There is a simulation applet on the CD in the book or students may use playing cards. College Basketball Students have two schools, Air Force and BYU, for which they will make frequency tables, create histograms and answer questions. Consider each group complete one and share results with the class during the summary. Box Plots Good explanation page for teacher understanding. http://web2.concordia.ca/Quality/tools/4boxplots.pdf Rockies Sports Plots Using Rockies hitting/pitching averages to create box plots. http://colorado.rockies.mlb.com/stats/sortable.jsp?c_id=col#playerType=ALL§ionType=sp&statType=hitting&page_type=SortablePlayer&season=2012&season_type=ANY&sportCode='mlb'&league_code='MLB'&split=&team_id=115&active_sw=&game_type='R'&position=&sortOrder='desc'&sortColumn=avg&results=&page=1&perPage=50&timeframe=&extended=0&last_x_days=&ts=1335284387074&tab_level=child&click_text=Sortable+Player+hitting Performance Assessment 3.1 (measures representing and analyzing statistical data) Students will work in groups to make various graphical displays of data and analyze the
Greeley-Evans School District 6 Page 11 of 17 2012-2013 Algebra I Curriculum Guide
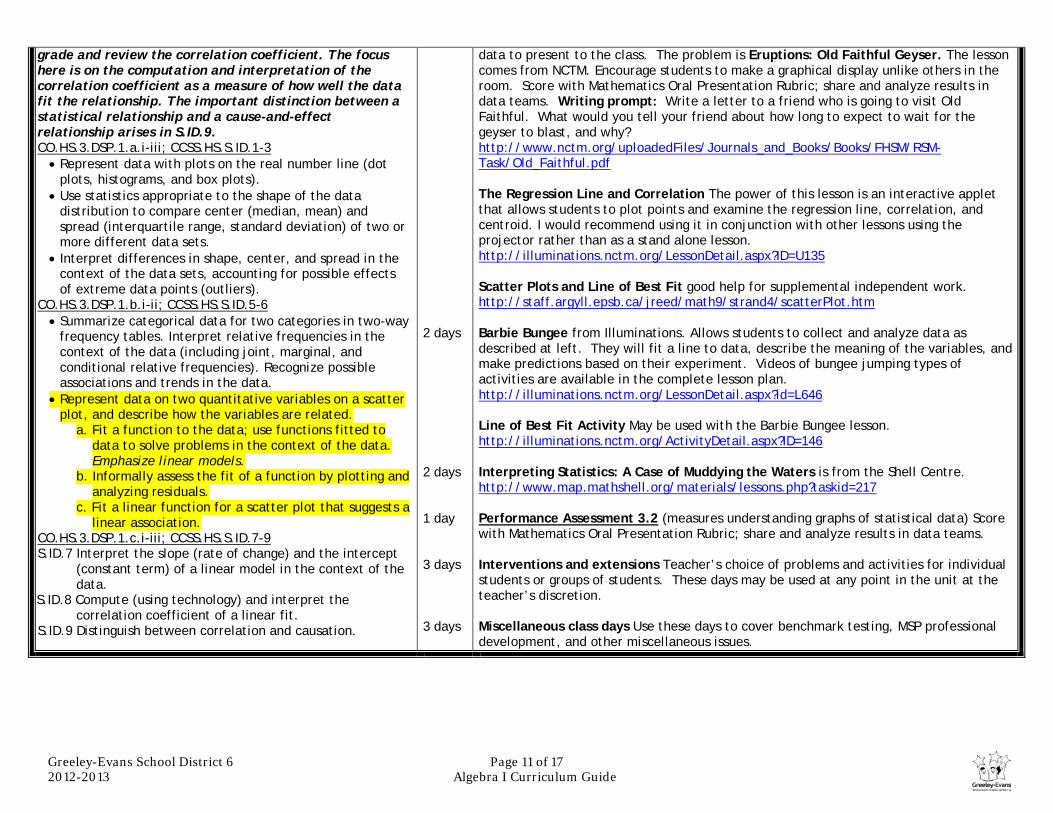
grade and review the correlation coefficient. The focus here is on the computation and interpretation of the correlation coefficient as a measure of how well the data fit the relationship. The important distinction between a statistical relationship and a cause-and-effect relationship arises in S.ID.9. CO.HS.3.DSP.1.a.i-iii; CCSS.HS.S.ID.1-3 • Represent data with plots on the real number line (dot
plots, histograms, and box plots). • Use statistics appropriate to the shape of the data
distribution to compare center (median, mean) and spread (interquartile range, standard deviation) of two or more different data sets.
• Interpret differences in shape, center, and spread in the context of the data sets, accounting for possible effects of extreme data points (outliers).
CO.HS.3.DSP.1.b.i-ii; CCSS.HS.S.ID.5-6 • Summarize categorical data for two categories in two-way
frequency tables. Interpret relative frequencies in the context of the data (including joint, marginal, and conditional relative frequencies). Recognize possible associations and trends in the data.
• Represent data on two quantitative variables on a scatter plot, and describe how the variables are related.
a. Fit a function to the data; use functions fitted to data to solve problems in the context of the data. Emphasize linear models.
b. Informally assess the fit of a function by plotting and analyzing residuals.
c. Fit a linear function for a scatter plot that suggests a linear association.
CO.HS.3.DSP.1.c.i-iii; CCSS.HS.S.ID.7-9 S.ID.7 Interpret the slope (rate of change) and the intercept
(constant term) of a linear model in the context of the data.
S.ID.8 Compute (using technology) and interpret the correlation coefficient of a linear fit.
S.ID.9 Distinguish between correlation and causation.
2 days 2 days 1 day 3 days 3 days
data to present to the class. The problem is Eruptions: Old Faithful Geyser. The lesson comes from NCTM. Encourage students to make a graphical display unlike others in the room. Score with Mathematics Oral Presentation Rubric; share and analyze results in data teams. Writing prompt: Write a letter to a friend who is going to visit Old Faithful. What would you tell your friend about how long to expect to wait for the geyser to blast, and why? http://www.nctm.org/uploadedFiles/Journals_and_Books/Books/FHSM/RSM-Task/Old_Faithful.pdf The Regression Line and Correlation The power of this lesson is an interactive applet that allows students to plot points and examine the regression line, correlation, and centroid. I would recommend using it in conjunction with other lessons using the projector rather than as a stand alone lesson. http://illuminations.nctm.org/LessonDetail.aspx?ID=U135 Scatter Plots and Line of Best Fit good help for supplemental independent work. http://staff.argyll.epsb.ca/jreed/math9/strand4/scatterPlot.htm Barbie Bungee from Illuminations. Allows students to collect and analyze data as described at left. They will fit a line to data, describe the meaning of the variables, and make predictions based on their experiment. Videos of bungee jumping types of activities are available in the complete lesson plan. http://illuminations.nctm.org/LessonDetail.aspx?id=L646 Line of Best Fit Activity May be used with the Barbie Bungee lesson. http://illuminations.nctm.org/ActivityDetail.aspx?ID=146 Interpreting Statistics: A Case of Muddying the Waters is from the Shell Centre. http://www.map.mathshell.org/materials/lessons.php?taskid=217 Performance Assessment 3.2 (measures understanding graphs of statistical data) Score with Mathematics Oral Presentation Rubric; share and analyze results in data teams. Interventions and extensions Teacher’s choice of problems and activities for individual students or groups of students. These days may be used at any point in the unit at the teacher’s discretion. Miscellaneous class days Use these days to cover benchmark testing, MSP professional development, and other miscellaneous issues.

Greeley-Evans School District 6 Page 12 of 17 2012-2013 Algebra I Curriculum Guide
Greeley/Evans School District 6 Algebra I Curriculum Guide
Unit 4: Quadratic Expressions and Equations Timeline: Feb 1 – Mar 28 39 days 5 days for TCAP 1 day = 43 minutes
Enduring Concept: Quadratic expressions and equations model many real situations. Simplifying and solving quadratic expressions and equations helps identify critical information about those real situations.
Grade Level Expectations (GLE): • Interpret the structure of expressions. • Write expressions in equivalent forms to solve problems. • Perform arithmetic operations on polynomials. • Create equations that describe numbers or relationships. • Solve equations and inequalities in one variable. • Solve systems of equations.
Vocabulary quadratic function minimum maximum vertex
zeroes factoring difference of squares
completing the square quadratic formula imaginary numbers
Inquiry Questions:
1. Which algebraic notation is most appropriate for a given situation? (i.e., 21
16.16 vs or ( )( )32.652 ++++ xxvsxx ) 2. What are some similarities in solving all types of equations? 3. Why do different types of equations require different types of solution processes? 4. How can a table, graph, and function notation be used to explain how one function family is different from and/or
similar to another?
Materials needed for this unit: copies of core-plus lessons algebra tiles
Evidence Outcomes Instructional Plan In this unit, students build on their knowledge from unit 2, where they extended the laws of exponents to rational exponents. Students apply this new understanding of number and strengthen their ability to see structure in and create quadratic and exponential expressions. They create and solve equations, inequalities, and systems of equations involving quadratic expressions. Interpret the structure of expressions. Focus on quadratic and exponential expressions. CO.HS.2.PFA.3.a.i-ii; CCSS.HS.A.SSE.1-2 • Interpret expressions that represent a quantity in terms of its
context.★ a. Interpret parts of an expression, such as terms, factors,
and coefficients. b. Interpret complicated expressions by viewing one or
more of their parts as a single entity. • Use the structure of an expression to identify ways to rewrite
it. Perform arithmetic operations on polynomials. Focus on polynomial expressions that simplify to forms that are linear or quadratic in a positive integer power of x. CO.HS.2.PFA.3.c: CCSS.HS.A.APR.1
1 day 2 days 5 days
Administer Unit 4 Pre-Assessment (measures system, function notation, laws of exponents, graphing line) Score with Mathematics Scoring Rubric; share and analyze results in data teams. This assessment does not get recorded in the grade book, nor should students be expected to correct their mistakes. It is an assessment to let you know what students know before beginning the unit. Simplifying Radicals is a power point with clear examples. This is planned as an introduction rather than as a mastery lesson. We want students to gain experience that can be built on in this and future units. Algebra I students don’t need to know how to rationalize denominators, but the rest is a nice presentation. http://www.wcs.k12.va.us/users/honaker/math-ppt/SimplifyingRadicals.ppt Building Powerful Numeracy for Middle and High School Students by Pamela Weber Harris, 2011. The whole book is very good for helping teachers set up numeracy lessons, but the pages included in the guide may help you think about algebraic reasoning in a more visual way. This could be very beneficial since many adolescents are visual learners. Core Plus Lesson 2 is a business application of polynomials. Through the application, students will learn how to create polynomials from contexts and how to rewrite them in equivalent forms. You should work through the student pages before you read the teacher pages so you have experience with common mistakes students will make. Student pages are every other page with teaching notes on the T-pages. Students should work in carefully assigned groups of 3 or 4. Establish

Greeley-Evans School District 6 Page 13 of 17 2012-2013 Algebra I Curriculum Guide
• Understand that polynomials form a system analogous to the integers, namely, they are closed under the operations of addition, subtraction, and multiplication; add, subtract, and multiply polynomials.
Write expressions in equivalent forms to solve problems. It is important to balance conceptual understanding and procedural fluency in work with equivalent expressions. For example, development of skill in factoring and completing the square goes hand-in-hand with understanding what different forms of a quadratic expression reveal. CO.HS.2.PFA.3.b.i; CCSS.HS.A.SSE.3 • Choose and produce an equivalent form of an expression to
reveal and explain properties of the quantity represented by the expression.★
a. Factor a quadratic expression to reveal the zeros of the function it defines.
b. Complete the square in a quadratic expression to reveal the maximum or minimum value of the function it defines.
c. Use the properties of exponents to transform expressions for exponential functions.
Create equations that describe numbers or relationships. Extend work on linear and exponential equations in Unit 1 to quadratic equations. CO.HS.2.PFA.4.a.i, ii, iv; CCSS.HS.A.CED.1,2,4 • Create equations and inequalities in one variable and use
them to solve problems. Include equations arising from linear and quadratic functions, and simple rational and exponential functions.
• Create equations in two or more variables to represent relationships between quantities; graph equations on coordinate axes with labels and scales.
• Rearrange formulas to highlight a quantity of interest, using the same reasoning as in solving equations. Extend to formulas involving squared variables.
Solve equations and inequalities in one variable. Students should learn of the existence of the complex number system, but will not solve quadratics with complex solutions until Algebra II. CO.HS.2.PFA.4.c.ii; CCSS.HS.A.REI.4 • Solve quadratic equations in one variable.
a. Use the method of completing the square to transform
1 day 6 days
1 day 6 days 1 day 2 days
norms with groups, such as one person must read the problem aloud, the group discusses the problem aloud, every student writes answers on their own paper. Resource pages are at the end of the unit.
• Investigation 1 How to Succeed in Business • Investigation 2 Equivalent Expressions • Investigation 3 What a Difference Subtraction Makes • MORE Problems: Modeling 3-4, Organizing 1,2,3, Reflecting 1,3, Extending 2
Performance Assessment 4.1 (measures simple radicals, polynomials, properties) Score with Mathematics Scoring Rubric; share and analyze results in data teams. Core Plus Lesson 3 introduces height over time and school dance situations to explore factoring and products. Work through the student pages before you read the teacher pages. Student pages are every other page with teaching notes on the T-pages. Students should work in carefully assigned groups of 3 or 4. Establish norms with groups, such as one person must read the problem aloud, the group discusses the problem aloud, every student writes answers on their own paper.
•Investigation 1 Products and Factoring •Investigation 2 Special Products and Factoring •Investigation 3 Division and Fractions •MORE Problems: Modeling 1,3 Organizing 1,2,3 Reflecting 2,4 Extending 1
Performance Assessment 4.2 (measures extended distributive property, factoring, simplifying simple rational expressions) Score with Mathematics Scoring Rubric; share and analyze results in data teams. Core Plus Lesson 4 contains linear and quadratic business applications. Students have an opportunity to refine their skills with linear functions and learn to use the quadratic formula in a way that is different from the way most of us learned. Please read the teacher pages carefully.
•Investigation 1 Reasoning about Linear Equations and Inequalities •Investigation 2 Reasoning about Quadratic Equations and Inequalities •MORE problems: Modeling 3,4 Organizing 1,2,3 Reflecting 5 Extending 1
Performance Assessment 4.3 (measures reasoning with linear inequalities, reasoning about quadratic equations using the quadratic formula) Score with Mathematics Scoring Rubric; share and analyze results in data teams. Completing the Square with the Area Model introduces students to a very difficult topic in a visual way. Though the description begins with a difficult problem, students should begin with quadratics in which 1=a . Students will appreciate your explicit modeling of how to think about making a square from the quadratic and drawing the problem with them. Consider letting students make up the quadratic equations that they will solve.

Greeley-Evans School District 6 Page 14 of 17 2012-2013 Algebra I Curriculum Guide
any quadratic equation in x into an equation of the form (x – p)2 = q that has the same solutions. Derive the quadratic formula from this form.
b. Solve quadratic equations by inspection (e.g., for x2 = 49), taking square roots, completing the square, the quadratic formula and factoring, as appropriate to the initial form of the equation. Recognize when the quadratic formula gives complex solutions.
Solve systems of equations. Include systems consisting of one linear and one quadratic equation. Include systems that lead to work with fractions. CO.HS.2.PFA.4.d.iii; CCSS.HS.A.REI.7 • Solve a simple system consisting of a linear equation and a
quadratic equation in two variables algebraically and graphically.
2 days 5 days 7 days
Blast Off: Water-Balloon Contest should be completed in groups of 2-4. This will be an opportunity for students to put together all they have learned about quadratics in this unit. Use it to collect data about what your students are able to do and what they still need to explore. Interventions and extensions Teacher’s choice of problems and activities for individual students or groups of students. These days may be used at any point in the unit at the teacher’s discretion. Miscellaneous class days Use these days to cover TCAP, MSP professional development, and other miscellaneous issues.

Greeley-Evans School District 6 Page 15 of 17 2012-2013 Algebra I Curriculum Guide
Greeley/Evans School District 6 Algebra I Curriculum Guide
Unit 5: Function Families and Modeling Timeline: Apr 8 – May 21 32 days 1 day = 43 minutes
Enduring Concept: Functions model situations where one quantity determines another and can be represented algebraically, graphically, and using tables. The exploration of multiple representations of functions develops a deeper understanding of the relationship between the variables in the function.
Grade Level Expectations (GLE): • Use properties of rational and irrational numbers. • Interpret functions that arise in applications in terms of a context. • Analyze functions using different representations. • Build a function that models a relationship between two quantities. • Build new functions from existing functions. • Construct and compare linear, quadratic, and exponential models and solve problems.
Vocabulary modeling linear function exponential function quadratic function
absolute value function step function piecewise-defined function square-root function
Inquiry Questions: 1. Why are relations and functions represented in multiple ways? 2. How can a table, graph, and function notation be used to explain how one function family is different
from and/or similar to another? 3. What is an inverse? 4. How is “inverse function” most likely related to addition and subtraction being inverse operations and to
multiplication and division being inverse operations? 5. How do symbolic transformations affect an equation, inequality, or expression? 6. What phenomena can be modeled with particular functions?
Materials needed for this unit: card stock empty 2-liter bottles 1-cup measuring tool various catalogs showing shipping costs chain, such as bicycle chain
Evidence Outcomes Instructional Plan In preparation for work with quadratic relationships students explore distinctions between rational and irrational numbers. They consider quadratic functions, comparing the key characteristics of quadratic functions to those of linear and exponential functions. They select from among these functions to model phenomena. Students learn to anticipate the graph of a quadratic function by interpreting various forms of quadratic expressions. In particular, they identify the real solutions of a quadratic equation as the zeros of a related quadratic function. Students learn that when quadratic equations do not have real solutions the number system must be extended so that solutions exist, analogous to the way in which extending the whole numbers to the negative numbers allows x+1 = 0 to have a solution. Formal work with complex numbers comes in Algebra II. Students expand their experience with functions to include more specialized functions—absolute value, step, and those that are piecewise-defined. Use properties of rational and irrational numbers. CO.HS.1.NPO.1.b.i; CCSS.HS.N.RN.3
1 day 2 days
Unit 5 Pre-Assessment (measures matching functions to their graphs) Score with Mathematics Scoring Rubric; share and analyze results in data teams. This assessment does not get recorded in the grade book, nor should students be expected to correct their mistakes. It is an assessment to let you know what students know before beginning the unit. Students should also complete Is It Rational? in preparation for the lesson below. Be sure to collect the papers for analysis prior to the lesson. The web address to find complete lesson plans is listed below each 9-12 algebra Illuminations lesson. Rational and Irrational Numbers 2 from the Shell Centre. Be sure to read the teacher pages carefully before beginning the lesson. Students must complete the classification pre-assessment prior to beginning the lesson; consider using this along with the Unit 5 pre-assessment in one day. This unit is all about fitting mathematical models to varying situations. Students will be presented many different situations, some real-world and some interesting patterns, for which they will be creating mathematical rules to model. In the each section of this unit you should emphasize comparing and contrasting any types of functions studied thus far. Look for opportunities to compare key features of graphs including intercepts, shape, domain/range, symmetry, relative maximum/minimum,

Greeley-Evans School District 6 Page 16 of 17 2012-2013 Algebra I Curriculum Guide
• Explain why the sum or product of two rational numbers is rational; that the sum of a rational number and an irrational number is irrational; and that the product of a nonzero rational number and an irrational number is irrational.
Interpret functions that arise in applications in terms of a context. Focus on quadratic functions; compare with linear and exponential functions studied in Algebra I. CO.HS.2.PFA.1.b.i-iii; CCSS.HS.F.IF.4-6 • For a function that models a relationship between two
quantities, interpret key features of graphs and tables in terms of the quantities, and sketch graphs showing key features given a verbal description of the relationship.
• Relate the domain of a function to its graph and, where applicable, to the quantitative relationship it describes. For example, if the function h(n) gives the number of person-hours it takes to assemble n engines in a factory, then the positive integers would be an appropriate domain for the function.★
• Calculate and interpret the average rate of change of a function (presented symbolically or as a table) over a specified interval. Estimate the rate of change from a graph.★
Build a function that models a relationship between two quantities. Focus on situations that exhibit a quadratic relationship. CO.HS.2.PFA.1.d.i.1-2; CCSS.HS.F.BF.1.a-b • Write a function that describes a relationship between
two quantities.★ a. Determine an explicit expression, a recursive process,
or steps for calculation from a context. b. Combine standard function types using arithmetic
operations. Construct and compare linear, quadratic, and exponential models and solve problems. CO.HS.2.PFA.2.a.iii; CCSS.HS.F.LE.3 Observe using graphs and tables that a quantity increasing exponentially eventually exceeds a quantity increasing linearly or quadratically. Analyze functions using different representations. CO.HS.2.PFA.1.c.i-vi.1-3; CCSS.HS.F.IF.7-9 • Graph functions expressed symbolically and show key
6 days 1 day 5 days
positive/negative, end behavior and increasing/decreasing at constant/increasing/decreasing rates. The Big Race is a cooperative learning lesson that reviews linear growth with time-distance graphs. Students have worked on this concept in 8th grade math as well as science classes. Egg Launch Contest presents another look at quadratic functions. http://illuminations.nctm.org/LessonDetail.aspx?id=L738 Polygon Chains explores linear functions, but don’t give this away prior to the exploration. Lesson plan is in notebook. Think of a Graph (All in the Family) from Illuminations requires different groups to analyze different sets of data to determine the type of function it represents. Five are simple linear or quadratic functions, with one square root function. http://illuminations.nctm.org/LessonDetail.aspx?id=L619 Performance Assessment 5.1 (measures fitting mathematical models to linear and quadratic contexts) You should expect an exact linear equation ( xy 213−= ), but only an approximate quadratic equation depending on the accuracy of students drawings, something close to ( )( )60 −−= xxy . Score with Mathematics Scoring Rubric; share and analyze results in data teams. Are You Interested in Stretching Your Dollars? From NCTM Math Notes is a financial literacy lesson that works with exponential growth and percentages. http://www.nctm.org/publications/article.aspx?id=22317 Sale! From the Shell Centre continues the look at percentages but works with decreasing the total. This might be good as a homework assignment. http://www.map.mathshell.org/materials/tasks.php?taskid=269&subpage=apprentice Hanging Chains (Note that the actual shape of the curve formed by a hanging chain is a catenary, but it is not necessary to discuss this aspect with students. Such a discussion can be saved for later, unless a student who already knows about catenaries brings it up. For the purpose of this activity, it can be assumed that the shape formed by the necklace is a parabola, and its curve can be approximated by a quadratic function.) This lesson requires students will choose points on a graph, substitute them into the general quadratic equation and solve a system of equations to find the quadratic equation that best fits the hanging chain. http://illuminations.nctm.org/LessonDetail.aspx?id=L628 Patchwork linear and quadratic models. Students should be expected to show their algebraic answers in the pictures on the front page. http://www.map.mathshell.org/materials/tasks.php?taskid=251&subpage=apprentice

Greeley-Evans School District 6 Page 17 of 17 2012-2013 Algebra I Curriculum Guide
features of the graph, by hand in simple cases and using technology for more complicated cases.★
a. Graph linear and quadratic functions and show intercepts, maxima, and minima.
b. Graph piecewise-defined functions, including step functions and absolute value functions.
• Write a function defined by an expression in different but equivalent forms to reveal and explain different properties of the function. a. Use the process of factoring and completing the
square in a quadratic function to show zeros, extreme values, and symmetry of the graph, and interpret these in terms of a context. Extend work with quadratics to include the relationship between coefficients and roots, and that once roots are known, a quadratic equation can be factored.
b. Use the properties of exponents to interpret expressions for exponential functions.
• Compare properties of two functions (linear, exponential, or quadratic) each represented in a different way (algebraically, graphically, numerically in tables, or by verbal descriptions). For example, given a graph of one quadratic function and an algebraic expression for another, say which has the larger maximum.
Build new functions from existing functions. CO.HS.2.PFA.1.i-iii; CCSS.HS.F.BF.3-4a • Identify the effect on the graph of replacing f(x) by f(x) +
k, k f(x), f(kx), and f(x + k) for specific values of k (both positive and negative); find the value of k given the graphs. Experiment with cases and illustrate an explanation of the effects on the graph using technology.
• Find inverse functions. a. Solve an equation of the form f(x) = c for a simple
function f that has an inverse and write an expression for the inverse. Focus on linear functions but consider simple situations where the domain of the function must be restricted in order for the inverse to exist, such as f(x) = x2, x>0.
1 day 6 days 1 day 4 days 5 days
Performance Assessment 5.2 (measures using mathematical models to compare linear, exponential and quadratic contexts) Score with Mathematics Scoring Rubric; share and analyze results in data teams. Choices for Piecewise Functions include: Piecing Together Piecewise Functions This lesson uses shipping costs from different catalogs so that each group has its own problem to present during the summary. Adapted from http://www.pctm.org/magazine/PiecewiseFunctions_Storm.pdf The Cost of Entertainment, Custom Greeting Cards, Cell Phone Plan Pricing from Make It Real Learning by Frank C. Wilson. I would have different groups each complete one of these and share poster size graphs with the class. Use craft paper and have students construct their graphs then go over them with markers. Step Functions Gives students an opportunity to explore a different type of piecewise function. Absolute Value Functions are introduced here as an extension of piecewise functions. I would not spend an entire day on this activity. Transforming Functions This investigation brings together all of the functions students have studied this year in an exploration of transformations. Students will use graphing calculators to graph the basic function of a family and compare it to the transformation given. Inverse Functions Most of the functions are linear, though simple quadratic functions are included for students who complete linear functions easily. Students should sketch each function and its inverse on the same grid, looking for patterns. Having students use the “friendly window” gives a view that is in perspective. During the summary or as you rotate through the groups, have students graph the line y = x with a dotted line on the same graph. Performance Assessment 5.3 (measures piecewise functions, transformations, inverse functions) Score with Mathematics Scoring Rubric; share and analyze results in data teams. Interventions and extensions Teacher’s choice of problems and activities for individual students or groups of students. These days may be used at any point in the unit at the teacher’s discretion. Miscellaneous class days Use these days to cover benchmark testing, MSP professional development, and other miscellaneous issues.
Greeley-Evans School District 6 Page 1 of 17 2012-2013 Algebra 2 Curriculum Guide
Greeley /Evans School District 6 Algebra II Curriculum Guide
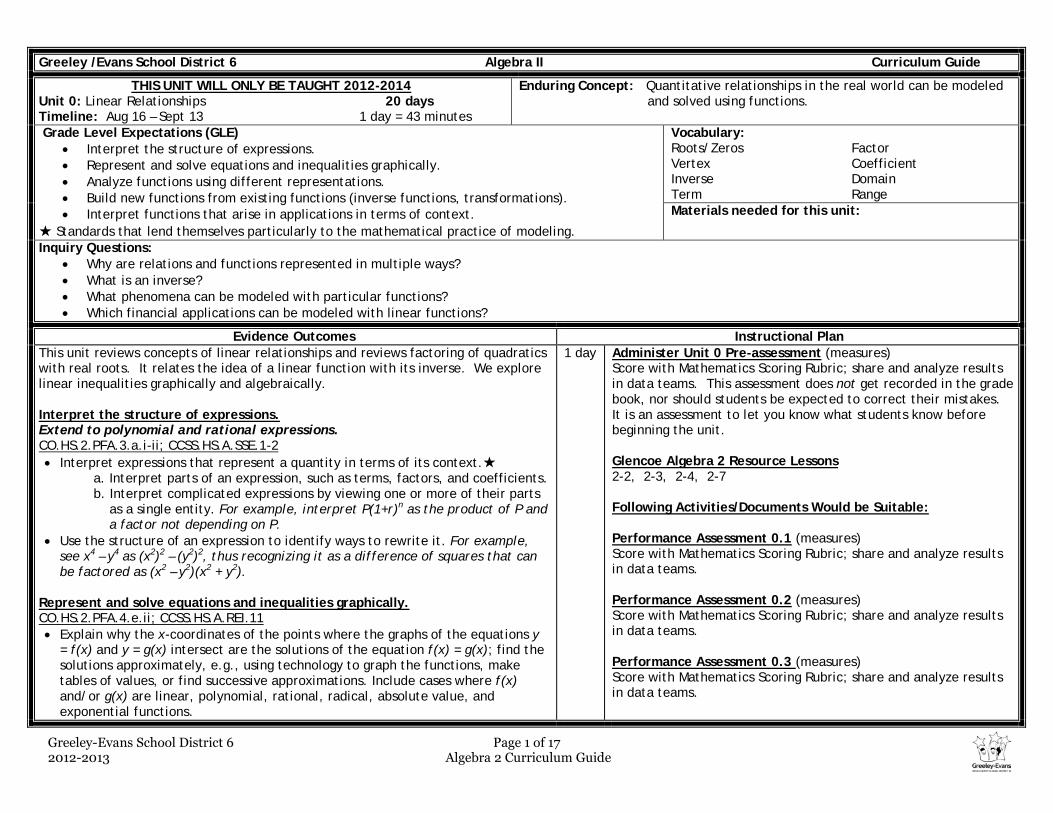
THIS UNIT WILL ONLY BE TAUGHT 2012-2014 Unit 0: Linear Relationships 20 days Timeline: Aug 16 – Sept 13 1 day = 43 minutes
Enduring Concept: Quantitative relationships in the real world can be modeled and solved using functions.
Grade Level Expectations (GLE) • Interpret the structure of expressions. • Represent and solve equations and inequalities graphically. • Analyze functions using different representations. • Build new functions from existing functions (inverse functions, transformations). • Interpret functions that arise in applications in terms of context.
★ Standards that lend themselves particularly to the mathematical practice of modeling.
Vocabulary: Roots/Zeros Vertex Inverse Term
Factor Coefficient Domain Range
Materials needed for this unit:
Inquiry Questions: • Why are relations and functions represented in multiple ways? • What is an inverse? • What phenomena can be modeled with particular functions? • Which financial applications can be modeled with linear functions?
Evidence Outcomes Instructional Plan This unit reviews concepts of linear relationships and reviews factoring of quadratics with real roots. It relates the idea of a linear function with its inverse. We explore linear inequalities graphically and algebraically. Interpret the structure of expressions. Extend to polynomial and rational expressions. CO.HS.2.PFA.3.a.i-ii; CCSS.HS.A.SSE.1-2 • Interpret expressions that represent a quantity in terms of its context.★
a. Interpret parts of an expression, such as terms, factors, and coefficients. b. Interpret complicated expressions by viewing one or more of their parts
as a single entity. For example, interpret P(1+r)n as the product of P and a factor not depending on P.
• Use the structure of an expression to identify ways to rewrite it. For example, see x4 – y4 as (x2)2 – (y2)2, thus recognizing it as a difference of squares that can be factored as (x2 – y2)(x2 + y2).
Represent and solve equations and inequalities graphically. CO.HS.2.PFA.4.e.ii; CCSS.HS.A.REI.11 • Explain why the x-coordinates of the points where the graphs of the equations y
= f(x) and y = g(x) intersect are the solutions of the equation f(x) = g(x); find the solutions approximately, e.g., using technology to graph the functions, make tables of values, or find successive approximations. Include cases where f(x) and/or g(x) are linear, polynomial, rational, radical, absolute value, and exponential functions.
1 day Administer Unit 0 Pre-assessment (measures) Score with Mathematics Scoring Rubric; share and analyze results in data teams. This assessment does not get recorded in the grade book, nor should students be expected to correct their mistakes. It is an assessment to let you know what students know before beginning the unit. Glencoe Algebra 2 Resource Lessons 2-2, 2-3, 2-4, 2-7 Following Activities/Documents Would be Suitable: Performance Assessment 0.1 (measures) Score with Mathematics Scoring Rubric; share and analyze results in data teams. Performance Assessment 0.2 (measures) Score with Mathematics Scoring Rubric; share and analyze results in data teams. Performance Assessment 0.3 (measures) Score with Mathematics Scoring Rubric; share and analyze results in data teams.
Greeley-Evans School District 6 Page 2 of 17 2012-2013 Algebra 2 Curriculum Guide
Analyze functions using different representations. CO.HS.2.PFA.1.c.iv; CCSS.HS.F.IF.7c • Graph functions expressed symbolically and show key features of the graph, by
hand in simple cases and using technology for more complicated cases.★ c. Graph polynomial functions, identifying zeros when suitable factorizations
are available, and showing end behavior. Relate to the relationship between zeros of quadratic functions and their factored forms.
Build new functions from existing functions. CO.HS.2.PFA.1.e.i; CCSS.HS.3.F.BF.3 • Identify the effect on the graph of replacing f(x) by f(x) + k, k f(x), f(kx), and
f(x + k) for specific values of k (both positive and negative); find the value of k given the graphs. Experiment with cases and illustrate an explanation of the effects on the graph using technology. Include recognizing even and odd functions from their graphs and algebraic expressions for them.
• Find inverse functions. a. Solve an equation of the form f(x) = c for a simple function f that has an inverse and write an expression for the inverse. For example, f(x) = 2 x3 or f(x) = (x+1)/(x-1) for x≠1.
Interpret functions that arise in applications in terms of context. CO.HS.2.PFA.1.b.i-iii; CCSS.HS.F.IF.4-6 • For a function that models a relationship between two quantities, interpret key
features of graphs and tables in terms of the quantities, and sketch graphs showing key features given a verbal description of the relationship. Key features include: intercepts; intervals where the function is increasing, decreasing, positive, or negative; relative maximums and minimums; symmetries; end behavior; and periodicity.★
• Relate the domain of a function to its graph and, where applicable, to the quantitative relationship it describes. For example, if the function h(n) gives the number of person-hours it takes to assemble n engines in a factory, then the positive integers would be an appropriate domain for the function.★
• Calculate and interpret the average rate of change of a function (presented symbolically or as a table) over a specified interval. Estimate the rate of change from a graph.★
Performance Assessment 0.4 (measures) Score with Mathematics Scoring Rubric; share and analyze results in data teams. This test needs to be entered into Galileo. Interventions and extensions Teacher’s choice of problems and activities for individual students or groups of students. These days may be used at any point in the unit at the teacher’s discretion. Miscellaneous class days Use these days to cover benchmark testing, MSP professional development, and other miscellaneous issues.
Greeley-Evans School District 6 Page 3 of 17 2012-2013 Algebra 2 Curriculum Guide
Greeley /Evans School District 6 Algebra II Curriculum Guide
Unit 1: Quadratic Relationships and Absolute Value Functions 32 days Timeline: Sep 14 – Oct 30 1 day = 43 minutes
Enduring Concept: Quantitative relationships in the real world can be modeled and solved using functions.
Grade Level Expectations (GLE) • Factor quadratic equations. This bullet should be removed for the 2014-2015 school year. • Understand the relationship between zeros and factors of polynomials. • Perform arithmetic operations with complex numbers. • Use complex numbers in polynomial identities and equations. • Interpret the structure of expressions. • Use polynomial identities to solve problems. • Represent and solve equations and inequalities graphically. • Analyze functions using different representations. • Build new functions from existing functions (inverse functions, transformations). • Interpret functions that arise in applications in terms of context.
★ Standards that lend themselves particularly to the mathematical practice of modeling.
Vocabulary: complex number conjugate pair quadratic coefficient
Factor Inverses Transformations Fundamental Theorem of Algebra
Materials needed for this unit:
Inquiry Questions: • Are there more complex numbers than real numbers? • How do symbolic transformations affect an equation, inequality, or expression? • When is it appropriate to simplify expressions? • The ancient Greeks multiplied binomials and found the roots of quadratic equations without algebraic notation. How can this be done? • Why do different types of equations require different types of solution processes? • Can computers solve algebraic problems that people cannot solve? Why?
Evidence Outcomes Instructional Plan This unit develops the structural similarities between the system of quadratics and the system of integers. Students draw on analogies between quadratic arithmetic and base-ten computation, focusing on properties of operations, particularly the distributive property. Students identify zeros of quadratics, including complex zeros of quadratic polynomials, and make connections between zeros of quadratics and solutions of quadratic equations. The unit culminates with the fundamental theorem of algebra. Factor quadratic equations. This bullet should be removed for the 2014-2015 school year. Understand the relationship between zeros and factors of polynomials. CO.HS.2.PFA.3.d.i-ii; CCSS.HS.A.APR.2-3 • Identify zeros of polynomials when suitable factorizations are available,
and use the zeros to construct a rough graph of the function defined by the polynomial.
Perform arithmetic operations with complex numbers.
1 day Administer Unit 1 Pre-assessment (measures ) Score with Mathematics Scoring Rubric; share and analyze results in data teams. This assessment does not get recorded in the grade book, nor should students be expected to correct their mistakes. It is an assessment to let you know what students know before beginning the unit. Glencoe Algebra 2 Resource Lessons 5-1 5-2 5-3 (REMOVED 2014-2015) 5-4 5-5 5-6 5-7 5-8 Following Activities/Documents Would be Suitable: Complex Number Bingo

Greeley-Evans School District 6 Page 4 of 17 2012-2013 Algebra 2 Curriculum Guide
CO.HS.1.NPO.1.c.i-ii; CCSS.HS.N.CN.1-2 • Know there is a complex number i such that i2 = −1, and every complex
number has the form a + bi with a and b real. • Use the relation i2 = –1 and the commutative, associative, and
distributive properties to add, subtract, and multiply complex numbers. Use complex numbers in polynomial identities and equations. CO.HS.1.NPO.7; CCSS.HS.N.CN.7-9 • Solve quadratic equations with real coefficients that have complex
solutions. • (+) Know the Fundamental Theorem of Algebra; show that it is true for
quadratic polynomials.
Interpret the structure of expressions. Extend to polynomial and rational expressions. CO.HS.2.PFA.3.a.i-ii; CCSS.HS.A.SSE.1-2 • Interpret expressions that represent a quantity in terms of its context.★
a. Interpret parts of an expression, such as terms, factors, and coefficients.
b. Interpret complicated expressions by viewing one or more of their parts as a single entity. For example, interpret P(1+r)n as the product of P and a factor not depending on P.
• Use the structure of an expression to identify ways to rewrite it. For example, see x4 – y4 as (x2)2 – (y2)2, thus recognizing it as a difference of squares that can be factored as (x2 – y2)(x2 + y2).
Use polynomial identities to solve problems. This cluster has many possibilities for optional enrichment, such as relating the example in A.APR.4 to the solution of the system u2+v2=1, v = t(u+1), relating the Pascal triangle property of binomial coefficients to (x+y)n+1 = (x+y)(x+y)n, deriving explicit formulas for the coefficients, or proving the binomial theorem by induction. CO.HS.2.PFA.3.e.i; CCSS.HS.A.APR.4-5 • Prove polynomial identities and use them to describe numerical
relationships. For example, the polynomial identity (x2 + y2)2 = (x2 – y2)2 + (2xy)2 can be used to generate Pythagorean triples.
Represent and solve equations and inequalities graphically. CO.HS.2.PFA.4.e.ii; CCSS.HS.A.REI.11 • Explain why the x-coordinates of the points where the graphs of the
equations y = f(x) and y = g(x) intersect are the solutions of the equation f(x) = g(x); find the solutions approximately, e.g., using technology to graph the functions, make tables of values, or find successive
Addition and Subtraction of Complex Numbers Completing the Square with an Area Model Solving Quadratic Equations: Cutting Corners Performance Assessment 1.1 (measures) Score with Mathematics Scoring Rubric; share and analyze results in data teams. Performance Assessment 1.2 (measures) Score with Mathematics Scoring Rubric; share and analyze results in data teams. Performance Assessment 1.3 (measures) Score with Mathematics Scoring Rubric; share and analyze results in data teams. Performance Assessment 1.4 (measures) Score with Mathematics Scoring Rubric; share and analyze results in data teams. This test needs to be entered into Galileo. Introduction to Imaginary and Complex numbers http://www.mathworksheetsgo.com/downloads/algebra-2/complex-numbers/imaginary-numbers-worksheet.pdf Complex Number Bingo http://www.regentsprep.org/Regents/math/algtrig/ATO6/ComplexRes.htm Addition and Subtraction of Complex Numbers http://www.mathworksheetsgo.com/downloads/algebra-2/complex-numbers/add-subtract-complex-numbers-worksheet.pdf Interventions and extensions Teacher’s choice of problems and activities for individual students or groups of students. These days may be used at any point in the unit at the teacher’s discretion. Miscellaneous class days Use these days to cover benchmark testing, MSP professional development, and other miscellaneous issues.

Greeley-Evans School District 6 Page 5 of 17 2012-2013 Algebra 2 Curriculum Guide
approximations. Include cases where f(x) and/or g(x) are linear, polynomial, rational, radical, absolute value, and exponential functions.
Analyze functions using different representations. CO.HS.2.PFA.1.c.iv; CCSS.HS.F.IF.7c • Graph functions expressed symbolically and show key features of the
graph, by hand in simple cases and using technology for more complicated cases.★
c. Graph polynomial functions, identifying zeros when suitable factorizations are available, and showing end behavior. Relate to the relationship between zeros of quadratic functions and their factored forms.
Build new functions from existing functions. CO.HS.2.PFA.1.e.i; CCSS.HS.3.F.BF.3 • Identify the effect on the graph of replacing f(x) by f(x) + k, k f(x),
f(kx), and f(x + k) for specific values of k (both positive and negative); find the value of k given the graphs. Experiment with cases and illustrate an explanation of the effects on the graph using technology. Include recognizing even and odd functions from their graphs and algebraic expressions for them.
• Find inverse functions. a. Solve an equation of the form f(x) = c for a simple function f that has an inverse and write an expression for the inverse. For example, f(x) = 2 x3 or f(x) = (x+1)/(x-1) for x≠1.
Interpret functions that arise in applications in terms of context. CO.HS.2.PFA.1.b.i-iii; CCSS.HS.F.IF.4-6 • For a function that models a relationship between two quantities,
interpret key features of graphs and tables in terms of the quantities, and sketch graphs showing key features given a verbal description of the relationship. Key features include: intercepts; intervals where the function is increasing, decreasing, positive, or negative; relative maximums and minimums; symmetries; end behavior; and periodicity.★
• Relate the domain of a function to its graph and, where applicable, to the quantitative relationship it describes. For example, if the function h(n) gives the number of person-hours it takes to assemble n engines in a factory, then the positive integers would be an appropriate domain for the function.★
• Calculate and interpret the average rate of change of a function (presented symbolically or as a table) over a specified interval. Estimate the rate of change from a graph.★

Greeley-Evans School District 6 Page 6 of 17 2012-2013 Algebra 2 Curriculum Guide
Greeley /Evans School District 6 Algebra II Curriculum Guide
Unit 2: Polynomial Relationships 34 days Timeline: Oct 31 – Dec 13 1 day = 43 minutes
Enduring Concept: Quantitative relationships in the real world can be modeled and solved using functions.
Grade Level Expectations (GLE) • Perform arithmetic operations with complex numbers. • Use complex numbers in polynomial identities and equations. • Interpret the structure of expressions. • Write expressions in equivalent forms to solve problems. • Perform arithmetic operations on polynomials. • Understand the relationship between zeros and factors of polynomials. • Use polynomial identities to solve problems. • Represent and solve equations and inequalities graphically. • Analyze functions using different representations. • Build new functions from existing functions (inverse functions, transformations). • Interpret functions that arise in applications in terms of context.
★ Standards that lend themselves particularly to the mathematical practice of modeling.
Vocabulary: Polynomial Binomial Theorem Remainder Theorem Synthetic Division Arithmetic Operations Identity Geometric Series???? Materials needed for this unit:
Inquiry Questions: • Why are relations and functions represented in multiple ways? • How do symbolic transformations affect an equation, inequality, or expression? • How could you visualize a function with four variables, such as ? • Why couldn’t people build skyscrapers without using functions?
Evidence Outcomes Instructional Plan This unit develops the structural similarities between the system of polynomials and the system of integers. Students draw on analogies between polynomial arithmetic and base-ten computation, focusing on properties of operations, particularly the distributive property. Students connect multiplication of polynomials with multiplication of multi-digit integers, and division of polynomials with long division of integers. Students identify zeros of polynomials, including complex zeros of quadratic polynomials, and make connections between zeros of polynomials and solutions of polynomial equations. The unit culminates with the fundamental theorem of algebra. Perform arithmetic operations with complex numbers. CO.HS.1.NPO.1.c.i-ii; CCSS.HS.N.CN.1-2 • Know there is a complex number i such that i2 = −1, and every complex number has the form
a + bi with a and b real. • Use the relation i2 = –1 and the commutative, associative, and distributive properties to add,
subtract, and multiply complex numbers. Use complex numbers in polynomial identities and equations. CO.HS.1.NPO.7; CCSS.HS.N.CN.7-9 • Solve quadratic equations with real coefficients that have complex solutions. • (+) Know the Fundamental Theorem of Algebra; show that it is true for quadratic polynomials.
1 day
Glencoe Algebra 2 Resource Lessons 6-1, 6-2, 6-3, 6-4, 6-6, 6-7, 6-8, 6-9 Following Activities/Documents Would be Suitable: Patterns in Pascal’s Triangle Patchwork Activity Manipulating Polynomials Representing Polynomials Performance Assessment 2.1 (measures) Score with Mathematics Scoring Rubric; share and analyze results in data teams. Performance Assessment 2.2 (measures) Score with Mathematics Scoring Rubric; share and analyze results in data teams. Performance Assessment 2.3 (measures) Score with Mathematics Scoring Rubric; share and analyze results in data teams.

Greeley-Evans School District 6 Page 7 of 17 2012-2013 Algebra 2 Curriculum Guide
Interpret the structure of expressions. Extend to polynomial and rational expressions. CO.HS.2.PFA.3.a.i-ii; CCSS.HS.A.SSE.1-2 • Interpret expressions that represent a quantity in terms of its context.★
a. Interpret parts of an expression, such as terms, factors, and coefficients. b. Interpret complicated expressions by viewing one or more of their parts as a single
entity. For example, interpret P(1+r)n as the product of P and a factor not depending on P.
• Use the structure of an expression to identify ways to rewrite it. For example, see x4 – y4 as (x2)2 – (y2)2, thus recognizing it as a difference of squares that can be factored as (x2 – y2)(x2 + y2).
Write expressions in equivalent forms to solve problems. CO.HS.2.PFA.3.b.ii; CCSS.HS.A.SSE.4 • Derive the formula for the sum of a finite geometric series (when the common ratio is not 1),
and use the formula to solve problems. For example, calculate mortgage payments. Consider extending to infinite geometric series.
Perform arithmetic operations on polynomials. CO.HS.2.PFA.3.c.i; CCSS.HS.A.APR.1 • Understand that polynomials form a system analogous to the integers, namely, they are closed
under the operations of addition, subtraction, and multiplication; add, subtract, and multiply polynomials. •
Understand the relationship between zeros and factors of polynomials. CO.HS.2.PFA.3.d.i-ii; CCSS.HS.A.APR.2-3 • Know and apply the Remainder Theorem: For a polynomial p(x) and a number a, the remainder
on division by x – a is p(a), so p(a) = 0 if and only if (x – a) is a factor of p(x). • Identify zeros of polynomials when suitable factorizations are available, and use the zeros to
construct a rough graph of the function defined by the polynomial. Use polynomial identities to solve problems. This cluster has many possibilities for optional enrichment, such as relating the example in A.APR.4 to the solution of the system u2+v2=1, v = t(u+1), relating the Pascal triangle property of binomial coefficients to (x+y)n+1 = (x+y)(x+y)n, deriving explicit formulas for the coefficients, or proving the binomial theorem by induction. CO.HS.2.PFA.3.e.i; CCSS.HS.A.APR.4-5 • Prove polynomial identities and use them to describe numerical relationships. For example,
the polynomial identity (x2 + y2)2 = (x2 – y2)2 + (2xy)2 can be used to generate Pythagorean triples.
• (+) Know and apply the Binomial Theorem for the expansion of (x + y)n in powers of x and y for a positive integer n, where x and y are any numbers, with coefficients determined for example by Pascal’s Triangle.
Performance Assessment 2.4 (measures) Score with Mathematics Scoring Rubric; share and analyze results in data teams. This test needs to be entered into Galileo. Interventions and extensions Teacher’s choice of problems and activities for individual students or groups of students. These days may be used at any point in the unit at the teacher’s discretion. Miscellaneous class days Use these days to cover benchmark testing, MSP professional development, and other miscellaneous issues.

Greeley-Evans School District 6 Page 8 of 17 2012-2013 Algebra 2 Curriculum Guide
Represent and solve equations and inequalities graphically. CO.HS.2.PFA.4.e.ii; CCSS.HS.A.REI.11 • Explain why the x-coordinates of the points where the graphs of the equations y = f(x) and y =
g(x) intersect are the solutions of the equation f(x) = g(x); find the solutions approximately, e.g., using technology to graph the functions, make tables of values, or find successive approximations. Include cases where f(x) and/or g(x) are linear, polynomial, rational, radical, absolute value, and exponential functions.
Analyze functions using different representations. CO.HS.2.PFA.1.c.iv; CCSS.HS.F.IF.7c • Graph functions expressed symbolically and show key features of the graph, by hand in simple
cases and using technology for more complicated cases.★ c. Graph polynomial functions, identifying zeros when suitable factorizations are
available, and showing end behavior. Relate to the relationship between zeros of quadratic functions and their factored forms.
Build new functions from existing functions. CO.HS.2.PFA.1.e.i; CCSS.HS.3.F.BF.3 • Identify the effect on the graph of replacing f(x) by f(x) + k, k f(x), f(kx), and f(x + k) for
specific values of k (both positive and negative); find the value of k given the graphs. Experiment with cases and illustrate an explanation of the effects on the graph using technology. Include recognizing even and odd functions from their graphs and algebraic expressions for them.
• Find inverse functions. a. Solve an equation of the form f(x) = c for a simple function f that has an inverse and write an expression for the inverse. For example, f(x) = 2 x3 or f(x) = (x+1)/(x-1) for x≠1.
Interpret functions that arise in applications in terms of context. CO.HS.2.PFA.1.b.i-iii; CCSS.HS.F.IF.4-6 • For a function that models a relationship between two quantities, interpret key features of
graphs and tables in terms of the quantities, and sketch graphs showing key features given a verbal description of the relationship. Key features include: intercepts; intervals where the function is increasing, decreasing, positive, or negative; relative maximums and minimums; symmetries; end behavior; and periodicity.★
• Relate the domain of a function to its graph and, where applicable, to the quantitative relationship it describes. For example, if the function h(n) gives the number of person-hours it takes to assemble n engines in a factory, then the positive integers would be an appropriate domain for the function.★
• Calculate and interpret the average rate of change of a function (presented symbolically or as a table) over a specified interval. Estimate the rate of change from a graph.★
Greeley-Evans School District 6 Page 9 of 17 2012-2013 Algebra 2 Curriculum Guide
Greeley /Evans School District 6 Algebra II Curriculum Guide
Unit 3: Rational and Radical Functions 39 days Timeline: Jan 8 – March 5 1 day = 43 minutes
Enduring Concept:
Grade Level Expectations (GLE) • Perform arithmetic operations with complex numbers. • Interpret the structure of expressions. • Rewrite rational expressions. • Understand solving equations as a process of reasoning and explain the reasoning. • Represent and solve equations and inequalities graphically. • Analyze functions using different representations. • Build new functions from existing functions (inverse functions, transformations). • Interpret functions that arise in applications in terms of context.
★ Standards that lend themselves particularly to the mathematical practice of modeling.
Vocabulary: Rational Function Radical Square Root Cube Root Radicand
Inquiry Questions: Materials needed for this unit:
Evidence Outcomes Instructional Plan This unit extends the arithmetic of integers to rational numbers by allowing division by all numbers except 0. Similarly, rational expressions extend the arithmetic of polynomials by allowing division by all polynomials except the zero polynomial. A central theme of this unit is that the arithmetic of rational expressions is governed by the same rules as the arithmetic of rational numbers. Perform arithmetic operations with complex numbers. CO.HS.1.NPO.1.c.i-ii; CCSS.HS.N.CN.1-2 • Know there is a complex number i such that i2 = −1, and every complex number has the form a + bi
with a and b real. • Use the relation i2 = –1 and the commutative, associative, and distributive properties to add, subtract,
and multiply complex numbers. Interpret the structure of expressions. Extend to polynomial and rational expressions. CO.HS.2.PFA.3.a.i-ii; CCSS.HS.A.SSE.1-2 • Interpret expressions that represent a quantity in terms of its context.★
a. Interpret parts of an expression, such as terms, factors, and coefficients. b. Interpret complicated expressions by viewing one or more of their parts as a single entity. For
example, interpret P(1+r)n as the product of P and a factor not depending on P. Rewrite rational expressions. CO.HS.2.PFA.3.g; CCSS.HS.1.A.APR.6 • Rewrite simple rational expressions in different forms; write a(x)/b(x) in the form q(x) + r(x)/b(x),
where a(x), b(x), q(x), and r(x) are polynomials with the degree of r(x) less than the degree of b(x), using inspection, long division, or, for the more complicated examples, a computer algebra system.
• Understand that rational expressions form a system analogous to the rational numbers, closed under addition, subtraction, multiplication, and division by a nonzero rational expression; add, subtract, multiply, and divide rational expressions.
1 day
Administer Unit 3 Pre-assessment (measures) Score with Mathematics Scoring Rubric; share and analyze results in data teams. This assessment does not get recorded in the grade book, nor should students be expected to correct their mistakes. It is an assessment to let you know what students know before beginning the unit. Glencoe Algebra 2 Resource Lessons 6-3, 7-3, 7-4, 7-5, 7-6, 7-7 Following Activities/Documents Would be Suitable: Operating on Functions Implications for Higher Mathematics Introduction to Imaginary and Complex numbers Manipulating Radicals Illuminations lesson on modeling a rational function. http://illuminations.nctm.org/LessonDetail.aspx?id=L606 Performance Assessment 3.1 (measures) Score with Mathematics Scoring Rubric; share

Greeley-Evans School District 6 Page 10 of 17 2012-2013 Algebra 2 Curriculum Guide
Understand solving equations as a process of reasoning and explain the reasoning. CO.HS.2.PFA.4.b.ii; CCSS.HS.A.REI.2 • Solve simple rational and radical equations in one variable, and give examples showing how
extraneous solutions may arise. Represent and solve equations and inequalities graphically. CO.HS.2.PFA.4.e.ii; CCSS.HS.A.REI.11 • Explain why the x-coordinates of the points where the graphs of the equations y = f(x) and y = g(x)
intersect are the solutions of the equation f(x) = g(x); find the solutions approximately, e.g., using technology to graph the functions, make tables of values, or find successive approximations. Include cases where f(x) and/or g(x) are linear, polynomial, rational, radical, absolute value, and exponential functions.
Analyze functions using different representations. CO.HS.2.PFA.1.c.iv; CCSS.HS.F.IF.7c • Graph functions expressed symbolically and show key features of the graph, by hand in simple cases
and using technology for more complicated cases.★ c. Graph polynomial functions, identifying zeros when suitable factorizations are available, and
showing end behavior. Relate to the relationship between zeros of quadratic functions and their factored forms.
Build new functions from existing functions. CO.HS.2.PFA.1.e.i; CCSS.HS.3.F.BF.3 • Identify the effect on the graph of replacing f(x) by f(x) + k, k f(x), f(kx), and f(x + k) for specific
values of k (both positive and negative); find the value of k given the graphs. Experiment with cases and illustrate an explanation of the effects on the graph using technology. Include recognizing even and odd functions from their graphs and algebraic expressions for them.
• Find inverse functions. a. Solve an equation of the form f(x) = c for a simple function f that has an inverse and write an
expression for the inverse. For example, f(x) = 2 x3 or f(x) = (x+1)/(x-1) for x≠1. Interpret functions that arise in applications in terms of context. CO.HS.2.PFA.1.b.i-iii; CCSS.HS.F.IF.4-6 • For a function that models a relationship between two quantities, interpret key features of graphs
and tables in terms of the quantities, and sketch graphs showing key features given a verbal description of the relationship. Key features include: intercepts; intervals where the function is increasing, decreasing, positive, or negative; relative maximums and minimums; symmetries; end behavior; and periodicity.★
• Relate the domain of a function to its graph and, where applicable, to the quantitative relationship it describes. For example, if the function h(n) gives the number of person-hours it takes to assemble n engines in a factory, then the positive integers would be an appropriate domain for the function.★
• Calculate and interpret the average rate of change of a function (presented symbolically or as a table) over a specified interval. Estimate the rate of change from a graph.★
and analyze results in data teams. Performance Assessment 3.2 (measures) Score with Mathematics Scoring Rubric; share and analyze results in data teams. Performance Assessment 3.3 (measures) Score with Mathematics Scoring Rubric; share and analyze results in data teams. Performance Assessment 3.4 (measures) Score with Mathematics Scoring Rubric; share and analyze results in data teams. This test needs to be entered into Galileo. Interventions and extensions Teacher’s choice of problems and activities for individual students or groups of students. These days may be used at any point in the unit at the teacher’s discretion. Miscellaneous class days Use these days to cover benchmark testing, MSP professional development, and other miscellaneous issues.
Greeley-Evans School District 6 Page 11 of 17 2012-2013 Algebra 2 Curriculum Guide
Greeley /Evans School District 6 Algebra II Curriculum Guide
Unit 4: Exponential and Logarithmic Functions 37 days Timeline: Mar 6 – May 2 1 day = 43 minutes
Enduring Concept:
Grade Level Expectations (GLE) • Represent and solve equations and inequalities graphically. • Analyze functions using different representations. • Build a function that models a relationship between two quantities. • Build new functions from existing functions (inverse functions, transformations). • Construct and compare linear, quadratic, and exponential models and solve problems. • Interpret functions that arise in applications in terms of context.
★ Standards that lend themselves particularly to the mathematical practice of modeling.
Vocabulary: Exponent Power Logarithm Natural Log
Common Log Product Rule Quotient Rule Power Rule
Inquiry Questions: Materials needed for this unit:
Evidence Outcomes Instructional Plan This unit …. Exponential and logarithmic functions Represent and solve equations and inequalities graphically. CO.HS.2.PFA.4.e.ii; CCSS.HS.A.REI.11 • Explain why the x-coordinates of the points where the graphs of the equations y =
f(x) and y = g(x) intersect are the solutions of the equation f(x) = g(x); find the solutions approximately, e.g., using technology to graph the functions, make tables of values, or find successive approximations. Include cases where f(x) and/or g(x) are linear, polynomial, rational, radical, absolute value, and exponential functions.
Analyze functions using different representations. CO.HS.2.PFA.1.c.iv; CCSS.HS.F.IF.7c • Graph functions expressed symbolically and show key features of the graph, by hand
in simple cases and using technology for more complicated cases.★ c. Graph polynomial functions, identifying zeros when suitable factorizations are
available, and showing end behavior. Relate to the relationship between zeros of quadratic functions and their factored forms.
Build a function that models a relationship between two quantities. CO.HS.2.PFA.1.d.i; CCSS.HS.3.F.BF.1 • Write a function that describes a relationship between two quantities.*
b. Combine standard function types using arithmetic operations. For example, build a function that models the temperature of a cooling body by adding a constant function to a decaying exponential, and relate these functions to the model.
Build new functions from existing functions. CO.HS.2.PFA.1.e.i; CCSS.HS.3.F.BF.3 • Identify the effect on the graph of replacing f(x) by f(x) + k, k f(x), f(kx), and f(x +
1 day Administer Unit 4 Pre-assessment (measures) Score with Mathematics Scoring Rubric; share and analyze results in data teams. This assessment does not get recorded in the grade book, nor should students be expected to correct their mistakes. It is an assessment to let you know what students know before beginning the unit. Glencoe Algebra 2 Resource Lessons 9-1, 9-2, 9-3, 9-4, 9-5, 9-6 Following Activities/Documents Would be Suitable: This Should Interest… Personal Financial Literacy in the Mathematics Classroom The Devil and Daniel Webster Performance Assessment 4.1 (measures) Score with Mathematics Scoring Rubric; share and analyze results in data teams. Performance Assessment 4.2 (measures) Score with Mathematics Scoring Rubric; share and analyze results in data teams. Performance Assessment 4.3 (measures) Score with Mathematics Scoring Rubric; share and analyze results in data teams. Performance Assessment 4.4 (measures) Score with Mathematics Scoring Rubric; share and analyze results in data teams.

Greeley-Evans School District 6 Page 12 of 17 2012-2013 Algebra 2 Curriculum Guide
k) for specific values of k (both positive and negative); find the value of k given the graphs. Experiment with cases and illustrate an explanation of the effects on the graph using technology. Include recognizing even and odd functions from their graphs and algebraic expressions for them.
• Find inverse functions. a. Solve an equation of the form f(x) = c for a simple function f that has an inverse and write an expression for the inverse. For example, f(x) = 2 x3 or f(x) = (x+1)/(x-1) for x≠1.
Construct and compare linear, quadratic, and exponential models and solve problems. CO.HS.2.PFA.2.a.iv; CCSS.HS.3.F.LE.4 • For exponential models, express as a logarithm the solution to a bct = d where a, c,
and d are numbers and the base b is 2, 10, or e; evaluate the logarithm using technology.
Interpret functions that arise in applications in terms of context. CO.HS.2.PFA.1.b.i-iii; CCSS.HS.F.IF.4-6 • For a function that models a relationship between two quantities, interpret key
features of graphs and tables in terms of the quantities, and sketch graphs showing key features given a verbal description of the relationship. Key features include: intercepts; intervals where the function is increasing, decreasing, positive, or negative; relative maximums and minimums; symmetries; end behavior; and periodicity.★
• Relate the domain of a function to its graph and, where applicable, to the quantitative relationship it describes. For example, if the function h(n) gives the number of person-hours it takes to assemble n engines in a factory, then the positive integers would be an appropriate domain for the function.★
• Calculate and interpret the average rate of change of a function (presented symbolically or as a table) over a specified interval. Estimate the rate of change from a graph.★
This test needs to be entered into Galileo. Interventions and extensions Teacher’s choice of problems and activities for individual students or groups of students. These days may be used at any point in the unit at the teacher’s discretion. Miscellaneous class days Use these days to cover benchmark testing, MSP professional development, and other miscellaneous issues.
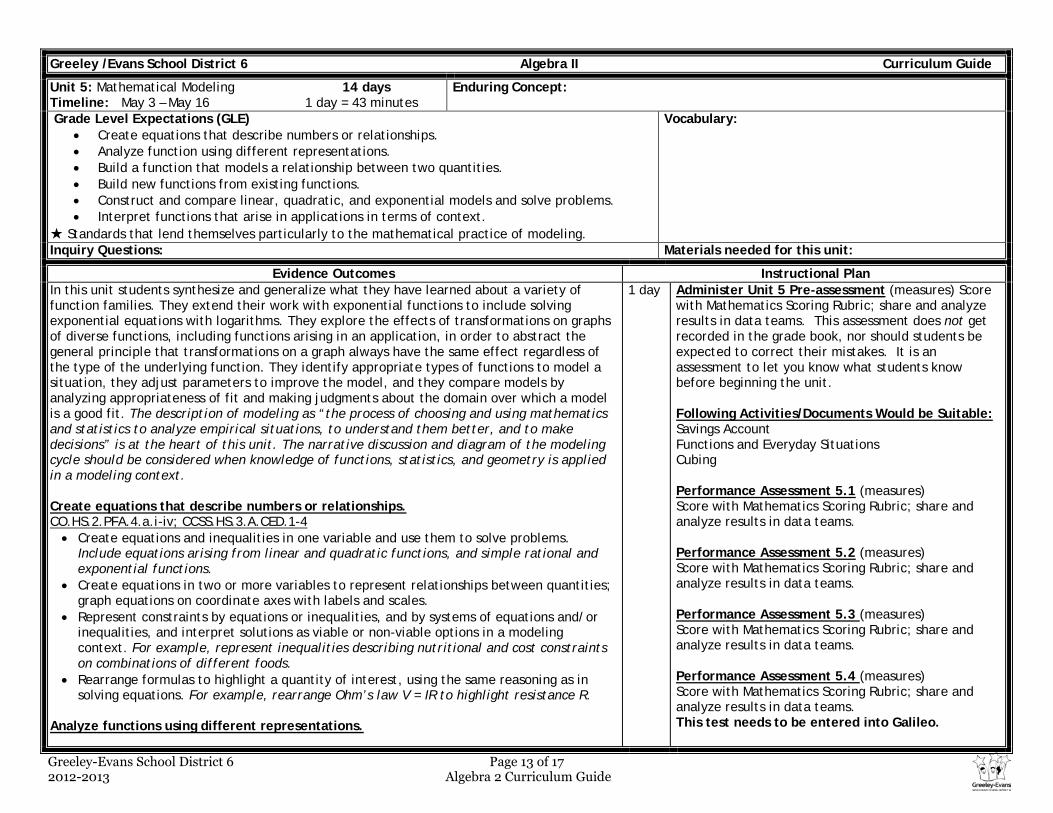
Greeley-Evans School District 6 Page 13 of 17 2012-2013 Algebra 2 Curriculum Guide
Greeley /Evans School District 6 Algebra II Curriculum Guide
Unit 5: Mathematical Modeling 14 days Timeline: May 3 – May 16 1 day = 43 minutes
Enduring Concept:
Grade Level Expectations (GLE) • Create equations that describe numbers or relationships. • Analyze function using different representations. • Build a function that models a relationship between two quantities. • Build new functions from existing functions. • Construct and compare linear, quadratic, and exponential models and solve problems. • Interpret functions that arise in applications in terms of context.
★ Standards that lend themselves particularly to the mathematical practice of modeling.
Vocabulary:
Inquiry Questions: Materials needed for this unit:
Evidence Outcomes Instructional Plan In this unit students synthesize and generalize what they have learned about a variety of function families. They extend their work with exponential functions to include solving exponential equations with logarithms. They explore the effects of transformations on graphs of diverse functions, including functions arising in an application, in order to abstract the general principle that transformations on a graph always have the same effect regardless of the type of the underlying function. They identify appropriate types of functions to model a situation, they adjust parameters to improve the model, and they compare models by analyzing appropriateness of fit and making judgments about the domain over which a model is a good fit. The description of modeling as “the process of choosing and using mathematics and statistics to analyze empirical situations, to understand them better, and to make decisions” is at the heart of this unit. The narrative discussion and diagram of the modeling cycle should be considered when knowledge of functions, statistics, and geometry is applied in a modeling context. Create equations that describe numbers or relationships. CO.HS.2.PFA.4.a.i-iv; CCSS.HS.3.A.CED.1-4 • Create equations and inequalities in one variable and use them to solve problems.
Include equations arising from linear and quadratic functions, and simple rational and exponential functions.
• Create equations in two or more variables to represent relationships between quantities; graph equations on coordinate axes with labels and scales.
• Represent constraints by equations or inequalities, and by systems of equations and/or inequalities, and interpret solutions as viable or non-viable options in a modeling context. For example, represent inequalities describing nutritional and cost constraints on combinations of different foods.
• Rearrange formulas to highlight a quantity of interest, using the same reasoning as in solving equations. For example, rearrange Ohm’s law V = IR to highlight resistance R.
Analyze functions using different representations.
1 day
Administer Unit 5 Pre-assessment (measures) Score with Mathematics Scoring Rubric; share and analyze results in data teams. This assessment does not get recorded in the grade book, nor should students be expected to correct their mistakes. It is an assessment to let you know what students know before beginning the unit. Following Activities/Documents Would be Suitable: Savings Account Functions and Everyday Situations Cubing Performance Assessment 5.1 (measures) Score with Mathematics Scoring Rubric; share and analyze results in data teams. Performance Assessment 5.2 (measures) Score with Mathematics Scoring Rubric; share and analyze results in data teams. Performance Assessment 5.3 (measures) Score with Mathematics Scoring Rubric; share and analyze results in data teams. Performance Assessment 5.4 (measures) Score with Mathematics Scoring Rubric; share and analyze results in data teams. This test needs to be entered into Galileo.

Greeley-Evans School District 6 Page 14 of 17 2012-2013 Algebra 2 Curriculum Guide
CO.HS.2.PFA.1.c.iv; CCSS.HS.F.IF.7c • Graph functions expressed symbolically and show key features of the graph, by hand in
simple cases and using technology for more complicated cases.★ c. Graph polynomial functions, identifying zeros when suitable factorizations are
available, and showing end behavior. Relate to the relationship between zeros of quadratic functions and their factored forms.
Build a function that models a relationship between two quantities. CO.HS.2.PFA.1.d.i; CCSS.HS.3.F.BF.1 • Write a function that describes a relationship between two quantities.*
b. Combine standard function types using arithmetic operations. For example, build a function that models the temperature of a cooling body by adding a constant function to a decaying exponential, and relate these functions to the model.
Build new functions from existing functions. CO.HS.2.PFA.1.e.i; CCSS.HS.3.F.BF.3 • Identify the effect on the graph of replacing f(x) by f(x) + k, k f(x), f(kx), and f(x + k) for
specific values of k (both positive and negative); find the value of k given the graphs. Experiment with cases and illustrate an explanation of the effects on the graph using technology. Include recognizing even and odd functions from their graphs and algebraic expressions for them.
• Find inverse functions. a. Solve an equation of the form f(x) = c for a simple function f that has an inverse and write an expression for the inverse. For example, f(x) = 2 x3 or f(x) = (x+1)/(x-1) for x≠1.
Construct and compare linear, quadratic, and exponential models and solve problems. CO.HS.2.PFA.2.a.iv; CCSS.HS.3.F.LE.4 • For exponential models, express as a logarithm the solution to a bct = d where a, c, and d
are numbers and the base b is 2, 10, or e; evaluate the logarithm using technology. Interpret functions that arise in applications in terms of context. CO.HS.2.PFA.1.b.i-iii; CCSS.HS.F.IF.4-6 • For a function that models a relationship between two quantities, interpret key features
of graphs and tables in terms of the quantities, and sketch graphs showing key features given a verbal description of the relationship. Key features include: intercepts; intervals where the function is increasing, decreasing, positive, or negative; relative maximums and minimums; symmetries; end behavior; and periodicity.★
• Relate the domain of a function to its graph and, where applicable, to the quantitative relationship it describes. For example, if the function h(n) gives the number of person-hours it takes to assemble n engines in a factory, then the positive integers would be an appropriate domain for the function.★
• Calculate and interpret the average rate of change of a function (presented symbolically or as a table) over a specified interval. Estimate the rate of change from a graph.★
Interventions and extensions Teacher’s choice of problems and activities for individual students or groups of students. These days may be used at any point in the unit at the teacher’s discretion. Miscellaneous class days Use these days to cover benchmark testing, MSP professional development, and other miscellaneous issues.
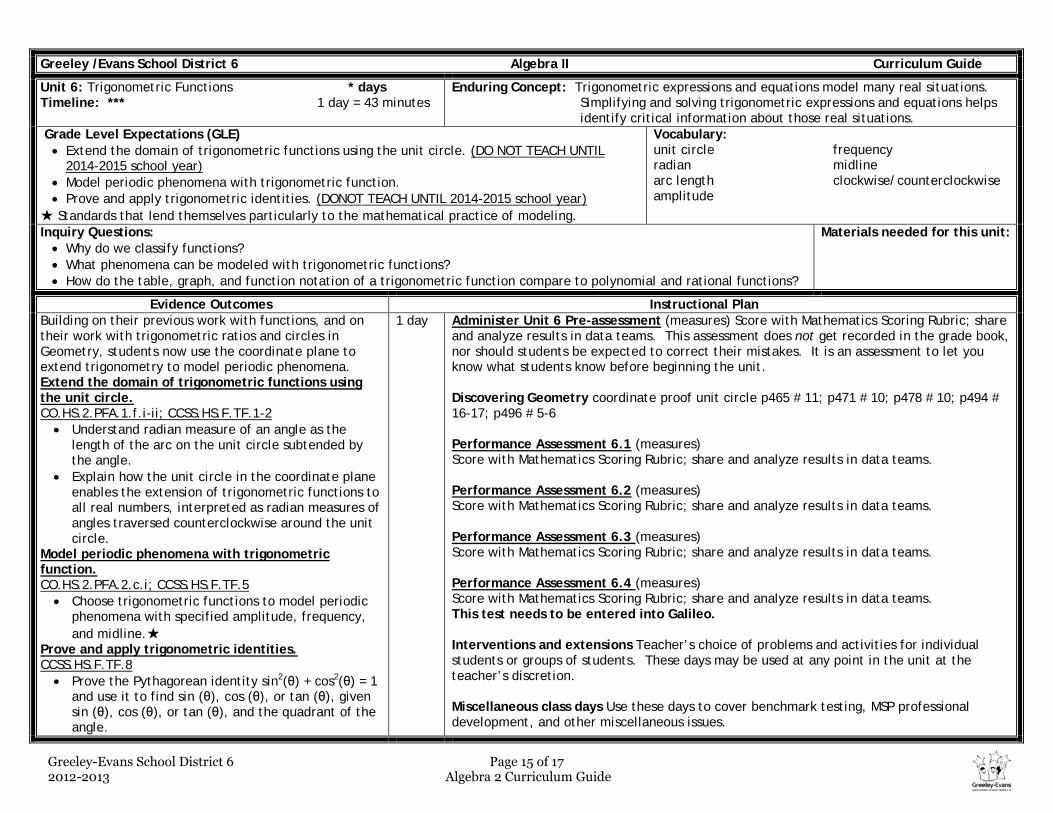
Greeley-Evans School District 6 Page 15 of 17 2012-2013 Algebra 2 Curriculum Guide
Greeley /Evans School District 6 Algebra II Curriculum Guide
Unit 6: Trigonometric Functions * days Timeline: *** 1 day = 43 minutes
Enduring Concept: Trigonometric expressions and equations model many real situations. Simplifying and solving trigonometric expressions and equations helps identify critical information about those real situations.
Grade Level Expectations (GLE) • Extend the domain of trigonometric functions using the unit circle. (DO NOT TEACH UNTIL
2014-2015 school year) • Model periodic phenomena with trigonometric function. • Prove and apply trigonometric identities. (DONOT TEACH UNTIL 2014-2015 school year)
★ Standards that lend themselves particularly to the mathematical practice of modeling.
Vocabulary: unit circle radian arc length amplitude
frequency midline clockwise/counterclockwise
Inquiry Questions: • Why do we classify functions? • What phenomena can be modeled with trigonometric functions? • How do the table, graph, and function notation of a trigonometric function compare to polynomial and rational functions?
Materials needed for this unit:
Evidence Outcomes Instructional Plan Building on their previous work with functions, and on their work with trigonometric ratios and circles in Geometry, students now use the coordinate plane to extend trigonometry to model periodic phenomena. Extend the domain of trigonometric functions using the unit circle. CO.HS.2.PFA.1.f.i-ii; CCSS.HS.F.TF.1-2 • Understand radian measure of an angle as the
length of the arc on the unit circle subtended by the angle.
• Explain how the unit circle in the coordinate plane enables the extension of trigonometric functions to all real numbers, interpreted as radian measures of angles traversed counterclockwise around the unit circle.
Model periodic phenomena with trigonometric function. CO.HS.2.PFA.2.c.i; CCSS.HS.F.TF.5 • Choose trigonometric functions to model periodic
phenomena with specified amplitude, frequency, and midline.★
Prove and apply trigonometric identities. CCSS.HS.F.TF.8 • Prove the Pythagorean identity sin2(θ) + cos2(θ) = 1
and use it to find sin (θ), cos (θ), or tan (θ), given sin (θ), cos (θ), or tan (θ), and the quadrant of the angle.
1 day Administer Unit 6 Pre-assessment (measures) Score with Mathematics Scoring Rubric; share and analyze results in data teams. This assessment does not get recorded in the grade book, nor should students be expected to correct their mistakes. It is an assessment to let you know what students know before beginning the unit. Discovering Geometry coordinate proof unit circle p465 # 11; p471 # 10; p478 # 10; p494 # 16-17; p496 # 5-6 Performance Assessment 6.1 (measures) Score with Mathematics Scoring Rubric; share and analyze results in data teams. Performance Assessment 6.2 (measures) Score with Mathematics Scoring Rubric; share and analyze results in data teams. Performance Assessment 6.3 (measures) Score with Mathematics Scoring Rubric; share and analyze results in data teams. Performance Assessment 6.4 (measures) Score with Mathematics Scoring Rubric; share and analyze results in data teams. This test needs to be entered into Galileo. Interventions and extensions Teacher’s choice of problems and activities for individual students or groups of students. These days may be used at any point in the unit at the teacher’s discretion. Miscellaneous class days Use these days to cover benchmark testing, MSP professional development, and other miscellaneous issues.
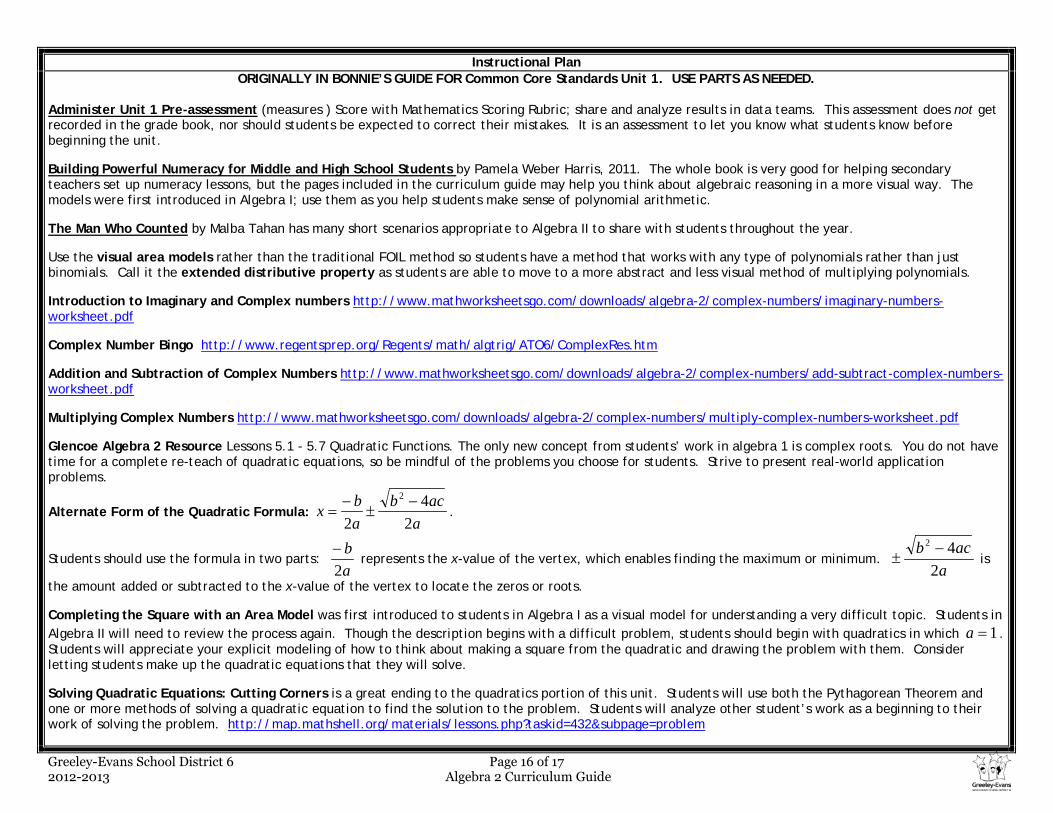
Greeley-Evans School District 6 Page 16 of 17 2012-2013 Algebra 2 Curriculum Guide
Instructional Plan ORIGINALLY IN BONNIE’S GUIDE FOR Common Core Standards Unit 1. USE PARTS AS NEEDED.
Administer Unit 1 Pre-assessment (measures ) Score with Mathematics Scoring Rubric; share and analyze results in data teams. This assessment does not get recorded in the grade book, nor should students be expected to correct their mistakes. It is an assessment to let you know what students know before beginning the unit. Building Powerful Numeracy for Middle and High School Students by Pamela Weber Harris, 2011. The whole book is very good for helping secondary teachers set up numeracy lessons, but the pages included in the curriculum guide may help you think about algebraic reasoning in a more visual way. The models were first introduced in Algebra I; use them as you help students make sense of polynomial arithmetic. The Man Who Counted by Malba Tahan has many short scenarios appropriate to Algebra II to share with students throughout the year. Use the visual area models rather than the traditional FOIL method so students have a method that works with any type of polynomials rather than just binomials. Call it the extended distributive property as students are able to move to a more abstract and less visual method of multiplying polynomials. Introduction to Imaginary and Complex numbers http://www.mathworksheetsgo.com/downloads/algebra-2/complex-numbers/imaginary-numbers-worksheet.pdf Complex Number Bingo http://www.regentsprep.org/Regents/math/algtrig/ATO6/ComplexRes.htm Addition and Subtraction of Complex Numbers http://www.mathworksheetsgo.com/downloads/algebra-2/complex-numbers/add-subtract-complex-numbers-worksheet.pdf Multiplying Complex Numbers http://www.mathworksheetsgo.com/downloads/algebra-2/complex-numbers/multiply-complex-numbers-worksheet.pdf Glencoe Algebra 2 Resource Lessons 5.1 - 5.7 Quadratic Functions. The only new concept from students’ work in algebra 1 is complex roots. You do not have time for a complete re-teach of quadratic equations, so be mindful of the problems you choose for students. Strive to present real-world application problems.
Alternate Form of the Quadratic Formula: a
acbabx
24
2
2 −±
−= .
Students should use the formula in two parts: ab
2−
represents the x-value of the vertex, which enables finding the maximum or minimum. a
acb2
42 −± is
the amount added or subtracted to the x-value of the vertex to locate the zeros or roots. Completing the Square with an Area Model was first introduced to students in Algebra I as a visual model for understanding a very difficult topic. Students in Algebra II will need to review the process again. Though the description begins with a difficult problem, students should begin with quadratics in which 1=a . Students will appreciate your explicit modeling of how to think about making a square from the quadratic and drawing the problem with them. Consider letting students make up the quadratic equations that they will solve. Solving Quadratic Equations: Cutting Corners is a great ending to the quadratics portion of this unit. Students will use both the Pythagorean Theorem and one or more methods of solving a quadratic equation to find the solution to the problem. Students will analyze other student’s work as a beginning to their work of solving the problem. http://map.mathshell.org/materials/lessons.php?taskid=432&subpage=problem

Greeley-Evans School District 6 Page 17 of 17 2012-2013 Algebra 2 Curriculum Guide
Performance Assessment 1.1 (measures complex numbers and quadratic equations) Score with Mathematics Scoring Rubric; share and analyze results in data teams. Geometric Series Glencoe Algebra 2 Resource Lessons 11.4 with 11.5 as extension. Students learned about arithmetic (linear) and geometric (exponential) sequences in Algebra I. This evidence outcome takes that learning to the next step with geometric series. Finite Geometric Series provides good practice problems. http://www.kutasoftware.com/FreeWorksheets/Alg2Worksheets/Finite%20Geometric%20Series.pdf Personal Financial Literacy in the Mathematics Classroom is a logical next step from the geometric series problems. Though not exactly the same, it uses the same algebraic thinking to solve financial problems. Students should have a copy of the Time-Value of Money formula sheet during the lesson and the assessment. Performance Assessment 1.2 (measures geometric series and time-value of money) Score with Mathematics Scoring Rubric; share and analyze results in data teams. Working with Exponents is a worksheet to help students review and solidify the laws of exponents. Students began using the laws of exponents in Algebra 1. Laws of Exponents Worksheet is a sheet of practice problems. Manipulating Polynomials explores polynomials from a geometric perspective. It will be a nice lesson integrating what students have learned in both Algebra I and Geometry and practicing their skills with polynomials from this unit. http://map.mathshell.org/materials/lessons.php?taskid=437&subpage=concept Glencoe Algebra 2 Resource Lessons 6.2 – 6.9 Please revisit the pages from Building Powerful Numeracy in Middle and High School Classrooms from the beginning of this unit for division of polynomials. Patterns in Pascal’s Triangle explores the binomial theorem. Glencoe Algebra 2 Resource Lesson 11.7 Performance Assessment 1.3 (measures computation with polynomials) Score with Mathematics Scoring Rubric; share and analyze results in data teams. Manipulating Radicals builds on students’ experience with simplifying radicals in Algebra I. This lesson will help students explore more properties of radicals. http://map.mathshell.org/materials/lessons.php?taskid=435&subpage=concept Glencoe Algebra 2 Resource Lessons 7.3 – 7.7 for radical equations and inequalities. Glencoe Algebra 2 Resource Lessons 8.1 – 8.6 for rational expressions and equations 10.7 Representing Polynomials explores zeros, transformations of polynomial functions and the fundamental theorem of algebra. http://map.mathshell.org/materials/lessons.php?taskid=436&subpage=concept Interventions and extensions Teacher’s choice of problems and activities for individual students or groups of students. These days may be used at any point in the unit at the teacher’s discretion. Miscellaneous class days Use these days to cover benchmark testing, MSP professional development, and other miscellaneous issues.

Items from TCAP framework
Greeley-Evans School District 6 Page 1 of 16 2012-2013 Geometry Curriculum Guide
Greeley-Evans School District 6 Geometry Curriculum Guide
Unit 1: Constructions, Rigid Transformations and Congruence Timeline: Aug 16 to Sep 20 25 days 1 day = 43 minutes
Enduring Concept: Two-dimensional objects in our world are routinely transformed, and those transformations can be described and analyzed mathematically.
Grade Level Expectations (GLE) • Make geometric constructions. • Experiment with transformations in the plane. • Understand congruence in terms of rigid motions.
Vocabulary precise represent predict
construct interior exterior
arc transformation rotation reflection
translation rigid corresponding congruent
Inquiry Questions 1. How would the idea of congruency be used outside of mathematics? 2. What does it mean for two things to be the same? Are there different degrees of sameness? 3. What makes a good definition of shape?
Materials needed for this unit: compass protractor straight edge
grid paper card stock transparencies
Evidence Outcomes Instructional Plan In previous grades, students were asked to draw triangles based on given measurements. They also have prior experience with rigid motions: translations, reflections, and rotations and have used these to develop notions about what it means for two objects to be congruent. In this unit, students establish triangle congruence criteria, based on analyses of rigid motions and formal constructions. They use triangle congruence as a familiar foundation for the development of formal proof. They apply reasoning to complete geometric constructions and explain why they work. Make geometric constructions. Build on prior student experience with simple constructions. Emphasize the ability to formalize and explain how these constructions result in the desired objects. Some of these constructions are closely related to previous standards and can be introduced in conjunction with them. CO.HS.4.SDG.1.d.i-ii; CCSS.HS.G.CO.12-13 • Make formal geometric constructions with a variety
of tools and methods (compass and straightedge, string, reflective devices, paper folding, dynamic geometric software, etc.). Copying a segment; copying an angle; bisecting a segment; bisecting an angle; constructing perpendicular lines, including the perpendicular bisector of a line segment; and constructing a line parallel to a given line through a
1 day 4 days
Administer Unit 1 Pre-assessment (measures construction and transformation) Score with Mathematics Scoring Rubric; share and analyze results in data teams. This assessment does not get recorded in the grade book, nor should students be expected to correct their mistakes. It is an assessment to let you know what students know before beginning the unit. Constructions Students should do a mix of constructions: by hand with a compass, Mira or patty paper, and with dynamic geometry software, such as CabriJr on the TI-84s. The software for CabriJr is preloaded on all district TI-84s; Beth Sasse or Bonnie Funk can help you learn how to use it. The guidebook for CabriJr is available for download at http://education.ti.com/downloads/guidebooks/ apps/83cabri_jr/ti83pcabrijr_eng.pdf Geometry in Nature and Art power point presentation introducing geometry. Can be found in the electronic files. Animated constructions http://www.mathsisfun.com/geometry/constructions.html Copying a Segment Discovering Geometry 3.1 Investigation 1 Copying an Angle Discovering Geometry 3.1 Investigation 2 Bisecting a Segment Discovering Geometry 3.2 Investigation 2 Glencoe Teaching Geometry with Manipulatives Lab 1.3 Bisecting an Angle Discovering Geometry 3.4 Investigation 2 Perpendicular Lines Discovering Geometry 3.3 Investigation 1 Glencoe Teaching Geometry with Manipulatives Lab 1.5, Lab 2.8, Lab 3.6

Items from TCAP framework
Greeley-Evans School District 6 Page 2 of 16 2012-2013 Geometry Curriculum Guide
point not on the line. • Construct an equilateral triangle, a square, and a
regular hexagon inscribed in a circle. Use coordinates to prove simple geometric theorems algebraically. CO.HS.4.SDG.3.a.ii.3; CCSS.HS.G.GPE.6 • Find the point on a directed line segment between
two given points that partitions the segment in a given ratio.
Experiment with transformations in the plane. Build on student experience with rigid motions from earlier grades. Point out the basis of rigid motions in geometric concepts, e.g., translations move points a specified distance along a line parallel to a specified line; rotations move objects along a circular arc with a specified center through a specified angle. CO.HS.4.1.a.i-viii; CCSS.HS.G.CO.1-5 • Know precise definitions of angle, circle,
perpendicular line, parallel line, and line segment, based on the undefined notions of point, line, distance along a line, and distance around a circular arc.
• Represent transformations in the plane using, e.g., transparencies and geometry software; describe transformations as functions that take points in the plane as inputs and give other points as outputs. Compare transformations that preserve distance and angle to those that do not (e.g., translation versus horizontal stretch).
1 day 3 days 6 days
Parallel Lines Glencoe Teaching Geometry with Manipulatives Lab 3.5 Bisectors, Medians, and Altitudes Glencoe Teaching Geometry with Manipulatives Lab 5.1 Inscribing Regular Figures in a Circle A video demonstration of inscribing a hexagon in a circle is at this website. http://www.mathopenref.com/constinhexagon.html Performance Assessment 1.1 (measures constructions) Score with Mathematics Scoring Rubric; share and analyze results in data teams. Discovering Geometry Using Your Algebra Skills is an opportunity to review algebra skills that will be used throughout geometry as well as beginning the idea of proof with coordinates. You should include algebra skills at any and all appropriate times throughout this course.
•1 Midpoint p36 (see Glencoe enrichment WS 2.7 for extension to other ratios) •2 Slope p133 •4 Writing Linear Equations p210
Rigid Transformations include translations, reflections, and rotations, along with symmetry and composition of transformations. Tools to help students visualize concepts include Mira, transparency sheet to trace and transform, mirror, patty paper. Illuminations has applets for rotation, reflection, translation, and glide reflection at http://illuminations.nctm.org/ Lessons titled Symmetries I, II, III, and IV. Representing and Combining Transformations is a hands-on, intuitive look at rigid transformations. http://map.mathshell.org/materials/lessons.php Flipchart for Promethean is in electronic files. Help students analyze transformations and organize their thinking using t-charts with coordinates, such as: (See Glencoe Enrichment WS 4.3) Discovering Geometry p71 # 18-20; p77 # 11-13; p8 # 30; p91 # 52; p131 # 16-18; p171 #
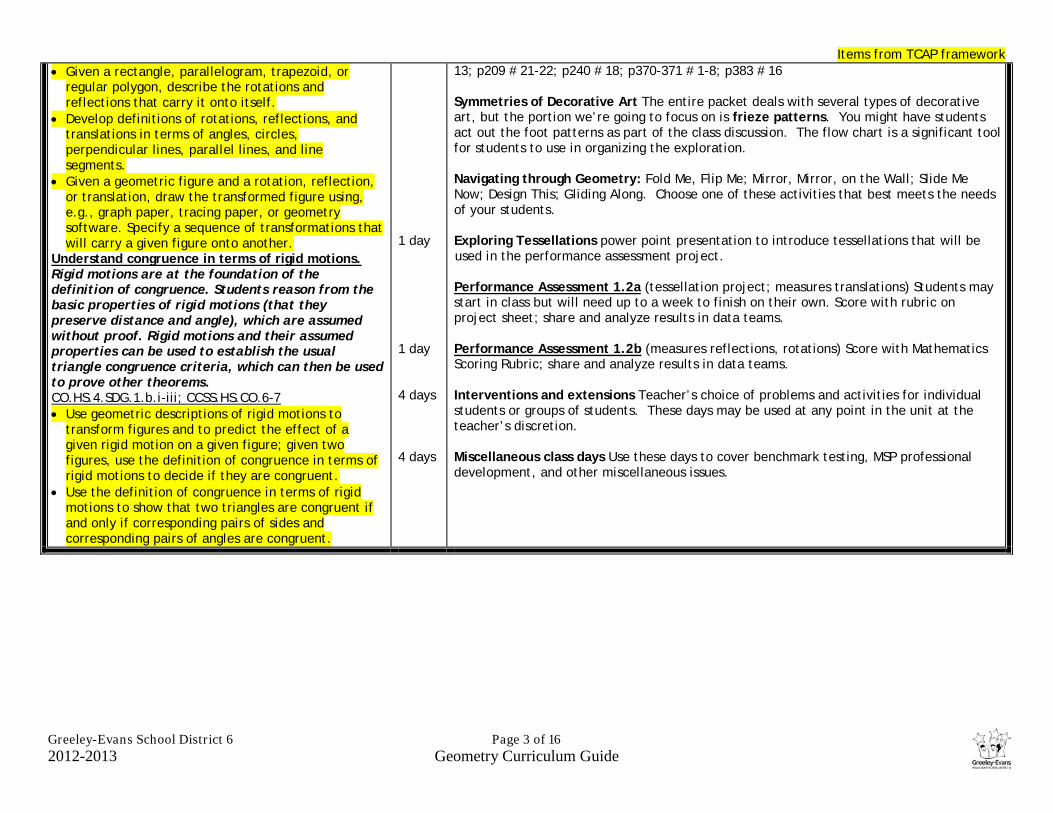
Items from TCAP framework
Greeley-Evans School District 6 Page 3 of 16 2012-2013 Geometry Curriculum Guide
• Given a rectangle, parallelogram, trapezoid, or regular polygon, describe the rotations and reflections that carry it onto itself.
• Develop definitions of rotations, reflections, and translations in terms of angles, circles, perpendicular lines, parallel lines, and line segments.
• Given a geometric figure and a rotation, reflection, or translation, draw the transformed figure using, e.g., graph paper, tracing paper, or geometry software. Specify a sequence of transformations that will carry a given figure onto another.
Understand congruence in terms of rigid motions. Rigid motions are at the foundation of the definition of congruence. Students reason from the basic properties of rigid motions (that they preserve distance and angle), which are assumed without proof. Rigid motions and their assumed properties can be used to establish the usual triangle congruence criteria, which can then be used to prove other theorems. CO.HS.4.SDG.1.b.i-iii; CCSS.HS.CO.6-7 • Use geometric descriptions of rigid motions to
transform figures and to predict the effect of a given rigid motion on a given figure; given two figures, use the definition of congruence in terms of rigid motions to decide if they are congruent.
• Use the definition of congruence in terms of rigid motions to show that two triangles are congruent if and only if corresponding pairs of sides and corresponding pairs of angles are congruent.
1 day 1 day 4 days 4 days
13; p209 # 21-22; p240 # 18; p370-371 # 1-8; p383 # 16 Symmetries of Decorative Art The entire packet deals with several types of decorative art, but the portion we’re going to focus on is frieze patterns. You might have students act out the foot patterns as part of the class discussion. The flow chart is a significant tool for students to use in organizing the exploration. Navigating through Geometry: Fold Me, Flip Me; Mirror, Mirror, on the Wall; Slide Me Now; Design This; Gliding Along. Choose one of these activities that best meets the needs of your students. Exploring Tessellations power point presentation to introduce tessellations that will be used in the performance assessment project. Performance Assessment 1.2a (tessellation project; measures translations) Students may start in class but will need up to a week to finish on their own. Score with rubric on project sheet; share and analyze results in data teams. Performance Assessment 1.2b (measures reflections, rotations) Score with Mathematics Scoring Rubric; share and analyze results in data teams. Interventions and extensions Teacher’s choice of problems and activities for individual students or groups of students. These days may be used at any point in the unit at the teacher’s discretion. Miscellaneous class days Use these days to cover benchmark testing, MSP professional development, and other miscellaneous issues.

Items from TCAP framework
Greeley-Evans School District 6 Page 4 of 16 2012-2013 Geometry Curriculum Guide
Greeley-Evans School District 6 Geometry Curriculum Guide
Unit 2: Foundations of Proof 41 days Timeline: Sep 24 to Nov 20 1 day = 43 minutes
Enduring Concept: Knowledge of right triangle trigonometry allows modeling and application of angle and distance relationships.
Grade Level Expectations (GLE) • Prove geometric theorems. • Use coordinates to prove simple geometric theorems algebraically.
Vocabulary prove theorem
inductive reasoning deductive reasoning
Inquiry Questions 1. What happens to the coordinates of the vertices of shapes when different transformations are applied in the plane? 2. Can computers solve algebraic problems that people cannot solve? Why? 3. How can you determine the measure of something that you cannot measure physically? 4. How do we know a square is a square?
Materials needed for this unit: spaghetti card stock
Evidence Outcomes Instructional Plan Building on their work with the Pythagorean theorem in 8th grade to find distances, students use a rectangular coordinate system to verify geometric relationships, including properties of special triangles and quadrilaterals and slopes of parallel and perpendicular lines. Students prove theorems—using a variety of formats—and solve problems about triangles, quadrilaterals, and other polygons. Prove geometric theorems. Encourage multiple ways of writing proofs, such as in narrative paragraphs, using flow diagrams, in two-column format, and using diagrams without words. Students should be encouraged to focus on the validity of the underlying reasoning while exploring a variety of formats for expressing that reasoning. CO.HS.4.SDG.1.c.i; CCSS.HS.G.CO.9 • Prove theorems about lines and angles. Theorems include:
vertical angles are congruent; when a transversal crosses parallel lines, alternate interior angles are congruent and corresponding angles are congruent; points on a perpendicular bisector of a line segment are exactly those equidistant from the segment’s endpoints.
Use coordinates to prove simple geometric theorems
1 day 8 days
Administer Unit 2 Pre-assessment (measures connections and proof) Score with Mathematics Scoring Rubric; share and analyze results in data teams. This assessment does not get recorded in the grade book, nor should students be expected to correct their mistakes. It is an assessment to let you know what students know before beginning the unit. Resources for thinking about proof use to introduce or sprinkle thru unit
• Jokes as Proofs (Joking with Proofs) provides an informal introduction to proof. Complete lesson plan at Illuminations. http://illuminations.nctm.org/LessonDetail.aspx?id=L823
• Conditional statements such as “If you attend GWHS/GCHS/NHS, then you are a Spartan/Wildcat/Grizzly.”
• The Pirate Game promotes logical thinking. Students may have to play several rounds before they are ready to analyze the problem theoretically.
• CabriJr (Apps on TI-84) to create drawings and test theorems. • Logic Puzzles are in order of ascending difficulty. Many more at
http://www.braingle.com/brainteasers/category.php?category=Logic-Grid&fields=&value=&unrated=0;order=8
Resource options:
• Discovering Geometry lessons 2.5 Inv. 1-2, lesson 2.6 Investigation; Line Design Project p132; Page 34-35 # 29-32;
• Glencoe Geometry lessons 2.7, 2.8, 3.1, 3.2, and 3.5 Finding Equations of Parallel and Perpendicular Lines is a Shell Centre lesson http://map.mathshell.org/materials/lessons.php

Items from TCAP framework
Greeley-Evans School District 6 Page 5 of 16 2012-2013 Geometry Curriculum Guide
algebraically. CO.HS.4.SDG.3.a.ii.2-3; CCSS.HS.G.GPE.5-6 • Prove the slope criteria for parallel and perpendicular lines
and use them to solve geometric problems (e.g., find the equation of a line parallel or perpendicular to a given line that passes through a given point). Relate work on parallel lines to work in Algebra I involving systems of equations having no solution or infinitely many solutions.
Prove geometric theorems. CO.HS.4.SDG.1.c.ii-iii; CCSS.HS.G.CO.10-11 • Prove theorems about triangles. Theorems include:
measures of interior angles of a triangle sum to 180°; base angles of isosceles triangles are congruent; the segment joining midpoints of two sides of a triangle is parallel to the third side and half the length; the medians, perpendicular bisectors, and angle bisectors of a triangle each meet at a point.
CO.HS.4.SDG.1.b.iv; CCSS.HS.CO.8 • Explain how the criteria for triangle congruence (ASA, SAS,
and SSS) follow from the definition of congruence in terms of rigid motions.
1 day 10 days 1 day
Write equation of perpendicular bisector study aids/coordinate geometry http://www.algebralab.org/studyaids/studyaid.aspx?file=Algebra2_10-4.xml Coordinate Proof Discovering Geometry Using Your Algebra Skills 10 p 712 Performance Assessment 2.1 (measures theorems about lines and angles) Score with Mathematics Scoring Rubric; share and analyze results in data teams. Triangles and Venn Diagrams power point to define types of triangles and make connections among the types. Available in the electronic files. Glencoe 4.1 as resource. Resource options:
• Discovering Geometry lesson 4.1 Investigation; Lesson 4.2 Investigation 1 and 2; Lesson 4.3 Investigation 1, 2, 3; p218 # 19-20; p52-53 # 22, 23, 25; p278 # 17 Additional composite problems: p 123 #4, p 130 #7, p 140 #26.
• Glencoe Geometry lessons 4.2, 4.6, 5.1, 5.2 Teaching Geometry with Manipulatives Lab 5.2 and 5.4
The Triangle Inequality and Inequalities for Sides and Angles (Inequalities in Triangles) http://illuminations.nctm.org/LessonDetail.aspx?id=L681 Triangular Frameworks builds on the triangle inequality theorem that students studied in 7th grade using various lengths of straws or Cuisenaire Rods. http://map.mathshell.org/materials/tasks.php?taskid=281&subpage=expert Teacher Video This is not a video for students. You will see a teacher from Australia lead students to develop the theorems for congruent triangles in an unusual way at http://timssvideo.com/27. Pieces of Proof This activity has all of the steps for 6 proofs of congruent triangles on cards. Students organize cards for each proof. Complete lesson plan at Illuminations. http://illuminations.nctm.org/LessonDetail.aspx?id=L727 Resource options:
• Discovering Geometry lesson 4.4 Investigations 1, 2; lesson 4.5 Investigation; lesson 4.6 CPCTC; Lines and Isosceles Triangles project p248; p57 # 23-27; p65 # 23-24; p223 # 10-11; p232 # 10-11
• Glencoe Geometry lessons 4.3, 4.4, 4.5 Teaching Geometry with Manipulatives Labs for these lessons; Enrichment WS 4.5
Performance Assessment 2.2 (measures triangle theorems and proof) Score with

Items from TCAP framework
Greeley-Evans School District 6 Page 6 of 16 2012-2013 Geometry Curriculum Guide
• Prove theorems about parallelograms. Theorems include:
opposite sides are congruent, opposite angles are congruent, the diagonals of a parallelogram bisect each other, and conversely, rectangles are parallelograms with congruent diagonals.
Use coordinates to prove simple geometric theorems algebraically. CO.HS.4.SDG.3.a.ii.1; CCSS.HS.G.GPE.4 • Use coordinates to prove simple geometric theorems
algebraically. For example, prove or disprove that a figure defined by four given points in the coordinate plane is a rectangle.
8 days 1 day 3 days 8 days
Mathematics Scoring Rubric; share and analyze results in data teams. Resource options:
• Discovering Geometry Lesson 5.1 Investigation; Lesson 5.2 Investigation; Lesson 5.5 Investigation; Lesson 5.6 Investigation 2 and 3; p277 # 15-16; p291 # 14-16; p527 # 23
• Glencoe Geometry lesson 6.1 – 6.3 Teaching Geometry with Manipulatives lab 6.3
Diagonals to Quadrilaterals explores the relationship between diagonals and the type of quadrilateral beginning with the diagonals, rather than the typical lesson of exploring diagonals once the quadrilateral is determined. http://illuminations.nctm.org/LessonDetail.aspx?id=L655 Performance Assessment 2.3 (measures parallelogram theorems and proof) Score with Mathematics Scoring Rubric; share and analyze results in data teams. Interventions and extensions Teacher’s choice of problems and activities for individual students or groups of students. These days may be used at any point in the unit at the teacher’s discretion. Miscellaneous class days Use these days to cover benchmark testing, MSP professional development, and other miscellaneous issues.

Items from TCAP framework
Greeley-Evans School District 6 Page 7 of 16 2012-2013 Geometry Curriculum Guide
Greeley-Evans School District 6 Geometry Curriculum Guide
Unit 3: Similarity and Proof 19 days Timeline: Nov 26 – Dec 20 1 day = 43 minutes
Enduring Concept: Concepts of similarity are foundational to geometry and its applications in the world. Analyzing geometric models helps me understand complex physical systems.
Grade Level Expectations (GLE) • Understand similarity in terms of similarity transformations. • Prove theorems involving similarity. • Apply geometric concepts in modeling situations.
Vocabulary verify apply derive
dilation similar
Inquiry Questions 1. How can you determine the measure of something that you cannot measure physically? 2. How are mathematical triangles different from triangles in the physical world? How are they the same? 3. How might surface area and volume be used to explain biological differences in animals?
Materials needed for this unit:
Evidence Outcomes Instructional Plan Students apply their earlier experience with dilations and proportional reasoning to build a formal understanding of similarity. They identify criteria for similarity of triangles and use similarity to solve problems. They are able to distinguish whether three given measures (angles or sides) define 0, 1, 2, or infinitely many triangles. Understand similarity in terms of similarity transformations. CO.HS.4.SDG.2.a.i-iv; CCSS.HS.G.SRT.1-3 • Verify experimentally the properties of dilations given by a
center and a scale factor. a. A dilation takes a line not passing through the
center of the dilation to a parallel line, and leaves a line passing through the center unchanged.
b. The dilation of a line segment is longer or shorter in the ratio given by the scale factor.
• Given two figures, use the definition of similarity in terms of similarity transformations to decide if they are similar; explain using similarity transformations the meaning of similarity for triangles as the equality of all corresponding pairs of angles and the proportionality of all corresponding pairs of sides.
• Use the properties of similarity transformations to establish the AA criterion for two triangles to be similar.
1 day 1 day 1 day 5 days
Administer Unit 3 Pre-assessment (measures similarity, proportional reasoning) Score with Mathematics Scoring Rubric; share and analyze results in data teams. This assessment does not get recorded in the grade book, nor should students be expected to correct their mistakes. It is an assessment to let you know what students know before beginning the unit. Resource Options for Proportional Reasoning:
•Discovering Geometry Using Your Algebra Skills 9 p560 •Glencoe Geometry Lesson 7.1 p380
Solving Systems of Linear Equations Discovering Geometry Using Your Algebra Skills 5 p285 Dilations Transformations is a lab sheet for talking about dilations with students. Navigating through Geometry
•Scale Factors •Basic Dilations •Coordinate Connections (use for differentiation with advanced students) •Shadowy Measurements •Field of Vision
Dilation Animations interactive applets with dilations for class discussions http://www.mathwarehouse.com/transformations/dilations/dilations-in-math.php Similarity Ratio might be helpful during class summary discussions http://www.mathwarehouse.com/geometry/similar/triangles/

Items from TCAP framework
Greeley-Evans School District 6 Page 8 of 16 2012-2013 Geometry Curriculum Guide
Prove theorems involving similarity. CO.HS.4.SDG.2.b.i,iii; CCSS.HS.G.SRT.4-5 • Prove theorems about triangles. Theorems include: a line
parallel to one side of a triangle divides the other two proportionally, and conversely; the Pythagorean Theorem proved using triangle similarity.
• Use congruence and similarity criteria for triangles to solve problems and to prove relationships in geometric figures.
1 day 3 days 1 day 3 days 3 days
Solving Geometry Problems: Floodlights from the Shell Center is a practical application of similar triangles. http://map.mathshell.org/materials/download.php?fileid=1257 Resource Options:
•Discovering Geometry Lesson 11.1 Inv 2; p569 # 15-16; •Glencoe Geometry Lesson 9.5; Lessons 7.2
Performance Assessment 3.1 (measures similarity transformations) Score with Mathematics Scoring Rubric; share and analyze results in data teams. Resource Options:
•Discovering Geometry Lesson 11.2 Inv. 1, 2, 3; p577 # 20; Lesson 11.3 Inv.; Lesson 11.6 Inv. 1 and 2; Take Another Look #1-2 p617
•Glencoe Geometry Lessons 7.3 – 7.5; Teaching with Manipulatives Lab 7.3 The Pythagorean Theorem Proved with Similar Triangles Use these pages to help students think about the Pythagorean Theorem from a different perspective. Also shown in the Khan Academy video at http://www.youtube.com/watch?v=LrS5_l-gk94&feature=related. Perplexing Parallelograms is an extension problem that uses similar triangles to prove a conjecture about parallelograms. http://illuminations.nctm.org/LessonDetail.aspx?id=L709 Performance Assessment 3.2 (measures similarity proofs) Score with Mathematics Scoring Rubric; share and analyze results in data teams. First Semester Final Exam will be multiple choice, covering all topics taught so far. Interventions and extensions Teacher’s choice of problems and activities for individual students or groups of students. These days may be used at any point in the unit at the teacher’s discretion. Miscellaneous class days Use these days to cover benchmark testing, MSP professional development, and other miscellaneous issues.

Items from TCAP framework
Greeley-Evans School District 6 Page 9 of 16 2012-2013 Geometry Curriculum Guide
Greeley-Evans School District 6 Geometry Curriculum Guide
Unit 4: Right Triangles and Trigonometry 21 days Timeline: Jan 7 – Feb 5 1 day = 43 minutes
Enduring Concept: Knowledge of right triangle trigonometry allows modeling and application of angle and distance relationships.
Grade Level Expectations (GLE) • Define trigonometric ratios and solve problems involving right triangles. • Apply geometric concepts in modeling situations. • Apply trigonometry to general triangles.
Vocabulary angle of elevation angle of depression
cosine sine tangent
Inquiry Questions 1. How can you determine the measure of something that you cannot measure physically? 2. How are mathematical triangles different from triangles in the physical world? How are they the same? 3. How might surface area and volume be used to explain biological differences in animals?
Materials needed for this unit: Library book: The Librarian Who Measured the Earth
Evidence Outcomes Instructional Plan Students apply similarity in right triangles to understand right triangle trigonometry, with particular attention to special right triangles and the Pythagorean theorem. Students develop the Laws of Sines and Cosines in order to find missing measures of general (not necessarily right) triangles. They are able to distinguish whether three given measures (angles or sides) define 0, 1, 2, or infinitely many triangles. Define trigonometric ratios and solve problems involving right triangles. CO.HS.4.SDG.2.c.i-iii; CCSS.HS.G.SRT.6-8 • Understand that by similarity, side ratios in right triangles
are properties of the angles in the triangle, leading to definitions of trigonometric ratios for acute angles.
• Explain and use the relationship between the sine and cosine of complementary angles.
• Use trigonometric ratios and the Pythagorean Theorem to solve right triangles in applied problems.
Apply geometric concepts in modeling situations. Focus on situations well modeled by trigonometric ratios for acute angles. CO.HS.4.SDG.5.a.i; CCSS.HS.G.MG.1 • Use geometric shapes, their measures, and their properties
to describe objects (e.g., modeling a tree trunk or a human torso as a cylinder).*
Apply trigonometry to general triangles. With respect to the general case of the Laws of Sines and Cosines, the definitions of sine and cosine must be extended to obtuse angles.
1 day 6 days 1 day
Administer Unit 4 Pre-assessment (measures trigonometry) Score with Mathematics Scoring Rubric; share and analyze results in data teams. NOTE: Include algebraic concepts for review whenever appropriate Radical Expressions Discovering Geometry Using Your Algebra Skills 8 p473 with Glencoe Geometry Prerequisite Skills Page 790-791 Resource Options:
•Discovering Geometry Lesson 9.1 Inv 1; Lesson 9.3 Inv 1-2; Lesson 12.1 – 12.2; Exploration p632 Indirect Measurement;
•Glencoe Geometry Lessons 8.2 – 8.5; Teaching with Manipulatives Lab 7.3, Lab 8.3, Lab 8.4
The Librarian Who Measured the Earth is the story of Eratosthenes and provides a practical example of the historical use of trigonometry. Consider reading it to your students during this unit. Some students may want to replicate the experiment, which is much easier to do with internet capabilities. Differentiation Problems:
• Hopewell Geometry provides an opportunity to revisit the Pythagorean Theorem.
•Pythagorean Triples will extend student thinking about the Pythagorean triples, and perimeter and area of triangles. http://map.mathshell.org/materials/tasks.php?taskid=280&subpage=expert
Performance Assessment 4.1 (measures right triangle trigonometry) Score with Mathematics Scoring Rubric; share and analyze results in data teams.

Items from TCAP framework
Greeley-Evans School District 6 Page 10 of 16 2012-2013 Geometry Curriculum Guide
CCSS.HS.G.SRT.9-11 • (+) Derive the formula A = 1/2 ab sin(C) for the area of a
triangle by drawing an auxiliary line from a vertex perpendicular to the opposite side.
• (+) Prove the Laws of Sines and Cosines and use them to solve problems.
• (+) Understand and apply the Law of Sines and the Law of Cosines to find unknown measurements in right and non-right triangles (e.g., surveying problems, resultant forces).
6 days 1 day 3 days 3 days
Law of Sines and Cosines helps students develop these two laws and can be used to develop the area formula A = ½absinC. The focus in geometry is using the law of sines and law of cosines to model and solve problems, so cling to real-world situations. http://illuminations.nctm.org/LessonDetail.aspx?ID=L703 Resource Options:
•Discovering Geometry Lesson 12.3 Inv 1, 2; Lesson 12.4 Inv •Glencoe Geometry Lessons 8.6 – 8.7; Teaching with Manipulatives Lab 7.3, Lab
8.3, Lab 8.4 Performance Assessment 4.2 (measures non-right triangle trigonometry) Score with Mathematics Scoring Rubric; share and analyze results in data teams. Interventions and extensions Teacher’s choice of problems and activities for individual students or groups of students. These days may be used at any point in the unit at the teacher’s discretion. Miscellaneous class days Use these days to cover benchmark testing, MSP professional development, and other miscellaneous issues.

Items from TCAP framework
Greeley-Evans School District 6 Page 11 of 16 2012-2013 Geometry Curriculum Guide
Greeley-Evans School District 6 Geometry Curriculum Guide
Unit 5: Extending to Three Dimensions 22 days Timeline: Feb 6 – Mar 8 1 day = 43 minutes
Enduring Concept: Understanding areas and volume enables design and building of complex two- and three-dimensional objects.
Grade Level Expectations (GLE) • Explain volume formulas and use them to solve problems. • Visualize the relation between two-dimensional and three-dimensional objects. • Apply geometric concepts in modeling situations.
Vocabulary informal formal
hemisphere slant height apothem
Inquiry Questions 1. How is the area of an irregular shape measured? 2. How can surface area be minimized while maximizing volume?
Materials needed for this unit: Oranges Card stock
Evidence Outcomes Instructional Plan Students’ experience with two-dimensional and three-dimensional objects is extended to include informal explanations of circumference, area and volume formulas. Additionally, students apply their knowledge of two-dimensional shapes to consider the shapes of cross-sections and the result of rotating a two-dimensional object about a line. Explain volume formulas and use them to solve problems. Informal arguments for area and volume formulas can make use of the way in which area and volume scale under similarity transformations: when one figure in the plane results from another by applying a similarity transformation with scale factor k, its area is k2 times the area of the first. Similarly, volumes of solid figures scale by k3 under a similarity transformation with scale factor k. CO.HS.4.SDG.3.a.ii.4; CCSS.HS.G.GPE.7 • Use coordinates to compute perimeters
of polygons and areas of triangles and rectangles, e.g., using the distance formula. Make connections with the distance formula and the Pythagorean Theorem.
1 day
5 days
1 day
9 days
Administer Unit 5 Pre-assessment (measures 1D, 2D, & 3D measures) Score with Mathematics Scoring Rubric; share and analyze results in data teams. Distance Formula Discovering Geometry Lesson 9.5 Inv 1 ties the distance formula directly to the Pythagorean Theorem. Coordinate Geometry Problems from Discovering Geometry: area of parallelogram p415 # 23; area of quadrilaterals p429 # 15-16; area of circle/rectangle/triangle p435 # 9-10; area p589 # 15 Investigating Areas of Regular Polygons Glencoe Teaching Geometry with Manipulatives Lab 11.3. This lesson extends the thinking of constructions to n-sided regular polygons (and indirectly to the area of a circle). Be sure to include triangles and squares in the thinking. Circle Pattern compares areas of two-colored circular regions. This is a good fraction review as well as area of circles. http://map.mathshell.org/materials/tasks.php?taskid=253&subpage=apprentice Circles and Squares explores ratios of areas. Students must calculate the areas then find the ratios. http://map.mathshell.org/materials/tasks.php?taskid=287&subpage=expert Evaluating Statements About Length and Area requires informal proofs around the topic of area of 2D shapes. This could be a good formative assessment as you move toward the performance assessment. http://map.mathshell.org/materials/lessons.php 2-D Resource Options:
•Discovering Geometry Lesson 6.5 Inv; Lesson 8.1 Inv; Lesson 8.2 Inv 1- 2, Lesson 8.4 Inv; Lesson 8.5 Inv •Glencoe Geometry Lessons 8.6 – 8.7; Teaching with Manipulatives Lab 7.3, Lab 8.3, Lab 8.4; Lesson 6.4
Enrichment
Performance Assessment 5.1 (measures 1D and 2D calculations) Score with Mathematics Scoring Rubric; share and analyze results in data teams. 2D Representations of 3D Objects from the Shell Center identifies 2D cross-sections of 3D objects.

Items from TCAP framework
Greeley-Evans School District 6 Page 12 of 16 2012-2013 Geometry Curriculum Guide
CO.HS.4.a.i-ii; CCSS.HS.G.GMD.1,3 • Give an informal argument for the
formulas for the circumference of a circle, area of a circle, volume of a cylinder, pyramid, and cone. Use dissection arguments, Cavalieri’s principle, and informal limit arguments.
• Use volume formulas for cylinders, pyramids, cones, and spheres to solve problems.
Visualize the relation between two-dimensional and three-dimensional objects. CO.HS.4.b.i; CCSS.HS.G.GMD.4 • Identify the shapes of two-dimensional
cross-sections of three-dimensional objects, and identify three-dimensional objects generated by rotations of two-dimensional objects.
Apply geometric concepts in modeling situations.
Focus on situations that require relating two- and three-dimensional objects, determining and using volume, and the trigonometry of general triangles. CO.HS.4.SDG.5.a.i-iii; CCSS.HS.G.MG.1-3 • Use geometric shapes, their measures,
and their properties to describe objects (e.g., modeling a tree trunk or a human torso as a cylinder).*
• Apply concepts of density based on area and volume in modeling situations (e.g., persons per square mile, BTUs per cubic foot).*
• Apply geometric methods to solve design problems (e.g., designing an object or structure to satisfy physical constraints or minimize cost; working with typographic grid systems based on ratios).*
1 day 3 days
2 days
http://map.mathshell.org/materials/lessons.php?taskid=439&subpage=concept How Large is that Dog? is an activity where students create similar 3-D dogs and compare various aspect ratios. Instructions and handouts can be found at the website. www.jamesrahn.com/geometry/pages/big_dog.htm Volume and Surface Area Giving Meaning to Volume and Surface Area http://www.learnnc.org/lp/media/lessons/GraysonWheatley5232002758/Vol&SA.pdf Problems on Volume from James Rahn is a good lesson on understanding volume formulas. http://www.jamesrahn.com/Geometry/pages/volume_of_a_prism.htm An Appeeling Activity uses oranges to understand the surface area and volume of spheres. Written by Joshua Urich and Elizabeth Sasse, WCSD6. Calculating Volumes of Compound Objects from the Shell Center explores various circular glasses. http://map.mathshell.org/materials/lessons.php?taskid=216&subpage=concept Coordinate Geometry from Discovering Geometry p557 # 28 allows students to explore volume as a function of a 2D shape rotated about an axis. Why Elephants Have Big Ears from Discovering Geometry p599 explores the relationships among dimensions, surface area and volume. To learn more about the surface area to volume ratio see http://umassk12.net/nano/materials/SAVweb.doc. Evaluating Statements About Enlargements (2D &3D) from the Shell Center helps students solidify their thinking about the effects of doubling or tripling the key features of a shape on the circumference, area and volume. http://map.mathshell.org/materials/lessons.php?taskid=213&subpage=concept 3D Resource Options: • Discovering Geometry Lesson 8.7 Inv 1 and 2, Lesson 10.3 Inv, Lesson 10.5, Lesson 11.5 Inv 1 and 2 • Glencoe Geometry 11-1, 11-2, 11-3, 11-4, 12-1, 12-2, 12-3, 12-4, 12-5, 12-6, 13-1 (especially Cavaleri’s
principle), 13-2, 13-3, 13-4; Teaching Geometry with Manipulatives: Lab 11.1, Lab 11.2, Lab 11.3, Lab 12.5, Lab 12.6, Lab 13.1, Lab 13.2
• Shell Center Fearless Frames, Bestsize Cans, Funsize Cans, Fruit Boxes, Propane Tanks http://map.mathshell.org/materials/tasks.php?subpage=expert&taskid=273
Performance Assessment 5.2 (measures 3D calculations) Score with Mathematics Scoring Rubric; share and analyze results in data teams. Interventions and extensions Teacher’s choice of problems and activities for individual students or groups of students. These days may be used at any point in the unit at the teacher’s discretion. Miscellaneous class days Use these days to cover benchmark testing, MSP professional development, and other miscellaneous issues.

Items from TCAP framework
Greeley-Evans School District 6 Page 13 of 16 2012-2013 Geometry Curriculum Guide
Greeley-Evans School District 6 Geometry Curriculum Guide
Unit 6: Circles With and Without Coordinates 39 days Timeline: Mar 11 – May 10 1 day = 43 minutes
Enduring Concept: Modeling geometrically and algebraically with circles helps us picture and explain many natural and man-made objects.
Grade Level Expectations (GLE) • Understand and apply theorems about circles. • Find arc lengths and areas of sectors of circles. • Translate between the geometric description and the equation for a conic section. • Use coordinates to prove simple geometric theorem algebraically. • Apply geometric concepts in modeling situations.
Vocabulary model radians arc length sector circumscribed
inscribed tangent chord secant
Inquiry Questions 1. Do perfect circles naturally occur in the physical world? 2. What is the relationship between the Pythagorean Theorem and the equation of a circle? 3. What models of circles can be found in physical therapy, landscaping, automotive care, forestry and other careers?
Materials needed for this unit:
Evidence Outcomes Instructional Plan In this unit, students prove basic theorems about circles, with particular attention to perpendicularity and inscribed angles, in order to see symmetry in circles and as an application of triangle congruence criteria. They study relationships among segments on chords, secants, and tangents as an application of similarity. In the Cartesian coordinate system, students use the distance formula to write the equation of a circle when given the radius and the coordinates of its center. Given an equation of a circle, they draw the graph in the coordinate plane, and apply techniques for solving quadratic equations to determine intersections between lines and circles or parabolas and between two circles. Students continue their study of quadratics by connecting the geometric and algebraic definitions of the parabola. Understand and apply theorems about circles. CO.HS.4.2.b.ii,e.i-iii; CCSS.HS.G.C.1-4 • Prove that all circles are similar. • Identify and describe relationships among inscribed angles,
radii, and chords. Include the relationship between central, inscribed, and circumscribed angles; inscribed angles on a diameter are right angles; the radius of a circle is perpendicular to the tangent where the radius intersects the circle.
• Construct the inscribed and circumscribed circles of a triangle, and prove properties of angles for a quadrilateral inscribed in a circle.
1 day 14 days
Administer Unit 6 Pre-assessment (measures ) Score with Mathematics Scoring Rubric; share and analyze results in data teams. Use radians to teach arc length and sector area; use Dynamic Geometry Software; and include algebra skills whenever possible. Modeling: Rolling Cups from the Shell Center uses the learning from Unit 5 to help students find the radius of the circle any cup will have when rolled on a flat surface. It could be a good way to start this unit. http://map.mathshell.org/materials/lessons.php?taskid=428&subpage=problem Circles Resource Options: • Discovering Geometry Lesson 6.1 Inv 2, 3, and 4; p311 #15 (IMPORTANT); Lesson 6.2
Inv 1 and 2; Lesson 6.3 Investigations 1-5; Lesson 6.5 Investigation; • Glencoe Geometry Lessons 10.1 – 10.8, 11.5; Teaching Geometry with Manipulatives
Lab 10.1, Lab 10.3, Lab 10.4; Geometry Lab 10.7 p607; page 612 # 25-26 • Advanced Mathematical Concepts (the college algebra book) Section 6.1 teach using
proportions and tie to arc length and sector area Coordinate Geometry problems found in Discovering Geometry circle, perpendicular bisector thru origin p312 # 18; tangent to circle p351 # 25-26; circles p533 # 16 Finding the Circumcenter Discovering Geometry Using Your Algebra Skills 6 p329 Find the Orthocenter and Centroid Discovering Geometry Using Your Algebra Skills 7 p401

Items from TCAP framework
Greeley-Evans School District 6 Page 14 of 16 2012-2013 Geometry Curriculum Guide
• (+) Construct a tangent line from a point outside a given circle to the circle.
Find arc lengths and areas of sectors of circles. Emphasize the similarity of all circles. Note that by similarity of sectors with the same central angle, arc lengths are proportional to the radius. Use this as a basis for introducing radian as a unit of measure. It is not intended that it be applied to the development of circular trigonometry in this course. CO.HS.4.SDG.2.f.i; CCSS.HS.G.C.5 • Derive using similarity the fact that the length of the arc
intercepted by an angle is proportional to the radius, and define the radian measure of the angle as the constant of proportionality; derive the formula for the area of a sector.
Translate between the geometric description and the equation for a conic section. CO.HS.4.SDG.3.a.i.1-3; CCSS.HS.G.GPE.1-2 • Derive the equation of a circle of given center and radius
using the Pythagorean Theorem; complete the square to find the center and radius of a circle given by an equation.
• Derive the equation of a parabola given a focus and directrix. The directrix should be parallel to a coordinate axis.
Use coordinates to prove simple geometric theorem algebraically. Include simple proofs involving circles. CO.HS.4.SDG.3.a.ii.1; CCSS.HS.G.GPE.4 • Use coordinates to prove simple geometric theorems
algebraically. For example, prove or disprove that a figure defined by four given points in the coordinate plane is a rectangle; prove or disprove that the point (1, √3) lies on the circle centered at the origin and containing the point (0, 2).
Apply geometric concepts in modeling situations. CO.HS.4.SDG.5.a.i; CCSS.HS.G.MG.1 • Use geometric shapes, their measures, and their properties
to describe objects (e.g., modeling a tree trunk or a human torso as a cylinder).* Focus on situations in which the analysis of circles is required.
1 day 12 days 1 day 5 days 5 days
Geometry Problems: Circles and Triangles from the Shell Center http://map.mathshell.org/materials/lessons.php?taskid=222&subpage=problem Inscribing and Circumscribing Right Triangles from the Shell Center http://map.mathshell.org/materials/lessons.php?taskid=403&subpage=problem Circles in Triangles from the Shell Center requires students to use the theorems they have learned about angles and circles to solve the problem. http://map.mathshell.org/materials/tasks.php?taskid=256&subpage=apprentice Sectors of Circles from the Shell Center http://map.mathshell.org/materials/lessons.php?taskid=441&subpage=concept Performance Assessment 6.1 (measures ) Score with Mathematics Scoring Rubric; share and analyze results in data teams. Equations of Circles 1 from the Shell Center http://map.mathshell.org/materials/lessons.php?taskid=406&subpage=concept Equations of Circles 2 from the Shell Center http://map.mathshell.org/materials/lessons.php?taskid=425&subpage=concept Forming Quadratics http://map.mathshell.org/materials/lessons.php?taskid=224&subpage=concept Lesson 13.2 More on Parabolas from the Math Matters 3 textbook p566 addresses the focus and directrix of parabolas. Parabola, Focus, and Directrix video explaining http://www.khanacademy.org/math/algebra/conic-sections/v/parabola-focus-and-directrix-1 Parabolic Conics gives sample problems http://edhelper.com/conics9.htm Completing the Square with an Area Model Use this model as needed when transforming the equation of a circle to find the center and radius of the circle. Performance Assessment 6.2 (measures ) Score with Mathematics Scoring Rubric; share and analyze results in data teams. Interventions and extensions Teacher’s choice of problems and activities for individual students or groups of students. These days may be used at any point in the unit at the teacher’s discretion. Miscellaneous class days Use these days to cover TCAP, MSP professional development, and other miscellaneous issues.

Items from TCAP framework
Greeley-Evans School District 6 Page 15 of 16 2012-2013 Geometry Curriculum Guide
Greeley-Evans School District 6 Geometry Curriculum Guide
Unit 7: Applications of Probability 23 days Timeline: Not taught in 2012-13 1 day=43 minutes
Enduring Concept: Comprehension of probability allows informed decision-making in a wide variety of disciplines including physics, biology, engineering, finance, and law.
Grade Level Expectations (GLE) • Understand independence and conditional probability and use them to interpret data. • Use the rules of probability to compute probabilities of compound events in a uniform probability
model. • Use probability to evaluate outcomes of decisions.
Vocabulary interpret data theoretical probability experimental probability
Independent events dependent events mutually exclusive events conditional probability compound events
Inquiry Questions 1. Can probability be used to model all types of uncertain situations? For example, can the probability that the
50th president of the United States will be female be determined? 2. How and why are simulations used to determine probability when the theoretical probability is unknown? 3. How does probability relate to obtaining insurance? (PFL)
Materials needed for this unit: Dice, 3 per group
Evidence Outcomes Instructional Plan Building on probability concepts that began in the middle grades, students use the languages of set theory to expand their ability to compute and interpret theoretical and experimental probabilities for compound events, attending to mutually exclusive events, independent events, and conditional probability. Students should make use of geometric probability models wherever possible. They use probability to make informed decisions. Understand independence and conditional probability and use them to interpret data. Build on work with two-way tables from Algebra I Unit 3 (S.ID.5) to develop understanding of conditional probability and independence. CO.HS.3.DSP.3.a.i-v; CCSS.HS.S.CP.1-5 • Describe events as subsets of a sample space (the set of
outcomes) using characteristics (or categories) of the outcomes, or as unions, intersections, or complements of other events (“or,” “and,” “not”).
• Understand that two events A and B are independent if the probability of A and B occurring together is the product of their probabilities, and use this characterization to determine if they are independent.
• Understand the conditional probability of A given B as P(A and B)/P(B), and interpret independence of A and B as saying that the conditional probability of A given B is the same as the probability of A, and the conditional
1 day 5 days 1 day 3 days
Administer Unit 7 Pre-assessment (measures ) Score with Mathematics Scoring Rubric; share and analyze results in data teams. NOTE: Include algebraic concepts for review whenever appropriate The Birthday Paradox might be a fun way to introduce this unit and learn to set up lists on the TI-84. http://illuminations.nctm.org/LessonDetail.aspx?id=L299 Modeling Conditional Probabilities 1: Lucky Dip is a lesson that builds on the understandings students developed in middle school with probability. Students work independently on a task, then share with a partner then analyze other students’ solution methods. Within the examination, they build the multiplication and addition rules as well as giving a context within which to discuss the ideas of independent and dependent events. http://map.mathshell.org/materials/lessons.php?taskid=409&subpage=problem Modeling Conditional Probabilities 2 is a direct follow up to the first lesson. While accessible with several methods, it eventually draws on the work with square patterns that students did in middle school and on their work with quadratics in algebra 1. http://map.mathshell.org/materials/lessons.php?taskid=405&subpage=concept Performance Assessment 2.1 (measures conditional probability in a novel context) Score with Mathematics Scoring Rubric; share and analyze results in data teams. Check Out These Spinners from Navigating through Probability 9-12 begins the experimentation process with compound events. You will need one copy of spinners and a paper clip per group. Students had experience with compound probabilities in 7th grade
Items from TCAP framework
Greeley-Evans School District 6 Page 16 of 16 2012-2013 Geometry Curriculum Guide
probability of B given A is the same as the probability of B.
• Construct and interpret two-way frequency tables of data when two categories are associated with each object being classified. Use the two-way table as a sample space to decide if events are independent and to approximate conditional probabilities.
• Recognize and explain the concepts of conditional probability and independence in everyday language and everyday situations. For example, compare the chance of having lung cancer if you are a smoker with the chance of being a smoker if you have lung cancer.
Use the rules of probability to compute probabilities of compound events in a uniform probability model. CO.HS.3.DSP.3.b-c; CCSS.HS.S.CP.6-9 • Find the conditional probability of A given B as the
fraction of B’s outcomes that also belong to A, and interpret the answer in terms of the model.
• Apply the Addition Rule, P(A or B) = P(A) + P(B) – P(A and B), and interpret the answer in terms of the model.
• Analyze* the cost of insurance as a method to offset the risk of a situation (PFL)
• (+) Apply the general Multiplication Rule in a uniform probability model, P(A and B) = P(A)P(B|A) = P(B)P(A|B), and interpret the answer in terms of the model.
• (+) Use permutations and combinations to compute probabilities of compound events and solve problems.
Use probability to evaluate outcomes of decisions. This unit sets the stage for work in Algebra II, where the ideas of statistical inference are introduced. Evaluating the risks associated with conclusions drawn from sample data (i.e. incomplete information) requires an understanding of probability concepts. (+) items are not in CO standards; CCSS.HS.S.MD.6-7 • (+) Use probabilities to make fair decisions (e.g., drawing
by lots, using a random number generator). • (+) Analyze decisions and strategies using probability
concepts (e.g., product testing, medical testing, pulling a hockey goalie at the end of a game).
1 day 4 days
1 day 3 days 4 days
which they solved by making outcome grids. Sounding an Alarm from Navigating through Probability 9-12 extends the work above to three events and uses the multiplication and addition rules for probability. Three-Dice Sums from Navigating through Probability 9-12 gives students the opportunity to compare experimental and theoretical results of tossing three dice. You will need 3 dice per group, or students may use the Probability Simulations app on the TI-84. The dice will help skeptical students “see” answers better than the calculator but the calculator is far faster. Performance Assessment 2.2 (measures conditional probability) Score with Mathematics Scoring Rubric; share and analyze results in data teams. Abby’s Kennels from Navigating through Probability 9-12 looks at two-way frequency tables of data via a simulation with blue and red chips in small paper bags with stickers on some of the chips. It may take two days, but will be worth the time. Ice Cream Cones and Dishes is an investigation of permutations and combinations. Students will find patterns in data and develop the rules for rn P and rn C through group interactions and summaries of learning rather than through direct instruction. Performance Assessment 2.3 (measures two-way frequency tables of data and permutations/combinations) Score with Mathematics Scoring Rubric; share and analyze results in data teams. Interventions and extensions Teacher’s choice of problems and activities for individual students or groups of students. These days may be used at any point in the unit at the teacher’s discretion. Miscellaneous class days Use these days to cover benchmark testing, MSP professional development, and other miscellaneous issues.