Embed Size (px)
Citation preview
1
High-Speed Experiments on Combustion-Powered Actuation for Dynamic Stall Suppression
Claude Matalanis Research Engineer
United Technologies Research Center (UTRC)
East Hartford, CT
Patrick Bowles Research Engineer
UTRC East Hartford, CT
Peter Lorber Technical Fellow Sikorsky Aircraft
Stratford, CT
Tom Crittenden
Research Associate Georgia Institute of Technology
Atlanta, GA
Ari Glezer Professor
Georgia Institute of Technology Atlanta, GA
Norman Schaeffler Research Scientist
NASA Langley Research Center Hampton, VA
Byung-Young Min Research Engineer
UTRC East Hartford, CT
Solkeun Jee Research Engineer
UTRC East Hartford, CT
Andrzej Kuczek Research Engineer
UTRC East Hartford, CT
Brian Wake Fellow UTRC
East Hartford, CT
ABSTRACT This work documents high-speed wind tunnel experiments conducted on a pitching airfoil equipped with an
array of combustion-powered actuators (COMPACT). The main objective of these experiments was to demonstrate the stall-suppression capability of COMPACT on a high-lift rotorcraft airfoil, the VR-12, at relevant Mach numbers. Through dynamic pressure measurements at the airfoil surface it was shown that COMPACT can positively affect the stall behavior of the VR-12 at Mach numbers up to 0.4. Static airfoil results demonstrated 25% and 50% increases in post-stall lift at Mach numbers of 0.4 and 0.3, respectively. Deep dynamic stall results showed cycle-averaged lift coefficient increases up to 11% at Mach 0.4. Furthermore, it was shown that these benefits could be achieved with relatively few pulses during down-stroke and with no need to pre-anticipate the stall event. The flow mechanisms responsible for stall suppression were investigated using particle image velocimetry.
NOTATION b = Airfoil span, in Cl = Lift coefficient Cd = Drag coefficient Cm = Moment coefficient Cµ = Pulse jet momentum coefficient,
ρjetUjet2h/(ρ∞U∞
2c) c = Airfoil chord length, in fact = Actuation frequency, pulses/second
fpitch = Airfoil pitching frequency, cycles/second
F+ = Non-dimensional pulse frequency, factc/U∞
k = Reduced frequency, = ωc/(2U∞) M = Mach number M′ = Mach number in reference frame which
moves with the freestream t = Time Ujet = Pulse jet velocity U∞ = Freestream velocity w = Downwash velocity X = Streamwise coordinate, origin at airfoil
leading-edge when α = 0° Z = Vertical coordinate, origin at airfoil
leading-edge when α = 0°
x = Streamwise coordinate in body axis, origin at airfoil leading-edge
y = Spanwise coordinate, origin at airfoil midspan
Γ = Circulation α = Airfoil angle-of-attack, deg α0 = Mean airfoil angle-of-attack, deg α1 = Amplitude of airfoil angle-of-attack, deg ω = Airfoil pitching frequency, 2πfpitch,
radians/s
INTRODUCTION Retreating-blade stall (RBS) continues to limit rotorcraft
speed, maneuverability, and efficiency. While RBS is a unique problem specific to rotorcraft, the flow physics involved closely resemble those of airfoil dynamic stall.
https://ntrs.nasa.gov/search.jsp?R=20160009061 2018-06-03T11:50:26+00:00Z
2
Numerous technologies have been developed in order to address this problem. Unsteady mechanical devices such as leading-edge slats and deployable vortex generators have been investigated in Refs. [1] and [2]. Aerodynamically, slats have shown a tremendous ability to enhance airfoil performance; however, the mechanical problems associated with applying them to rotor blades are substantial. Many studies have investigated plasma actuation for stall suppression, Refs. [3] and [4] are two recent examples. The advantages presented by these technologies are significant. They can be applied while cleanly maintaining the baseline aerodynamic surface and they can be mechanically integrated to a rotor blade with relative ease. Generating enough authority at Mach numbers at and above 0.3 has been a challenge, but continual strong progress has been made by several investigators.
Unsteady or pulsed blowing near the airfoil leading-edge has been a topic of many investigations focused on reducing the impact of dynamic stall. Computational fluid dynamics (CFD) studies have been performed (Refs. [5], [6], [7], and [8]) as well as experimental studies (Refs. [9], [10], [11], [12], [13], [14] and [15]) which show the potential strengths and weaknesses of this strategy. Although there are exceptions, the most common outcome of such studies is to show strong stall-suppression capability at Mach numbers at or below Mach 0.2. An appreciable reduction in benefit occurs as Mach number increases to 0.3 and 0.4 and the freestream momentum begins to overwhelm the actuation momentum. The challenge is to develop an actuation technique which can maintain strong momentum at these higher Mach numbers.
Combustion-powered actuation (COMPACT) is a form of unsteady blowing characterized by high impulse short duration jets. The technology has been described thoroughly in Ref. [16] and demonstrated experimentally at low-speeds (Refs. [17], [18], and [19]) and simulated at high speeds (Refs. [18] and [20]). The characteristics of this technology have suggested the strong potential for the suppression of static and dynamic stall at Mach numbers up to 0.4.
This paper documents the design, fabrication, and wind tunnel testing of a test article used to evaluate the dynamic-stall suppression capabilities of COMPACT on a high-lift rotorcraft airfoil (VR-12). The wind tunnel tests were conducted at Mach numbers ranging from 0.1 to 0.5 with a primary focus on deep dynamic stall conditions.
EXPERIMENTAL APPARATUS Tests were conducted in the NASA Glenn Icing Research Tunnel (IRT). The test section is 6 ft high, 9 ft wide, and 20 ft in length. During the testing, the Mach number was varied between 0.2 and 0.5. In the IRT, which has test section total pressure equal to atmospheric pressure, the 15 inch chord of the model provides a near full scale Reynolds number that increases from 1.8E+6 at M = 0.2 to 4.7E+6 at M = 0.5.
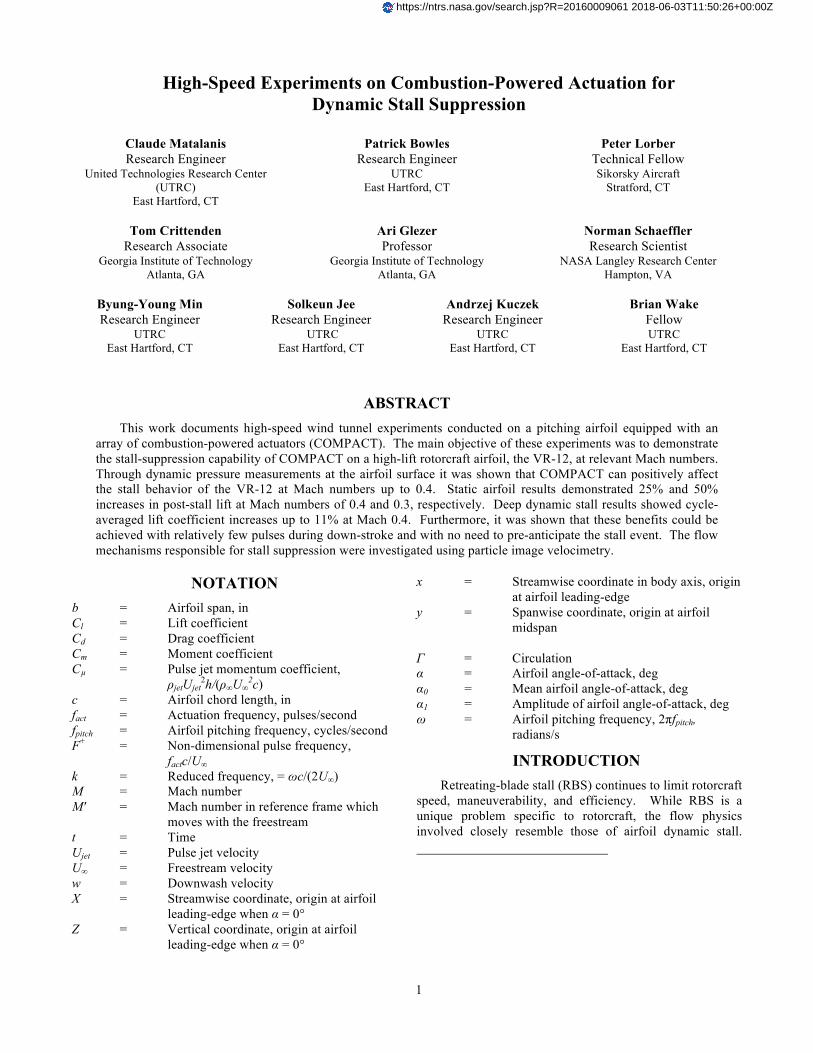
A tunnel-spanning blade model having a current technology helicopter high-lift airfoil, the VR-12, was used. A CAD-rendering of the experimental apparatus is shown in Figure 1. The model consists of a steel spar (the main load bearing element), trailing-edge (TE) composite skins, and a combination of leading-edge (LE) actuator modules and clean LE aluminum sheaths. The LE and TE components are fastened directly to the spar. The model was mounted vertically in the test section of the wind tunnel and spanned from floor to ceiling with a 1.875-in gap at the floor and a 2.125-in gap at the ceiling. It is supported from above and below by spherical roller bearings.
Pitching about the quarter-chord is achieved via push-pull actuation of two hydraulic cylinders mounted directly beneath the tunnel floor. One cylinder assembly is instrumented with a linear potentiometer to provide displacement feedback to a servo-valve controller. This pitching airfoil mechanism was enhanced from that used in Ref. [21] to provide up to ±10º motion at up to 8.5 Hz. Additional steady model pitch is provided by the IRT yaw table. A large borosilicate glass window was bonded in a recess of the upper mount plate in order to allow adequate optical access for the particle image velocimetry (PIV) camera.
Figure 1. Overall CAD-rendering of the airfoil and pitching airfoil mechanism.
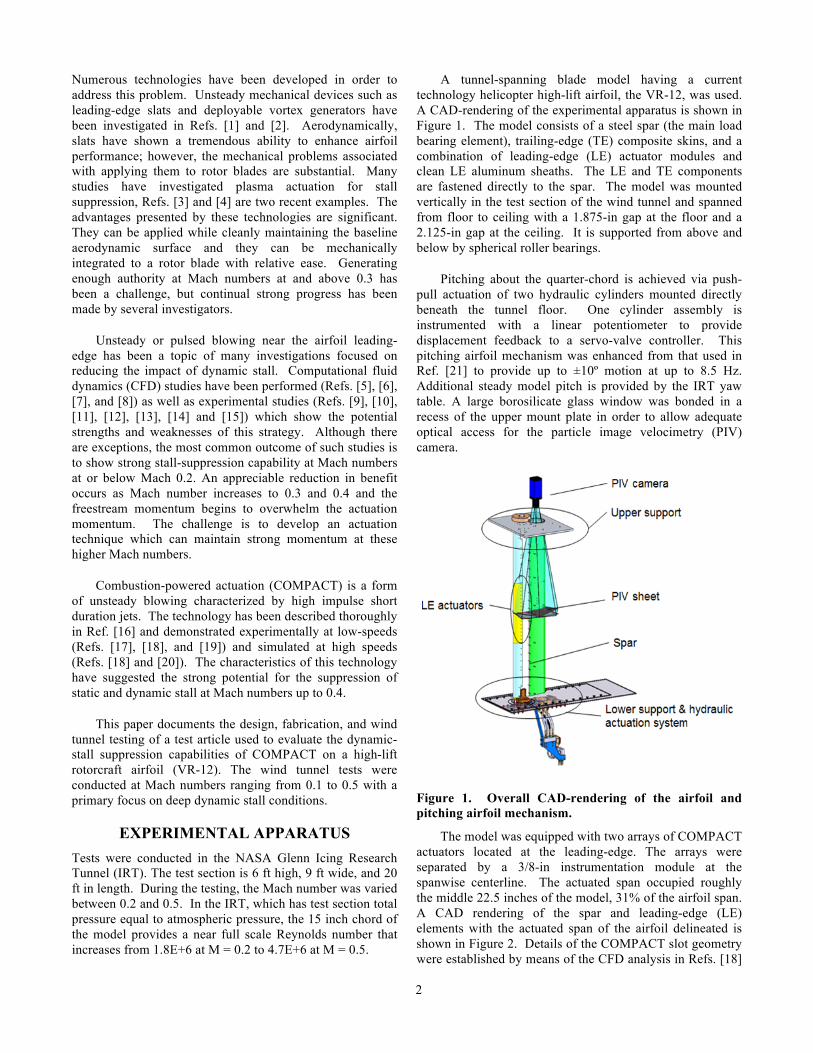
The model was equipped with two arrays of COMPACT actuators located at the leading-edge. The arrays were separated by a 3/8-in instrumentation module at the spanwise centerline. The actuated span occupied roughly the middle 22.5 inches of the model, 31% of the airfoil span. A CAD rendering of the spar and leading-edge (LE) elements with the actuated span of the airfoil delineated is shown in Figure 2. Details of the COMPACT slot geometry were established by means of the CFD analysis in Refs. [18]
3
and [20]. The slot height at the throat was 0.024 inch or 0.0016c, and the exit was oriented at an angle of approximately 20° with respect to the airfoil surface. Figure 3 shows an individual actuator module, which has a nominally 0.50-inch wide combustor with a slot orifice exhausting to the surface of the airfoil and two 0.0625-inch width side walls enclosing the combustion chamber. 18 modules are positioned adjacent to each other to form each actuator array on either side of the model centerline. While the individual actuators form the shape of the upper surface and nose of the airfoil, two large cover plates form the lower surface of the airfoil underneath the actuator array. Tubing to provide air, hydrogen, and wiring for ignition was routed through both model pivot posts and into the airfoil leading-edge. The actuated leading-edge was replaced with a clean leading-edge for baseline airfoil testing.
Two implementations of the COMPACT installation were tested in separate wind tunnel entries. In the first implementation, hydrogen and air were fed to a common plenum for each array. The plenums distributed fuel and air to each module. It was found that the large spanwise length of each array combined with the three-dimensional nature of
dynamic stall created difficulties in achieving uniform high-frequency actuation. To mitigate this problem, an enhanced implementation was developed wherein hydrogen and air were fed individually to each actuator module. This enabled uniform actuation at frequencies greater than 200 Hz. All COMPACT-on results shown in this work are from this enhanced implementation.
Single-row and dual-row actuator configurations were tested. The single-row configuration is shown in Figure 4 and had its slot exit at 0.10c across the full actuated span shown in Figure 2. The dual-row configuration is shown in Figure 5 and had slot exits at 0.10c and 0.17c across approximately half of the actuated span covered by the single-row configuration.
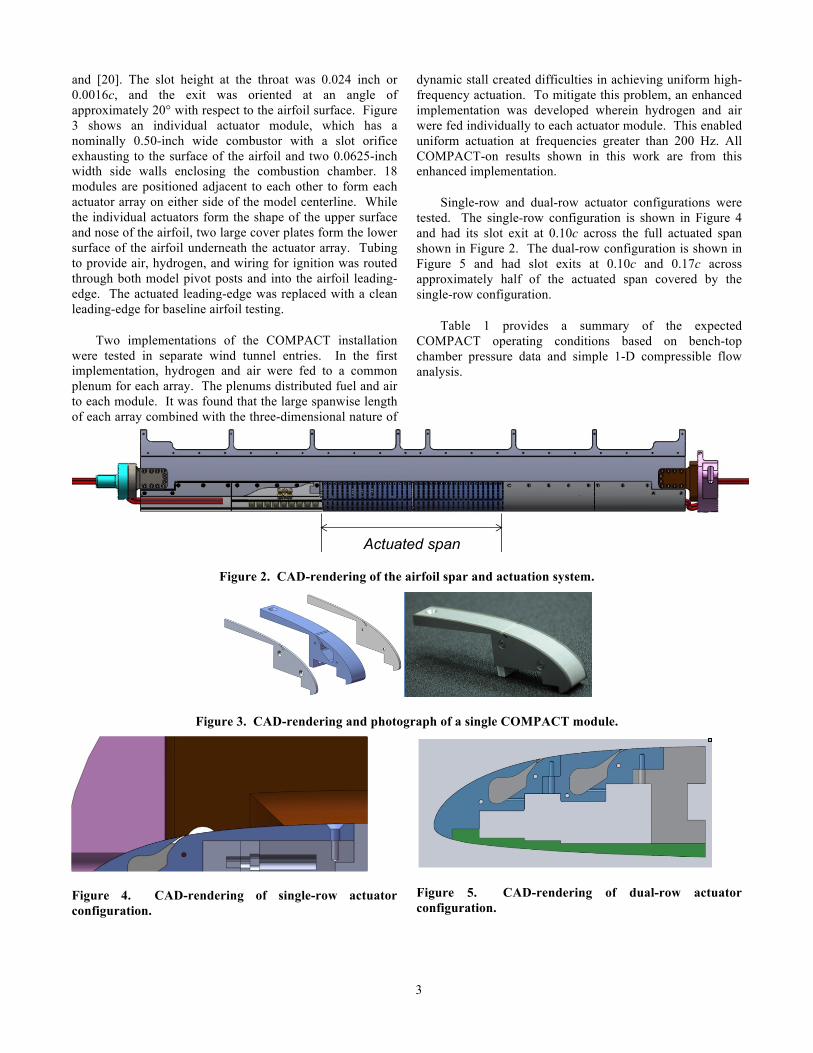
Table 1 provides a summary of the expected COMPACT operating conditions based on bench-top chamber pressure data and simple 1-D compressible flow analysis.
Figure 2. CAD-rendering of the airfoil spar and actuation system.
Figure 3. CAD-rendering and photograph of a single COMPACT module.
Figure 4. CAD-rendering of single-row actuator configuration.
Figure 5. CAD-rendering of dual-row actuator configuration.
Actuated span
4
Table 1. Typical COMPACT operating conditions.
M = 0.1 0.2 0.3 0.4 Freestream Pressure (psi) 14.4 14.13 13.67 13.03 Freestream Temperature 51.4°F 40.9°F 24.5°F 3.1°F Steady bleed Cµ 0.00260 0.00067 0.00031 0.00018 Peak Cµ 0.180 0.0440 0.019 0.011 Hz at F+=0.2 17.72 35.1 51.78 67.48 Avg Cµ F+=0.2 0.00054 0.00027 0.00018 0.00013 RMS Cµ F+=0.2 0.00597 0.00209 0.00113 0.00073 Hz at F+=0.4 35.44 70.2 103.56 134.96 Avg Cµ F+=0.4 0.00108 0.00054 0.00035 0.00026 RMS Cµ F+=0.4 0.0084 0.0030 0.0016 0.0010 Hz at F+=0.6 53.16 105.3 155.34 202.44 Avg Cµ F+=0.6 0.00163 0.00081 0.00053 0.00039 RMS Cµ F+=0.6 0.01033 0.00364 0.00196 0.00126 Hz at F+=0.8 70.88 140.4 207.12 269.92 Avg Cµ F+=0.8 0.00217 0.00107 0.00070 0.00052 RMS Cµ F+=0.8 0.01193 0.00420 0.00227 0.00146 Hz at F+=1.0 88.6 175.5 258.9 337.4 Avg Cµ F+=1.0 0.00270 0.00134 0.00088 0.00065 RMS Cµ F+=1.0 0.01334 0.00469 0.00253 0.00163
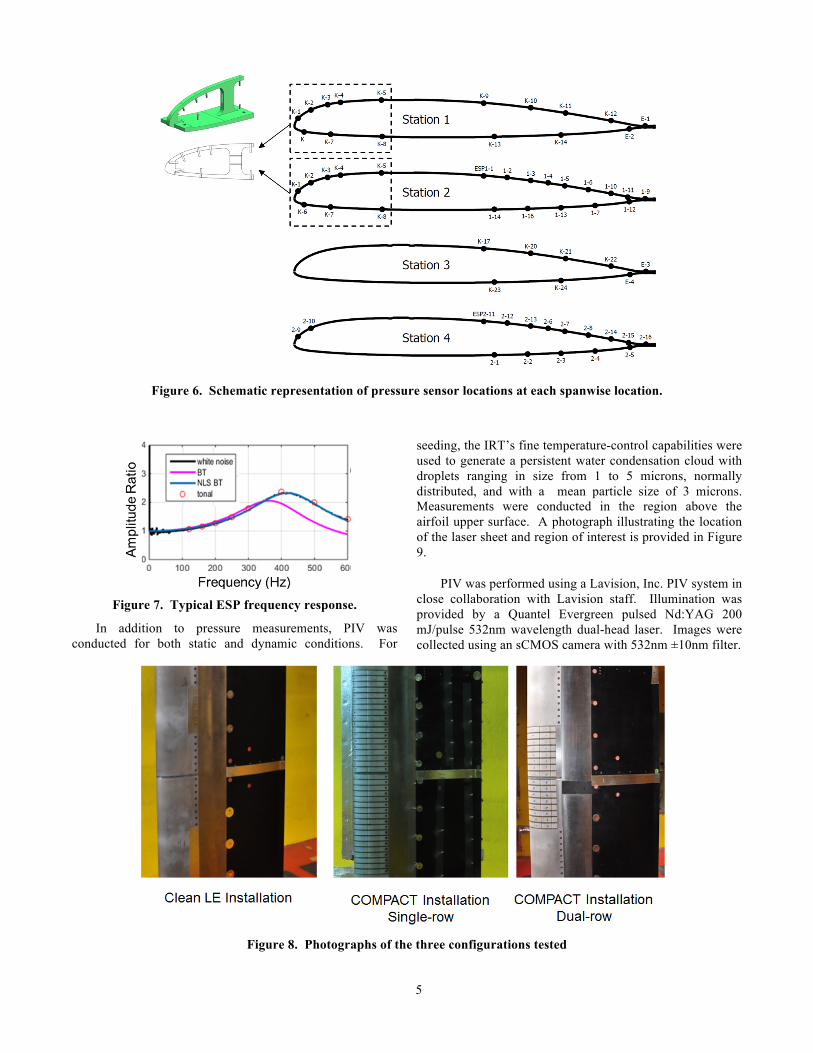
As shown in Figure 6, the model was instrumented with 24 high frequency response Kulite pressure transducers and 30 surface ports connected via short 4-in tubes to electronic pressure scanners (ESPs) mounted inside the model. The primary results were obtained from Station 1 and Station 2. Both were chordwise arrays located very near the mid span of the model between the two COMPACT arrays. An Accura Bluestone® SLA insert shown in green in Figure 6 divided the COMPACT modules and contained 8 leading-edge Kulites common to both stations. Two additional partial chordwise arrays, station 3 and station 4, were located above the centerline at y/(b/2) = 0.32 and 0.70, respectively.
The dynamic response of the ESP pneumatic system was measured [22] and found to be consistent with analytical predictions [23] of 300 Hz bandwidth, sufficient to resolve at least 30 times the maximum oscillation frequency. Small corrections based on the measured response were applied during data processing. Figure 7 shows a typical amplitude response. The black line is for white noise, the red circles are for discrete tones, and the red line is the prediction based on tube geometry. The applied correction was based on a curve fit to the black line. Both the Kulites and the ESPs were also corrected for temperature changes.
The pressure instrumentation cables were routed through the lower pivot post. A single system was used to
command the wing pitching motion, to acquire data, and to process and display the results. One National Instruments™ multifunction data acquisition (DAQ) unit ran the ESPs, acquired wind tunnel conditions, and provided pitch actuation control inputs, and the other acquired the Kulite data.
The acquired data sets consisted of 32 or 64 consecutive pitch cycles at each point. For steady pitch conditions, a 12.8 second record is acquired using a virtual 5 Hz cycle. The samples are acquired at constant phase within each cycle, typically 128/cycle for each ESP pressure port and 1024/cycle for each of the Kulite sensors.
Mathworks® MATLAB™ post-processing scripts computed the ensemble-average over a pitch cycle and phase shifted it to correct for lag in the hydraulic system between the command and the response. Peak and cycle averaged quantities are then computed from the ensemble-averaged loads and surface pressures. The pressure data were integrated using segmented Gaussian quadrature to calculate the surface-normal contributions to the lift, moment, and drag. Tangential (viscous) forces were not measured.
Photographs of the three configurations tested (baseline clean, single-row COMPACT, and dual-row COMPACT) are shown in Figure 8.
5
Figure 6. Schematic representation of pressure sensor locations at each spanwise location.
Figure 7. Typical ESP frequency response.
In addition to pressure measurements, PIV was conducted for both static and dynamic conditions. For
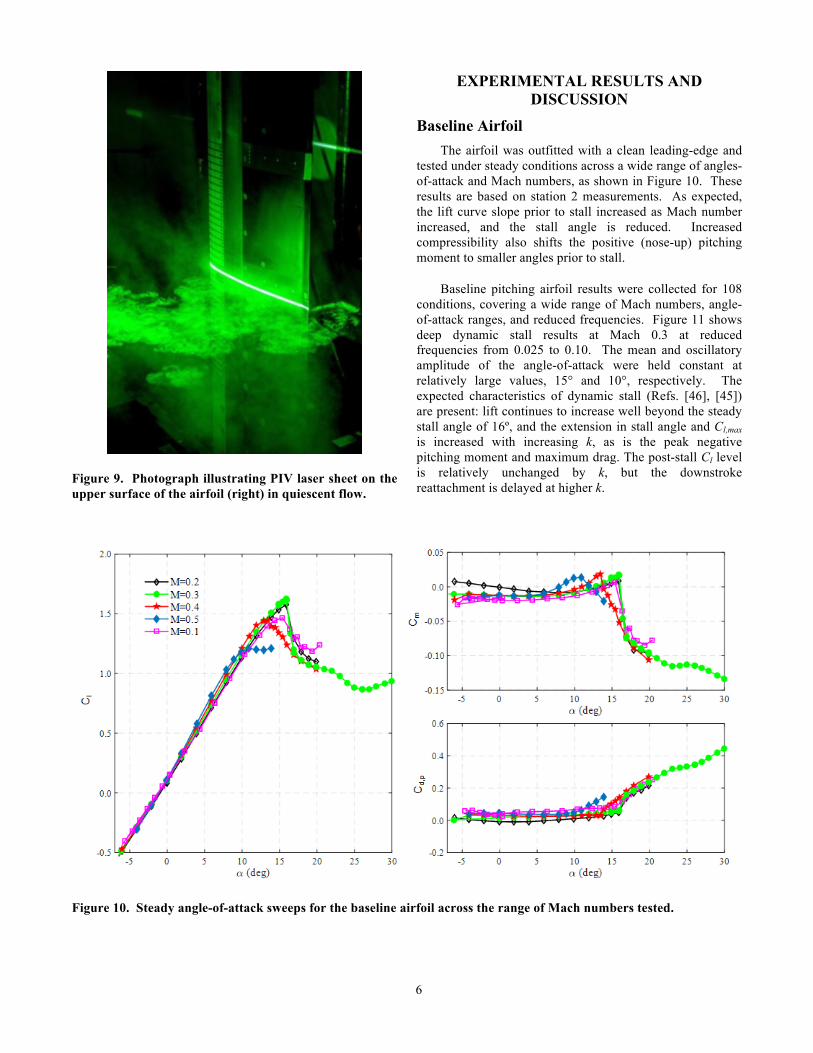
seeding, the IRT’s fine temperature-control capabilities were used to generate a persistent water condensation cloud with droplets ranging in size from 1 to 5 microns, normally distributed, and with a mean particle size of 3 microns. Measurements were conducted in the region above the airfoil upper surface. A photograph illustrating the location of the laser sheet and region of interest is provided in Figure 9.
PIV was performed using a Lavision, Inc. PIV system in close collaboration with Lavision staff. Illumination was provided by a Quantel Evergreen pulsed Nd:YAG 200 mJ/pulse 532nm wavelength dual-head laser. Images were collected using an sCMOS camera with 532nm ±10nm filter.
Figure 8. Photographs of the three configurations tested
6
Figure 9. Photograph illustrating PIV laser sheet on the upper surface of the airfoil (right) in quiescent flow.
EXPERIMENTAL RESULTS AND DISCUSSION
Baseline Airfoil The airfoil was outfitted with a clean leading-edge and
tested under steady conditions across a wide range of angles-of-attack and Mach numbers, as shown in Figure 10. These results are based on station 2 measurements. As expected, the lift curve slope prior to stall increased as Mach number increased, and the stall angle is reduced. Increased compressibility also shifts the positive (nose-up) pitching moment to smaller angles prior to stall.
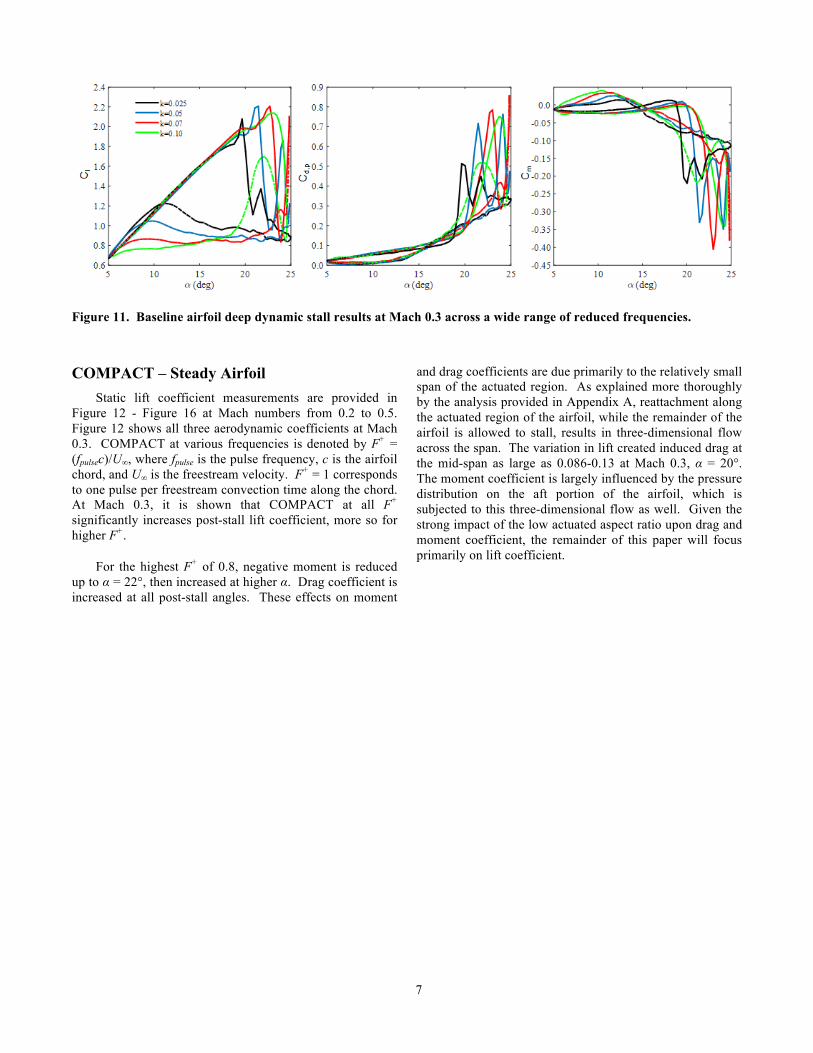
Baseline pitching airfoil results were collected for 108 conditions, covering a wide range of Mach numbers, angle-of-attack ranges, and reduced frequencies. Figure 11 shows deep dynamic stall results at Mach 0.3 at reduced frequencies from 0.025 to 0.10. The mean and oscillatory amplitude of the angle-of-attack were held constant at relatively large values, 15° and 10°, respectively. The expected characteristics of dynamic stall (Refs. [46], [45]) are present: lift continues to increase well beyond the steady stall angle of 16º, and the extension in stall angle and Cl,max is increased with increasing k, as is the peak negative pitching moment and maximum drag. The post-stall Cl level is relatively unchanged by k, but the downstroke reattachment is delayed at higher k.
Figure 10. Steady angle-of-attack sweeps for the baseline airfoil across the range of Mach numbers tested.
7
Figure 11. Baseline airfoil deep dynamic stall results at Mach 0.3 across a wide range of reduced frequencies.
COMPACT – Steady Airfoil Static lift coefficient measurements are provided in
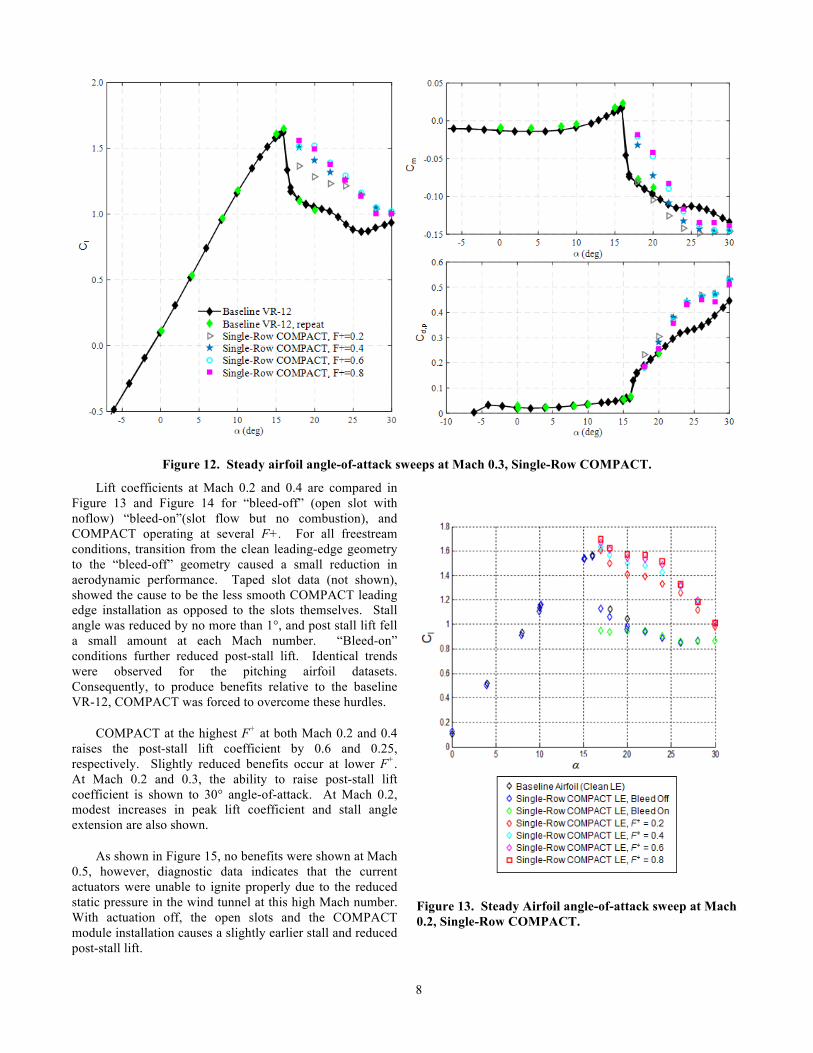
Figure 12 - Figure 16 at Mach numbers from 0.2 to 0.5. Figure 12 shows all three aerodynamic coefficients at Mach 0.3. COMPACT at various frequencies is denoted by F+ = (fpulsec)/U∞, where fpulse is the pulse frequency, c is the airfoil chord, and U∞ is the freestream velocity. F+ = 1 corresponds to one pulse per freestream convection time along the chord. At Mach 0.3, it is shown that COMPACT at all F+ significantly increases post-stall lift coefficient, more so for higher F+.
For the highest F+ of 0.8, negative moment is reduced up to α = 22°, then increased at higher α. Drag coefficient is increased at all post-stall angles. These effects on moment
and drag coefficients are due primarily to the relatively small span of the actuated region. As explained more thoroughly by the analysis provided in Appendix A, reattachment along the actuated region of the airfoil, while the remainder of the airfoil is allowed to stall, results in three-dimensional flow across the span. The variation in lift created induced drag at the mid-span as large as 0.086-0.13 at Mach 0.3, α = 20°. The moment coefficient is largely influenced by the pressure distribution on the aft portion of the airfoil, which is subjected to this three-dimensional flow as well. Given the strong impact of the low actuated aspect ratio upon drag and moment coefficient, the remainder of this paper will focus primarily on lift coefficient.
8
Figure 12. Steady airfoil angle-of-attack sweeps at Mach 0.3, Single-Row COMPACT.
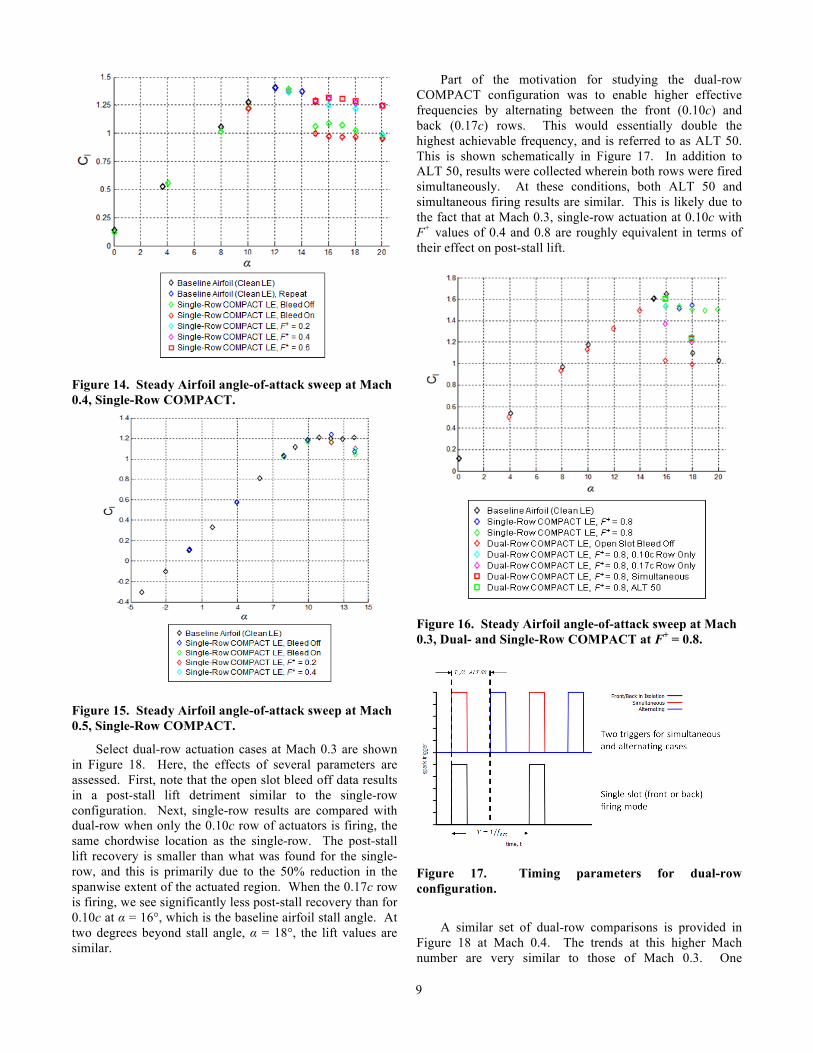
Lift coefficients at Mach 0.2 and 0.4 are compared in Figure 13 and Figure 14 for “bleed-off” (open slot with noflow) “bleed-on”(slot flow but no combustion), and COMPACT operating at several F+. For all freestream conditions, transition from the clean leading-edge geometry to the “bleed-off” geometry caused a small reduction in aerodynamic performance. Taped slot data (not shown), showed the cause to be the less smooth COMPACT leading edge installation as opposed to the slots themselves. Stall angle was reduced by no more than 1°, and post stall lift fell a small amount at each Mach number. “Bleed-on” conditions further reduced post-stall lift. Identical trends were observed for the pitching airfoil datasets. Consequently, to produce benefits relative to the baseline VR-12, COMPACT was forced to overcome these hurdles.
COMPACT at the highest F+ at both Mach 0.2 and 0.4 raises the post-stall lift coefficient by 0.6 and 0.25, respectively. Slightly reduced benefits occur at lower F+. At Mach 0.2 and 0.3, the ability to raise post-stall lift coefficient is shown to 30° angle-of-attack. At Mach 0.2, modest increases in peak lift coefficient and stall angle extension are also shown.
As shown in Figure 15, no benefits were shown at Mach 0.5, however, diagnostic data indicates that the current actuators were unable to ignite properly due to the reduced static pressure in the wind tunnel at this high Mach number. With actuation off, the open slots and the COMPACT module installation causes a slightly earlier stall and reduced post-stall lift.
Figure 13. Steady Airfoil angle-of-attack sweep at Mach 0.2, Single-Row COMPACT.
9
Figure 14. Steady Airfoil angle-of-attack sweep at Mach 0.4, Single-Row COMPACT.
Figure 15. Steady Airfoil angle-of-attack sweep at Mach 0.5, Single-Row COMPACT.
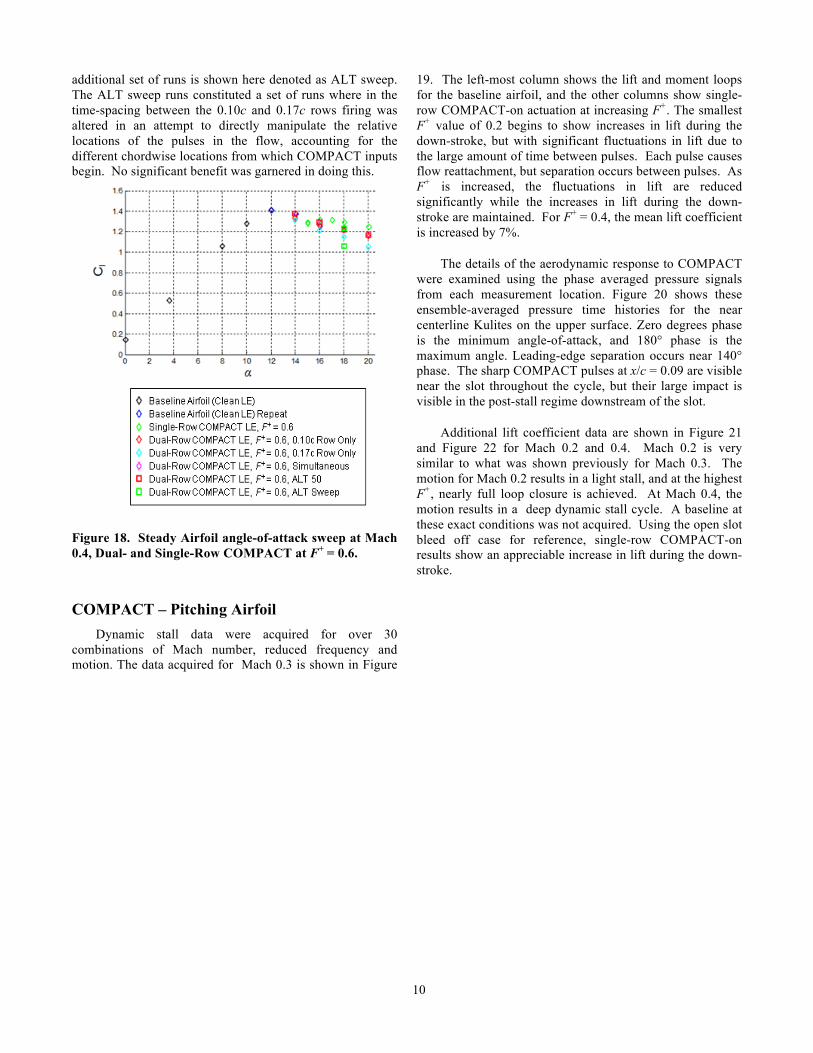
Select dual-row actuation cases at Mach 0.3 are shown in Figure 18. Here, the effects of several parameters are assessed. First, note that the open slot bleed off data results in a post-stall lift detriment similar to the single-row configuration. Next, single-row results are compared with dual-row when only the 0.10c row of actuators is firing, the same chordwise location as the single-row. The post-stall lift recovery is smaller than what was found for the single-row, and this is primarily due to the 50% reduction in the spanwise extent of the actuated region. When the 0.17c row is firing, we see significantly less post-stall recovery than for 0.10c at α = 16°, which is the baseline airfoil stall angle. At two degrees beyond stall angle, α = 18°, the lift values are similar.
Part of the motivation for studying the dual-row COMPACT configuration was to enable higher effective frequencies by alternating between the front (0.10c) and back (0.17c) rows. This would essentially double the highest achievable frequency, and is referred to as ALT 50. This is shown schematically in Figure 17. In addition to ALT 50, results were collected wherein both rows were fired simultaneously. At these conditions, both ALT 50 and simultaneous firing results are similar. This is likely due to the fact that at Mach 0.3, single-row actuation at 0.10c with F+ values of 0.4 and 0.8 are roughly equivalent in terms of their effect on post-stall lift.
Figure 16. Steady Airfoil angle-of-attack sweep at Mach 0.3, Dual- and Single-Row COMPACT at F+ = 0.8.
Figure 17. Timing parameters for dual-row configuration.
A similar set of dual-row comparisons is provided in
Figure 18 at Mach 0.4. The trends at this higher Mach number are very similar to those of Mach 0.3. One
10
additional set of runs is shown here denoted as ALT sweep. The ALT sweep runs constituted a set of runs where in the time-spacing between the 0.10c and 0.17c rows firing was altered in an attempt to directly manipulate the relative locations of the pulses in the flow, accounting for the different chordwise locations from which COMPACT inputs begin. No significant benefit was garnered in doing this.
Figure 18. Steady Airfoil angle-of-attack sweep at Mach 0.4, Dual- and Single-Row COMPACT at F+ = 0.6.
COMPACT – Pitching Airfoil Dynamic stall data were acquired for over 30
combinations of Mach number, reduced frequency and motion. The data acquired for Mach 0.3 is shown in Figure
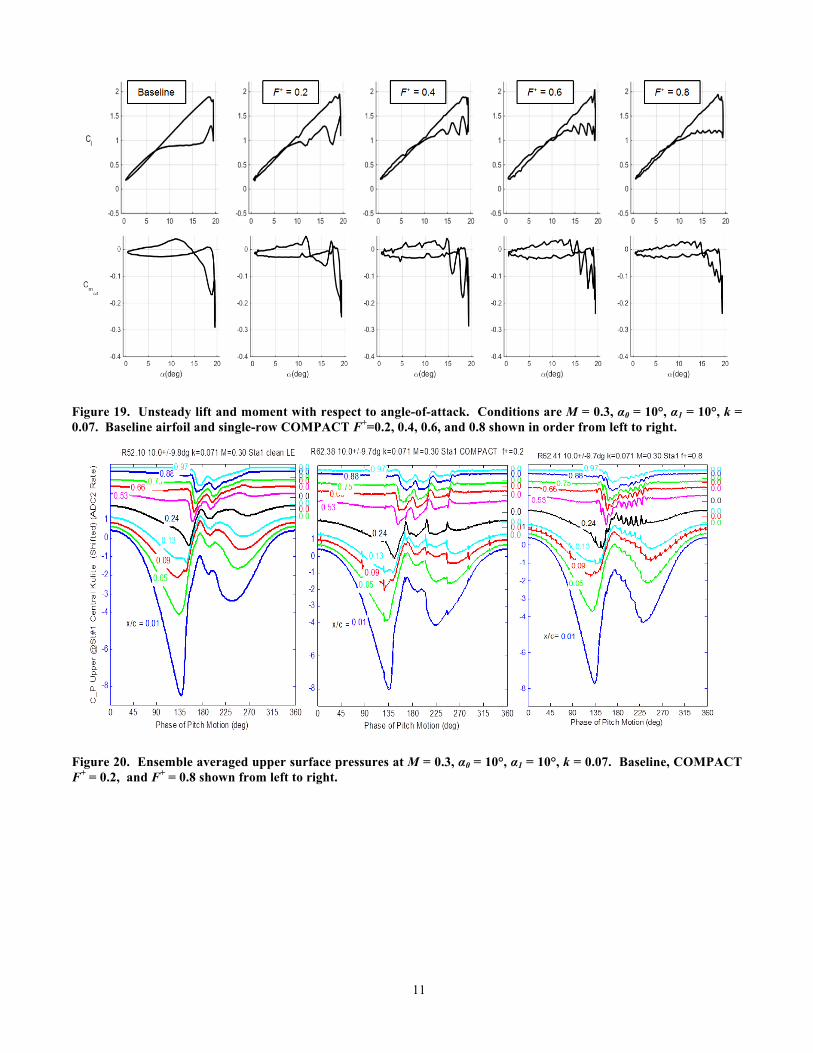
19. The left-most column shows the lift and moment loops for the baseline airfoil, and the other columns show single-row COMPACT-on actuation at increasing F+. The smallest F+ value of 0.2 begins to show increases in lift during the down-stroke, but with significant fluctuations in lift due to the large amount of time between pulses. Each pulse causes flow reattachment, but separation occurs between pulses. As F+ is increased, the fluctuations in lift are reduced significantly while the increases in lift during the down-stroke are maintained. For F+ = 0.4, the mean lift coefficient is increased by 7%.
The details of the aerodynamic response to COMPACT were examined using the phase averaged pressure signals from each measurement location. Figure 20 shows these ensemble-averaged pressure time histories for the near centerline Kulites on the upper surface. Zero degrees phase is the minimum angle-of-attack, and 180° phase is the maximum angle. Leading-edge separation occurs near 140° phase. The sharp COMPACT pulses at x/c = 0.09 are visible near the slot throughout the cycle, but their large impact is visible in the post-stall regime downstream of the slot.
Additional lift coefficient data are shown in Figure 21 and Figure 22 for Mach 0.2 and 0.4. Mach 0.2 is very similar to what was shown previously for Mach 0.3. The motion for Mach 0.2 results in a light stall, and at the highest F+, nearly full loop closure is achieved. At Mach 0.4, the motion results in a deep dynamic stall cycle. A baseline at these exact conditions was not acquired. Using the open slot bleed off case for reference, single-row COMPACT-on results show an appreciable increase in lift during the down-stroke.
11
Figure 19. Unsteady lift and moment with respect to angle-of-attack. Conditions are M = 0.3, α0 = 10°, α1 = 10°, k = 0.07. Baseline airfoil and single-row COMPACT F+=0.2, 0.4, 0.6, and 0.8 shown in order from left to right.
Figure 20. Ensemble averaged upper surface pressures at M = 0.3, α0 = 10°, α1 = 10°, k = 0.07. Baseline, COMPACT F+ = 0.2, and F+ = 0.8 shown from left to right.
12
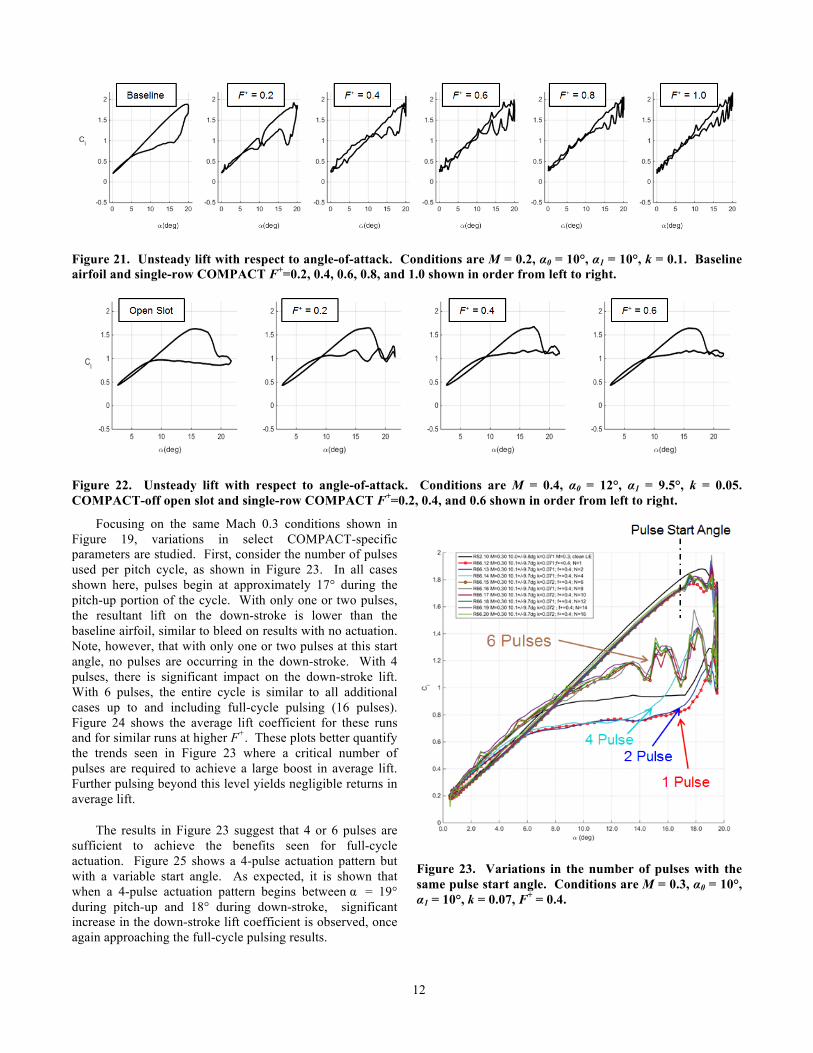
Figure 21. Unsteady lift with respect to angle-of-attack. Conditions are M = 0.2, α0 = 10°, α1 = 10°, k = 0.1. Baseline airfoil and single-row COMPACT F+=0.2, 0.4, 0.6, 0.8, and 1.0 shown in order from left to right.
Figure 22. Unsteady lift with respect to angle-of-attack. Conditions are M = 0.4, α0 = 12°, α1 = 9.5°, k = 0.05. COMPACT-off open slot and single-row COMPACT F+=0.2, 0.4, and 0.6 shown in order from left to right.
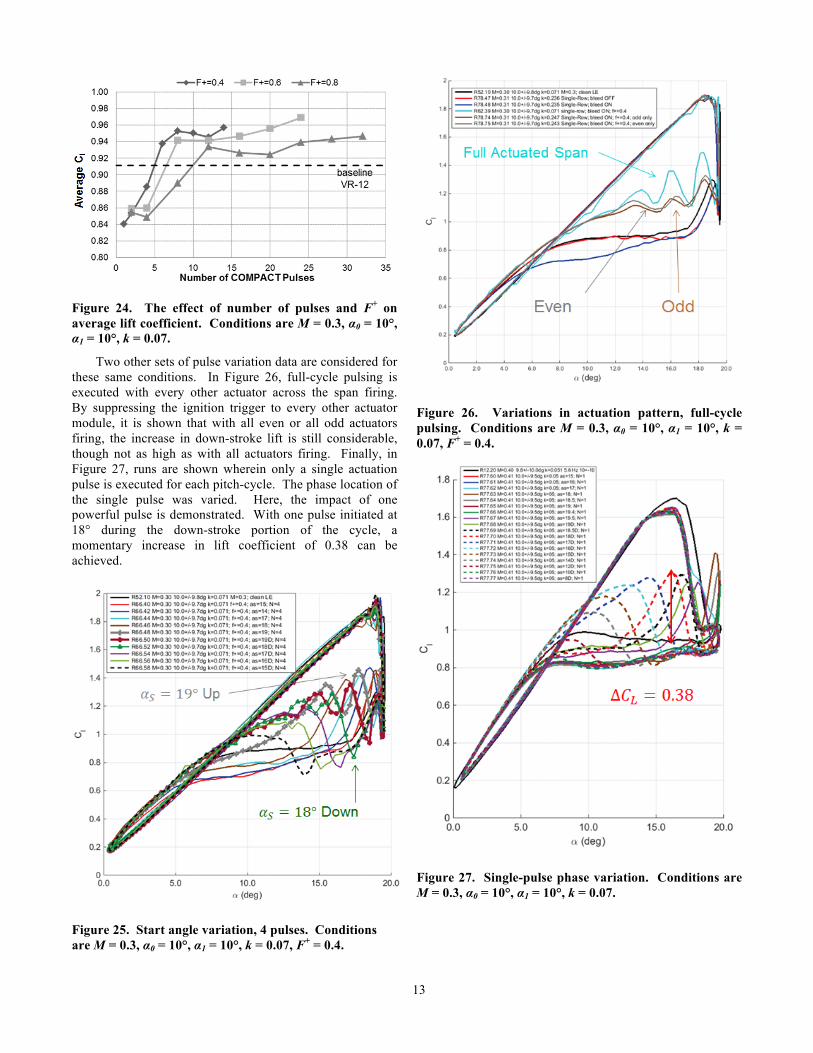
Focusing on the same Mach 0.3 conditions shown in Figure 19, variations in select COMPACT-specific parameters are studied. First, consider the number of pulses used per pitch cycle, as shown in Figure 23. In all cases shown here, pulses begin at approximately 17° during the pitch-up portion of the cycle. With only one or two pulses, the resultant lift on the down-stroke is lower than the baseline airfoil, similar to bleed on results with no actuation. Note, however, that with only one or two pulses at this start angle, no pulses are occurring in the down-stroke. With 4 pulses, there is significant impact on the down-stroke lift. With 6 pulses, the entire cycle is similar to all additional cases up to and including full-cycle pulsing (16 pulses). Figure 24 shows the average lift coefficient for these runs and for similar runs at higher F+. These plots better quantify the trends seen in Figure 23 where a critical number of pulses are required to achieve a large boost in average lift. Further pulsing beyond this level yields negligible returns in average lift.
The results in Figure 23 suggest that 4 or 6 pulses are sufficient to achieve the benefits seen for full-cycle actuation. Figure 25 shows a 4-pulse actuation pattern but with a variable start angle. As expected, it is shown that when a 4-pulse actuation pattern begins between α = 19° during pitch-up and 18° during down-stroke, significant increase in the down-stroke lift coefficient is observed, once again approaching the full-cycle pulsing results.
Figure 23. Variations in the number of pulses with the same pulse start angle. Conditions are M = 0.3, α0 = 10°, α1 = 10°, k = 0.07, F+ = 0.4.
13
Figure 24. The effect of number of pulses and F+ on average lift coefficient. Conditions are M = 0.3, α0 = 10°, α1 = 10°, k = 0.07.
Two other sets of pulse variation data are considered for these same conditions. In Figure 26, full-cycle pulsing is executed with every other actuator across the span firing. By suppressing the ignition trigger to every other actuator module, it is shown that with all even or all odd actuators firing, the increase in down-stroke lift is still considerable, though not as high as with all actuators firing. Finally, in Figure 27, runs are shown wherein only a single actuation pulse is executed for each pitch-cycle. The phase location of the single pulse was varied. Here, the impact of one powerful pulse is demonstrated. With one pulse initiated at 18° during the down-stroke portion of the cycle, a momentary increase in lift coefficient of 0.38 can be achieved.
Figure 25. Start angle variation, 4 pulses. Conditions are M = 0.3, α0 = 10°, α1 = 10°, k = 0.07, F+ = 0.4.
Figure 26. Variations in actuation pattern, full-cycle pulsing. Conditions are M = 0.3, α0 = 10°, α1 = 10°, k = 0.07, F+ = 0.4.
Figure 27. Single-pulse phase variation. Conditions are M = 0.3, α0 = 10°, α1 = 10°, k = 0.07.
14
One significant finding is that effective control can be achieved without having to anticipate stall. The increases in down-stroke lift are primarily caused by pulses immediately before or during the down-stroke.. The increases in down-stroke lift are primarily realized by pulses which occur immediately before or during the down-stroke. This finding has positive implications with regard to reducing the required amount of fuel, minimizing the amount of heat generated, and reducing the complexity of the control system which would be needed for a system using COMPACT.
A full set of pitching airfoil data was collected for the dual-row configuration. In accordance with the steady-state data, as shown in the previous section, none of the pitching airfoil dual-row results provided better enhancement than the single-row and is omitted from this section for brevity. Full datasets for all these results can be found in Ref. [24].
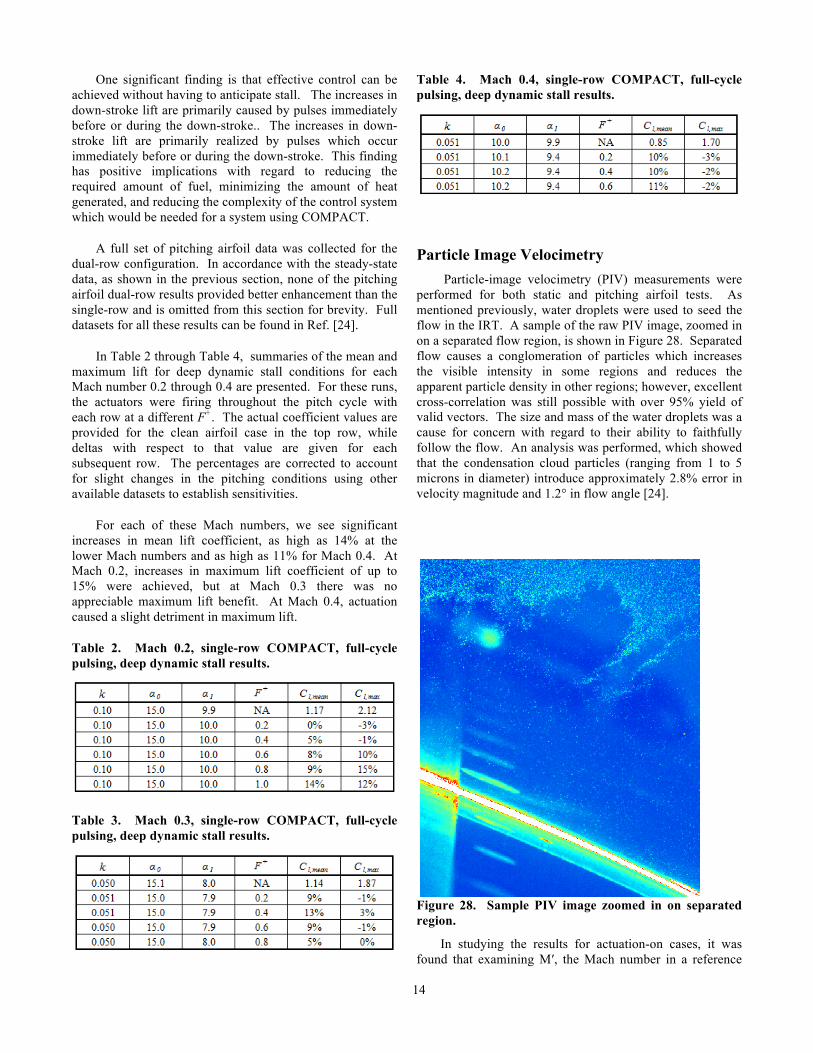
In Table 2 through Table 4, summaries of the mean and maximum lift for deep dynamic stall conditions for each Mach number 0.2 through 0.4 are presented. For these runs, the actuators were firing throughout the pitch cycle with each row at a different F+. The actual coefficient values are provided for the clean airfoil case in the top row, while deltas with respect to that value are given for each subsequent row. The percentages are corrected to account for slight changes in the pitching conditions using other available datasets to establish sensitivities.
For each of these Mach numbers, we see significant increases in mean lift coefficient, as high as 14% at the lower Mach numbers and as high as 11% for Mach 0.4. At Mach 0.2, increases in maximum lift coefficient of up to 15% were achieved, but at Mach 0.3 there was no appreciable maximum lift benefit. At Mach 0.4, actuation caused a slight detriment in maximum lift.
Table 2. Mach 0.2, single-row COMPACT, full-cycle pulsing, deep dynamic stall results.
Table 3. Mach 0.3, single-row COMPACT, full-cycle pulsing, deep dynamic stall results.
Table 4. Mach 0.4, single-row COMPACT, full-cycle pulsing, deep dynamic stall results.
Particle Image Velocimetry Particle-image velocimetry (PIV) measurements were
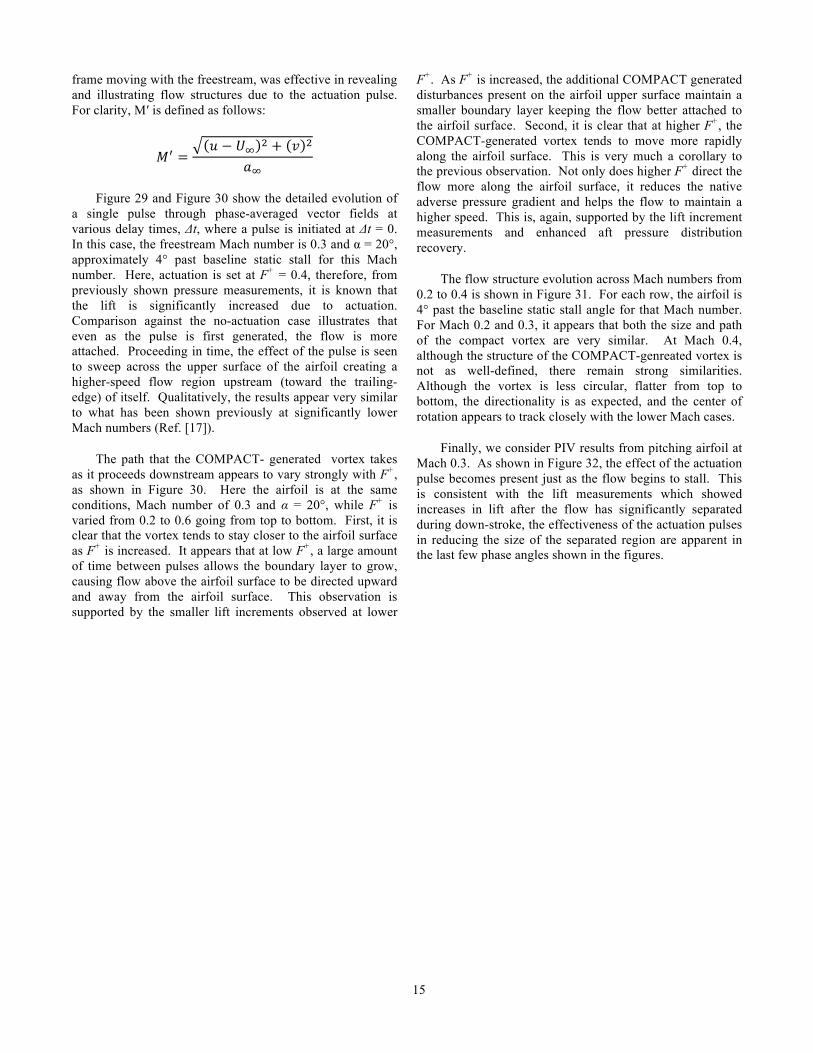
performed for both static and pitching airfoil tests. As mentioned previously, water droplets were used to seed the flow in the IRT. A sample of the raw PIV image, zoomed in on a separated flow region, is shown in Figure 28. Separated flow causes a conglomeration of particles which increases the visible intensity in some regions and reduces the apparent particle density in other regions; however, excellent cross-correlation was still possible with over 95% yield of valid vectors. The size and mass of the water droplets was a cause for concern with regard to their ability to faithfully follow the flow. An analysis was performed, which showed that the condensation cloud particles (ranging from 1 to 5 microns in diameter) introduce approximately 2.8% error in velocity magnitude and 1.2° in flow angle [24].
Figure 28. Sample PIV image zoomed in on separated region.
In studying the results for actuation-on cases, it was found that examining M′, the Mach number in a reference
15
frame moving with the freestream, was effective in revealing and illustrating flow structures due to the actuation pulse. For clarity, M′ is defined as follows:
𝑀! =𝑢 − 𝑈! ! + 𝑣 !
𝑎!
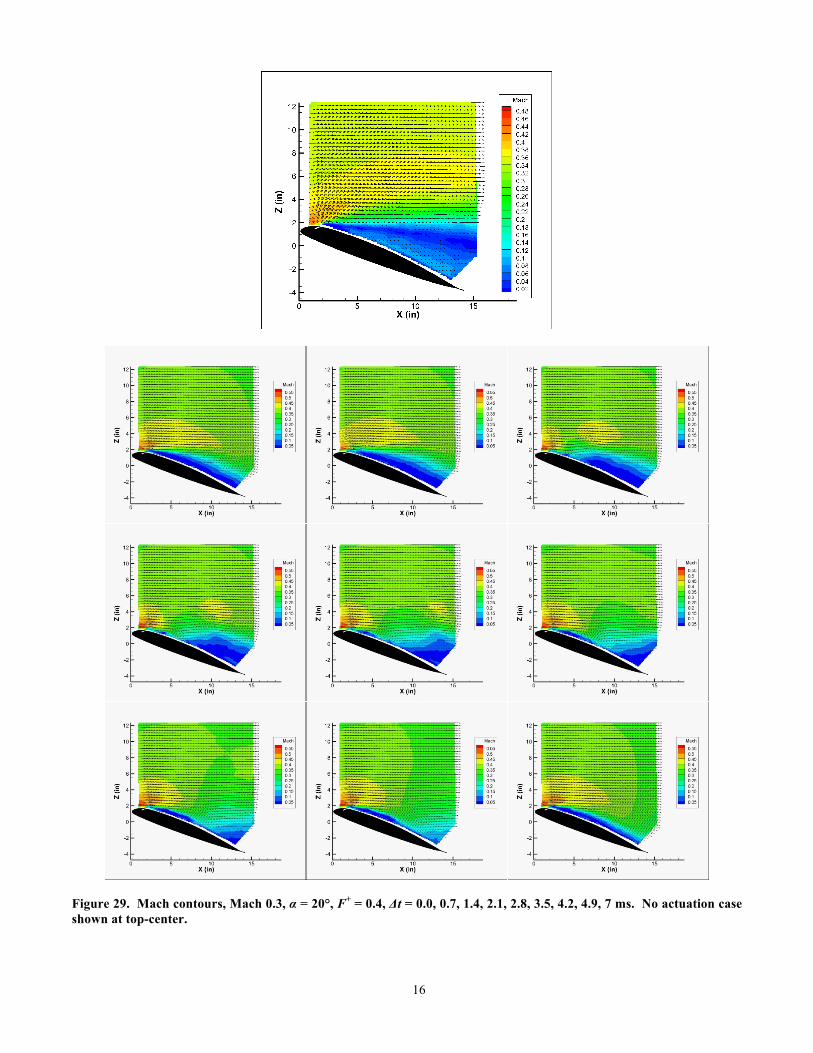
Figure 29 and Figure 30 show the detailed evolution of a single pulse through phase-averaged vector fields at various delay times, Δt, where a pulse is initiated at Δt = 0. In this case, the freestream Mach number is 0.3 and α = 20°, approximately 4° past baseline static stall for this Mach number. Here, actuation is set at F+ = 0.4, therefore, from previously shown pressure measurements, it is known that the lift is significantly increased due to actuation. Comparison against the no-actuation case illustrates that even as the pulse is first generated, the flow is more attached. Proceeding in time, the effect of the pulse is seen to sweep across the upper surface of the airfoil creating a higher-speed flow region upstream (toward the trailing-edge) of itself. Qualitatively, the results appear very similar to what has been shown previously at significantly lower Mach numbers (Ref. [17]).
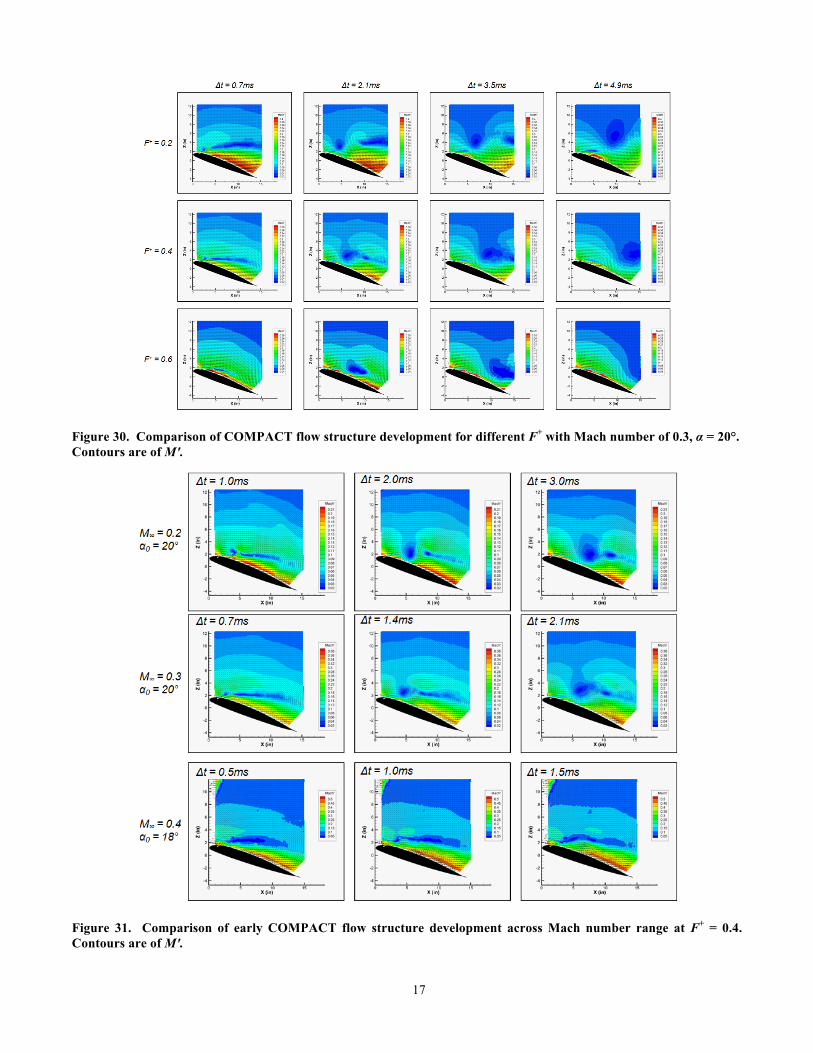
The path that the COMPACT- generated vortex takes as it proceeds downstream appears to vary strongly with F+, as shown in Figure 30. Here the airfoil is at the same conditions, Mach number of 0.3 and α = 20°, while F+ is varied from 0.2 to 0.6 going from top to bottom. First, it is clear that the vortex tends to stay closer to the airfoil surface as F+ is increased. It appears that at low F+, a large amount of time between pulses allows the boundary layer to grow, causing flow above the airfoil surface to be directed upward and away from the airfoil surface. This observation is supported by the smaller lift increments observed at lower
F+. As F+ is increased, the additional COMPACT generated disturbances present on the airfoil upper surface maintain a smaller boundary layer keeping the flow better attached to the airfoil surface. Second, it is clear that at higher F+, the COMPACT-generated vortex tends to move more rapidly along the airfoil surface. This is very much a corollary to the previous observation. Not only does higher F+ direct the flow more along the airfoil surface, it reduces the native adverse pressure gradient and helps the flow to maintain a higher speed. This is, again, supported by the lift increment measurements and enhanced aft pressure distribution recovery.
The flow structure evolution across Mach numbers from 0.2 to 0.4 is shown in Figure 31. For each row, the airfoil is 4° past the baseline static stall angle for that Mach number. For Mach 0.2 and 0.3, it appears that both the size and path of the compact vortex are very similar. At Mach 0.4, although the structure of the COMPACT-genreated vortex is not as well-defined, there remain strong similarities. Although the vortex is less circular, flatter from top to bottom, the directionality is as expected, and the center of rotation appears to track closely with the lower Mach cases.
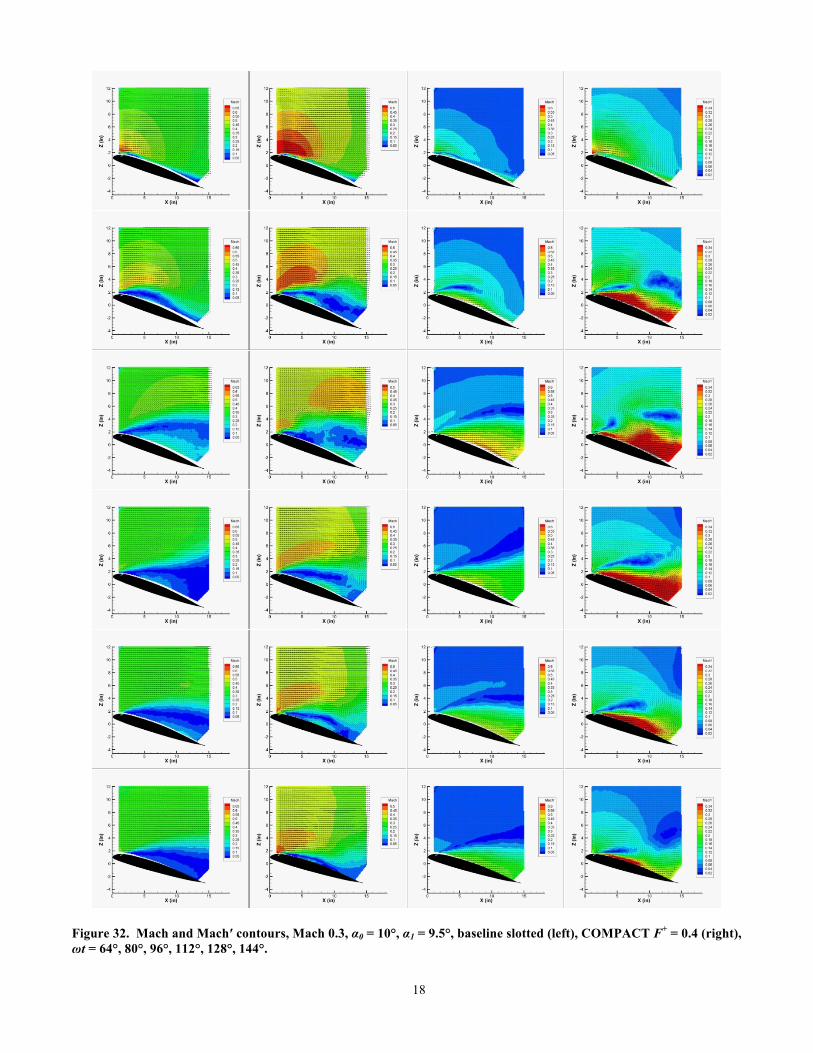
Finally, we consider PIV results from pitching airfoil at Mach 0.3. As shown in Figure 32, the effect of the actuation pulse becomes present just as the flow begins to stall. This is consistent with the lift measurements which showed increases in lift after the flow has significantly separated during down-stroke, the effectiveness of the actuation pulses in reducing the size of the separated region are apparent in the last few phase angles shown in the figures.
16
Figure 29. Mach contours, Mach 0.3, α = 20°, F+ = 0.4, Δt = 0.0, 0.7, 1.4, 2.1, 2.8, 3.5, 4.2, 4.9, 7 ms. No actuation case shown at top-center.
17
Figure 30. Comparison of COMPACT flow structure development for different F+ with Mach number of 0.3, α = 20°. Contours are of M′.
Figure 31. Comparison of early COMPACT flow structure development across Mach number range at F+ = 0.4. Contours are of M′.
18
Figure 32. Mach and Mach′ contours, Mach 0.3, α0 = 10°, α1 = 9.5°, baseline slotted (left), COMPACT F+ = 0.4 (right), ωt = 64°, 80°, 96°, 112°, 128°, 144°.
19
CONCLUSIONS AND RECOMMENDATIONS
This experiment has identified the response of a modern high lift helicopter airfoil to COMPACT high authority unsteady flow control. The primary benefit was a recovery of lift in the post-stall regime for both steady and dynamic stall conditions, which was observed at Mach numbers from 0.2 to 0.4, typical of those on the retreating blade side of a helicopter. More specific conclusions are provided as follows.
1. COMPACT has been shown effective in increasing maximum static lift coefficient at a Mach number of 0.2.
2. COMPACT has been shown effective in increasing static post-stall lift at Mach numbers of 0.3 and 0.4.
3. These benefits were determined relative to the baseline, and occurred even though replacing the smooth baseline leading-edge with the COMPACT leading-edge lowered the static stall angle and reduced post stall lift for conditions when the actuation slots were sealed, when they were open without actuation, and when they were open with steady bleed air present.
4. COMPACT was effective in increasing cycle-averaged lift coefficient at Mach numbers up to 0.4 at a variety of reduced frequencies, amplitudes, and mean angles which range from light to deep stall.
5. Partial cycle COMPACT operation proved as effective increasing cycle-averaged lift coefficient as full-cycle operation. For all actuation frequencies at Mach 0.3 and Mach 0.4, actuation was only required over 1/3rd of the pitch cycle. The optimum actuation incidence range corresponded to starting COMPACT prior to moment stall and continuing through the start of the down-stroke. Actuation through the mean angle on the down-stroke was not shown to be necessary.
6. Although not as effective as uninterrupted spanwise actuation, non-continuous span operation of the single-row COMPACT configuration showed a strong ability to improve post-stall lift behavior. This offers potential for hydrogen storage reduction.
7. Simultaneous or alternating operation of the dual-row COMPACT configuration outperformed single-row post-stall lift benefits for the same actuated wing span.
8. Changes in equivalent 2D drag coefficient due to COMPACT were not quantified from experiments
because the relatively low actuated span caused significant induced drag.
9. Flow field measurements at Mach numbers up to 0.4 showed that the physical mechanisms responsible for enhancements shown previously at low Mach numbers behave in very much the same way at Mach numbers up to 0.4.
10. A strong dependency in effectiveness upon actuation frequency was shown in both the simulations and experiments, suggesting a continued need to push the boundary on maximum possible frequency. However, non-dimensional actuation frequencies (F+) as low as 0.4 were shown effective in producing strong lift benefits at Mach 0.4.
ACKNOWLEDGEMENTS The authors gratefully acknowledge NASA for their
support of this work under contract number NNC12CA36C, Susan Gorton, NASA Rotary Wing Project Leader. Thanks are also extended to Archer Jennings (UTRC) and Svytoslav Yorish (Georgia Tech) for support during the IRT test, to the model designers Andrzej Kuczek (UTRC), Ben Isabella (Sikorsky), and Robert Beatty (Sikorsky), and to Callum Gray (Lavision, Inc.) for assistance with the PIV measurements. The support of the NASA Glenn Research Center IRT staff directly contributed to the project’s success.
REFERENCES
[1] P. Lorber, A. Bagai and B. Wake, "Design and Evaluation of Slatted Airfoils for Improved Rotor Performance," AHS International 62nd Annual Forum, 2006.
[2] A. Le Pape, M. Costes, F. Richez, G. Joubert, F. David and J.-M. Deluc, "Dynamic Stall Control Using Deployable Leading-Edge Vortex Generators," AIAA Journal, Vol. 50 No. 10, 2012.
[3] C. L. Kelley, P. Bowles, J. Cooney, C. He, T. C. Corke, B. Osborne, J. Silkey and J. Zehnle, "High Mach Number Leading-Edge Flow Separation Using AC DBD Plasma Actuators," AIAA Paper, 2012.
[4] M. Frankhouser, K. Hird, S. Naigle, J. Gregory and J. Bons, "Nanosecond Dielectric Barrier Discharge Plasma Actuator Flow Control of Compressible Dynamic Stall," AIAA Aviation Conference, June 22-26, Dallas, TX, 2015.
[5] B. E. Wake and E. A. Lurie, "Computational Evaluation of Directed Synthetic Jets for Dynamic Stall Control," AHS International 57th Annual Forum, 2001.
[6] R. Florea and B. E. Wake, "Parametric Analysis of Directed-Synthetic Jets for Improved Dynamic-Stall Performance," 41st Aerospace Sciences Meeting and
20
Exhibit, 2003. [7] R. Raju, R. Mittal and L. Cattafesta, "Dynamics of
Airfoil Separation Control Using Zero-Net Mass-Flux Forcing," AIAA Journal, Vol. 46, No. 12, 2008.
[8] M. Visbal, "Numerical Exploration of Flow Control for Delay of Dynamic Stall on a Pitching Airfoil," 32nd AIAA Applied Aerodynamics Conference, 2014.
[9] A. D. Gardner, K. Richter, H. Mai and D. Neuhaus, "Experimental Investigation of Air Jets for the Control of Compressible Dynamic Stall," Journal of the American Helicopter Society, Vol. 58, No. 4, 2013.
[10] D. Greenblatt and I. Wygnanski, "Dynamic Stall Control by Periodic Excitation, Part I: NACA 0015 Parametric Study," Journal of Aircraft, Vol. 38, No. 3, 2001.
[11] H. Nagib, J. Kiedaisch, D. Greenblatt, I. Wygnanski and A. Hassan, "Effective Flow Control for Rotorcraft Applications at Flight Mach Numbers," AIAA 31st Fluid Dynamics Conference, 11-14 June, Anaheim, CA, 2001.
[12] L. W. Traub, A. Miller and O. Rediniotis, "Effects of Synthetic Jet Actuation on a Ramping NACA 0015 Airfoil," Journal of Aircraft, Vol. 41, No. 5, 2004.
[13] I. Wygnanski and A. Seifert, "The Control of Separation by Periodic Oscillations," AIAA 18th Aerospace Ground Testing Conference, Colorado Springs CO, 1994.
[14] P. Lorber, D. McCormick, T. Anderson, B. Wake, D. MacMartin, M. Pollack, T. Corke and K. Breuer, "Rotorcraft Retreating Blade Stall Control," AIAA FLUIDS 2000 Conference and Exhibit, Denver Colorado,19-22 June 2000, 2000.
[15] D. Weaver, K. McAlister and J. Tso, "Suppression of Dynamic Stall by Steady and Pulsed Upper Surface Blowing," 16th AIAA Applied Aerodynamics Conference, 1998.
[16] T. Crittenden, A. Glezer, R. Funk and D. Parekh, "Combustion-Driven Jet Actuators for Flow Control," 31st AIAA Fluid Dynamics Conference and Exhibit, Anaheim, CA, 2001.
[17] G. Woo, T. Crittenden and A. Glezer, "Transitory Separation Control over a Stalled Airfoil," AIAA Paper, 2009.
[18] C. G. Matalanis, B.-Y. Min, P. O. Bowles, S. Jee, B. E.Wake, T. M. Crittenden, G. Woo and A. Glezer, "Combustion-Powered Actuation for Dynamic-Stall Suppression: High-Mach Simulations and Low-Mach Experiments," AIAA Journal, Vol. 53, No. 8, August 2015.
[19] D. Brzozowski, G. Woo, J. Culp and A. Glezer, "Transient Separation Control Using Pulse-Combustion Actuation," AIAA Journal, Vol. 48, No. 11, 2010.
[20] S. Jee, C. Matalanis, B.-Y. Min, P. Bowles, B. Wake, T. Crittenden and A. Glezer, "Computations of Dynamic Stall Control with Combustion-Powered Actuation,"
AHS 71st Annual Forum, Virginia Beach, VA, 2015. [21] P. Lorber, R. Flemming, J. O'Neill, R. Narducci, T.
Reinert, L. Sankar and J. Kim, "Oscillating Iced Airfoil Pressure Measurement and Computation," American Helicopter Society 69th Annual Forum, Fort Worth Texas, May 21-23, 2013.
[22] M. Marcolini, P. Lorber, W. Miller and A. Covino, "Frequency Response Calibration of Recess-Mounted Pressure Transducers," NASA Technical Memorandum 104031, March, 1991.
[23] H. Berg and H. Tijdeman, "Theoretical and Experimental Results for the Dynamic Response of Pressure Measuring Systems," National Aerospace Lab NLR-TR F-238, Jan., Amsterdam, Netherlands, 1965.
[24] C. Matalanis, P. Bowles, S. Jee, B.-Y. Min, A. Kuczek, P. Croteau, B. Wake, T. Crittenden, A. Glezer and P. Lorber, "Dynamic Stall Suppression Using Combustion-Powered Actuation (COMPACT)," NASA/CR, submitted, 2016.
APPENDIX A: INDUCED DRAG ESTIMATE The limited span of the actuated region had important
effects on the coefficients measured at the mid-span for actuation-on cases. Although no attempt was made to correct the coefficients for these effects, the following analysis provides estimates on how the coefficients measured, particularly drag, may be affected by the limited actuated span.
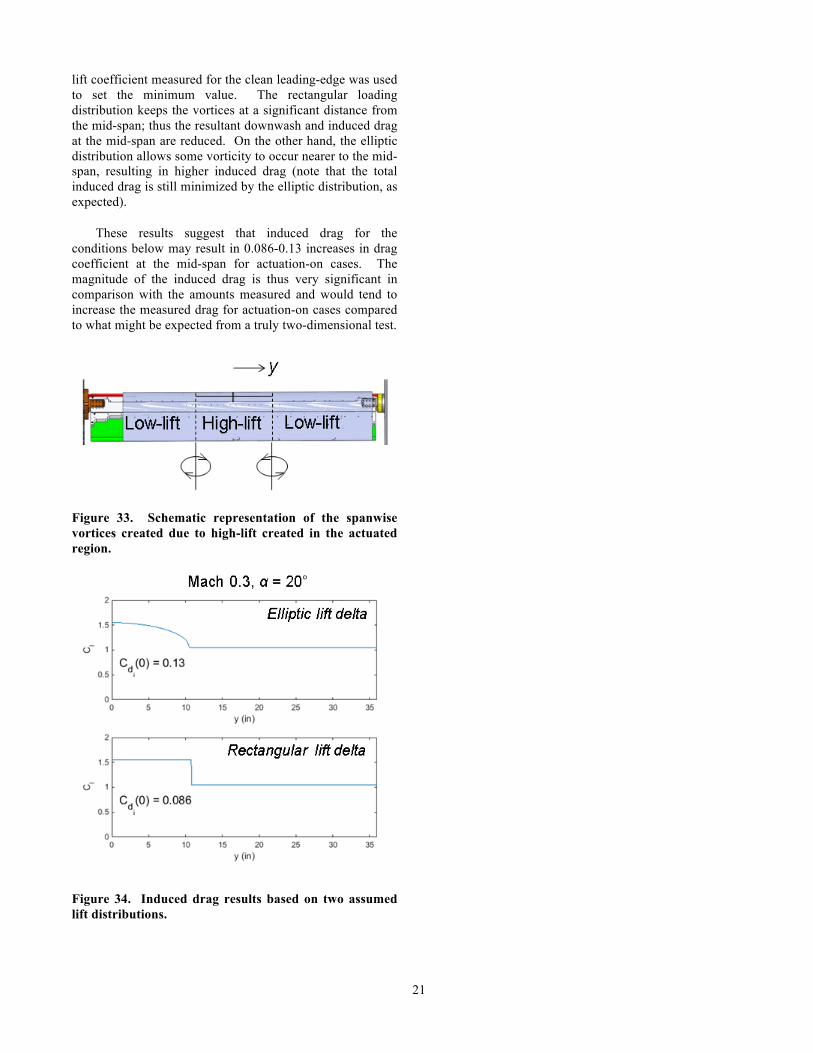
Only 33.1% of the span of the airfoil was actuated in the single-row configuration. As such, when actuation is working effectively and reattaching flow in this region, raising the local lift coefficient at the mid-span, a loading distribution wherein high-lift occurs at the mid-span while nominal lift occurs elsewhere is created, as shown in the schematic of Figure 33. When the local lift coefficient varies about the span in this manner, the local circulation varies as well, and this suggests that spanwise vorticity will occur about this region, resulting in counter-rotating vortices oriented as in Figure 33. These vortices create a downwash over the wing, which can be calculated using Biot-Savart law for an array of semi-infinite vortices governed by
𝑑𝑤 =!"!"!"
!! !!!!.
For the purposes of this analysis, y is defined as shown in Figure 33. Since the loading distribution is not known, two loading distributions were assumed and used to band the range of induced drag at the mid-span. Results for elliptic and rectangular loading distributions are shown in Figure 34. To construct these distributions, experimental results from Mach 0.3, α = 20° cases for the clean leading-edge and F+ = 0.4 are used. The lift coefficient measured for F+ = 0.4 was used to set the peak value in the distribution (at y = 0). The
21
lift coefficient measured for the clean leading-edge was used to set the minimum value. The rectangular loading distribution keeps the vortices at a significant distance from the mid-span; thus the resultant downwash and induced drag at the mid-span are reduced. On the other hand, the elliptic distribution allows some vorticity to occur nearer to the mid-span, resulting in higher induced drag (note that the total induced drag is still minimized by the elliptic distribution, as expected).
These results suggest that induced drag for the conditions below may result in 0.086-0.13 increases in drag coefficient at the mid-span for actuation-on cases. The magnitude of the induced drag is thus very significant in comparison with the amounts measured and would tend to increase the measured drag for actuation-on cases compared to what might be expected from a truly two-dimensional test.
Figure 33. Schematic representation of the spanwise vortices created due to high-lift created in the actuated region.
Figure 34. Induced drag results based on two assumed lift distributions.