Embed Size (px)
Citation preview

Engineering Fracture Mechanics 74 (2007) 1928–1941
www.elsevier.com/locate/engfracmech
High-speed photography of compressed human trabecularbone correlates whitening to microscopic damage
P.J. Thurner a,*, B. Erickson a, R. Jungmann a, Z. Schriock a, J.C. Weaver b,G.E. Fantner a, G. Schitter a, D.E. Morse b, P.K. Hansma a
a Physics Department, Hansma Lab – Broida Hall, University of California, Santa Barbara, CA 93106, USAb Department of Molecular, Cellular and Developmental Biology, University of California, Santa Barbara, CA, USA
Received 19 January 2006; received in revised form 21 May 2006; accepted 31 May 2006Available online 4 August 2006
Abstract
Mechanical testing of trabecular bone is mainly motivated by the huge impact of osteoporosis in post-menopausalwomen and the aged in society in terms of social and health care costs. Trabecular bone loss and impairment of its mechan-ical properties reduce bone strength and increase fracture risk, especially in vertebrae. It is generally accepted that in addi-tion to bone mineral density, microarchitecture and material properties of bone also play important roles for bone strengthand fracture risk. In order to overcome the limitations of standard mechanical tests delivering merely integral informationabout complicated samples, experiments were designed for step-wise mechanical testing with concurrent imaging of trabec-ular and cortical bone. In this communication we present an approach for real-time imaging of trabecular bone duringcompression using high-speed photography and investigate the hypothesis whether the whitening of deformed trabeculaeis due to microdamage. Experiments on human trabecular bone samples from a healthy male donor revealed that failure ofsuch samples is highly localized in fracture bands. Moreover, strongly deformed trabeculae were seen to whiten, an effectsimilar to stress whitening in polymers. Scanning Electron Microscopy of the same regions of interest revealed that whit-ened trabeculae were strongly damaged by microscopic cracks and mostly failed in delamination. Higher resolution imagesuncovered mineralized collagen fibrils spanning the cracks. The whitening partially faded after unloading of the samples,presumably due to partial crack closure. Overall, high-speed photography enables microdamage detection in real-time dur-ing a mechanical test and provides a correlation to recorded stress strain curves.� 2006 Elsevier Ltd. All rights reserved.
Keywords: Trabecular bone; Fracture; High-speed photography; Stress-whitening; Microdamage; Delamination
1. Introduction
Mechanical testing of trabecular bone is a vast experimental field [3,6,11–14,31]. This research is mainlymotivated by the reduction of bone strength due to osteoporosis, a systemic skeletal disease [10,18], which
0013-7944/$ - see front matter � 2006 Elsevier Ltd. All rights reserved.
doi:10.1016/j.engfracmech.2006.05.024
* Corresponding author. Tel.: +1 805 893 3999. fax: +1 805 893 8315.E-mail address: [email protected] (P.J. Thurner).

P.J. Thurner et al. / Engineering Fracture Mechanics 74 (2007) 1928–1941 1929
comes with a concomitant increase of fracture risk. Post-menopausal women and the elderly are affected bythis disease, along with certain younger populations. Osteoporosis also has a huge impact on society as itresults in immense health care costs (13.8 billions of US$ in the USA alone in 1995) [25].
Trabecular bone is situated at the end of the long bones and in the spinal column, where it fills all of theinner vertebral space. In the long bones it transfers loads from joint surfaces onto the midshaft of the bone; inlumbar vertebrae, trabecular bone carries and transfers about 90% of the applied load [16,27]. Thus a loss oftrabecular bone and/or impairment of its mechanical properties reduce bone strength and increase fracturerisk, especially in vertebrae. The definition of osteoporosis is still based on bone density, i.e. a density 2.5 stan-dard deviations lower than the healthy young normal is considered osteoporotic [34]. While, this definitionproves to be adequate for a large population [11,17,26,35] it fails to be accurate for the individual. In factsometimes up to 90% of the variation in bone strength are left unexplained on an individual basis [4], indicat-ing the severe limitations in assessing fracture risk in patients by measuring bone density. It is generallyaccepted that microarchitecture and material properties of bone also play an important role for bone strengthand fracture risk.
Standard mechanical tests, however, deliver only integral information on a bone specimen and no informa-tion of local processes experienced in the elastic, yield, and post-yield region. Failure of trabecular bone can inthis way only be assessed in a post-hoc fashion, investigating sections or fracture patterns. In order to closethis gap, experiments have been devised combining mechanical testing and imaging (so called functional imag-ing) of trabecular and also cortical bone [2,19,22,23,29,30]. Such functional imaging approaches give directinsight into the translation of apparent strains in trabecular and cortical bone. In both cases apparent straincan result in a broad range of local strains. Most of these functional imaging approaches deliver 3D informa-tion, however, they all are time consuming and thus limited to slow, quasi-static testing and/or recording ofonly a few different states of a sample subjected to mechanical testing. In contrast, high-speed photography isdesigned to record very fast processes, which allows for uncovering the failure dynamics of bone samples sub-jected to mechanical testing in a 2D fashion in real time.
In this communication we present images as well as quantitative data of the whitening effect found in boneas a consequence of overloading. This whitening effect was, to the best of our knowledge, mentioned in liter-ature only once by Currey [5], who hypothesized it to be due to microcracking but also stated that experimen-tal evidence (not shown in [5]) was not conclusive. In order to investigate the hypothesis whether whitening ofbone is due to microdamage, we built a custom mechanical testing system that was combined with a high-speed camera in order to image trabecular bone while being mechanically tested in compression. Our resultsshow that whitening in trabecular bone occurs in strongly deformed regions and SEM images of these regionsprovide proof for our hypothesis that whitening is due to microdamage.
2. Materials and methods
2.1. Sample preparation
We investigated a total of 14 bone samples isolated from a previously healthy male donor 21 years of agewith no diagnosed bone disease. Bone samples with a height of about 4 mm and a cross-sectional area of about4.9 mm by 4.9 mm were cut from vertebrae using a bandsaw (Marmed Inc. Cleveland, OH, USA) under con-stant irrigation with tap water. The smaller sample dimension is oriented in the original principal load bearingdirection. Bone marrow was extracted from the specimens using a jet of pressurized water. All bone sampleswere weighed and their exact dimensions after preparation were measured using a pair of calipers. Mean sam-ple dimensions, mass and density are given in Table 1.
2.2. Mechanical testing
A photograph of the experimental setup including the high-speed camera system is shown in Fig. 1A. Com-pression testing of all samples was done using a custom-made mechanical testing device, consisting of a loadframe and a piston driven by a stepper motor. The piston impinges onto the transparent sample chamber(shown in Fig. 1B), made from PMMA consisting of a frame and a plunger, which applies the displacement

Table 1Mean (N = 14) specimen dimension, mass, apparent density, elastic modulus, yield stress and strain as well as failure stress and strain
Parameter Average Standard deviation
Width [mm] 4.84 0.09Length [mm] 4.89 0.04Height [mm] 4.18 0.22Mass [mg] 38.3 5.8Apparent density [g/cm3] 0.39 0.06Elastic modulus [MPa] 104 30Yield stress [MPa] 5.4 1.4Yield strain [%] 5.6 1.0Failure stress [MPa] 6.1 1.6Failure strain [%] 8.9 2.2
Fig. 1. Photograph of the custom mechanical testing device (A) used for the experiments. A high-speed camera is used to record the bonesample during compression. The sample is kept submerged in physiological buffer in a transparent sample holder (B).
1930 P.J. Thurner et al. / Engineering Fracture Mechanics 74 (2007) 1928–1941

P.J. Thurner et al. / Engineering Fracture Mechanics 74 (2007) 1928–1941 1931
onto the sample. The sample chamber has a fluid inlet and outlet, allowing for immersion of the specimen influid, in this case a buffer, containing 150 mM NaCl, and10 mM Hepes, at pH 7.0. The load exerted onto thesample was measured with a 100 lb capacity load cell (Model LBC-100, Transducer Techniques Inc., Teme-cula, CA, USA), which was mounted onto the lower end of the piston. Total displacement was measured witha laser distance sensor with 5 lm resolution (Baumer Electric OADM 12I6430/S35A, Frauenfeld, Switzer-land). The experiment was controlled using a PC with an internal DAQ card (NI PCI-6013, National Instru-ments, Austin, TX, USA), an external I/O card (NI BNC 2110, National Instruments, Austin, TX, USA), andLabView (National Instruments, Austin, TX, USA). A strain rate of 50%/s was used for all mechanical tests.The mechanical tests consisted of two phases: in a first phase the piston was lowered slowly until a preload of0.5 N was reached, in order to find the sample top. In a second phase the sample was then loaded at a constantstrain rate up to 50% deformation. All stress strain curves were corrected for the toe regions they exhibited atlow strains: a linear fit performed in the elastic region (i.e. the most linear region) of the stress strain curve wasextrapolated and its intersection with zero stress was defined as the true zero strain. From these correctedstress strain curves, elastic modulus, yield stress and strain, as well as failure stress and strain were retrieved.Failure was defined as the first local maximum in each stress–strain curve. The average values of the extractedparameters are given in Table 1. In addition all stress–strain curves were re-sampled onto a common grid inorder to compute an average stress strain curve for all 14 samples.
2.3. High-speed photography
We used an Ultima 512 high-speed camera (Photron Inc., San Diego, CA, USA) equipped with a KC lens,with a KC-AUX and an IF-3 lens mounted on top (Infinity, Boulder, CO, USA). The high-speed camera canrecord up to 32,000 frames/s but offers limited memory of 512 MB. We recorded images at 500 frames/s and ashutter opening time of 1/10,000 s as well as 60 frames/s and a shutter opening time of 1/12,000. The scene wasilluminated from the front using two fiber lights (MH-100, Dolan Jenner Industries Inc., Lawrence, MA,USA) at angles of about ±45� (cp. Fig. 1).
2.4. Image processing
All recorded movies where cropped to the region of the mechanical test using Image J (National Institute ofHealth, Bethesda, MD, USA). A texture correlation [1] algorithm was then applied using IDL (Research Sys-tems Inc., Boulder, CO, USA) on the individual frames in order to detect the motion of the plunger. A regionof interest with high contrast was selected on the plunger and tracked in subsequent recorded frames. Thetracking allowed synchronization between recorded image data and stress–strain curves. For the quantifica-tion of whitening seen during compression of the samples, a thresholding algorithm, programmed in LabViewwas used. Due to flickering of the fiber lights during the experiments the threshold was determined from thehistograms of five consecutive frames prior to compression, since five frames accounted for the approximateperiod of the intensity flickering. From each of the five histograms the highest pixel value (lying between 0 and255) was determined. The average value of these five values was calculated and subsequently used as thethreshold, i.e. all pixels having a higher value were counted as whitened pixels in each frame. Due to flickeringof the fiber lights the raw whitening curve exhibited a considerable amount of noise, such that a median filter(rank 100) was applied. 150 frames (or more), before the beginning and after the end of the relevant framesshowing sample compression, were included in the filtering in order to suppress artifacts in filtered curves.
2.5. Scanning electron microscopy (SEM)
For low-resolution electron microscopy the samples were rinsed briefly with water and 95% ethanol toremove residual buffer and then transferred to a custom-made aluminum vise. Subsequently they were airdried, contacted with silver paint, sputtercoated with gold, and imaged with an SEM (Model: Vega TS5130MM, Tescan, Brno, Czech Republic). All images were recorded with an accelerating voltage of20 keV. Higher resolution electron micrographs were obtained using a focused ion beam machine (Model:DB235 Dual-Beam Focus Ion Beam System, FEI Company, Hillsboro, OR, USA) in SEM mode with an

1932 P.J. Thurner et al. / Engineering Fracture Mechanics 74 (2007) 1928–1941
acceleration voltage of 10 keV. Prior to this imaging experiment, the samples were further sputtercoated withgold-palladium to reduce charging in the cracks.
3. Results
High-speed photography images of one of the trabecular bone samples during compression are presented inFig. 2. It can be seen from these frames that the apparent strain imposed on the sample is translated into abroad range of local strains. At the failure point (at 8.4%), most of the bone structure looks more or less intact,only a few trabeculae are seen to deform and fail (cp. Figs. 2 and 3). Even at strains between 20% and 30% wefind quite a few undeformed trabeculae as can be seen for example in the bottom left of the respective framesin Fig. 2. Deformed trabeculae are seen to whiten with increasing strain. This effect can be best seen in Fig. 3,which shows the magnified detail of the high-speed photography sequence marked with a black frame in themiddle-left of the sample in Fig. 2. Here the whitening starts at around 4% apparent strain, very close to theyield strain of 4.8%. In Fig. 4A, corrected stress–strain data (black curve) for one of the trabecular bone sam-
Fig. 2. High-speed photography frames of a whole trabecular bone sample under compression. Deformed trabeculae are seen to whiten.The white and black frames at 0% strain correspond to regions of interest shown in Figs. 3, 5, 7, 8 and 9.

Fig. 3. Detail of the high-speed photography frames shown in Fig. 2 (black frame in the middle of the left side) at different strains showingthe progression of the whitening from the plastic region to post-failure region.
P.J. Thurner et al. / Engineering Fracture Mechanics 74 (2007) 1928–1941 1933
ples is shown as well as the whitening progression (grey curve) with increasing strain. The stress–strain curveexhibits a non-linear toe-region and a linear elastic region, prior to yield and failure occurring at 4.8% strainand 8.4% strain, respectively, both indicated with a red line. After failure, a slight negative modulus isobserved, followed by a positive slope due to compaction of the sample. In the inset in Fig. 4A bothstress–strain and whitening curves are given on a different scale in order to illustrate the fact that the detectedwhitening steeply increases just above the yield point. The black dots on the stress–strain curve in the inset inFig. 4A correspond to the individual images shown in Fig. 3, whereas the open circles on the stress–straincurve in Fig. 4A correspond to the high-speed photography frames of the same sample shown in Fig. 2. Com-paring the high-speed photography data corresponding to the toe-region of the stress–strain curve reveals thatin this region, loading results in translation and deformation of the sample. This is presumably due to the factthat the sample faces loaded in compression are not cut perfectly parallel to each other. The average stress–strain and whitening curves for all 14 samples are presented in Fig. 4B and C, respectively. Again, the whit-ening curve is shown on a different scale in the inset of Fig. 4C in order to illustrate the strong increase of thewhitening in the plastic region, just above the yield point. Both average curves in Fig. 4B and C are very sim-ilar to the curves of the individual sample shown in Fig. 4A. Again, the stress–strain curve exhibits a non-lin-ear toe-region and a linear elastic region, prior to yield and failure occurring at 5.6% strain and 8.9% strain,respectively, both indicated with a red line. Also, after failure, a slight negative modulus is observed, followedby a positive slope due to compaction. Similarly to the whitening of the individual sample, the average whit-ening exhibits a steep increase just above the yield point and finally saturates in the compaction region. Aftermechanical testing a few samples were secured in their recovered state and imaged with SEM. In the sample,presented in Figs. 2 and 3, we investigated several regions of interest (ROI), one of them containing thestrongly deformed trabecula shown at different strains in Fig. 3, and another one containing a trabecula that

0
2
4
6
8
10
0 20 400
1
2
3
4
4 80
100
200
0
2
4
6
8
10
0
1
2
3
4
2 6 1002468
0
100
200
strain [%]
A
B
C
yield failure
stre
ss [
MPa
]st
ress
[M
Pa]
whi
teni
ng [
pix*
104
]w
hitening [pix* 104]
Fig. 4. Representative stress–strain and (black) whitening curves (gray) of one of the trabecular bone samples (A); the same curves aregiven on a different scale in the inset. Open circles on the curve and full circles in the inset correspond to the frames shown in Figs. 2 and 3,respectively. Average stress–strain (B) and whitening (C) curves for all 14 samples look similar to the curves of the individual sample.Again the whitening curve is shown on a different scale in the inset (C). The red lines (online version) indicate the yield and failure strainsof the individual sample (A) and average of all samples (B, C), respectively.
1934 P.J. Thurner et al. / Engineering Fracture Mechanics 74 (2007) 1928–1941
did not exhibit obvious deformation even at 46% apparent strain. Both these ROIs are marked with blackframes in Fig. 2. The comparison between high-speed photography and SEM of the whitened trabecula isgiven in Fig. 5. The corresponding morphology can be easily seen. The SE micrographs show that the whit-ened region is severely damaged. As can be clearly seen in Fig. 5C two microcracks are situated on the surface,both bridged by ligaments (cp. Fig. 5D). The upper crack seen in Fig. 5B and Fig. 6A was investigated in moredetail with SEM at higher resolution. Relatively undamaged filaments are bridging the crack (cp. Fig. 6B),which consist of mineralized collagen fibrils, as can be seen in Fig. 6C and D. In contrast, no severe damagewas seen in the region of interest (cp. Fig. 2) where no whitening is detected and no obvious deformation isseen in the high-speed photography movie. The comparison of SE micrographs with the ROI containing thetrabecula with no evident deformation is presented in Fig. 7. In this ROI, no large cracks can be discerned,
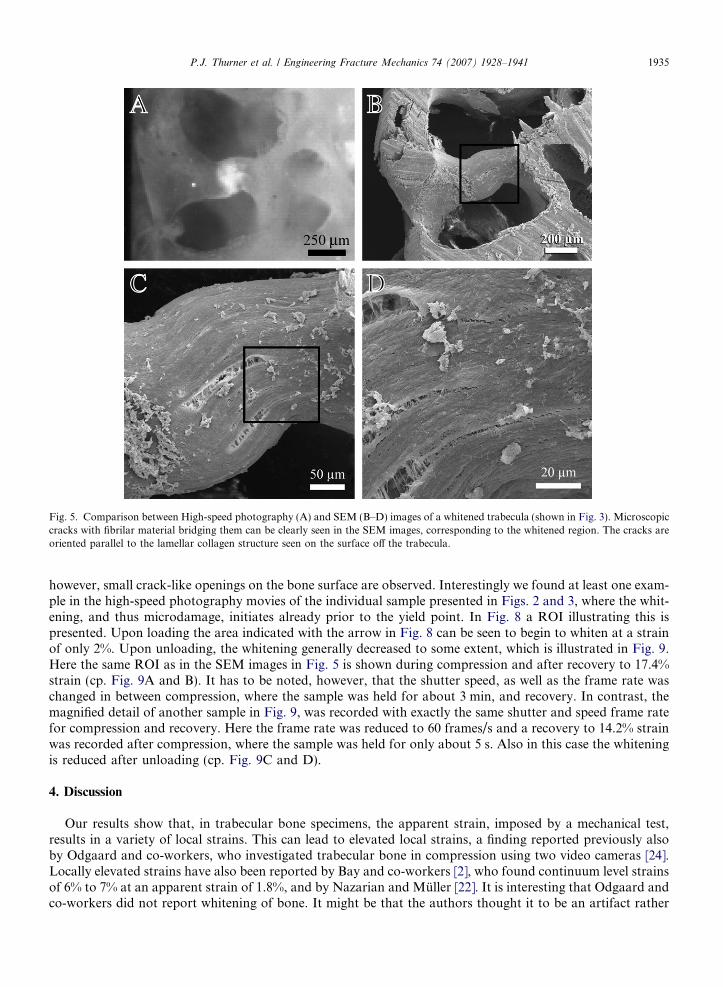
Fig. 5. Comparison between High-speed photography (A) and SEM (B–D) images of a whitened trabecula (shown in Fig. 3). Microscopiccracks with fibrilar material bridging them can be clearly seen in the SEM images, corresponding to the whitened region. The cracks areoriented parallel to the lamellar collagen structure seen on the surface off the trabecula.
P.J. Thurner et al. / Engineering Fracture Mechanics 74 (2007) 1928–1941 1935
however, small crack-like openings on the bone surface are observed. Interestingly we found at least one exam-ple in the high-speed photography movies of the individual sample presented in Figs. 2 and 3, where the whit-ening, and thus microdamage, initiates already prior to the yield point. In Fig. 8 a ROI illustrating this ispresented. Upon loading the area indicated with the arrow in Fig. 8 can be seen to begin to whiten at a strainof only 2%. Upon unloading, the whitening generally decreased to some extent, which is illustrated in Fig. 9.Here the same ROI as in the SEM images in Fig. 5 is shown during compression and after recovery to 17.4%strain (cp. Fig. 9A and B). It has to be noted, however, that the shutter speed, as well as the frame rate waschanged in between compression, where the sample was held for about 3 min, and recovery. In contrast, themagnified detail of another sample in Fig. 9, was recorded with exactly the same shutter and speed frame ratefor compression and recovery. Here the frame rate was reduced to 60 frames/s and a recovery to 14.2% strainwas recorded after compression, where the sample was held for only about 5 s. Also in this case the whiteningis reduced after unloading (cp. Fig. 9C and D).
4. Discussion
Our results show that, in trabecular bone specimens, the apparent strain, imposed by a mechanical test,results in a variety of local strains. This can lead to elevated local strains, a finding reported previously alsoby Odgaard and co-workers, who investigated trabecular bone in compression using two video cameras [24].Locally elevated strains have also been reported by Bay and co-workers [2], who found continuum level strainsof 6% to 7% at an apparent strain of 1.8%, and by Nazarian and Muller [22]. It is interesting that Odgaard andco-workers did not report whitening of bone. It might be that the authors thought it to be an artifact rather

Fig. 6. Low (A) and high-resolution (SEM) images of the microscopic crack (shown in Fig. 5B–D). Fibrillar structures span the crack,coated with rounded particles, presumably hydroxyapatite crystals. Besides the protein matrix in between mineralized fibrils, it seems thatmineral particles also compound different fibrils together.
1936 P.J. Thurner et al. / Engineering Fracture Mechanics 74 (2007) 1928–1941
than a new discovery, but it may also be that whitening is dependent on strain rate and was thus not observed.Odgaard and co-workers compressed their samples in a quasi-static mode at strain rates of 0.015%/s in con-trast to our experiments where a strain rate of 50%/s was used.
The whitening images shown here are not only representative for the whole group of 14 samples but also fora total number of 30 samples of the same donor. Overall, we have so far investigated over 100 trabecular bonesamples from different human donors, as well as samples retrieved from porcine and bovine bone obtainedfrom a meat-wholesaler. Whitening was a feature we consistently observed in all of these samples. Currey[5] already hypothesized whitening to be due to microdamage but did not find conclusive evidence for this phe-nomenon. In our own investigation using high-speed photography and SEM, we clearly uncovered micro-scopic damage of whitened trabeculae, mostly in the form of delamination fractures (cp. Fig. 5), whichproves this hypothesis to be correct: whitening and microscopic damage are strongly correlated. We alsosaw ligaments bridging the observed cracks, which consist of bundles of collagen fibrils covered with hydroxy-apatite crystals (cp. Fig. 6D). These ligaments have been reported earlier for microscopic cracks in both cor-tical [21] and trabecular bone [7,29]. The negative control investigation of non-whitened trabeculae provedthat these are neither fractured nor exhibit microscopic cracks (cp. Fig. 7). Higher resolution SEM investiga-tion also gives some clues about the failure mechanism of healthy trabecular bone. Fig. 6D gives evidence thatbone fails in the interfibrillar space, i.e. by the separation of mineralized collagen fibrils. Besides the earlierreported protein matrix holding the fibrils together in the form of a ‘‘glue’’ [7], it seems from these images thatfibrils might also be fused by mineral crystals.
Qualitatively, we find whitened areas already in the elastic linear region of mechanical tests. This is illustratedin Fig. 8, where whitening already starts at an apparent strain of only 2%. Although we find whitening at suchlow apparent strains only to a limited extent, this finding has an important implication: it means that cyclic load-

Fig. 7. Comparison between high-speed photography (A) and SEM (B–D) images of a trabecula that did not whiten (cp. Fig. 2, blackframe at the bottom). The trabecula looks intact, only very small openings on the surface can be seen at a magnification of 1400· SEM(D).
Fig. 8. Detail of the high-speed photography frames shown in Fig. 2 (white frame) at different strains showing the initiation of whitening(arrow) well below the apparent yield strain and its progression with increasing apparent strain.
P.J. Thurner et al. / Engineering Fracture Mechanics 74 (2007) 1928–1941 1937
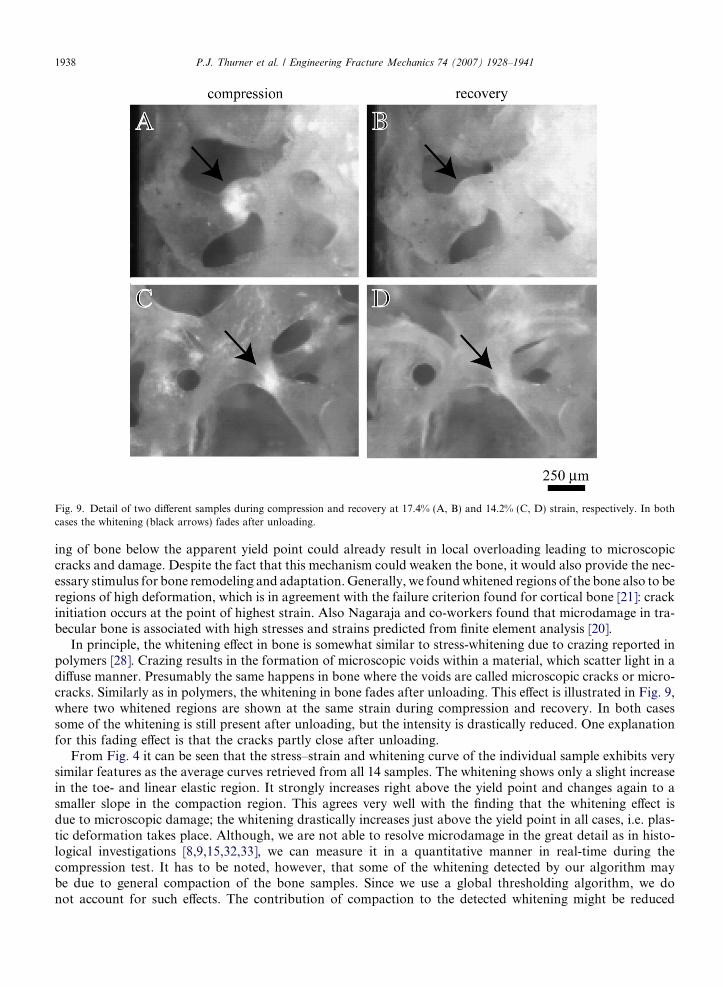
Fig. 9. Detail of two different samples during compression and recovery at 17.4% (A, B) and 14.2% (C, D) strain, respectively. In bothcases the whitening (black arrows) fades after unloading.
1938 P.J. Thurner et al. / Engineering Fracture Mechanics 74 (2007) 1928–1941
ing of bone below the apparent yield point could already result in local overloading leading to microscopiccracks and damage. Despite the fact that this mechanism could weaken the bone, it would also provide the nec-essary stimulus for bone remodeling and adaptation. Generally, we found whitened regions of the bone also to beregions of high deformation, which is in agreement with the failure criterion found for cortical bone [21]: crackinitiation occurs at the point of highest strain. Also Nagaraja and co-workers found that microdamage in tra-becular bone is associated with high stresses and strains predicted from finite element analysis [20].
In principle, the whitening effect in bone is somewhat similar to stress-whitening due to crazing reported inpolymers [28]. Crazing results in the formation of microscopic voids within a material, which scatter light in adiffuse manner. Presumably the same happens in bone where the voids are called microscopic cracks or micro-cracks. Similarly as in polymers, the whitening in bone fades after unloading. This effect is illustrated in Fig. 9,where two whitened regions are shown at the same strain during compression and recovery. In both casessome of the whitening is still present after unloading, but the intensity is drastically reduced. One explanationfor this fading effect is that the cracks partly close after unloading.
From Fig. 4 it can be seen that the stress–strain and whitening curve of the individual sample exhibits verysimilar features as the average curves retrieved from all 14 samples. The whitening shows only a slight increasein the toe- and linear elastic region. It strongly increases right above the yield point and changes again to asmaller slope in the compaction region. This agrees very well with the finding that the whitening effect isdue to microscopic damage; the whitening drastically increases just above the yield point in all cases, i.e. plas-tic deformation takes place. Although, we are not able to resolve microdamage in the great detail as in histo-logical investigations [8,9,15,32,33], we can measure it in a quantitative manner in real-time during thecompression test. It has to be noted, however, that some of the whitening detected by our algorithm maybe due to general compaction of the bone samples. Since we use a global thresholding algorithm, we donot account for such effects. The contribution of compaction to the detected whitening might be reduced

P.J. Thurner et al. / Engineering Fracture Mechanics 74 (2007) 1928–1941 1939
by the use of algorithms that consider the local changes in brightness. The observed shape of the whiteningcurves presented in Fig. 4, however, cannot be explained by compaction alone, given the assumption thatthe whitening contribution of compaction is directly proportional to the increase in density. If assumed so,the whitening, as a function of time and at a constant strain rate, is given by the relation
W ðtÞ / mV 0ð1� _e � tÞ ð1Þ
Here W denotes the whitening, t the time, m the mass of the sample, V0 the initial volume of the sample, and _ethe strain rate. If expanded into a Taylor series with _e � t ¼ e at e = 0 this transforms into
W ðeÞ / mV 0
� 1þ eþ e2 þ e3 þ . . .� �
e¼0ð2Þ
The nonlinear terms in Eq. (2) can be ignored in a first order approximation (e� 1), thus the increase in whit-ening is almost linear.
Clearly a limitation of our approach is the fact that only a part of a bone specimen is imaged during themechanical test, in contrast to other functional imaging approaches, where the whole 3D structure can beassessed [2,19,20,22,29,30]. However, high-speed photography is a real-time instrument, which can gather sig-nificantly more image information of a mechanical test in terms of temporal resolution compared to 3Dapproaches. In the 3D functional imaging experiments, usually quasi-static testing is done and only a few dif-ferent stages of the sample during compression are recorded. A further limitation of the experiments presentedhere was the encounter of toe regions in stress–strain curves at very low strains, which we corrected for byextrapolating the linear elastic region of the stress strain curves, as also done before in other studies[29,30]. The origin of these toe regions was clearly determined to be due to slight translation and rotationof the samples, as seen in the high-speed photography movies. Apparently the sample surfaces were not cutperfectly parallel to each other. We did not precondition our samples prior to mechanical tests, which has beenreported to reduce toe regions [11], as we were aiming for specimens undamaged, beyond the potentially smalldamage encountered during preparation. A more sophisticated sample preparation protocol should lead tobetter specimens and, thus, less toe regions.
In the future, we plan to include the computation of strain fields in our analysis in order to determine thetrue local strain needed for the formation of microscopic delamination fractures. We also consider performinga more thorough investigation of microdamage in the future using the gold standard, fluorescence labeling andsectioning for histological analysis. Overall, high-speed photography proves to be a valuable functional imag-ing technique that can be added with relative ease to existing mechanical testing experiments providing insightto the local failure dynamics of trabecular bone.
5. Conclusions
In this manuscript we demonstrate that combining high-speed photography and mechanical compressiongives new insights into the fracture dynamics of trabecular bone. The comparison of high-speed photographydata with SEM images clearly demonstrates that whitening of bone is caused by microdamage. High-speedphotography is thus a tool enabling the detection of microdamage accumulation in a non-invasive and quan-titative fashion during mechanical testing of trabecular bone. Qualitatively, we find elevated local strains com-pared to the apparent strain during compression, which is in agreement with previous studies. Elevated localstrains result in whitening and thus microdamage already well below the yield point. Quantitatively, whiteningand microdamage accumulation steeply increase right around the yield point and continue to increase in theplastic and post-failure region. After unloading the whitening fades, most probably due to partial crack clo-sure. By SEM imaging we find that on the macromolecular scale bone fails through delamination and sepa-ration of mineralized collagen fibrils, which on the micro- and macroscale results in whitening.
Acknowledgements
For funding of this work we are gratefully indebted to SNF Postdoctoral fellowship PBEZ2—105116,DAAD scholarship No. D/05/42569, FWF Project No. J2395-N02, OAW DOC-Fellowship, NIH Grant
1940 P.J. Thurner et al. / Engineering Fracture Mechanics 74 (2007) 1928–1941
Number GM65354, Veeco/DI Grant Number SB030071, MRL NSF Grant Number DMR00-80034, NASA/URETI Grant Number BiMAt NCC-1-02037, USARL (ICB) Grant Number DAAD19-030D-0004, USA-RIEM (ICB) Grant Number W911QY-04-P-0516, and the NOAA National Sea Grant College Programand the US Department of Commerce (NA36RG0537, Project R/MP-92) through the California Sea GrantCollege System.
References
[1] Bay BK. Texture correlation: a method for the measurement of detailed strain distributions within trabecular bone. J Orthop Res1995;13:258–67.
[2] Bay BK, Smith TS, Fyhrie DP, Saad M. Digital volume correlation: three-dimensional strain mapping using X-ray tomography. ExpMech 1999;39:217–26.
[3] Bayraktar HH, Morgan EF, Niebur GL, Morris GE, Wong EK, Keaveny TM. Comparison of the elastic and yield properties ofhuman femoral trabecular and cortical bone tissue. J Biomech 2004;37:27–35.
[4] Ciarelli MJ, Goldstein SA, Kuhn JL, Cody DD, Brown MB. Evaluation of orthogonal mechanical properties and density of humantrabecular bone from the major metaphyseal regions with materials testing and computed tomography. J Orthop Res 1991;9:674–82.
[5] Currey JD. Bones: structure and mechanics. Princeton: Princeton University Press; 2002.[6] Dalstra M, Huiskes R, Odgaard A, van Erning L. Mechanical and textural properties of pelvic trabecular bone. J Biomech
1993;26:523–35.[7] Fantner GE, Hassenkam T, Kindt JH, Weaver JC, Birkedal H, Pechenik L, et al. Sacrificial bonds and hidden length dissipate energy
as mineralized fibrils separate during bone fracture. Nat Mater 2005:4.[8] Fazzalari NL, Forwood MR, Smith K, Manthey BA, Herreen P. Assessment of cancellous bone quality in severe osteoarthrosis: bone
mineral density, mechanics, and microdamage. Bone 1998;22:381–8.[9] Fyhrie DP, Schaffler MB. Failure mechanisms in human vertebral cancellous bone. Bone 1994;15:105–9.
[10] Kanis JA. Osteoporosis: a view into the next century. Neth J Med 1997;50:198–203.[11] Keaveny TM, Guo XE, Wachtel EF, McMahon TA, Hayes WC. Trabecular bone exhibits fully linear elastic behavior and yields at
low strains. J Biomech 1994;27:1127–36.[12] Keaveny TM, Hayes WC. A 20-year perspective on the mechanical properties of trabecular bone. J Biomech Engng 1993;115:534–42.[13] Keaveny TM, Morgan EF, Niebur GL, Yeh OC. Biomechanics of trabecular bone. Ann Rev Biomed Engng 2001;3:307–33.[14] Keaveny TM, Wachtel EF, Kopperdahl DL. Mechanical behavior of human trabecular bone after overloading. J Orthop Res
1999;17:346–53.[15] Lee TC, Arthur TL, Gibson LJ, Hayes WC. Sequential labelling of microdamage in bone using chelating agents. J Orthop Res
2000;18:322–5.[16] McBroom RJ, Hayes WC, Edwards WT, Goldberg RP, White III AA. Prediction of vertebral body compressive fracture using
quantitative computed tomography. J Bone Joint Surgery [Am] 1985;67:1206–14.[17] McElhaney JH, Fogle JL, Melvin JW, Haynes RR, Roberts VL, Alem NM. Mechanical properties of cranial bone. J Biomech
1970;3:495–511.[18] Melton III LJ, Chrischilles EA, Cooper C, Lane AW, Riggs BL. Perspective. How many women have osteoporosis? J Bone Mineral
Res 1992;7:1005–10.[19] Muller R, Gerber SC, Hayes WC. Micro-compression: a novel technique for the nondestructive assessment of local bone failure.
Technol Health Care 1998;6:433–44.[20] Nagaraja S, Couse TL, Guldberg RE. Trabecular bone microdamage and microstructural stresses under uniaxial compression. J
Biomech 2005;38:707–16.[21] Nalla RK, Kinney JH, Ritchie RO. Mechanistic fracture criteria for the failure of human cortical bone. Nat Mater 2003;2:164–8.[22] Nazarian A, Muller R. Time-lapsed microstructural imaging of bone failure behavior. J Biomech 2004;37:55–65.[23] Nicolella DP, Nicholls AE, Lankford J, Davy DT. Machine vision photogrammetry: a technique for measurement of microstructural
strain in cortical bone. J Biomech 2001;34:135–9.[24] Odgaard A, Hvid I, Linde F. Compressive axial strain distributions in cancellous bone specimens. J Biomech 1989;22:829–35.[25] Ray NF, Chan JK, Thamer M, Melton III LJ. Medical expenditures for the treatment of osteoporotic fractures in the United States
in 1995: report from the National Osteoporosis Foundation. J Bone Miner Res 1997;12:24–35.[26] Rice JC, Cowin SC, Bowman JA. On the dependence of the elasticity and strength of cancellous bone on apparent density. J Biomech
1988;21:155–68.[27] Silva MJ, Keaveny TM, Hayes WC. Load sharing between the shell and centrum in the lumbar vertebral body. Spine 1997;22:140–50.[28] Strobl G. The physics of polymers: concepts for understanding their structures and behavior. Berlin: Springer; 1997.[29] Thurner P, Wyss P, Voide R, Stauber M, Muller B, Stampanoni M, et al. In: Bonse U, editor. Developments in X-Ray tomography
IV. SPIE Proceedings 5535. Colorado: Denver; 2004. p. 112–28.[30] Thurner PJ, Wyss P, Voide R, Stauber M, Stampanoni M, Sennhauser U, et al. Time-lapsed investigation of three-dimensional
failure and damage accumulation in trabecular bone using synchrotron light. Bone 2006;39:289–99.[31] Ulrich D, Hildebrand T, Van Rietbergen B, Muller R, Ruegsegger P. The quality of trabecular bone evaluated with micro-computed
tomography, FEA and mechanical testing. Stud Health Technol Inform 1997;40:97–112.

P.J. Thurner et al. / Engineering Fracture Mechanics 74 (2007) 1928–1941 1941
[32] Vashishth D, Koontz J, Qiu SJ, Lundin-Cannon D, Yeni YN, Schaffler MB, et al. In vivo diffuse damage in human vertebraltrabecular bone. Bone 2000;26:147–52.
[33] Wachtel EF, Keaveny TM. Dependence of trabecular damage on mechanical strain. J Orthop Res 1997;15:781–7.[34] WHO Assessment of osteoporotic fracture risk and its role in screening for postmenopausal osteoporosis. World Health
Organization, Geneva; 1994.[35] Williams JL, Lewis JL. Properties and an anisotropic model of cancellous bone from the proximal tibial epiphysis. J Biomech Engng
1982;104:50–6.