Embed Size (px)
Citation preview
High Speed Rail along the Ahmedabad-Mumbai corridor
Impacts on energy and emissions
Sarbojit Pal High Speed Rail Seminar, Ahmedabad
February 11, 2013
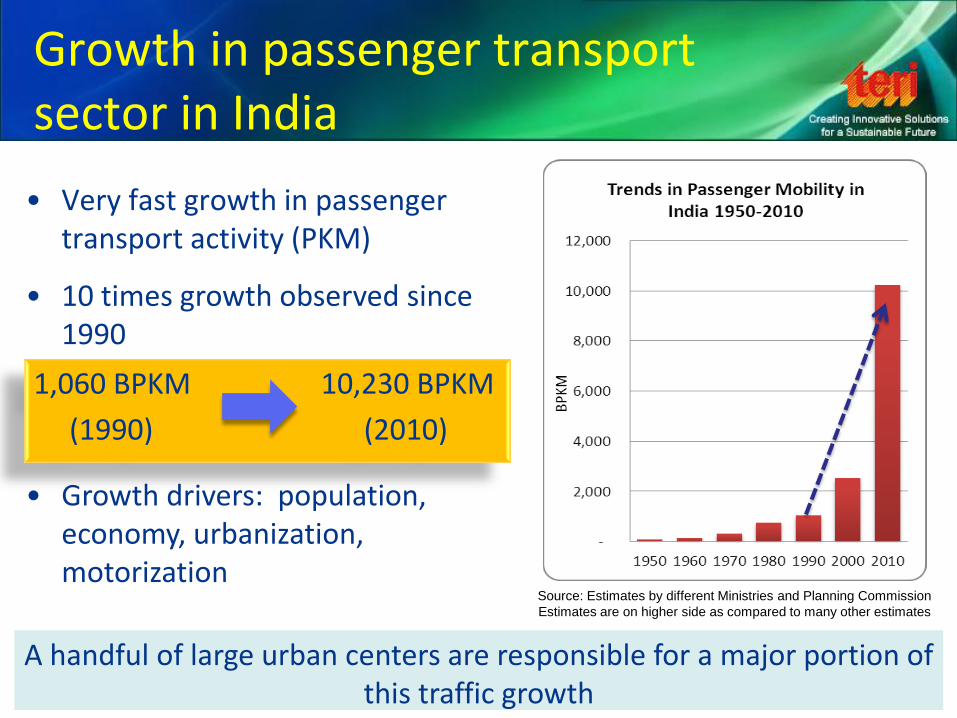
• Very fast growth in passenger transport activity (PKM)
Growth in passenger transport sector in India
• Growth drivers: population, economy, urbanization, motorization
• 10 times growth observed since 1990
Source: Estimates by different Ministries and Planning Commission
Estimates are on higher side as compared to many other estimates
1,060 BPKM 10,230 BPKM
(1990) (2010)
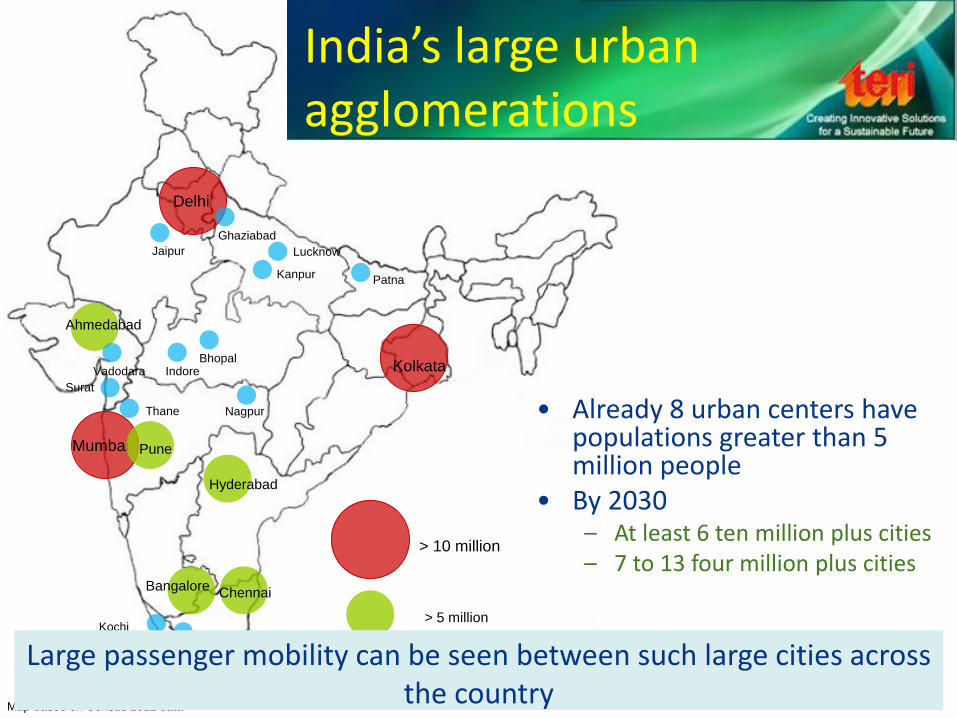
A handful of large urban centers are responsible for a major portion of this traffic growth
Nagpur
Map based on Census 2011 data
India’s large urban agglomerations
Mumbai
Kolkata
Delhi
> 10 million
Hyderabad
Chennai Bangalore
Pune
Ahmedabad
> 5 million
Patna
Lucknow
Surat
Coimbatore
Jaipur
Ghaziabad
Vadodara
Thane
Kochi
Kanpur
Indore
Thrissur
Bhopal
Kochi
> 1 million
• Already 8 urban centers have populations greater than 5 million people
• By 2030 – At least 6 ten million plus cities – 7 to 13 four million plus cities
Large passenger mobility can be seen between such large cities across the country
Kochi
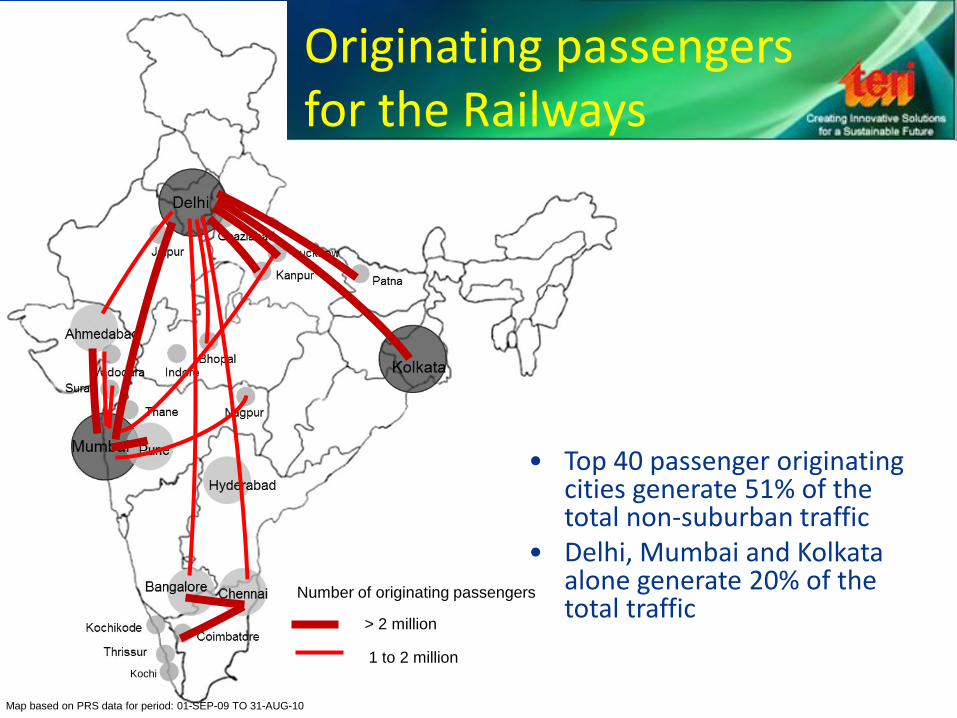
Map based on PRS data for period: 01-SEP-09 TO 31-AUG-10
• Top 40 passenger originating cities generate 51% of the total non-suburban traffic
• Delhi, Mumbai and Kolkata alone generate 20% of the total traffic
Originating passengers for the Railways
1 to 2 million
Number of originating passengers
> 2 million
Kochi
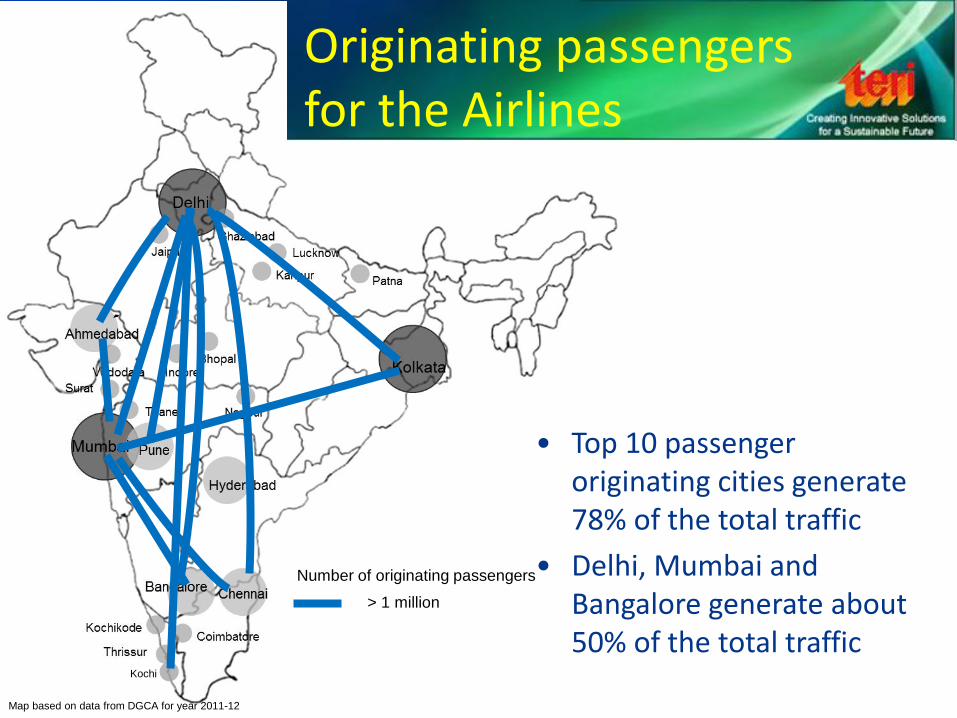
Map based on data from DGCA for year 2011-12
> 1 million
Originating passengers for the Airlines
• Top 10 passenger originating cities generate 78% of the total traffic
• Delhi, Mumbai and Bangalore generate about 50% of the total traffic
Number of originating passengers
Kochi
Map based on data from DGCA for year 2011-12
> 1 million air
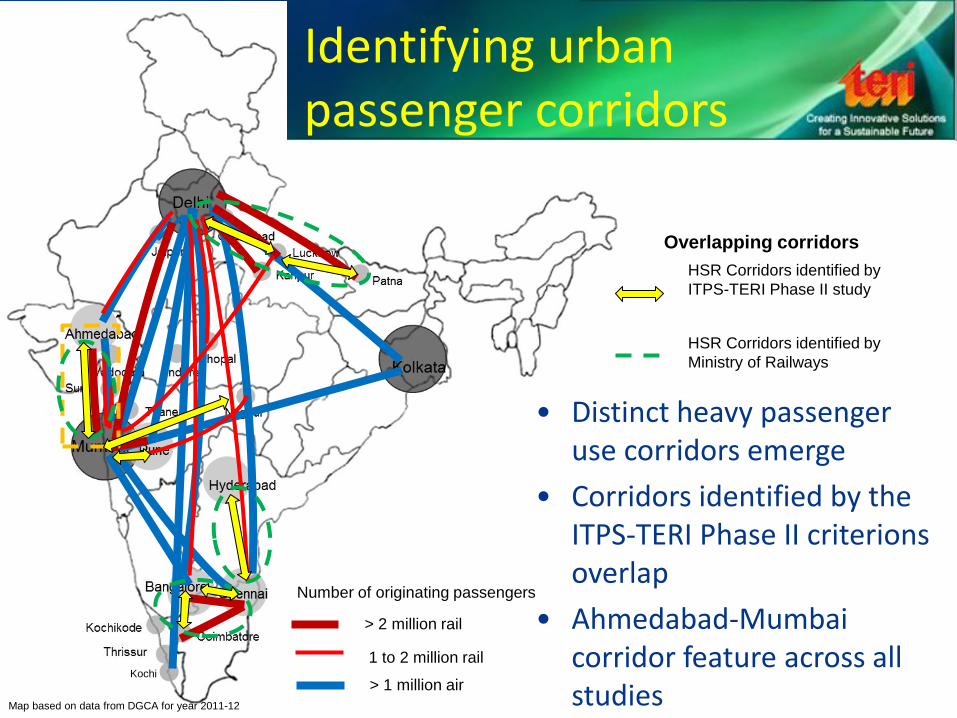
Identifying urban passenger corridors
• Distinct heavy passenger use corridors emerge
• Corridors identified by the ITPS-TERI Phase II criterions overlap
• Ahmedabad-Mumbai corridor feature across all studies
Number of originating passengers
> 2 million rail
1 to 2 million rail
HSR Corridors identified by
Ministry of Railways
HSR Corridors identified by
ITPS-TERI Phase II study
Overlapping corridors
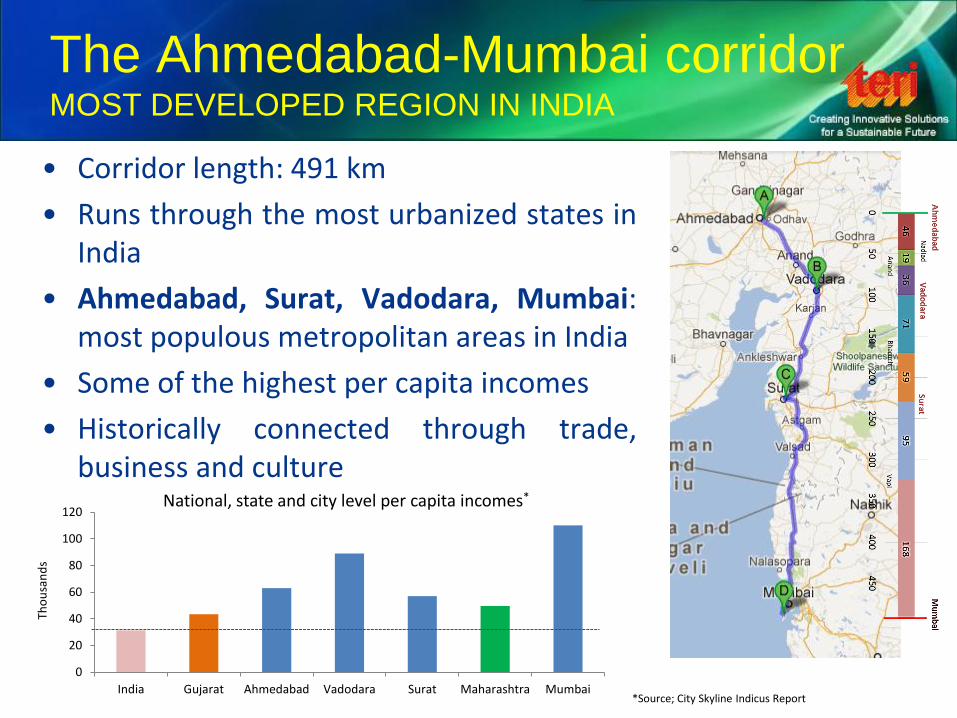
• Corridor length: 491 km
• Runs through the most urbanized states in India
• Ahmedabad, Surat, Vadodara, Mumbai: most populous metropolitan areas in India
• Some of the highest per capita incomes
• Historically connected through trade, business and culture
*Source; City Skyline Indicus Report
0
20
40
60
80
100
120
India Gujarat Ahmedabad Vadodara Surat Maharashtra Mumbai
Tho
usa
nd
s
National, state and city level per capita incomes*
The Ahmedabad-Mumbai corridor MOST DEVELOPED REGION IN INDIA
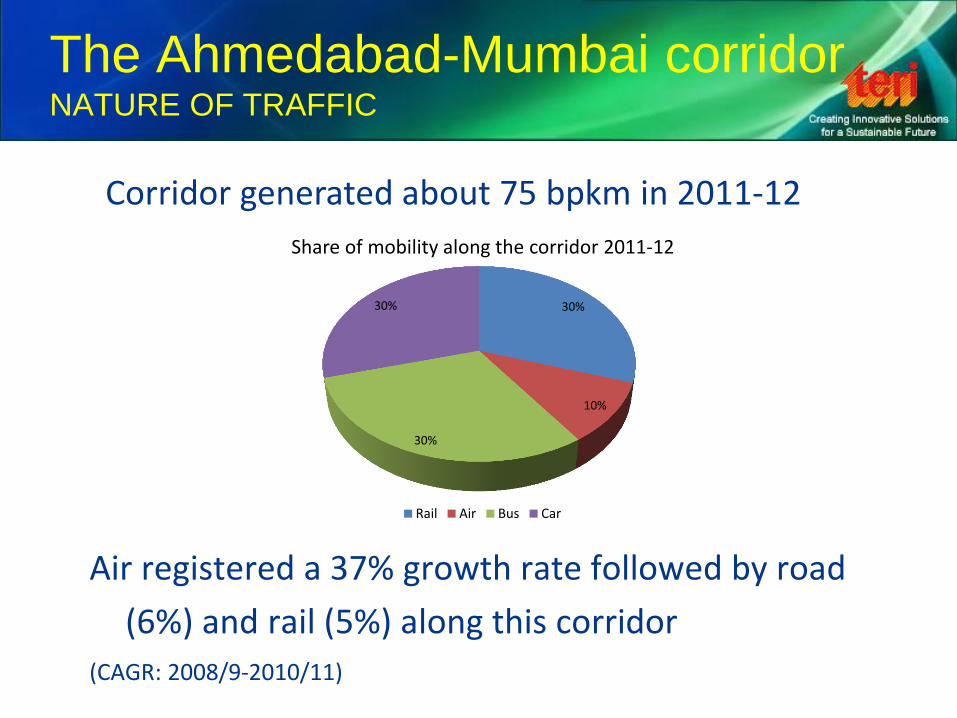
Air registered a 37% growth rate followed by road
(6%) and rail (5%) along this corridor
(CAGR: 2008/9-2010/11)
30%
10%
30%
30%
Share of mobility along the corridor 2011-12
Rail Air Bus Car
The Ahmedabad-Mumbai corridor NATURE OF TRAFFIC
Corridor generated about 75 bpkm in 2011-12
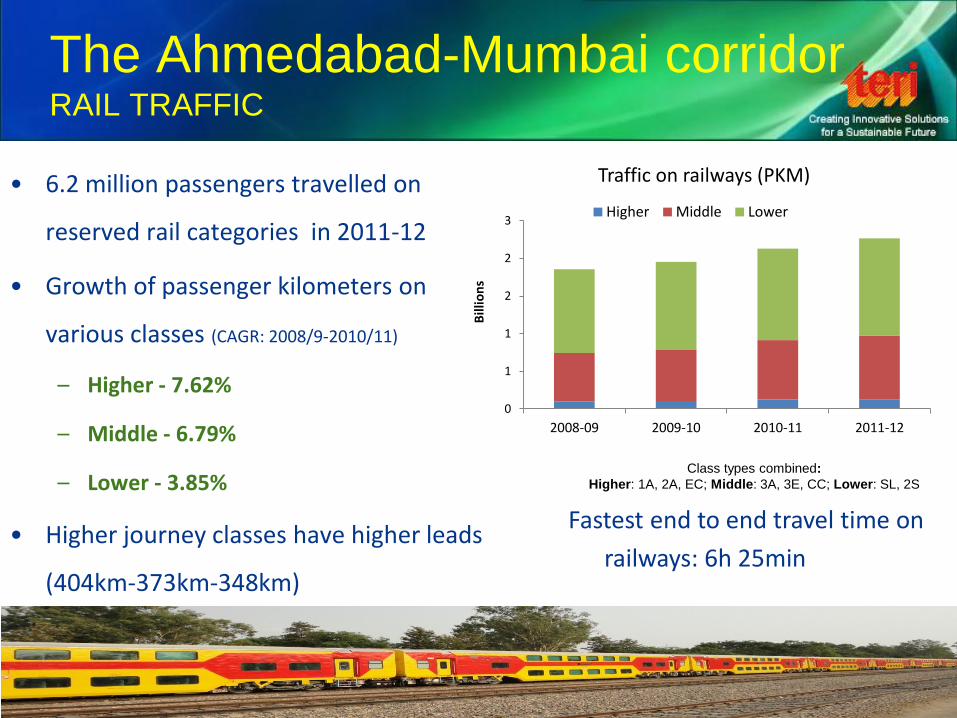
The Ahmedabad-Mumbai corridor RAIL TRAFFIC
• 6.2 million passengers travelled on
reserved rail categories in 2011-12
• Growth of passenger kilometers on
various classes (CAGR: 2008/9-2010/11)
– Higher - 7.62%
– Middle - 6.79%
– Lower - 3.85%
• Higher journey classes have higher leads
(404km-373km-348km)
Class types combined:
Higher: 1A, 2A, EC; Middle: 3A, 3E, CC; Lower: SL, 2S
0
1
1
2
2
3
2008-09 2009-10 2010-11 2011-12
Bill
ion
s
Traffic on railways (PKM)
Higher Middle Lower
Fastest end to end travel time on
railways: 6h 25min
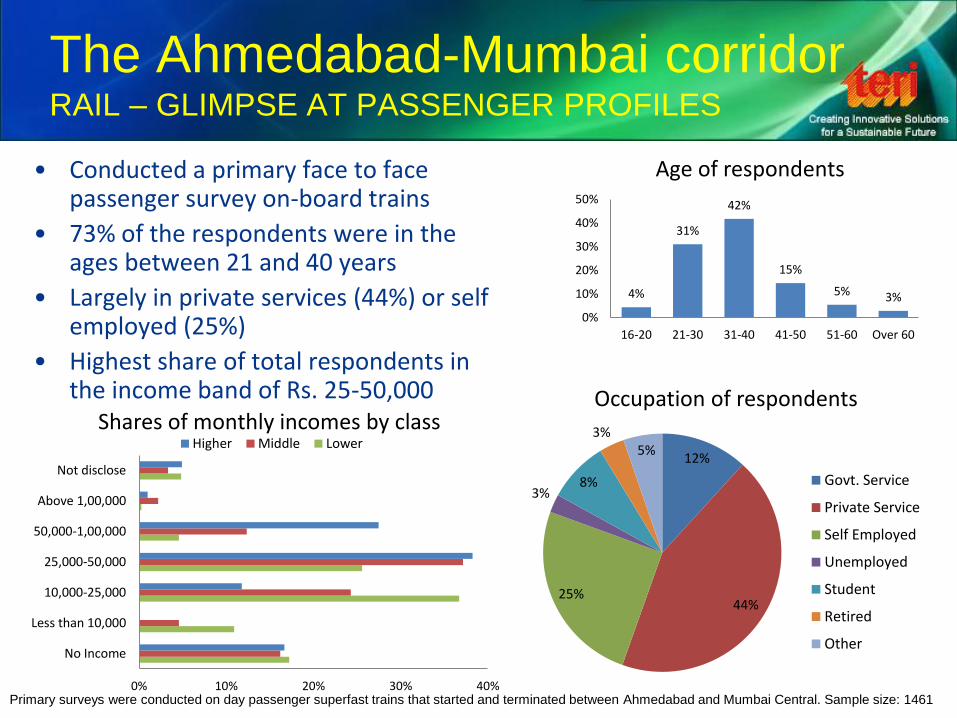
The Ahmedabad-Mumbai corridor RAIL – GLIMPSE AT PASSENGER PROFILES
4%
31%
42%
15%
5% 3%
0%
10%
20%
30%
40%
50%
16-20 21-30 31-40 41-50 51-60 Over 60
Age of respondents
12%
44% 25%
3% 8%
3% 5%
Occupation of respondents
Govt. Service
Private Service
Self Employed
Unemployed
Student
Retired
Other
• Conducted a primary face to face passenger survey on-board trains
• 73% of the respondents were in the ages between 21 and 40 years
• Largely in private services (44%) or self employed (25%)
• Highest share of total respondents in the income band of Rs. 25-50,000
Primary surveys were conducted on day passenger superfast trains that started and terminated between Ahmedabad and Mumbai Central. Sample size: 1461 0% 10% 20% 30% 40%
No Income
Less than 10,000
10,000-25,000
25,000-50,000
50,000-1,00,000
Above 1,00,000
Not disclose
Shares of monthly incomes by class Higher Middle Lower
The Ahmedabad-Mumbai corridor RAIL – GLIMPSE AT PASSENGER PROFILES
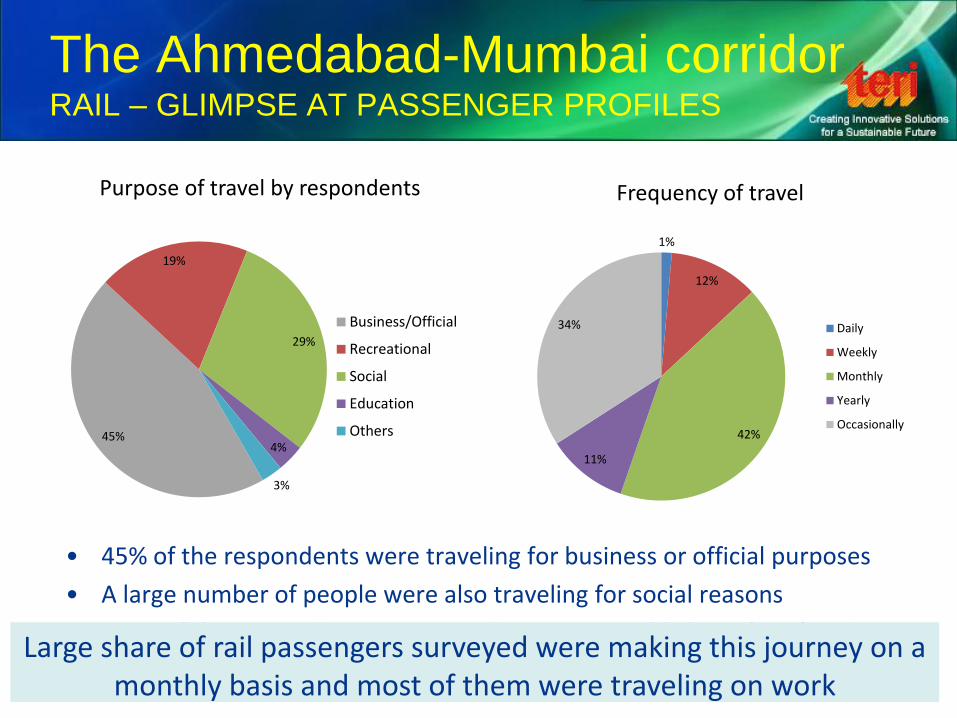
45%
19%
29%
4%
3%
Purpose of travel by respondents
Business/Official
Recreational
Social
Education
Others
1%
12%
42%
11%
34%
Frequency of travel
Daily
Weekly
Monthly
Yearly
Occasionally
• 45% of the respondents were traveling for business or official purposes
• A large number of people were also traveling for social reasons
• Most of the respondents were traveling on a monthly basis (42%) and a large share occasionally (34%)
Large share of rail passengers surveyed were making this journey on a monthly basis and most of them were traveling on work
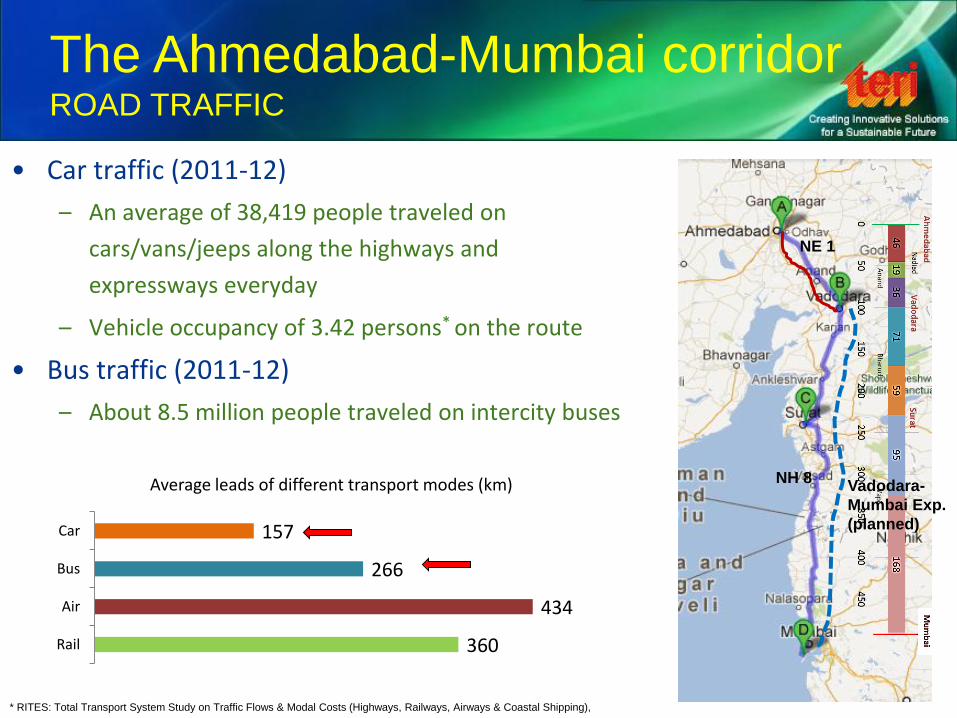
• Car traffic (2011-12)
– An average of 38,419 people traveled on
cars/vans/jeeps along the highways and
expressways everyday
– Vehicle occupancy of 3.42 persons* on the route
• Bus traffic (2011-12)
– About 8.5 million people traveled on intercity buses
* RITES: Total Transport System Study on Traffic Flows & Modal Costs (Highways, Railways, Airways & Coastal Shipping),
360
434
266
157
Rail
Air
Bus
Car
Average leads of different transport modes (km)
The Ahmedabad-Mumbai corridor ROAD TRAFFIC
NH 8
NE 1
Vadodara-
Mumbai Exp.
(planned)
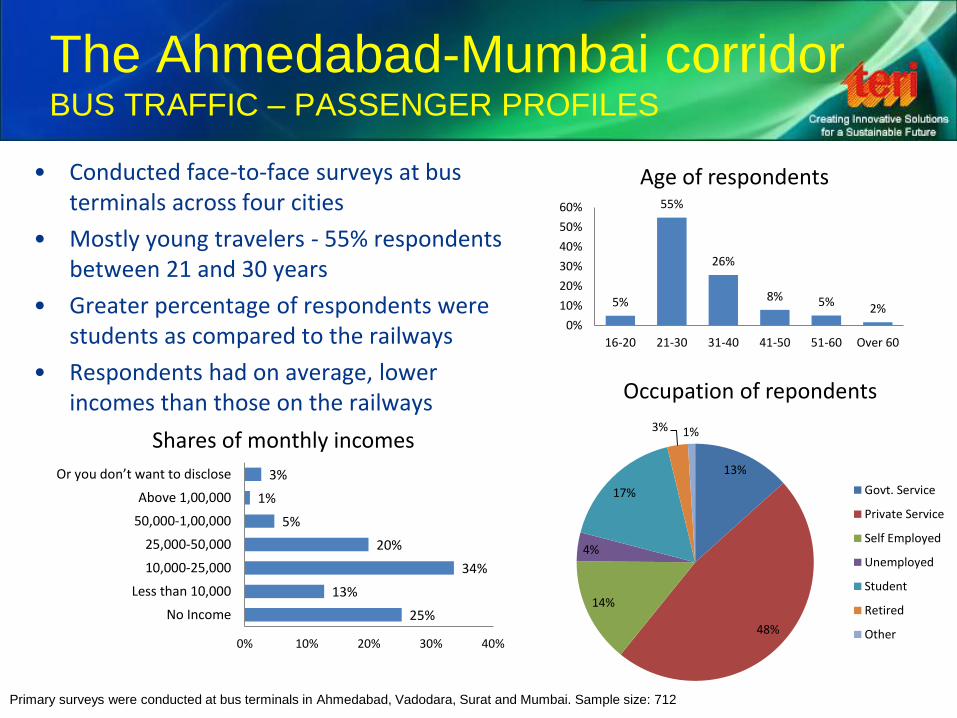
The Ahmedabad-Mumbai corridor BUS TRAFFIC – PASSENGER PROFILES
• Conducted face-to-face surveys at bus terminals across four cities
• Mostly young travelers - 55% respondents between 21 and 30 years
• Greater percentage of respondents were students as compared to the railways
• Respondents had on average, lower incomes than those on the railways
Primary surveys were conducted at bus terminals in Ahmedabad, Vadodara, Surat and Mumbai. Sample size: 712
5%
55%
26%
8% 5% 2%
0%
10%
20%
30%
40%
50%
60%
16-20 21-30 31-40 41-50 51-60 Over 60
Age of respondents
13%
48%
14%
4%
17%
3% 1%
Occupation of repondents
Govt. Service
Private Service
Self Employed
Unemployed
Student
Retired
Other
25%
13%
34%
20%
5%
1%
3%
0% 10% 20% 30% 40%
No Income
Less than 10,000
10,000-25,000
25,000-50,000
50,000-1,00,000
Above 1,00,000
Or you don’t want to disclose
Shares of monthly incomes
The Ahmedabad-Mumbai corridor BUS TRAFFIC – PASSENGER PROFILES
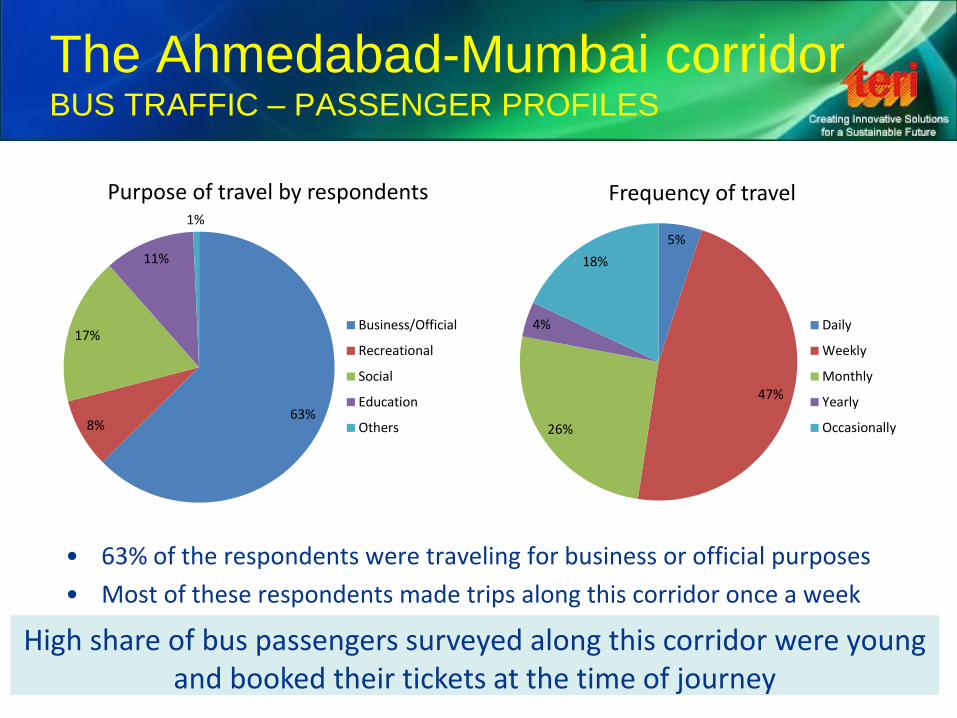
• 63% of the respondents were traveling for business or official purposes
• Most of these respondents made trips along this corridor once a week
• 92% of them booked their tickets at the time of the journey
63% 8%
17%
11%
1%
Purpose of travel by respondents
Business/Official
Recreational
Social
Education
Others
5%
47%
26%
4%
18%
Frequency of travel
Daily
Weekly
Monthly
Yearly
Occasionally
High share of bus passengers surveyed along this corridor were young and booked their tickets at the time of journey
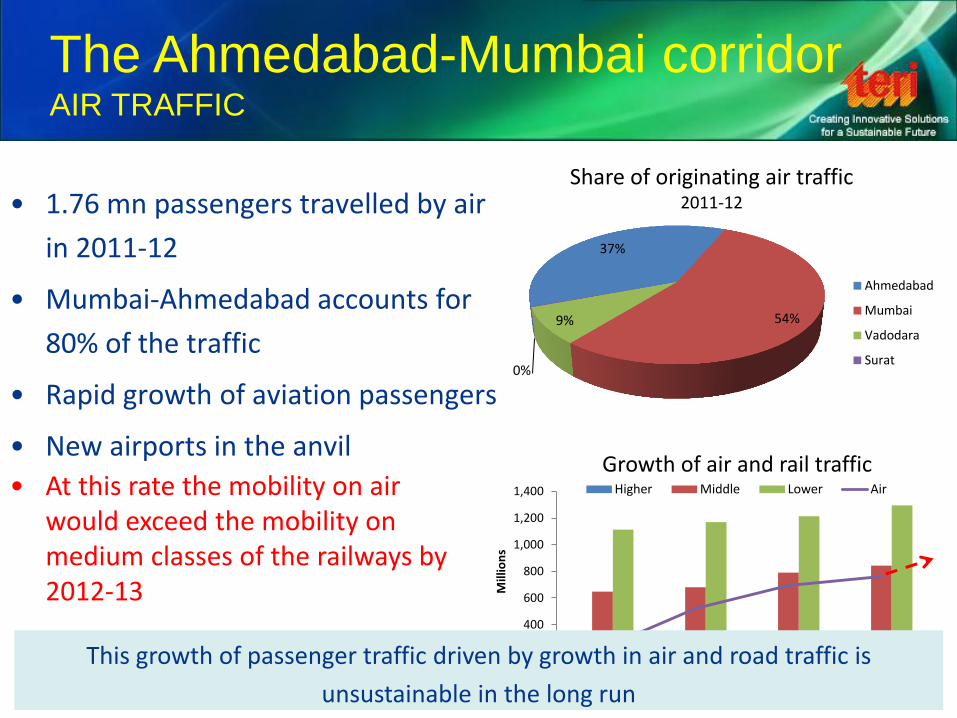
• 1.76 mn passengers travelled by air
in 2011-12
• Mumbai-Ahmedabad accounts for
80% of the traffic
• Rapid growth of aviation passengers
• New airports in the anvil
0
200
400
600
800
1,000
1,200
1,400
2008-09 2009-10 2010-11 2011-12
Mill
ion
s
Growth of air and rail traffic Higher Middle Lower Air
The Ahmedabad-Mumbai corridor AIR TRAFFIC
37%
54% 9%
0%
Share of originating air traffic 2011-12
Ahmedabad
Mumbai
Vadodara
Surat
• At this rate the mobility on air would exceed the mobility on medium classes of the railways by 2012-13
This growth of passenger traffic driven by growth in air and road traffic is
unsustainable in the long run
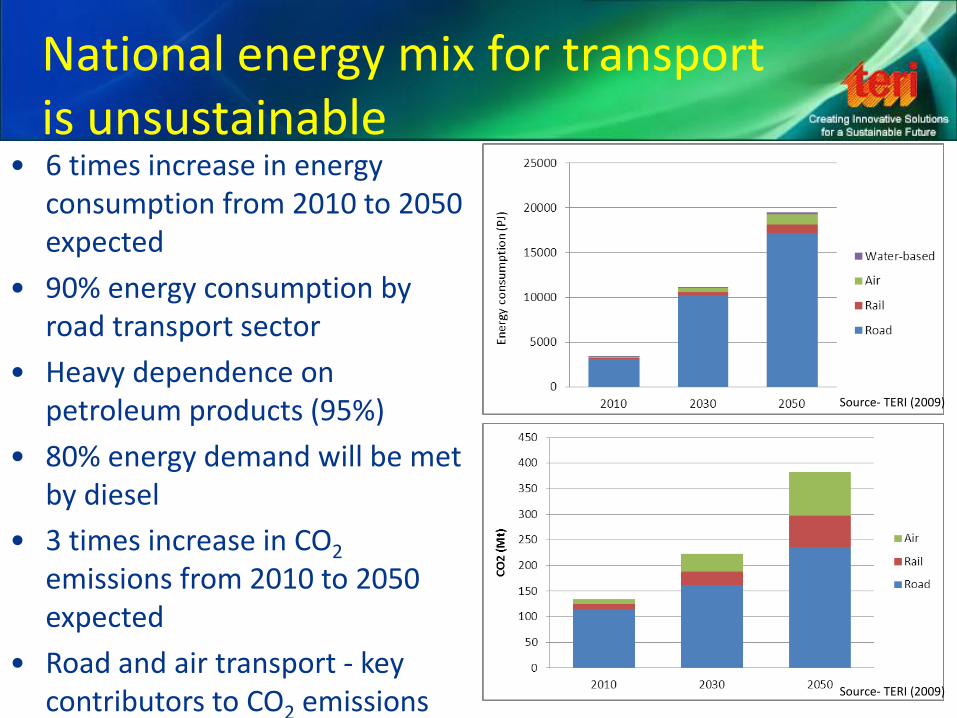
National energy mix for transport is unsustainable
• 6 times increase in energy consumption from 2010 to 2050 expected
• 90% energy consumption by road transport sector
• Heavy dependence on petroleum products (95%)
• 80% energy demand will be met by diesel
• 3 times increase in CO2 emissions from 2010 to 2050 expected
• Road and air transport - key contributors to CO2 emissions
Source- TERI (2009)
Source- TERI (2009)
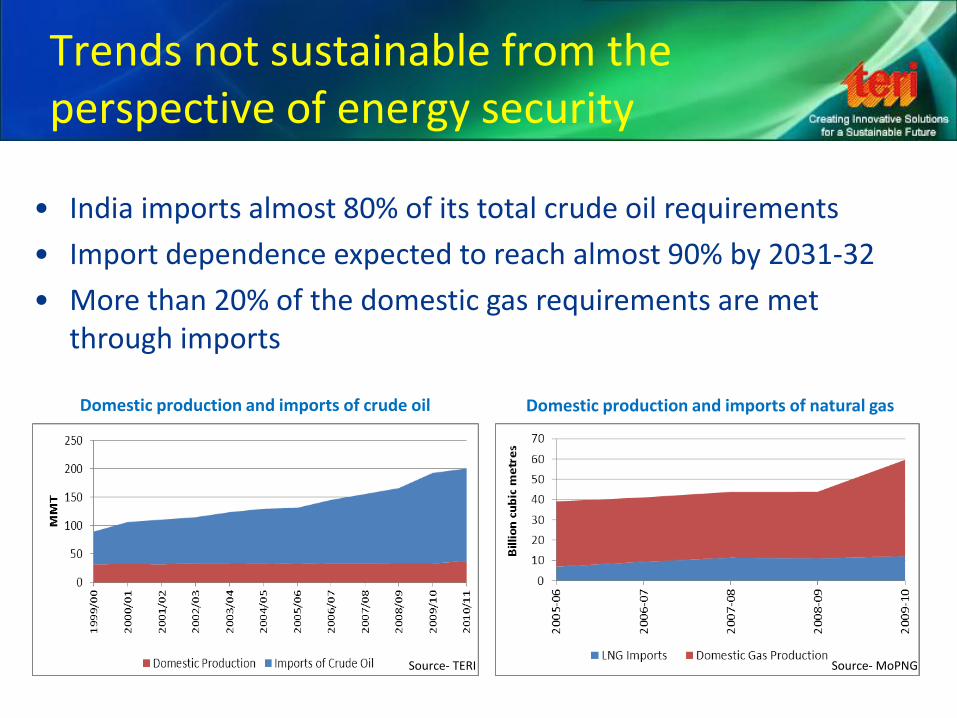
Trends not sustainable from the perspective of energy security
Domestic production and imports of crude oil
• India imports almost 80% of its total crude oil requirements
• Import dependence expected to reach almost 90% by 2031-32
• More than 20% of the domestic gas requirements are met through imports
Domestic production and imports of natural gas
Source- MoPNG Source- TERI
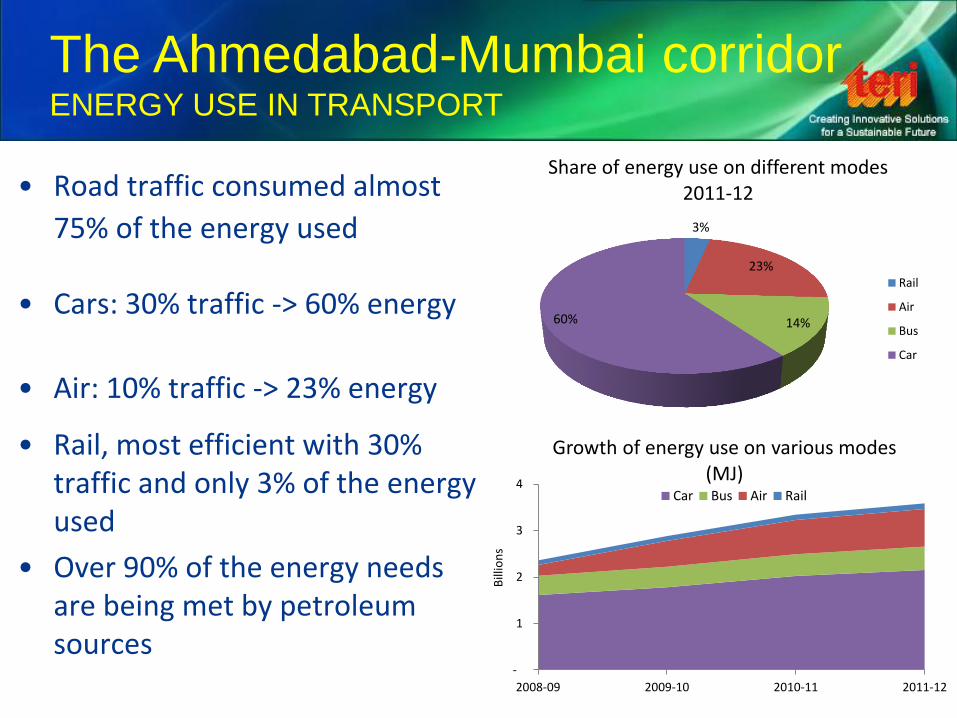
• Road traffic consumed almost
75% of the energy used
• Cars: 30% traffic -> 60% energy
• Air: 10% traffic -> 23% energy
• Rail, most efficient with 30% traffic and only 3% of the energy used
• Over 90% of the energy needs are being met by petroleum sources
3%
23%
14% 60%
Share of energy use on different modes 2011-12
Rail
Air
Bus
Car
The Ahmedabad-Mumbai corridor ENERGY USE IN TRANSPORT
-
1
2
3
4
2008-09 2009-10 2010-11 2011-12
Bill
ion
s
Growth of energy use on various modes (MJ)
Car Bus Air Rail
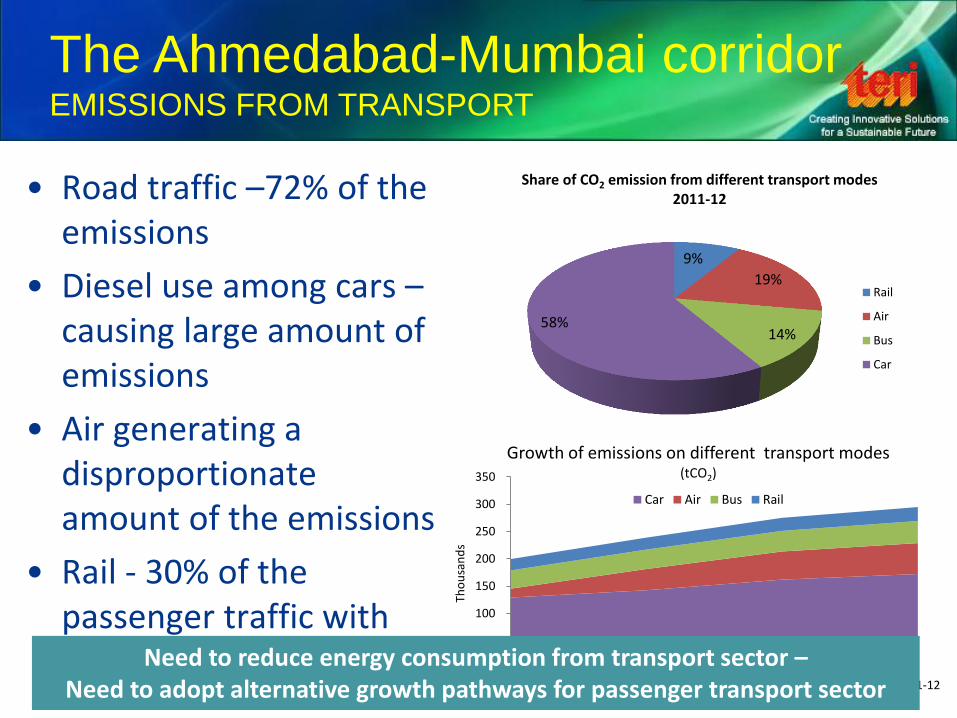
• Road traffic –72% of the emissions
• Diesel use among cars –causing large amount of emissions
• Air generating a disproportionate amount of the emissions
• Rail - 30% of the passenger traffic with only 9% of the emissions
The Ahmedabad-Mumbai corridor EMISSIONS FROM TRANSPORT
9%
19%
14% 58%
Share of CO2 emission from different transport modes 2011-12
Rail
Air
Bus
Car
-
50
100
150
200
250
300
350
2008-09 2009-10 2010-11 2011-12
Tho
usa
nd
s Growth of emissions on different transport modes
(tCO2)
Car Air Bus Rail
Need to reduce energy consumption from transport sector – Need to adopt alternative growth pathways for passenger transport sector
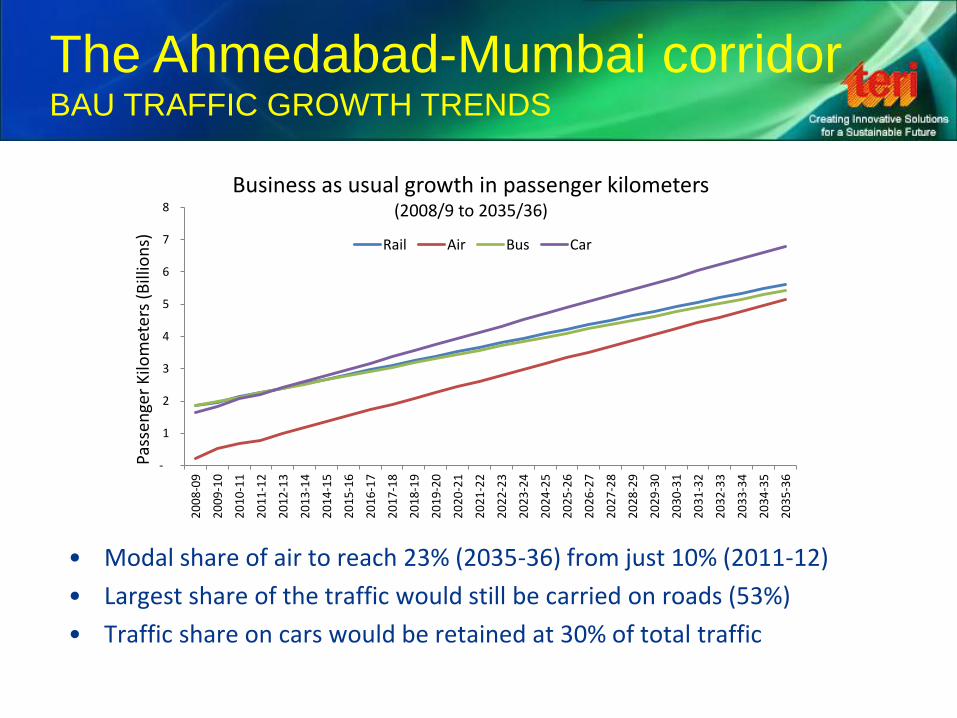
The Ahmedabad-Mumbai corridor BAU TRAFFIC GROWTH TRENDS
-
1
2
3
4
5
6
7
82
00
8-0
9
20
09
-10
20
10
-11
20
11
-12
20
12
-13
20
13
-14
20
14
-15
20
15
-16
20
16
-17
20
17
-18
20
18
-19
20
19
-20
20
20
-21
20
21
-22
20
22
-23
20
23
-24
20
24
-25
20
25
-26
20
26
-27
20
27
-28
20
28
-29
20
29
-30
20
30
-31
20
31
-32
20
32
-33
20
33
-34
20
34
-35
20
35
-36
Pass
enge
r K
ilom
eter
s (B
illio
ns)
Business as usual growth in passenger kilometers (2008/9 to 2035/36)
Rail Air Bus Car
• Modal share of air to reach 23% (2035-36) from just 10% (2011-12)
• Largest share of the traffic would still be carried on roads (53%)
• Traffic share on cars would be retained at 30% of total traffic
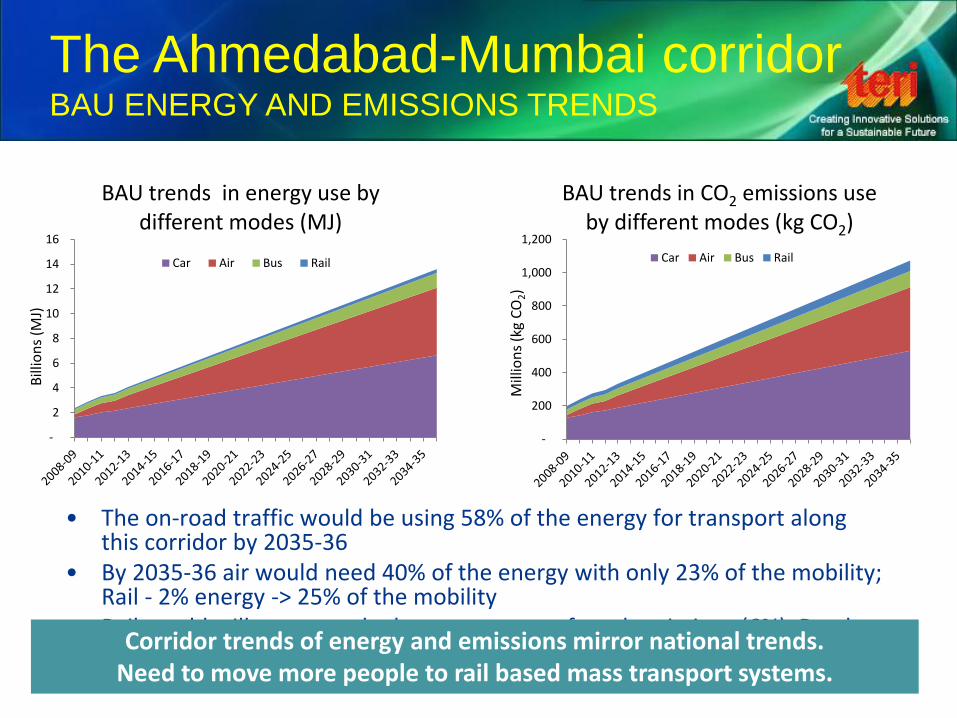
The Ahmedabad-Mumbai corridor BAU ENERGY AND EMISSIONS TRENDS
• The on-road traffic would be using 58% of the energy for transport along this corridor by 2035-36
• By 2035-36 air would need 40% of the energy with only 23% of the mobility; Rail - 2% energy -> 25% of the mobility
• Rail would still generate the lowest amount of total emissions (6%). Road – 59%
-
2
4
6
8
10
12
14
16
Bill
ion
s (M
J)
BAU trends in energy use by different modes (MJ)
Car Air Bus Rail
-
200
400
600
800
1,000
1,200
Mill
ion
s (k
g C
O2)
BAU trends in CO2 emissions use by different modes (kg CO2)
Car Air Bus Rail
Corridor trends of energy and emissions mirror national trends. Need to move more people to rail based mass transport systems.
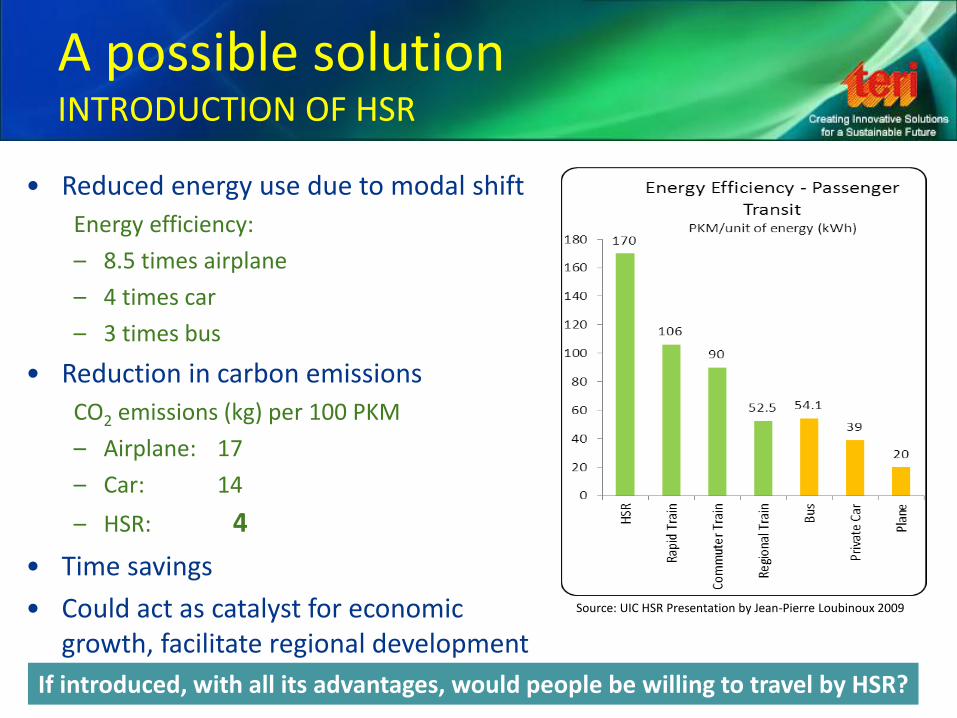
A possible solution INTRODUCTION OF HSR
• Reduced energy use due to modal shift
Energy efficiency:
– 8.5 times airplane
– 4 times car
– 3 times bus
• Reduction in carbon emissions
CO2 emissions (kg) per 100 PKM
– Airplane: 17
– Car: 14
– HSR: 4
• Time savings
• Could act as catalyst for economic growth, facilitate regional development
Source: UIC HSR Presentation by Jean-Pierre Loubinoux 2009
If introduced, with all its advantages, would people be willing to travel by HSR?
The Ahmedabad-Mumbai corridor MODAL SHIFT TO HSR
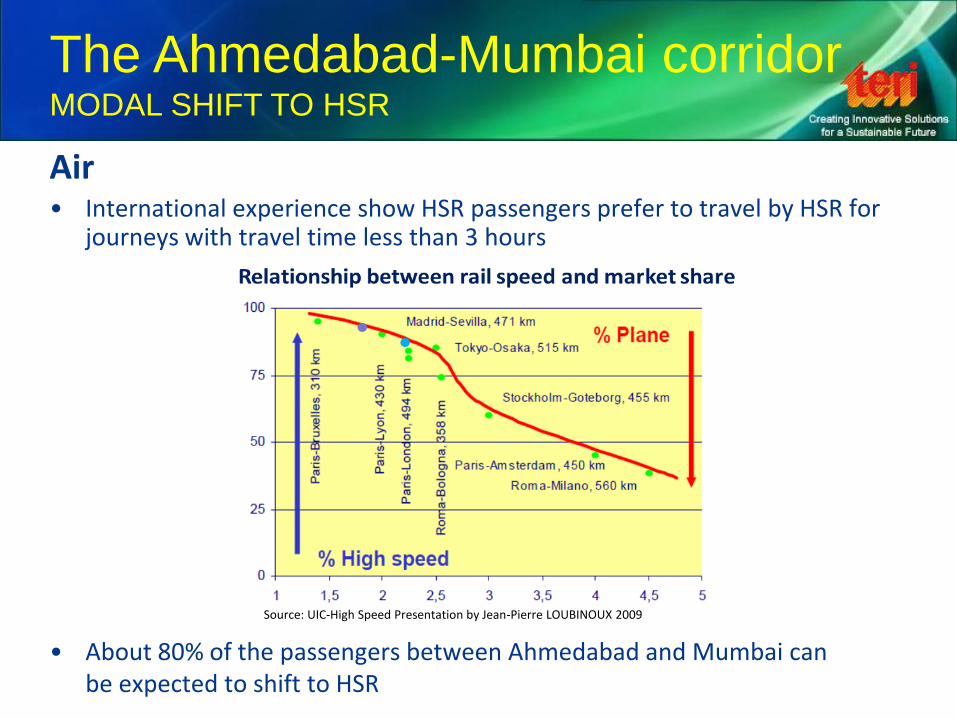
Air • International experience show HSR passengers prefer to travel by HSR for
journeys with travel time less than 3 hours
• About 80% of the passengers between Ahmedabad and Mumbai can be expected to shift to HSR
Source: UIC-High Speed Presentation by Jean-Pierre LOUBINOUX 2009
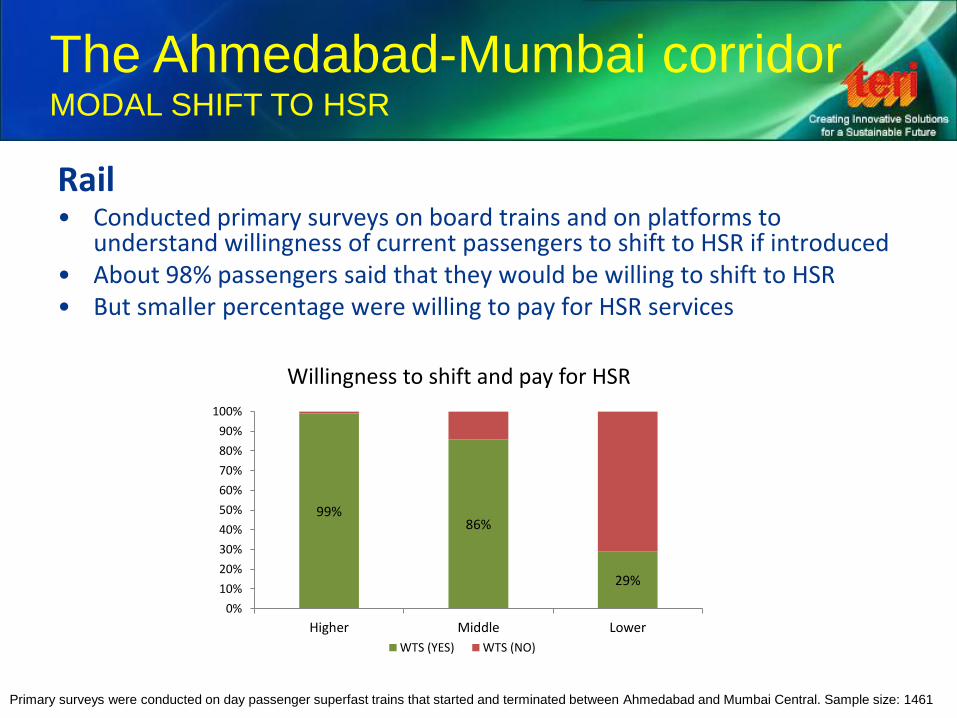
Rail • Conducted primary surveys on board trains and on platforms to
understand willingness of current passengers to shift to HSR if introduced • About 98% passengers said that they would be willing to shift to HSR • But smaller percentage were willing to pay for HSR services
The Ahmedabad-Mumbai corridor MODAL SHIFT TO HSR
Primary surveys were conducted on day passenger superfast trains that started and terminated between Ahmedabad and Mumbai Central. Sample size: 1461
99% 86%
29%
0%
10%
20%
30%
40%
50%
60%
70%
80%
90%
100%
Higher Middle Lower
Willingness to shift and pay for HSR
WTS (YES) WTS (NO)
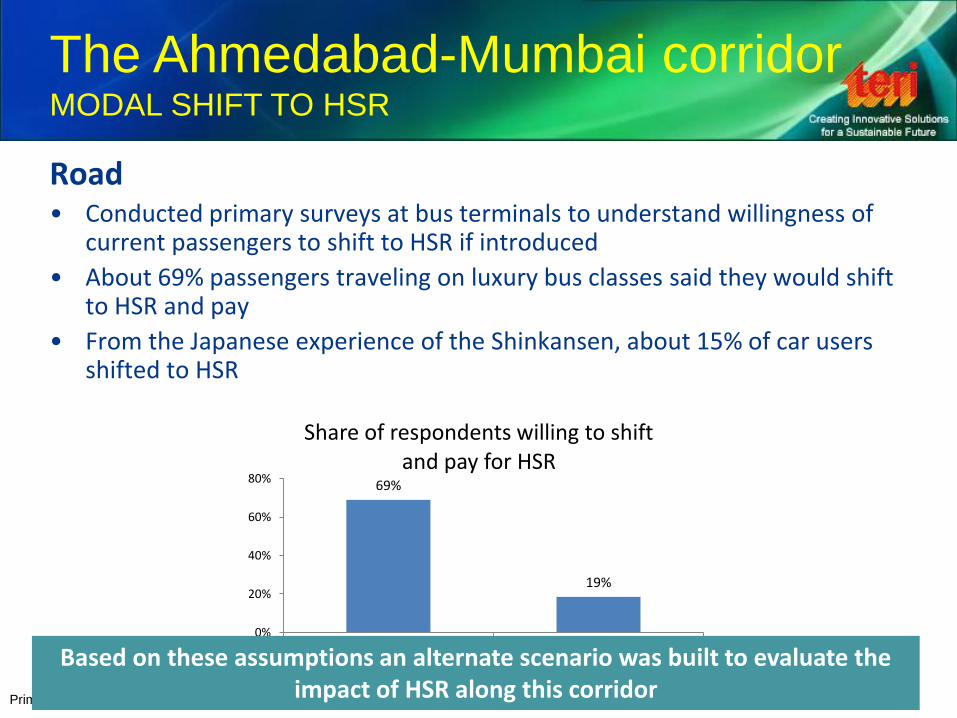
Road • Conducted primary surveys at bus terminals to understand willingness of
current passengers to shift to HSR if introduced
• About 69% passengers traveling on luxury bus classes said they would shift to HSR and pay
• From the Japanese experience of the Shinkansen, about 15% of car users shifted to HSR
The Ahmedabad-Mumbai corridor MODAL SHIFT TO HSR
Primary surveys were conducted at intercity bus terminals in Ahmedabad, Vadodara, Surat and Mumbai. Sample size: 712
69%
19%
0%
20%
40%
60%
80%
Luxury Bus Other Bus
Share of respondents willing to shift and pay for HSR
Based on these assumptions an alternate scenario was built to evaluate the impact of HSR along this corridor
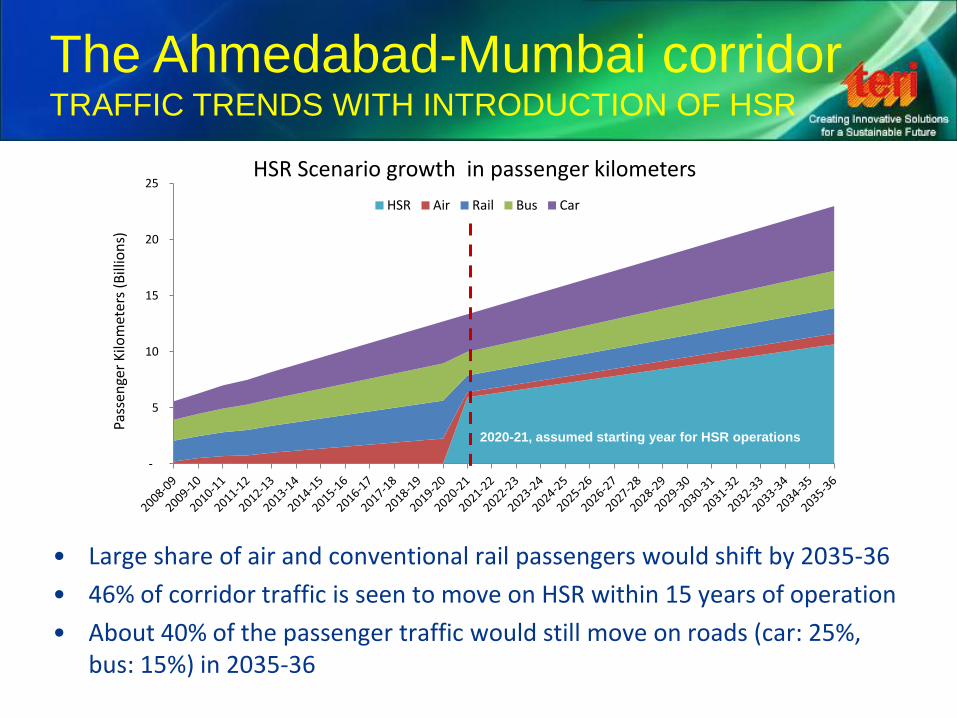
The Ahmedabad-Mumbai corridor TRAFFIC TRENDS WITH INTRODUCTION OF HSR
• Large share of air and conventional rail passengers would shift by 2035-36
• 46% of corridor traffic is seen to move on HSR within 15 years of operation
• About 40% of the passenger traffic would still move on roads (car: 25%, bus: 15%) in 2035-36
-
5
10
15
20
25
Pass
enge
r K
ilom
eter
s (B
illio
ns)
HSR Scenario growth in passenger kilometers
HSR Air Rail Bus Car
2020-21, assumed starting year for HSR operations
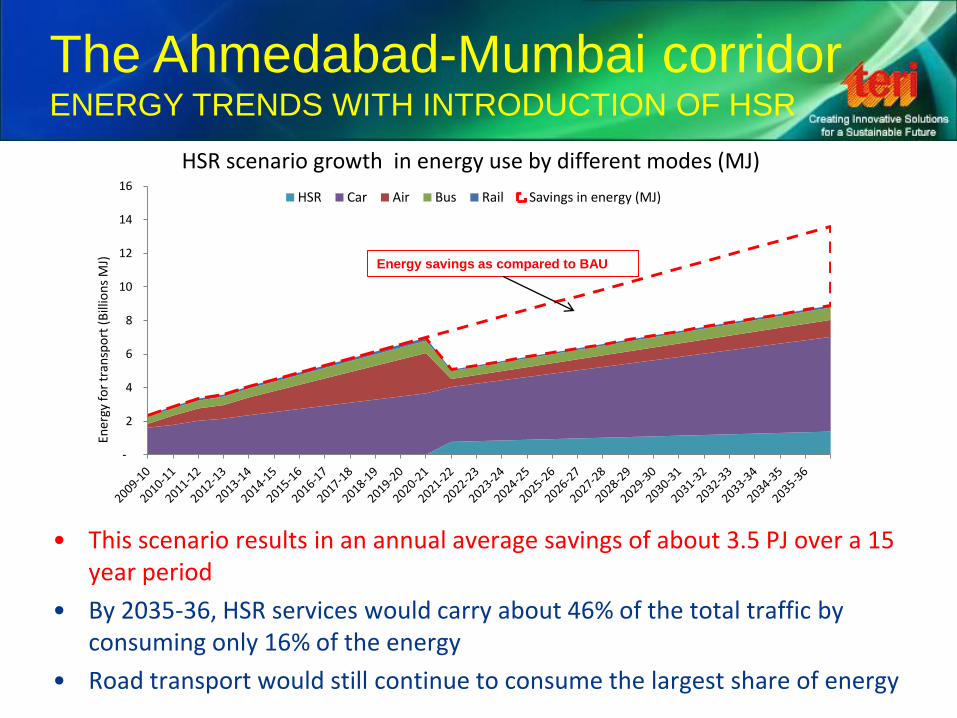
The Ahmedabad-Mumbai corridor ENERGY TRENDS WITH INTRODUCTION OF HSR
• This scenario results in an annual average savings of about 3.5 PJ over a 15 year period
• By 2035-36, HSR services would carry about 46% of the total traffic by consuming only 16% of the energy
• Road transport would still continue to consume the largest share of energy
-
2
4
6
8
10
12
14
16
Ener
gy f
or
tran
spo
rt (
Bill
ion
s M
J)
HSR scenario growth in energy use by different modes (MJ)
HSR Car Air Bus Rail Savings in energy (MJ)
Energy savings as compared to BAU
-
200
400
600
800
1,000
1,200
Mill
ion
s
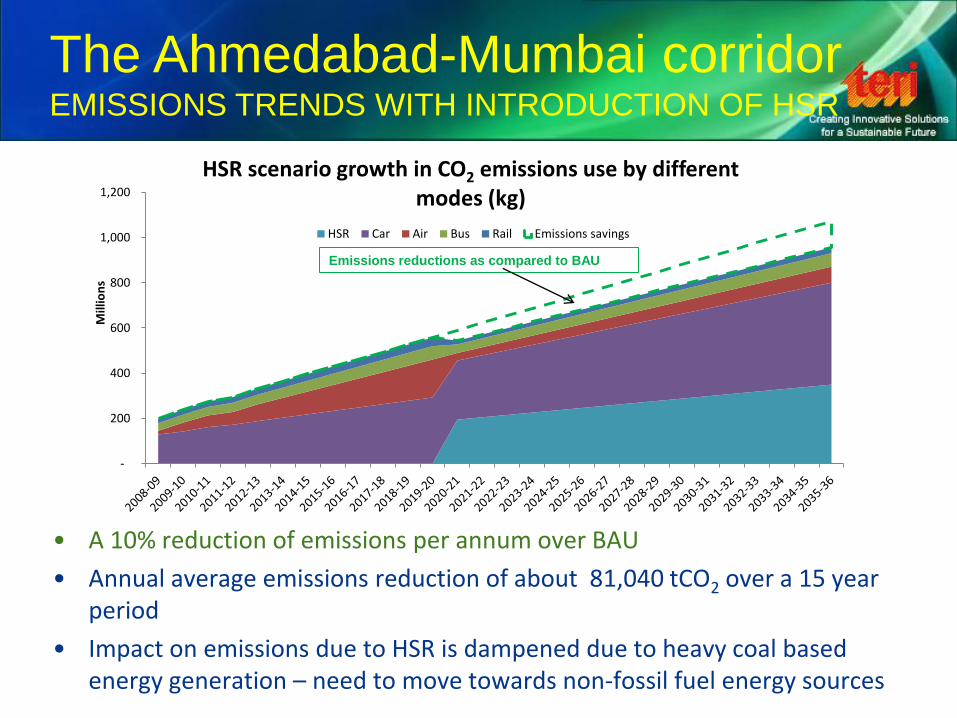
HSR scenario growth in CO2 emissions use by different modes (kg)
HSR Car Air Bus Rail Emissions savings
The Ahmedabad-Mumbai corridor EMISSIONS TRENDS WITH INTRODUCTION OF HSR
• A 10% reduction of emissions per annum over BAU
• Annual average emissions reduction of about 81,040 tCO2 over a 15 year period
• Impact on emissions due to HSR is dampened due to heavy coal based energy generation – need to move towards non-fossil fuel energy sources
Emissions reductions as compared to BAU
Summary
• High Speed Rail is definitely one of the solutions to meet the rapidly increasing demands for mobility along this corridor
– Large energy savings
– Man hours savings
– Increased safety
– Reduced total emissions
• New technologies for electricity generation should be explored to realize the complete benefits of HSR
THANK YOU