Embed Size (px)
Citation preview

High-technology Office Outlook
United States | 2014

JLL | United States | High-technology Office Outlook | 2014 1
What are the pros and cons when considering an urban market over a suburban one and how do the various characteristics help high-tech firms grow?

Table of contents
JLL | United States | High-technology Office Outlook | 2014 2
Key findings 3
In this report 4
U.S. High-tech economy 5
Employment 5
Wages 6
Immigration 7
Patents 7
U.S. High-tech funding 8
Venture capital 8
U.S. Office market impact 11
Has urbanization killed the suburbs? 13
High-tech office market index 15
Local market rankings 17
Local markets
Atlanta 19
Austin 20
Baltimore 21
Boston 22
Boulder 23
Charlotte 24
Chicago 25
Dallas 26
Denver 27
Detroit 28
Indianapolis 29
Los Angeles 30
Minneapolis 31
New Jersey 32
New York 33
Northern Virginia 34
Oakland-East Bay 35
Orange County 36
Orlando 37
Philadelphia 38
Phoenix 39
Pittsburgh 40
Portland 41
Raleigh-Durham 42
Richmond 43
Salt Lake City 44
San Diego 45
San Francisco 46
San Francisco Peninsula 47
Seattle-Bellevue 48
Silicon Valley 49
South Florida 50
Suburban Maryland 51
Washington, DC 52
Contacts 53

The industry has had a profound impact on the office real estate market in this recovery cycle. Never before has an industry single-handedly shaped the way we work together and how we configure space more than the high-tech industry. This has had broad implications on location choice, investment strategies, and market performance.
We’re not in bubble territory, despite the headlines. Venture capital, while on the rise, is flowing to fewer companies at larger sums. Additionally, the stock market remains balanced with both high-volume / high-priced companies, and smaller-cap / growth companies, and no spike in IPOs.
Key findings
3
Clusters are important: understanding the dynamics of the local labor market, the competitive wage environment, and the clustering of innovation are key for occupiers when considering expansion into new markets.
JLL | United States | High-technology Office Outlook | 2014
In this report
4
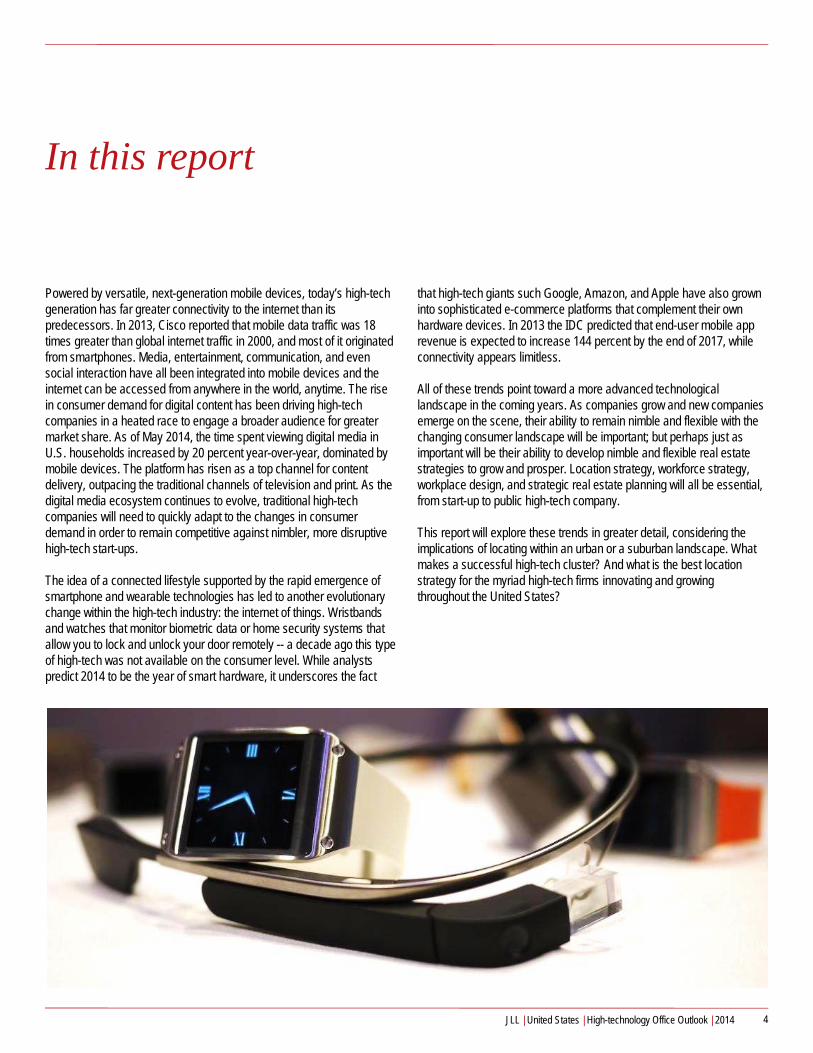
Powered by versatile, next-generation mobile devices, today’s high-tech generation has far greater connectivity to the internet than its predecessors. In 2013, Cisco reported that mobile data traffic was 18 times greater than global internet traffic in 2000, and most of it originated from smartphones. Media, entertainment, communication, and even social interaction have all been integrated into mobile devices and the internet can be accessed from anywhere in the world, anytime. The rise in consumer demand for digital content has been driving high-tech companies in a heated race to engage a broader audience for greater market share. As of May 2014, the time spent viewing digital media in U.S. households increased by 20 percent year-over-year, dominated by mobile devices. The platform has risen as a top channel for content delivery, outpacing the traditional channels of television and print. As the digital media ecosystem continues to evolve, traditional high-tech companies will need to quickly adapt to the changes in consumer demand in order to remain competitive against nimbler, more disruptive high-tech start-ups.
The idea of a connected lifestyle supported by the rapid emergence of smartphone and wearable technologies has led to another evolutionary change within the high-tech industry: the internet of things. Wristbands and watches that monitor biometric data or home security systems that allow you to lock and unlock your door remotely -- a decade ago this type of high-tech was not available on the consumer level. While analysts predict 2014 to be the year of smart hardware, it underscores the fact
that high-tech giants such Google, Amazon, and Apple have also grown into sophisticated e-commerce platforms that complement their own hardware devices. In 2013 the IDC predicted that end-user mobile app revenue is expected to increase 144 percent by the end of 2017, while connectivity appears limitless.
All of these trends point toward a more advanced technological landscape in the coming years. As companies grow and new companies emerge on the scene, their ability to remain nimble and flexible with the changing consumer landscape will be important; but perhaps just as important will be their ability to develop nimble and flexible real estate strategies to grow and prosper. Location strategy, workforce strategy, workplace design, and strategic real estate planning will all be essential, from start-up to public high-tech company.
This report will explore these trends in greater detail, considering the implications of locating within an urban or a suburban landscape. What makes a successful high-tech cluster? And what is the best location strategy for the myriad high-tech firms innovating and growing throughout the United States?
JLL | United States | High-technology Office Outlook | 2014

High-tech employment reaches new peak
5
Employment in the services and manufacturing components of the high-tech sector is now at its highest level ever, having surpassed the dot-com employment high in October 2013. Since then, the sector has added an additional 69,000 jobs, reaching 3.3 million positions as of July 2014. The focus on application and software development, web-based programs, and shared services defines the current high-tech industry boom, resulting in a stronger concentration in high-tech services jobs in this cycle than 15 years ago. The high-tech services component now makes up 83.6 percent of all high-tech jobs compared with 68.0 percent in 2001, when manufacturing played a larger role in the domestic high-tech economy and when fewer companies relied on offshore manufacturing operations to produce hardware and other components.
Of the 3.3 million high-tech jobs, the high-tech services side of the industry employs more than 2.7 million people throughout the United States, and with a multiplier effect of up to four jobs per high-tech services job, an estimated 10.8 million additional jobs are supported by the industry. This side of the employment equation is more likely to include those working in offices and has the most direct impact on office leasing. The traditional office-using employment sectors (professional and business services, information services and financial activities) fully recovered from the financial crisis by early 2014, but of the jobs recovered, 19.1 percent were within the high-tech services sector compared with just 14.1 percent during the 2003 to 2007 period. High-tech is having broader impact on office employment, and the industry has been on the leading edge in the shift toward urban locations, innovative workplaces, and unique build-outs.
High-tech should no longer be considered its own industry, however, as the skills and services performed by traditional high-tech companies are now infiltrating all businesses. Auto manufacturers are creating vehicles that are the equivalent of two-ton computers. Traditional retailers are building websites from the ground up to compete with virtual storefronts. Financial institutions are employing entire engineering teams to create mobile-banking applications that perform the basic functions of an ATM, minus the cash dispensing. High-tech’s traditional job categories are still the most reliable way to track the momentum of the industry, but with almost all major employers and industries integrating software, hardware, and programming into their corporate functions, it is safe to say that high-tech is no longer a standalone industry, but an important component within all business models.
U.S. high-tech employment
Source: Bureau of Labor Statistics
0
500
1000
1500
2000
2500
3000
3500
1999
2000
2001
2002
2003
2004
2005
2006
2007
2008
2009
2010
2011
2012
2013
2014
High-tech services employment (000)High-tech manufacturing employment
U.S. High-tech services share of office employment growth
Source: Bureau of Labor Statistics
19.1%
80.9%
High-Tech services
All other office jobs
JLL | United States | High-technology Office Outlook | 2014
2009-2014

6
Wage wars and the competitive labor market
Tight labor supply is driving up the cost of labor within the high-tech sector. Nationally, the annual average high-tech wage increased by 1.8 percent in 2013 to $102,601; it increased by 1.9 percent in the high-tech services sector to $105,248. In several local markets where labor pools are tightest, these increases were even more pronounced (see the below table). For comparison, traditional office-using jobs saw wages increase by just 0.9 percent to an average of $70,997 last year. While high-tech positions are found within nearly every corporation, using our high-tech industry definition is still the best benchmark for measuring the cost of the highly-skilled workforce required to perform programming and engineering functions.
The supply of labor is constricted with only 298,746 students earning a science, high-tech, engineering, or math (STEM) degree in 2009 (latest data available, National Center for Education Statistics, 2014). While this is up by 22.2 percent from 2001, the struggle to find the right talent is the number one concern for most high-tech companies and for most hiring managers looking for high-tech talent. The need for talent has prompted a rise in training programs that focus on building programming skills, which could help fill the gap. In addition, dozens of free and for-profit programming classes are in place for students who are pre-college. The ubiquitous use of high-tech has sparked more interest among students and young people to learn the skills necessary to enter the evolving workforce, an excellent sign for the sustained growth of the industry.
TOTAL HIGH-TECH EMPLOYMENT SERVICES ONLY HIGH-TECH EMPLOYMENT
Market (ranked by wage growth)
High-tech average annual
wage, 2013
High-tech wage growth, YoY
Market (ranked by wage growth)
High-tech services average
annual wage, 2013
High-tech services wage growth, YoY
San Francisco $156,518 18.9% Silicon Valley $214,117 23.6%New York $125,555 11.3% San Francisco $155,795 19.3%Detroit $81,520 9.9% Austin $85,002 19.0%Seattle-Bellevue $143,597 9.2% Los Angeles $99,785 16.7%Austin $100,431 8.0% Phoenix $77,109 15.4%Silicon Valley $195,815 8.0% New York $126,317 11.5%Denver $93,885 7.3% Detroit $84,110 11.3%San Diego $106,087 6.7% San Diego $107,315 9.8%Chicago $92,881 6.5% South Florida $64,246 9.6%South Florida $67,687 6.4% East Bay $124,697 9.5%Los Angeles $98,687 6.1% Seattle-Bellevue $147,610 9.5%Dallas $82,880 5.8% Dallas $69,861 9.1%Central Florida $74,874 5.4% Denver $92,082 8.6%East Bay $114,883 5.1% Chicago $97,170 8.4%Boulder $105,112 5.0% Charlotte $92,354 8.2%Charlotte $98,380 4.9% Pittsburgh $82,132 7.8%Raleigh-Durham $107,542 4.7% Central Florida $76,493 7.1%Pittsburgh $76,741 4.2% Boston $129,310 6.2%Phoenix $91,507 4.0% Portland $94,062 5.5%Boston $125,979 3.6% Salt Lake City $73,671 5.5%Minneapolis-St.Paul $94,721 3.6% Boulder $112,681 5.4%Richmond $81,065 2.9% Orange County $100,673 5.3%Indianapolis $102,541 2.8% Minneapolis-St.Paul $94,868 4.1%New Jersey $105,355 2.8% Atlanta $98,450 2.8%Atlanta $98,698 2.6% Indianapolis $105,530 2.7%Salt Lake City $75,694 2.3% New Jersey $105,530 2.7%UNITED STATES $102,601 1.8% Raleigh-Durham $89,360 2.6%Orange County $97,289 1.7% Baltimore $104,146 2.2%Baltimore $102,959 1.5% Richmond $82,170 2.2%Philadelphia $100,437 0.7% UNITED STATES $105,248 1.9%Portland $105,350 0.6% Philadelphia $105,756 0.7%Northern Virginia $116,601 -0.4% Northern Virginia $116,842 -0.3%Washington, DC $100,702 -0.6% Washington, DC $100,556 -0.6%Suburban Maryland $103,440 -2.2% Suburban Maryland $102,198 -1.5%San Francisco Peninsula $291,497 -5.1% San Francisco Peninsula $317,931 -5.9%
JLL | United States | High-technology Office Outlook | 2014

7
Immigration reform could deepen the labor pool
The discussion around immigration has been quite focused, with lobbying groups backed by major high-tech firms setting up shop in Washington, DC to voice their concerns around the issue. While immigration reform has a number of components, the point of greatest contention for high-tech companies is the limitation on H-1B Visas, the visa that allows skilled workers from other countries to come into the United States to work. As a result of the tight labor market, only 1.8 percent of computer and mathematical professionals were unemployed in July 2014, many high-tech hiring managers believe an increase in the number of H-1B Visas would help loosen the squeeze on talent.
Only 85,000 H-1B Visas are granted each year, and combined with rollovers from previous years, this cap limits the talent pool for many high-tech companies. Of the nearly 300,000 STEM degrees earned in 2009, 15.8 percent were earned by non-resident aliens who, without an H-1B Visa, were not guaranteed a job in the U.S. upon graduation. And the demand for these work visas is quite high; 172,500 applications for the 2015 fiscal year were received within one week, one of the fastest rates ever recorded. The high-tech industry is a major proponent of these visas, as indicated by the number obtained by professionals in the industry: computer-related occupations accounted for 59.0 percent of the 262,569 H-1B Visa beneficiaries in 2012 (latest data available), up from 50.8 in 2011.
It all begins with an idea
The United States is the clear leader in innovation, as measured by patent activity, with 133,593 utility patents registered in 2013. Coming in a distant second was Japan, with 51,919 patents. Looking at registered patents per capita, Taiwan takes the lead, with one utility patent registered for every 2,113 people. The United States comes in a close second, with one utility patent registered for every 2,384 people.
Computer-related occupations of
H-1B Visas
2011 2012vs.50.8% 59.0%
Innovation concentration is an excellent indicator of the cluster strength and may be a way for companies to determine which countries are good choices for growth opportunities. An innovation cluster supports the development of new ideas, and for companies who are looking to expand into foreign markets, it points to potential acquisition opportunities.
Total utility patents : Top 5 countries
Utility patents per capita: Top 5 countries
Within the United States, California takes the lead for the most patents registered in 2013, with 36,193 patents, or 27.1 percent of the U.S. total. California is followed by Texas and New York with just 6.9 percent and 6.4 percent, respectively, of total U.S. patent generation. The top clusters for high-tech employment, start-up funding, and wage growth are nearly all located in these three states, home to Silicon Valley, San Francisco, Austin, and New York, areas where some of the most successful high-tech companies were founded in this cycle and the last 100 years.
Utility patents by state: Top 10 states
United States133,593
Canada6,547 Germany
15,498
Taiwan11,071
South Korea14,548
Japan51,919
United States2,384 Taiwan
2,113
South Korea3,466
Japan2,448
Israel2,725
CA36,193
TX9,222
WA5,878 MN
5,119
IL4,644 PA
3,961
NJ4,717
NY8,489
MA6,409
JLL | United States | High-technology Office Outlook | 2014

1.5%
29.4%
44.5%
24.7%Seed Stage
Early Stage
Expansion Stage
Later Stage
VC funding by High-tech sector
65%11%
8%
6%3% 7%
Software
Media and Entertainment
IT Services
Consumer Products andServicesComputers and Peripherals
Rest of HT sector
$9.6BTotal U.S.high-tech
VC funding
Venture capital investment still far from dot-com high
8
Venture capital investment has been on the rise over the past 12 months as investors remain confident in the overall health of the high-tech sector. From the third quarter of 2013 to the second quarter of 2014, the high-tech sector secured $24.7 billion in funding, 62.2 percent of total venture capital funding for all sectors. While this figure is significant, it is still well below the peak of 2000 when high-tech companies received $73.8B in venture capital. The software sub-sector consistently attracts the lion’s share of funding; the increased consumption of data and demand for mobile applications has resulted in a 45.5 percent increase in funding. Additionally the expansion of high-tech into other non-tech industries as well as the rise in on-demand services like Uber, AirBnb, and Google Express is attracting more venture capitalists hoping to be early adopters of the latest innovation. Likewise, personalization is permeating other niche segments and on-demand services coupled with the growing popularity in wearable high-tech has led to an increase in funding of consumer products and services by 14.6 percent on a four quarter trailing basis since third quarter 2013.
There has been a shift in where investors are placing their capital. Early expansion, and late-stage funding rounds have grown as institutional venture capital firms look to chase higher returns by placing more capital toward established, fast-growing companies. From the third quarter 2013 to the second quarter of 2014, early, mid, and late-stage funding rose by 64.8 percent and over the past five years the U.S. has recorded some of the largest funding rounds in venture capital history. Further fueling the growth engine, hedge funds and private equity firms have joined venture capital firms, adding to the significant amount of capital available for high-tech companies. This has resulted in a number of well-funded companies expanding their real estate in high-tech hubs so that they can aggressively grow their businesses, especially if their business models are immensely scalable. With the current private investment market placing more value on user-base over profits, funded companies have cash on hand to grow by bolstering engineering and marketing teams and expanding into new markets, all of which has had a direct impact on overall employment levels and commercial real estate conditions. With the current high-tech IPO pipeline expected to exceed 2013, high-tech funding will likely remain robust for the next 12 to 18 months.
U.S. VC funding vs High-tech funding
Source: PricewaterhouseCoopers
$
$ 5,000,000,000
$ 10,000,000,000
$ 15,000,000,000 US Total HT VC FundingUS Total VC Funding
Source: PricewaterhouseCoopers
VC funding by stage of development
Source: PricewaterhouseCoopers
$13.3BTotal Q2 2014
U.S. VCfunding
JLL | United States | High-technology Office Outlook | 2014
U.S. Total VC funding
Expansion stage
Seed stage
Early stage
Later stage

IPO activity remains muted compared to dot-com bubble, but drives significant growth of the stock market
9
With a total market capitalization of more than $5 trillion, the high-tech industry comprises 15 percent of the combined NASDAQ and New York stock exchanges, beating out sectors such as finance, consumer services, energy, and healthcare. With more than 200 companies going public since 2010, that brings the total number of U.S.-listed, public high-tech companies to 682, or 10.4 percent of all companies. The combined impact of these companies on the stock market and promise of high returns in the future are contrasted sharply by the industry’s much smaller share of total employment at just 2.8 percent. The financial impact of a relatively small, but highly-skilled industry further affirms the domestic, and arguably global, shift toward an economy based on innovation. (NASDAQ.com as of 7/25/14)
Risk and growth potential evenly dispersed among public, high-tech companies, but mega caps maintain a leading share
In the first half of 2014, 37 high-tech companies went public for a total of $6.6 billion in proceeds. The IPO roster included companies like Arista Networks, Sabre Corporation, and Zendesk, contributing to a market capitalization of $45 billion, representing 16 percent of the year’s total. On the overall list of public high-tech companies, four of the 17 mega cap (or blue chip) companies are household names like Apple, Microsoft, and Google (which performed a stock split in January and now trades under both GOOG and GOOGL). These companies represent some of the more revolutionary technologies and innovations of the modern era and unsurprisingly are some of the largest companies in terms of real estate. As many more continue to grow in size and value, like Facebook, Oracle, Yahoo!, and Salesforce, commercial real estate will continue to be a fundamental tool for company growth as well as an asset in its ability to further innovate.
JLL | United States | High-technology Office Outlook | 2014
Cap RangeTotal number
of firmsTotal market cap
Total numberof high-tech
firms
Total high-tech market cap
% high-tech market cap
of total
Mega $200b + 17 $5,075,721,559,704 4 $1,754,702,519,836 34.6%
Large $10-$200b 612 $23,533,824,248,444 68 $2,650,849,622,622 11.3%
Mid $2-$10b 1,098 $4,977,448,070,552 149 $628,925,857,524 12.6%
Small $300m-$2b 1,889 $1,613,827,951,074 235 $205,996,596,473 12.8%
Micro $50-$300m 1,527 $234,878,340,486 152 $23,458,390,266 10.0%
Nano <$50m 1,452 $15,441,043,135 74 $1,882,136,019 12.2%
Total 6,595 $35,451,141,213,395 682 $5,265,815,122,740 14.9%
Source: Renaissance Capital, NASDAQ.com
1,181 high-tech companies have gone public from 1995 to 2014
1995
1996 1997 1998 1999 2000
2001
2002 2003 2004 2005 2006 2007 2008
2009
2010 2011 2012 2013
2014
748 IPOs125
or 16.7% of thesecompanies remain
public today
222 IPOs165
or 74.3% of thesecompanies remain
public today
268 IPOs71
or 26.5% of thesecompanies remain
public today

10
Market caps and IPO volume are misleading metrics when measuring the health of a company or an entire industry. While it offers public investors the opportunity to buy a piece of a hopeful blockbuster, an IPO is a way for companies to tap into public capital for expansion, reinvestment, or the ultimate goal, a financial exit. Lest we forget high-tech’s predecessors from the dot-com era, since 1995, 1,181 high-tech companies have gone public, which includes 748 IPOs from 1995 to 2001. Of that high-tech class, only 125 still remain on the stock market in their original form, a mere 16.7 percent. Comparatively, of the public offerings dating from 2009 through 2014, 165, or 74.3 percent, of the 222 companies remain on the stock market. While this includes companies like Zynga and Groupon, which many would consider flops, it reveals a more restrained environment where companies work hard to prove success before enlisting public money to prove it.
Dot-com era high-tech companies make up a fraction of today’s American stock exchangeDifferent this time, however, are the mega-acquisitions that have made headlines for their price tags rather than their savvy. As companies explore exiting options and hope for the elusive billion-dollar deal, acquiring companies are looking to maintain their innovative edge by purchasing new technologies that expand their user base and increase market share. The infusion of young talent and acquisition of start-ups’ technologies help companies to maintain their leading position, especially when cornering a niche market like cloud computing, search, or social media. And while it may appear as though acquisitions reduce the number of start-ups in the market, the successes of these parent companies often result in new spin-offs and start-ups, which continually replenish the industry with new innovation and fuel the market for commercial real estate.
Looking for signs of an overvalued high-tech industry could be argued by both sides. While some recent acquisitions have sold at exorbitant prices, the companies making these purchases are incredibly solvent and view these investments as offensive maneuvers in growing their
Top 15 acquiring companiesCisco 161Google 154Microsoft 134IBM 120Yahoo! 107Hewlett-Packard 86Oracle Corporation 86AOL 63EMC 59Intel 57Apple 49eBay 48Facebook 48Amazon 45Adobe Systems 38
businesses rather than defensive attacks to claw back market share. Additionally, start-ups simply aren’t tapping the public stock markets for capital at the same level seen in 2000. While there’s certainly much hype to be questioned about some new technologies and products, the continual innovation and discovery made by this industry will be a leading driver in the future of the economy as businesses, life and people evolve. With successes come failures and the industry today is one of big ideas and fearlessness, a stark difference from older and more traditional industries.
JLL | United States | High-technology Office Outlook | 2014
Source: CrunchBase

High-tech steadies the office market recovery
11
Halfway through 2014, the U.S. office market continues to demonstrate signs of a more sustained and broadening recovery. Improving macroeconomic conditions have enhanced corporate sentiment, leading the way for hiring in an increasing number of industry segments and geographies. With these new jobs comes the demand for more office space; Q2 2014 net absorption jumped to a recovery-high of 13.9 million square feet and vacancy dropped by 30 basis points to 16.3 percent, even tighter at 13.7 percent for CBDs. For the high-tech sector, these numbers define the resiliency of an industry that has contributed to 29.2 percent absorption since 2010, while at the same time supporting an increasingly landlord-favorable market that’s shrinking in supply.
In response to this constraint, developers have honed in on high-tech markets as promising investments for speculative construction, hoping to capture the upswing of this real estate cycle. Of the 65.4 million square feet of space under construction across the country, 14.2 million (21.7 percent) is underway in the tech-heavy markets of the Bay Area, Midtown South in New York, Boston, Seattle, Portland, and Austin, which will come online over the next four years. Importantly, the current construction cycle nationally has been characterized by strong levels of preleasing compared to the mid-2000s. For tenants, this means that the relief valve will not do much to create new opportunities at the bargaining table with landlords, and the space that does come to the market will command a premium not only for quality, but also scarcity.
Secondary high-tech markets will begin to take the lead, as will emerging geographies
Tightening conditions have been beneficial for secondary high-tech markets as well as tertiary corporate markets not regarded during earlier years of the recovery. Google’s 105,000-square-foot lease at 1000 W Fulton Street in Chicago, for example, is representative of recognized firms’ expansion outward from high-tech epicenters to attract new talent at lower labor and real estate costs. In some geographies, these companies have become anchors for new clusters in markets where high-tech is not a driver of the local economy. In Atlanta, MailChimp’sprelease at Ponce City Market has paved the way to create a niche in a hyper-diverse market that can attract the young, entrepreneurial employees that these companies crave. Further, this is occurring within a property that has undergone extensive renovation and features many historic and aesthetically pleasing elements desired by high-tech tenants.
Shifts to affordability can even be seen in core high-tech markets. Upon its expansion to Portland, Salesforce was able to take advantage of a market with Class A rents 58.5 percent lower than in San Francisco, but also where employment is growing by 8.8 percent in computer systems design. This does not mean that the Bay Area is out of the equation; on the contrary, Salesforce’s 714,000-square-foot prelease at 415 Mission Street shows the firm’s continued commitment to San Francisco.
Cumulatively, these markets have seen occupancy gains of 40.7 million square feet, or 29.2 percent of national absorption
-10,000,000
0
10,000,000
20,000,000
30,000,000
40,000,000
50,000,000
2010 2011 2012 2013 YTD2014
YTD
net
abs
orpt
ion
(s.f.
)
Bay Area:17,510,693 s.f.
Midtown South:1,890,633 s.f.
Boston:4,744,568 s.f.
Seattle:9,380,384 s.f.
Portland:4,052,099 s.f.
Austin:3,100,415 s.f.
Source: JLL Research
Coming online over the next 4 years
Bay Area
MidtownSouth in NYC
Boston
Seattle
Portland
Austin
65,400,000square feetof space is
under construction across the country
14,200,000square feet
of that space is in the
tech-heavy markets
21.7% or
JLL | United States | High-technology Office Outlook | 2014

12
Finally, the emergence of high-tech clusters mixing with traditional industry concentrations and a new, digital business model has had a beneficial impact on the office market. Los Angeles’ Westside is home to a burgeoning group of companies at the confluence of high-tech and entertainment, long the mainstay of the metro area. Video game creator Riot Games, which leased 77,000 square feet at 12312 W Olympic Boulevard, is likely to be joined by Google as well as advertising mogul RPA, both of which are actively looking for space nearby. As high-tech intermingles with traditional segments of the economy over the coming years, these types of clusters and growth sectors are likely to become much more common in markets throughout the United States.
High-tech will remain a key component of the office market, but its share of gains may decline slightly
Over the next 24 months, by which point the U.S. office market as a whole is likely to peak, high-tech will continue to drive occupancy gains, tenant demand, expansionary activity, and even preleasing in certain markets and submarkets.
In absolute terms, the industry is still in expansionary mode, as evidenced by consistent year-on-year job growth of more than 4.0 percent as well as the more than 5.7 million square feet of net absorption
in core markets seen in 2014 alone. Innovative and new technologies willbe increasingly crucial components in the next phase of the economic cycle and will be responsible for a significant share of activity. However, recent economic growth seen across the country means that tech’s share of absorption and other fundamentals may decline. Nonetheless, it remains a formidable driver of the economy and will continue to impact office markets across the country.
High-tech is on the leading edge of workplace change
Because so much of the early demand for office space coming out of the recession was driven by high-tech companies, so the industry’s workplace design preferences are now permeating broader changes within the commercial office landscape. Open plans, a mix of collaborative and private workspaces, and flexible furniture designs all in the name of innovation and productivity define the 21st
century workplace.
Many high-tech companies are largely staffed by millennials, and their workplace preferences are driving the trend toward denser work environments, in both urban and suburban settings. The typical buildoutin the late 20th century of 250 square feet per person has shrunk to an average of 200 square feet per person today. As millennials make up a larger portion of the total workforce (50 percent by 2020) their workplace preferences will continue to drive the trend toward higher density. However, there is a point of diminishing returns and finding the right balance between open and private space is key in creating desirable workplaces that still foster creativity and innovation.
Landlords are adopting creative buildouts in their assets across the country in order to attract high-tech tenants and others in creative industries. Open ceilings, unfinished floors, removal of window-line offices, and restoration of original architectural details are becoming commonplace. Landlords with traditional suburban buildings are also finding creative ways to build attractive environments including constructing outdoor sports areas, adding an amenities building with retail or fitness facilities, and adding pathways within the campus to create a more walkable environment.
Rents in many of these submarkets have jumped more than 10.0 percent year-over-year…
Source: JLL Research
…resulting in some of the highest asking rents across submarkets nationally
Source: JLL Research
13.6% 13.2% 13.0% 12.0% 11.4% 10.4% 10.3% 10.0%
2.7%
0.0%2.0%4.0%6.0%8.0%
10.0%12.0%14.0%16.0%
Cla
ss A
ask
ing
rent
yea
r-on-
year
gro
wth
$96.96 $96.72 $88.44 $82.13 $80.76 $74.72 $69.81 $62.90
$34.92
$0.00$20.00$40.00$60.00$80.00
$100.00$120.00
Cla
ss A
dire
ct a
vera
ge a
skin
g re
nt
($ p
.s.f.
)
15%Space reduction by U.S. law firms
and financial services
relocating
72%Of global CREs
plan to aggressively
increase density in next 3 years
200s.f./employee average target
density, down from 250-300 s.f. in 2009
50% of the U.S.
workforce was baby boomers in 2010. Millennials
will be 50% by 2020
Demographics and technology drive productivity and utilization and the next evolution of office space use.
JLL | United States | High-technology Office Outlook | 2014

Has urbanization killed the suburbs? We think not…
13
The urban versus suburban debate has been waged by economists, businesses, and industries over the last several years in an attempt to understand the successes and failures within local markets that range anywhere from employee attraction and retention to business creation and expansion. For the high-tech industry, understanding this phenomenon is paramount to a company’s sustainability and growth, but the question of which one is better is not as simple as that. Some suburban markets, like Silicon Valley and Dallas are enjoying economic recovery and expansion far ahead of others as a result of unique attributes and amenities that appeal to both employees and employers. And urban markets like San Francisco and New York, which have always maintained a cool factor, are unsurprisingly producing high-tech innovators that would never consider relocating to a neighboring suburb for fear that they would lose their edge and potentially their best and brightest employees. So what are the pros and cons when considering an urban market over a suburban one and how do the various characteristics help high-tech companies grow?
Are the suburbs dead?It is true that there remain many recession-ravaged suburbs throughout the U.S., still recovering from lost industries and company shut-downs, which have left real and lasting unemployment and economic despair, and urban dwellers would happily portray dense living and plentiful amenities as far more culturally satisfying and exciting. However, there are many markets that offer a highly desirable suburban lifestyle with a low cost of living and many available jobs, and there are even more markets that offer suburban living surrounding an urban core, providing people with the best of both worlds.
Downtown Palo Alto, located in Silicon Valley, has enjoyed such high demand in recent years that the office market is just 3.6 percent vacant with an average asking rate over $86 per square foot, beating New York City’s Plaza District at $85 per square foot. Its quaint downtown strip on University Avenue with restaurants and shopping, its year-round, outdoor-friendly weather, and its proximity to both universities and neighboring San Francisco have established it firmly as a much-desired suburb. Its only downside is the high cost of living. Austin, however, offers access to talent with nearby University of Texas, Austin, walkable amenities both downtown and in South Austin, and a highly favorable business environment that is perfect for a start-up. Not only that, but average rental rates for apartments are 38 percent lower than New York City and 66 percent lower than San Francisco, according to Arcayibes.
What’s so great about urban living?There are a lot of reasons that urban dwelling has been revived in recent years: the increasing desire to walk or take public transit rather than drive, the multi-faceted lifestyle that offers theater, arts, and nightlife, and the move toward fewer belongings that smaller spaces can accommodate rather than expansive homes filled with objects. Urban cities today have become incredible destinations that resemble nothing of the dirty and polluted streets that led, in part, to the post-World War II suburbanization in the 1940s and 50s. Rather, they are cosmopolitan metropolises that compare to the romance and exoticness of London, Paris, and Hong Kong. Additionally, and probably most importantly, they are often business centers that offer jobs unavailable in far-out suburbs, which became a driving factor in the growth of urban markets following the recent economic recession, and offered a place of opportunity for the recently down-trodden.
Why is this an important topic for high-tech companies?The question of whether or not a company should locate in a suburb or an urban center is entirely dependent on the needs of the company. Urban markets offer start-ups a high-tech nucleus from which it can source talent, test its product, or access incubators and co-working spaces available in higher quantity in an urban core. High-tech conglomerates can also benefit from the urban market as well. In 2012, Motorola Mobility (a subsidiary of Google at the time) announced that it would be moving its headquarters from Libertyville, Illinois to Chicago all in the name of employee attraction and retention. Following the announcement of the relocation, employment applications increased by 28 percent. In January 2014, Lenovo purchased Motorola Mobility from Google and plans to keep its new Chicago location and even expand its premises. On the other hand, Google, which calls nearly the entire city of Mountain View, CA its headquarters, continues to thrive in the Silicon Valley suburb with the ownership and leasehold of nearly 10 million square feet, and thousands of employees. While it maintains a location in every urban market across the country, the opportunity to create a mega campus, building by building was made possible by suburban sprawl, and not only that, it is a nice place to live.
These stories demonstrate that it is not necessarily a question of suburban versus urban, but what is best for the growth and success of the company. The answer is unique to all sizes and all types of high-tech firms. This report examines the real estate environment, the market characteristics, and the reasons that each of these 34 markets appeal to high-tech companies. They are not all Silicon Valleys, but they all offer unique qualities that have enabled the high-tech industry to grow. Understanding what location means to your company and its ability to source talent and grow revenue will remain a top driver in company success.
JLL | United States | High-technology Office Outlook | 2014

14
No two markets are alikeIn this report, JLL analyzed the features and amenities of 34 markets across the country to ascertain the following:
• Is public transit available?
• Does the market have amenities that are within walking distance?
• Is the market comprised of mixed-use real estate that includes retail and office space?
• Or, is the market primarily comprised of traditional office parks that are without amenities?
• Is the market easily accessible by the highway and is it within 10 miles of an airport?
• As a market with high-tech activity, is it anchored by one particular high-tech company?
• Is there a dominant high-tech subsector that’s clustering in the market?
Results from this study revealed that no two markets are alike and that more than half of the markets are actually a mix of suburban and urban characteristics, not purely one or the other. Attractiveness and popularity among high-tech companies is really experienced at the submarket and micro-market level where interesting neighborhoods have become the focal point for much of the clustering of this industry.
San Diego has NO mixed-use
urban suburban4 13
Market stats
urban and suburban features17
HAVE transit12
DO NOT HAVE transit6
ARE walkable44%
ARE walkable in parts56%
HAVE mixed-use32%
PARTIAL mixed-use65%
markets are located near a major freeway exit
All34
62828 are within and 6 are outside 10 miles of an airport
markets have a software cluster11HAVE electronics & instruments cluster3
HAVE media & entertainment cluster3
5
3
2
2
Number of markets by anchored company
JLL | United States | High-technology Office Outlook | 2014

High-tech industry market score and cycle clock
15
Our proprietary high-tech office market score takes into account key metrics to determine the position of each market included in this report along the high-tech office growth cycle. This score is not a ranking per se, but it does quantify market position relative to the others based on employment growth, high-tech office employment concentration, market dynamism, innovation, and investment trends.
Each market is scored among the others in this report, so a high score only indicates that it is a leader among the top high-tech markets in the U.S., while a low score means that a market has slower momentum, but opportunity to grow even more.
The high-tech office cycle clock is a visual representation of where each market in this report stands relative to the others in the current cycle. Markets positioned on the two left quadrants of the clock indicate strong momentum in most, if not all, categories measured to produce an overall score. Markets placed in the two right quadrants of the clock are those that have metrics with room to improve.
The following metrics are considered to be key drivers of high-tech industry growth, and have weighted each category to derive a total score for each market:
High-tech job growth: broad measure of economic success and job creationHigh-tech wage growth: measures the competitive nature of the labor market in a given location. How much competition is there for the right talent?High-tech services concentration: measures jobs in the industry that fall within office-using employment sectors as a percentage. Larger concentrations have greater impact on office space demand when changes to employment occur, providing a strong indicator of how the high-tech industry in each market could move real estate. Share of U.S. venture capital funding: measures the impact venture capital funding has on the industry in each market, and the potential for company growth and new job creation. Intellectual capital: measures the availability of skilled labor for each market, quantified by the percentage of people 25 or older with a bachelor’s degree or higher. Innovation: measures utility patents granted in each market as a leading indicator of new inventions or ideas.Market dynamism: New this year, this category measures the concentration of favorable amenities in each market. How walkable is the market? How many other high-tech companies are already clustered there? How vibrant is the market outside of the office sector?
Growing late stage
Contracting
Growing early stage
Stabilizing
Baltimore, Indianapolis, Minneapolis-St.Paul,Northern Virginia, New Jersey,
Orange County, Orlando, Pittsburgh, San Diego
Austin, New York
Boulder, Denver, Los Angeles, Philadelphia
Chicago, Dallas, Portland, San Francisco Peninsula
Miami, Detroit, Charlotte
Washington, DC, UNITED STATES
Atlanta, Phoenix, Raleigh-Durham, Salt Lake City Suburban Maryland
San Francisco
Seattle-Bellevue, Silicon Valley
Boston, Oakland-East Bay
Richmond
JLL | United States | High-technology Office Outlook | 2014

Local market rankings
16
84.6 San Francisco
52.6 San Francisco Peninsula
70.6 Silicon Valley
44.7 Los Angeles
31.1 Orange County
31.0 San Diego
39.6 Salt Lake City
46.3
Denver
71.4 Seattle-Bellevue
53.8 Portland
53.2Chicago
52.7Dallas
36.0Minneapolis-St. Paul
58.5
Austin
40.2 Phoenix
39.4
Atlanta
43.5Washington, DC
38.3Baltimore
36.0New Jersey
26.5Suburban, MD
58.7 New York
38.6Northern, VA
35.7
Pittsburgh
35.8
Indianapolis
47.6
Philadelphia56.8 Boston
28.5 Charlotte
12.9Richmond
29.9
South Florida
34.6
Orlando
40.7 Raleigh-Durham
28.5Detroit
44.5Boulder
57.0 East Bay
JLL | United States | High-technology Office Outlook | 2014
Total weighted score
San Francisco 84.6 Dallas 52.7 Phoenix 40.2 Orlando 34.6
Seattle-Bellevue 71.4 San Francisco Peninsula 52.6 Salt Lake City 39.6 Orange County 31.1
Silicon Valley 70.6 Philadelphia 47.6 Atlanta 39.4 San Diego 31.0
New York 58.7 Denver 46.3 Northern Virginia 38.6 South Florida 29.9
Austin 58.5 Los Angeles 44.7 Baltimore 38.3 Detroit 28.5
East Bay 57.0 Boulder 44.5 Minneapolis-St. Paul 36.0 Charlotte 28.5
Boston 56.8 Washington, DC 43.5 New Jersey 36.0 Suburban Maryland 26.5
Portland 53.8 UNITED STATES 42.5 Indianapolis 35.8 Richmond Virginia 12.9
Chicago 53.2 Raleigh-Durham 40.7 Pittsburgh 35.7
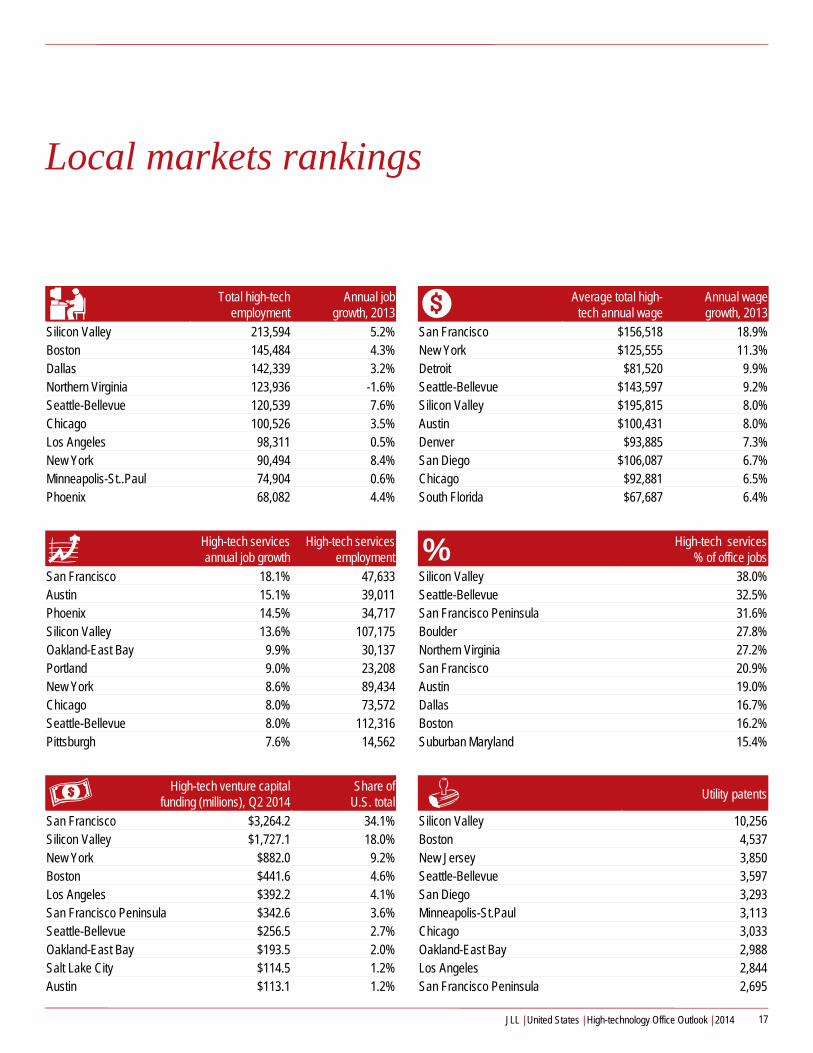
Local markets rankings
17
Total high-tech employment
Annual job growth, 2013
Silicon Valley 213,594 5.2%Boston 145,484 4.3%Dallas 142,339 3.2%Northern Virginia 123,936 -1.6%Seattle-Bellevue 120,539 7.6%Chicago 100,526 3.5%Los Angeles 98,311 0.5%New York 90,494 8.4%Minneapolis-St..Paul 74,904 0.6%Phoenix 68,082 4.4%
High-tech services annual job growth
High-tech services employment
San Francisco 18.1% 47,633Austin 15.1% 39,011Phoenix 14.5% 34,717Silicon Valley 13.6% 107,175Oakland-East Bay 9.9% 30,137Portland 9.0% 23,208New York 8.6% 89,434Chicago 8.0% 73,572Seattle-Bellevue 8.0% 112,316Pittsburgh 7.6% 14,562
High-tech venture capital funding (millions), Q2 2014
Share ofU.S. total
San Francisco $3,264.2 34.1%Silicon Valley $1,727.1 18.0%New York $882.0 9.2%Boston $441.6 4.6%Los Angeles $392.2 4.1%San Francisco Peninsula $342.6 3.6%Seattle-Bellevue $256.5 2.7%Oakland-East Bay $193.5 2.0%Salt Lake City $114.5 1.2%Austin $113.1 1.2%
Average total high-tech annual wage
Annual wage growth, 2013
San Francisco $156,518 18.9%New York $125,555 11.3%Detroit $81,520 9.9%Seattle-Bellevue $143,597 9.2%Silicon Valley $195,815 8.0%Austin $100,431 8.0%Denver $93,885 7.3%San Diego $106,087 6.7%Chicago $92,881 6.5%South Florida $67,687 6.4%
High-tech services % of office jobs
Silicon Valley 38.0%Seattle-Bellevue 32.5%San Francisco Peninsula 31.6%Boulder 27.8%Northern Virginia 27.2%San Francisco 20.9%Austin 19.0%Dallas 16.7%Boston 16.2%Suburban Maryland 15.4%
Utility patents
Silicon Valley 10,256Boston 4,537New Jersey 3,850Seattle-Bellevue 3,597San Diego 3,293Minneapolis-St.Paul 3,113Chicago 3,033Oakland-East Bay 2,988Los Angeles 2,844San Francisco Peninsula 2,695
JLL | United States | High-technology Office Outlook | 2014
%

Local high-tech markets
18JLL | United States | High-technology Office Outlook | 2014
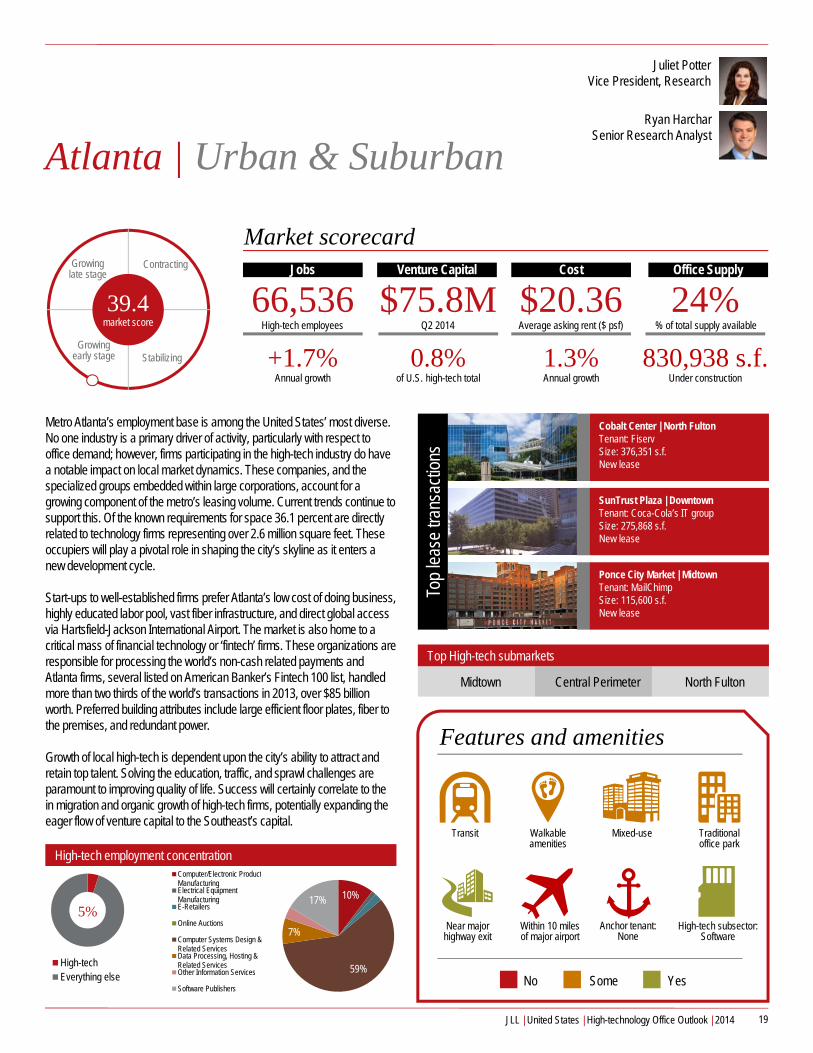
Atlanta | Urban & Suburban
Metro Atlanta’s employment base is among the United States’ most diverse. No one industry is a primary driver of activity, particularly with respect to office demand; however, firms participating in the high-tech industry do have a notable impact on local market dynamics. These companies, and the specialized groups embedded within large corporations, account for a growing component of the metro’s leasing volume. Current trends continue to support this. Of the known requirements for space 36.1 percent are directly related to technology firms representing over 2.6 million square feet. These occupiers will play a pivotal role in shaping the city’s skyline as it enters a new development cycle.
Start-ups to well-established firms prefer Atlanta’s low cost of doing business, highly educated labor pool, vast fiber infrastructure, and direct global access via Hartsfield-Jackson International Airport. The market is also home to a critical mass of financial technology or ‘fintech’ firms. These organizations are responsible for processing the world’s non-cash related payments and Atlanta firms, several listed on American Banker’s Fintech 100 list, handled more than two thirds of the world’s transactions in 2013, over $85 billion worth. Preferred building attributes include large efficient floor plates, fiber to the premises, and redundant power.
Growth of local high-tech is dependent upon the city’s ability to attract and retain top talent. Solving the education, traffic, and sprawl challenges are paramount to improving quality of life. Success will certainly correlate to the in migration and organic growth of high-tech firms, potentially expanding the eager flow of venture capital to the Southeast’s capital.
Top High-tech submarkets
Midtown Central Perimeter North Fulton
19
Contracting
Stabilizing
Growing late stage
Growing early stage
Juliet PotterVice President, Research
39.4market score
Cobalt Center | North FultonTenant: FiservSize: 376,351 s.f.New lease
SunTrust Plaza | DowntownTenant: Coca-Cola’s IT groupSize: 275,868 s.f.New lease
Ponce City Market | MidtownTenant: MailChimpSize: 115,600 s.f.New lease
Top
leas
e tra
nsac
tions
Market scorecardJobs
66,536+1.7%
Annual growth
Venture Capital Cost Office Supply
$75.8M0.8%
of U.S. high-tech total
$20.361.3%Annual growth
24%830,938 s.f.
Under construction
High-techEverything else
High-tech employment concentration
10%1%
2%
0%
59%
7%
4% 17%
Computer/Electronic ProductManufacturingElectrical EquipmentManufacturingE-Retailers
Online Auctions
Computer Systems Design &Related ServicesData Processing, Hosting &Related ServicesOther Information Services
Software Publishers
Features and amenities
5%
Walkable amenities
Transit Mixed-use Traditional office park
No Some Yes
Near major highway exit
Within 10 miles of major airport
High-tech subsector:Software
Q2 2014 % of total supply availableAverage asking rent ($ psf)High-tech employees
Anchor tenant:None
Ryan HarcharSenior Research Analyst
JLL | United States | High-technology Office Outlook | 2014

Austin| Urban & Suburban
Dubbed “Silicon Hills” for its booming high-tech scene, Austin is home to more than 4,700 high-tech firms. While the CBD’s prestigious location gives firms an edge in attracting talent, the Northwest high-tech corridor is home to Apple, Google, IBM, Oracle, National Instruments, Microsoft, Cisco, and HP.
Austin offers an abundance of educated talent at a fraction of the cost of other high-tech markets. The average wage for Austin high-tech workers is half that of Silicon Valley, and the absence of corporate and personal income taxes create a pro-business environment. The city is attractive to employees, who can enjoy a low cost of living and high quality of life. The University of Texas, combined with an attractive lifestyle, have young people flocking to the city. Access to accelerators, incubators and venture capital firms make the city fertile for growth. Austin is also home to SXSW Interactive, where Twitter made its 2007 debut.
The fierce battle for talent has led high-tech companies to invest heavily in amenities, seeking to create unique and high quality environments that embody their corporate cultures. The workplace has become a tool for employee recruitment and retention. This has produced a high demand for new, or recently remodeled, creative office space.
Flexibility is in high demand. Tightening vacancy and rising costs have pushed companies seeking large blocks and expansion options to the suburbs. As a result, there are more urbanized, mixed-use projects that recreate a downtown atmosphere, with walkable amenities, entertainment, and housing options.
Top High-tech submarkets
Central Business District
Northwest Southwest
20
Contracting
Stabilizing
Growing late stage
Growing early stage
Brittany MakiResearch Analyst
58.5market score
501 Congress | CBDTenant: DropboxSize: 60,000 s.f.New lease
Quarry Oaks Atrium A | NorthwestTenant: WebsenseSize: 92,000 s.f.New lease
Encino Trace | SouthwestTenant: ARM, Inc.Size: 120,000 s.f.New lease
Top
leas
e tra
nsac
tions
Market scorecardJobs
65,010+8.3%
Annual growth
Venture Capital Cost Office Supply
$113M1.2%
of U.S. high-tech total
$30.449.1%Annual growth
5.6%2.6 m.s.f.
Under construction
High-techEverything else
High-tech employment concentration
46%
2%2%0%
33%
4%3%
10%
Computer/Electronic ProductManufacturingElectrical EquipmentManufacturingE-Retailers
Online Auctions
Computer Systems Design &Related ServicesData Processing, Hosting &Related ServicesOther Information Services
Software Publishers
Features and amenities
10%
Walkable amenities
Transit Mixed-use Traditional office park
No Some Yes
Near major highway exit
Within 10 miles of major airport
High-tech subsector:Software
Q2 2014 % of total supply availableAverage asking rent ($ psf)High-tech employees
Anchor tenant:Dell
JLL | United States | High-technology Office Outlook | 2014

Baltimore | Urban & Suburban
While high-tech firms are located across the Baltimore metro region, the Baltimore City Southeast submarket has seen the greatest amount of recent activity by high-tech tenants. Firms have been drawn to the area due in part to a growing millennial population and nearby educational institutions, such as Johns Hopkins University and the University of Maryland, along with several successful incubators. Demand from the high-tech sector has helped to spur new development and contributed to tight market conditions in neighborhoods including Locust Point, Federal Hill, Fells Point and Canton. To the north of the city, software publishers, such as ZeniMax Online Studios and Firaxis Games in Hunt Valley and the I-83 Corridor, have long been an important occupier. Larger corporate high-tech users are typically drawn to the Columbia South submarket due to its large labor pool and traditional office inventory.
In one of the largest lease transactions of the year for the overall market, Millennial Media expanded their headquarters in Canton at 2400 Boston Street as the mobile advertising firm grew into space recently vacated by The Emerging high-tech Center, a non-profit incubator program. Demonstrating the lack of existing availability, Mindgrub and Groove Commerce both leased space in new adaptive re-use projects. In Baltimore City, a lack of existing inventory is the greatest challenge facing high-tech tenants. Outside of the traditional downtown in the communities that are sought after by high-tech tenants, vacancy rates are typically well-below five percent with blocks of over 5,000 square feet limited. The viability of adaptive re-use projects and new development is challenged by the hesitancy of high-tech tenants to commit to long-term leases.
Top High-tech submarkets
Baltimore Southeast I-83 North Columbia South
21
Contracting
Stabilizing
Growing late stage
Growing early stage
Patrick LatimerSenior Research Analyst
38.3market score
2400 Boston Street | Baltimore SETenant: Millennial MediaSize: 90,558 p.s.f.Renewal and expansion
1215 E Fort Avenue | Baltimore SETenant: MindgrubSize: 13,000 p.s.f.Relocation
443 S Central Avenue | Baltimore SETenant: Groove CommerceSize: 10,000 p.s.f.Relocation
Top
leas
e tra
nsac
tions
Market scorecardJobs
34,402+2.1%
Annual growth
Venture Capital Cost Office Supply
$22M0.2%
of U.S. high-tech total
$22.200.8%Annual growth
18%0.5 m.s.f.
Under construction
High-techEverything else
High-tech employment concentration
11%
0% 1%0%
79%
4% 2% 3%Computer/Electronic ProductManufacturingElectrical EquipmentManufacturingE-Retailers
Online Auctions
Computer Systems Design &Related ServicesData Processing, Hosting &Related ServicesOther Information Services
Software Publishers
Features and amenities
3.5%
Walkable amenities
Transit Mixed-use Traditional office park
No Some Yes
Near major highway exit
Within 10 miles of major airport
High-tech subsector:Mobile
Q2 2014 % of total supply availableAverage asking rent ($ psf)High-tech employees
Anchor tenant:Millennial
Media
JLL | United States | High-technology Office Outlook | 2014

Boston | Urban & Suburban
Top High-tech submarkets
East Cambridge Downtown 128/Mass Pike
22
Contracting
Stabilizing
Growing late stage
Growing early stage
Jordan YarboroSenior Research Analyst
56.8market score
Market scorecardJobs
145,484+4.3%
Annual growth
Venture Capital Cost Office Supply
$441M4.6%
of U.S. high-tech total
$32.587.9%Annual growth
19%4.2 m.s.f.
Under construction
High-techEverything else
High-tech employment concentration
32%
2%
0%
39%
4%
5%17%
Computer/Electronic ProductManufacturingElectrical EquipmentManufacturingE-Retailers
Online Auctions
Computer Systems Design &Related ServicesData Processing, Hosting &Related ServicesOther Information Services
Software Publishers
Features and amenities
7.9%
Walkable amenities
Transit Mixed-use Traditional office park
No Some Yes
Near major highway exit
Within 10 miles of major airport
High-tech subsector:Software
Q2 2014 % of total supply availableAverage asking rent ($ psf)High-tech employees
Anchor tenants:Oracle, Google,
Microsoft
9 Technology Drive | 495/Mass PikeTenant: Bose Corporation Size: 280,000 s.f.Renewal
77 CityPoint | 128/Mass PikeTenant: Care.comSize: 108,000 s.f.Relocation and expansion
Lafayette City Center | DowntownTenant: CarboniteSize: 53,000 s.f.Relocation and expansion
Top
leas
e tra
nsac
tions
Greater Boston is a diverse and evolving office market, prime for technology companies. Elite universities, such as Harvard and MIT, continue to fuel innovation and produce top talent. Tech companies traditionally cluster in East Cambridge, Route 128/Mass Pike and the Seaport District, which recently became a popular value option for urban focused tenants. Today, low vacancies and surging rents in these tech hotbeds are forcing tenants to explore alternative locations. In Boston, the Financial District and Downtown Crossing are welcoming technology tenants, attracted to a growing amenity base and proximity to the Red Line. Outer urban areas like Somerville, Watertown and Charlestown are all benefitting from the spillover of tech tenants from neighboring Boston and Cambridge as new development projects will bring access to amenities, modern housing and public transportation. Incubators and shared workspaces are vital to Boston’s tech ecosystem, providing flexible options for start-ups and early stage companies. Groups like the Cambridge Innovation Center (CIC) and newcomer WeWorkare growing throughout Boston. The incubator model now extends to corporate users like Constant Contact and eBay that designate space within their own headquarters to accommodate start-ups.
In Boston’s suburbs, the Route 128 corridor has traditionally hosted a large concentration of blue-chip tech companies. With the growing trend of urbanization and an increasingly millennial workforce, suburban markets face strong competition from their urban counterparts. To keep pace with tenant demand, Burlington and Waltham are undergoing rapid transformations. Through exciting mixed-use development and asset repositioning, suburban landlords are rethinking the traditional office park to appeal to an evolving tenant base.
JLL | United States | High-technology Office Outlook | 2014

Boulder | Suburban
Technology firms in Boulder sprawl throughout the submarket, but are traditionally clustered in three geographies: Downtown, Central and East. Large anchor tenants in Boulder, such as IBM and DigitalGlobe, tend to enhance the tech presence rather than overtaking it. Start-ups and established firms alike enjoy the brick-and-timber and creative office spaces, along with traditional office spaces. The presence of the University of Colorado provides a hub for innovation and also contributes to Boulder’s highly educated workforce. Millennials in Boulder tend to gravitate toward Downtown because of the walkable amenities and live-work-play lifestyle. Vacancy in Downtown Boulder sits at 5.3 percent and with only one building under construction, tech company expansion is difficult at present time.
The technology industry in Boulder is growing as existing companies expand and many start-ups pop up throughout the submarket. Independent security intelligence company LogRhythm provides an excellent example of a growing company. In 2012, the company leased 40,000 square feet in Boulder and less than two years later, it is expanding by an additional 20,000 square feet in the same building.
Landlord flexibility remains one of the biggest challenges facing start-ups in Boulder. Landlords are pushing asking rates, especially Downtown where Class A space goes for over $41.00 per square foot, the highest rate in Boulder and Denver combined. Developers continue to plan for Boulder’s growth, which will provide opportunities for both established and emerging companies alike.
Top High-tech submarkets
Downtown Central East
23
Contracting
Stabilizing
Growing late stage
Growing early stage
Mandy SeyfriedResearch Analyst
44.5market score
5665 Flatiron Parkway | EastTenant: SolarWindsSize: 20,575 s.f.Relocation
4780 Pearl East Circle | EastTenant: LogRhythm Size: 20,000 s.f.Expansion in building
3005 Center Green Drive | CentralTenant: Hybris Corp. Size: 10,367 s.f.Relocation and expansion
Top
leas
e tra
nsac
tions
Market scorecardJobs
21,244+1.1%
Annual growth
Venture Capital Cost Office Supply
$22M0.2%
of U.S. high-tech total
$23.34-0.6%Annual growth
7.0%175,755 s.f.
Under construction
High-techEverything else
High-tech employment concentration
38%
3%
34%
4%
2%19%
Computer/Electronic ProductManufacturing
E-Retailers
Computer Systems Design &Related Services
Data Processing, Hosting &Related Services
Other Information Services
Software Publishers
Features and amenities
15.4%
Walkable amenities
Transit Mixed-use Traditional office park
No Some Yes
Near major highway exit
Within 10 miles of major airport
High-tech subsector:Computer/Peripherals
Q2 2014 % of total supply availableAverage asking rent ($ psf)High-tech employees
Anchor tenant:IBM
JLL | United States | High-technology Office Outlook | 2014

Charlotte | Urban & Suburban
Dominated by banking and finance, Charlotte has had to diversify its industry portfolio in order to recover from the recession and better prepare for another economic downturn. One of the industries that Charlotte has focused on recruiting is high-tech, mainly because it is an industry that will continue to thrive in the future.
Charlotte does not house many major high-tech firms, so as a result most of Charlotte’s high-tech workforce is built into the larger corporations that are headquartered here. Charlotte has eight Fortune 500 headquarters located in the region along with numerous others that require significant high-tech support. As banks have become increasingly technologically savvy, Wells Fargo and Bank of America maintain a substantial amount of their back office and high-tech functions in Charlotte. This is also due to the fact that Charlotte is a more affordable place to do business than banking hubs such as New York and San Francisco. As the state continues to dole out incentives for high-tech firms willing to relocate to the region, Charlotte will continue to see relocations like Spectra, a financial services high-tech firm, which is bringing 250 or more jobs to the CBD.
Charlotte has also made progress in developing a start-up culture. This growing sector can be found in innovation hubs such as the Packard Place building in the CBD. Midtown also plays host to a variety of small high-tech start-ups.
Top High-tech submarkets
CBD Midtown University
24
Contracting
Stabilizing
Growing late stage
Growing early stage
Taylor AllisonResearch Analyst
28.5market score
1101 Red Ventures Dr | South CarolinaTenant: Red Ventures (Software Division)Size: 180,000 s.f.Expansion
200 S College St | CBDTenant: AIG (Software Division)Size: 30,000 s.f.Relocation
201 S Tryon St | CBDTenant: ThinkGateSize: 21,210 s.f.Relocation
Top
leas
e tra
nsac
tions
Market scorecardJobs
19,262+4.4%
Annual growth
Venture Capital Cost Office Supply
$00%
of U.S. high-tech total
$22.023.2%Annual growth
17.8%240,000 s.f.
Under construction
High-techEverything else
High-tech employment concentration
16% 1%
1%
42%
34%
3%Computer/Electronic ProductManufacturingElectrical EquipmentManufacturingE-Retailers
Computer Systems Design &Related ServicesData Processing, Hosting &Related ServicesOther Information Services
Software Publishers
Features and amenities
3.7%
Walkable amenities
Transit Mixed-use Traditional office park
No Some Yes
Near major highway exit
Within 10 miles of major airport
High-tech subsector:IT services
Q2 2014 % of total supply availableAverage asking rent ($ psf)High-tech employees
Anchor tenant:None
JLL | United States | High-technology Office Outlook | 2014
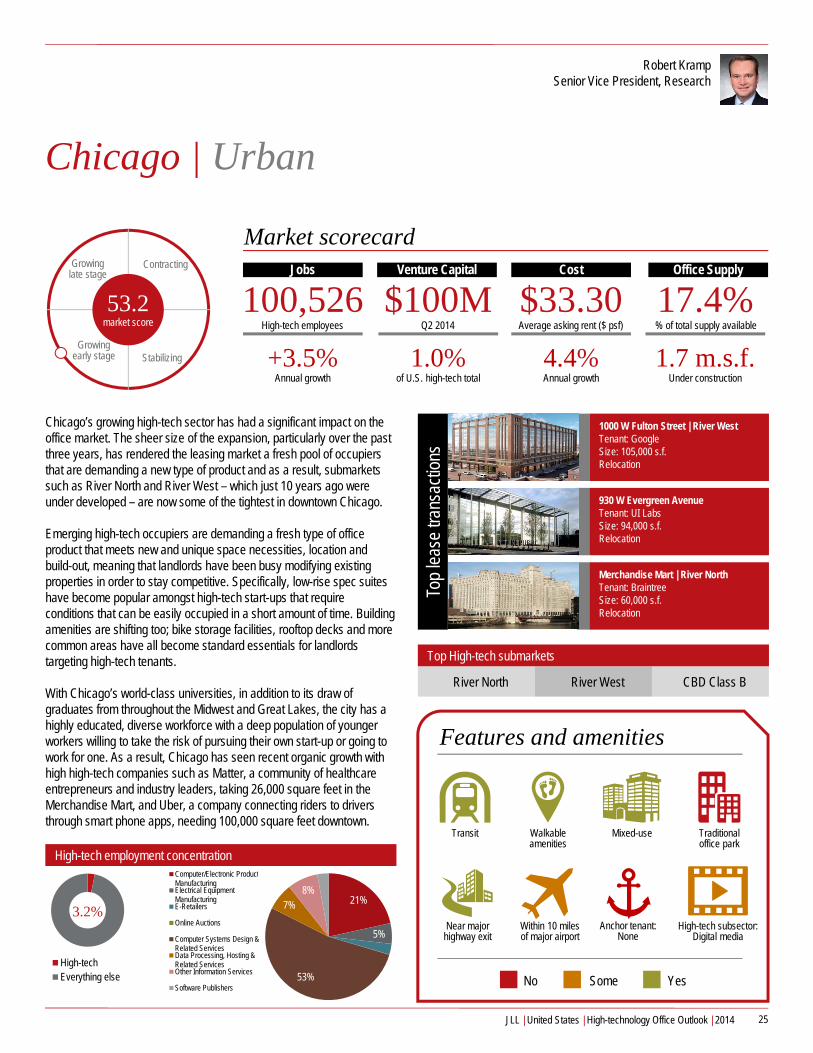
Chicago | Urban
Chicago’s growing high-tech sector has had a significant impact on the office market. The sheer size of the expansion, particularly over the past three years, has rendered the leasing market a fresh pool of occupiers that are demanding a new type of product and as a result, submarkets such as River North and River West – which just 10 years ago were under developed – are now some of the tightest in downtown Chicago.
Emerging high-tech occupiers are demanding a fresh type of office product that meets new and unique space necessities, location and build-out, meaning that landlords have been busy modifying existing properties in order to stay competitive. Specifically, low-rise spec suites have become popular amongst high-tech start-ups that require conditions that can be easily occupied in a short amount of time. Building amenities are shifting too; bike storage facilities, rooftop decks and more common areas have all become standard essentials for landlords targeting high-tech tenants.
With Chicago’s world-class universities, in addition to its draw of graduates from throughout the Midwest and Great Lakes, the city has a highly educated, diverse workforce with a deep population of younger workers willing to take the risk of pursuing their own start-up or going to work for one. As a result, Chicago has seen recent organic growth with high high-tech companies such as Matter, a community of healthcare entrepreneurs and industry leaders, taking 26,000 square feet in the Merchandise Mart, and Uber, a company connecting riders to drivers through smart phone apps, needing 100,000 square feet downtown.
Top High-tech submarkets
River North River West CBD Class B
25
Contracting
Stabilizing
Growing late stage
Growing early stage
Robert KrampSenior Vice President, Research
53.2market score
1000 W Fulton Street | River WestTenant: GoogleSize: 105,000 s.f.Relocation
930 W Evergreen AvenueTenant: UI LabsSize: 94,000 s.f.Relocation
Merchandise Mart | River NorthTenant: BraintreeSize: 60,000 s.f.Relocation
Top
leas
e tra
nsac
tions
Market scorecardJobs
100,526+3.5%
Annual growth
Venture Capital Cost Office Supply
$100M1.0%
of U.S. high-tech total
$33.304.4%Annual growth
17.4%1.7 m.s.f.
Under construction
High-techEverything else
High-tech employment concentration
21%
5%
3%
0%53%
7%8%
3%Computer/Electronic ProductManufacturingElectrical EquipmentManufacturingE-Retailers
Online Auctions
Computer Systems Design &Related ServicesData Processing, Hosting &Related ServicesOther Information Services
Software Publishers
Features and amenities
3.2%
Walkable amenities
Transit Mixed-use Traditional office park
No Some Yes
Near major highway exit
Within 10 miles of major airport
High-tech subsector:Digital media
Q2 2014 % of total supply availableAverage asking rent ($ psf)High-tech employees
Anchor tenant:None
JLL | United States | High-technology Office Outlook | 2014

Dallas | Suburban
Dallas’ high-tech history goes back to the 1951-founding of Texas Instruments, which produced the first commercial microchip. TI, a top-three producer of semiconductors and digital processors globally, is an important anchor in the region. Dallas’ high-tech infrastructure clusters around computing and electronics. Numerous hardware, software, and solutions companies, like Hewlett Packard, McAfee, Cisco, Oracle, CompuCom, Computer Sciences Corp, Intuit, and Microsoft have operations in Dallas. Start-ups also emerge, such as GuideIT, a heath care solutions company started last year by former EDS and Perot System executives with Perot funding, as well as relocations into the region, like Omnitracs covering software solutions for the trucking industry.
Underscoring Dallas’ high-tech role, the region is one of the top-five patent originators in the U.S. Leaders include TI, HP, Cisco, Samsung, Motorola, Raytheon, and Lockheed Martin. AT&T’s 2008 headquarters relocation also set the stage for wireless/mobile to become a driver.
High-tech companies tend to locate in the suburbs to be close to their skilled workforce. Key submarkets include Far North Dallas and the former Telecom Corridor in Plano-Richardson, as well as Las Colinas. Amazon has been enhancing its presence. After opening 2.2 million square feet of distribution space last year, they took significant office space this year.
Continued high-tech growth is forecast due to Dallas’ low cost of doing business, aggressive company recruiting efforts, low cost of living compared to many high-tech markets, and high quality of life.
Top High-tech submarkets
Far North Dallas Richardson - Plano Las Colinas
26
Contracting
Stabilizing
Growing late stage
Growing early stage
Walter BialasVice President, Research
52.7market score
Two Galleria Tower | LBJ FreewayTenant: AmazonSize: 88,600 s.f.New lease
500 E John Carpenter Fwy| Las ColinasTenant: JDA Software Group Size: 53,300 s.f.Relocation
3 Park Central | LBJ FreewayTenant: Myth InnovationsSize: 26,000 s.f.New lease
Top
leas
e tra
nsac
tions
Market scorecardJobs
142,239+3.2%
Annual growth
Venture Capital Cost Office Supply
$85M0.9%
of U.S. high-tech total
$23.006.9%Annual growth
19%4 m.s.f.Under construction
High-techEverything else
High-tech employment concentration
26%
1%1%
2%
48%
4% 10%
8%Computer/ElectronicProduct ManufacturingElectrical EquipmentManufacturingE-Retailers
Online Auctions
Computer Systems Design& Related ServicesData Processing, Hosting &Related ServicesOther Information Services
Software Publishers
Features and amenities
8.0%
Walkable amenities
Transit Mixed-use Traditional office park
No Some Yes
Near major highway exit
Within 10 miles of major airport
High-tech subsector:Electronics/instruments,Mobile, Semiconductor
Q2 2014 % of total supply availableAverage asking rent ($ psf)High-tech employees
Anchor tenants:Texas Instruments,
AT&T, HP
JLL | United States | High-technology Office Outlook | 2014

Denver | Urban & Suburban
Technology firms in Denver are clustered primarily in three geographies. Traditionally, many high-tech tenants have gravitated to the Northwest and Southeast Suburban submarkets, near large anchor tenants such as Oracle and Level 3 Communications. There are a handful of corporate occupiers, however the presence and growth of these companies does not take space away from or minimize growth of start-ups. Technology firms have started to cluster in the CBD and surrounding areas where brick-and-timber and creative office spaces are popping up. Also contributing to technology companies clustering around the CBD is Denver’s highly educated millennial workforce, whose live-work-play mindset is concentrated in and around the CBD, lures many high-tech prospects to the area in order to attract top talent.
The technology industry in Denver is growing as existing companies expand and many start-ups are budding around the metro area. Enterprise-class software and services provider Rally Software is a good example of a growing company. Rally recently opened a new location in the Denver CBD at 1628 16th Street, leasing 21,645 square feet. This adds to Rally’s 65,545-square-foot location in Boulder, plus a proposed 90,000-square-foot building to enable additional growth.
Landlord flexibility remains one the biggest challenges facing start-ups in Denver. Landlords are pushing asking rates and have a strong desire for creditworthy tenants; however, creative and incubator office spaces are being constructed and have provided opportunity for small tech start-ups to put down roots and gain traction in the market.
Top High-tech submarkets
Northwest CBD Southeast Suburban
27
Contracting
Stabilizing
Growing late stage
Growing early stage
Mandy SeyfriedResearch Analyst
46.3market score
1628 16th Street | CBDTenant: Rally Software Size: 21,645 s.f.New lease
8005 S Chester Street | Southeast SuburbanTenant: RingCentralSize: 39,248 s.f.Relocation and expansion
105 Edgeview Drive | NorthwestTenant: AircellSize: 112,000 s.f.Relocation and expansion
Top
leas
e tra
nsac
tions
Market scorecardJobs
48,943+5.8%
Annual growth
Venture Capital Cost Office Supply
$42M0.4%
of U.S. high-tech total
$23.935.7%Annual growth
14.5%1.2 m.s.f.
Under construction
High-techEverything else
High-tech employment concentration
12%1% 3%
0%
56%
12%
4% 12%
Computer/Electronic ProductManufacturingElectrical EquipmentManufacturingE-Retailers
Online Auctions
Computer Systems Design &Related ServicesData Processing, Hosting &Related ServicesOther Information Services
Software Publishers
Features and amenities
4.5%
Walkable amenities
Transit Mixed-use Traditional office park
No Some Yes
Near major highway exit
Within 10 miles of major airport
High-tech subsector:Software
Q2 2014 % of total supply availableAverage asking rent ($ psf)High-tech employees
Anchor tenant:Oracle
JLL | United States | High-technology Office Outlook | 2014

Detroit | Urban & Suburban
As the birthplace of the assembly line, Detroit has long had a high-tech presence, thanks to the region’s automotive industry and concentration of advanced manufacturing. Yet in recent years, the number of high-tech companies in Detroit has been increasing, almost exponentially. The primary force behind this trend is simple: the vehicles of tomorrow will be highly sophisticated technological machines. Take for instance hybrid vehicles, electric motors and self-driving automobiles. Even Google is positioning itself to become a player in the automotive industry with advanced autonomous technologies. Recently, the high-tech giant announced it would launch a Michigan-based fleet of 100 self-driving vehicle prototypes, sans steering wheel and gas and brake pedals, by the end of the summer. Livonia-based Roush Enterprises will assemble the prototypes with parts from several Southeast Michigan suppliers.
Indeed, Detroit has numerous high-tech companies targeting the automotive industry, but the region also has its fair share of traditional high-tech companies focusing on such subsectors as software development and information high-tech services. Arguably the most well-known high-tech company headquartered in Detroit is the Compuware Corporation. In 2013, the software company’s revenue topped $944 million and it employed nearly 4,500 people worldwide. Compuware was one of the first companies to move its headquarters from the suburbs to downtown Detroit in 2003. And since then, downtown Detroit has become something of a high-tech hub, attracting the likes of Amazon, Microsoft, Twitter and Google to the city’s urban core.
Top High-tech submarkets
Downtown Washtenaw North Oakland
28
Contracting
Stabilizing
Growing late stage
Growing early stage
Andrew BatsonSenior Research Analyst
28.5market score
19111 Victor Parkway | N. I-275 Corridor Tenant: STMicroelectronics Size: 21,000 s.f.Relocation
500 S Main Street | Royal OakTenant: VectorformSize: 19,000 s.f.Relocation and expansion
150 W Jefferson Avenue | DowntownTenant: AmazonSize: 13,000 s.f.Relocation and expansion
Top
leas
e tra
nsac
tions
Market scorecardJobs
48,675+1.0%
Annual growth
Venture Capital Cost Office Supply
$00%
of U.S. high-tech total
$22.84-1.4%Annual growth
29%66,000 s.f.
Under construction
High-techEverything else
High-tech employment concentration
14% 2% 1%
0%
65%
6%
4% 8%Computer/Electronic ProductManufacturingElectrical EquipmentManufacturingE-Retailers
Online Auctions
Computer Systems Design &Related ServicesData Processing, Hosting &Related ServicesOther Information Services
Software Publishers
Features and amenities
2.9%
Walkable amenities
Transit Mixed-use Traditional office park
No Some Yes
Near major highway exit
Within 10 miles of major airport
High-tech subsector:Electronics/Instruments
Q2 2014 % of total supply availableAverage asking rent ($ psf)High-tech employees
Anchor tenant:Compuware
JLL | United States | High-technology Office Outlook | 2014

Indianapolis | Urban & Suburban
Clustered in two specific areas within the Indianapolis metro, the CBD and Northwest submarkets, high-tech companies Indianapolis are primarily driven by start-ups with space needs ranging between 5,000 and 25,000 square feet. For example, Lesson.ly, a software start-up that makes it easy to build, share, and track training materials, is adding 74 jobs as it moves from its shared space with TinderBox at 54 Monument Circle and considers larger downtown options.
High-tech firms have been entering the Indianapolis market for a few reasons. The local talent pool is available with nearby universities such as IUPUI, Indiana University, and Purdue University producing graduates in the mathematics and science fields demanded by high-tech companies. In addition, Indiana’s pro-business tax climate being one of the lowest in the U.S. makes it attractive to young companies. While there is significant competition for limited venture capital dollars for start-up companies in Indianapolis, the metro does attract high-tech expansions from established occupiers, as well. Recently, Systems in Motion, a company that specializes in integrated onshore high-tech services, is expanding its operations in Kokomo & Carmel and adding 400 jobs by 2017. The California-based high-tech firm plans to lease up to 25,000 square feet in Kokomo and hire 240 workers, and it will also lease 15,000 square feet in Carmel and add 160 workers.
Top High-tech submarkets
CBD Northwest Keystone
29
Contracting
Stabilizing
Growing late stage
Growing early stage
Ajay PatwariResearch Analyst
35.8market score
7676 Interactive Way | NorthwestTenant: Interactive Intelligence Size: 112,500 s.f.Renewal and expansion
1099 North Meridian St. | CBDTenant: Angie’s ListSize: 90,000 s.f.New lease
451 E. Market St.| CBDTenant: StreetLinksSize: 25,000 s.f.New lease
Top
leas
e tra
nsac
tions
Market scorecardJobs
32,699+4.0%
Annual growth
Venture Capital Cost Office Supply
$6.5M0.1%
of U.S. high-tech total
$17.954.7%Annual growth
16.6%0.13 m.s.f.
Under construction
High-techEverything else
High-tech employment concentration
3%2% 2%0%
60%
8%
5%
20%
Computer/ElectronicProduct ManufacturingElectrical EquipmentManufacturingE-Retailers
Online Auctions
Computer Systems Design& Related ServicesData Processing, Hosting &Related ServicesOther Information Services
Software Publishers
Features and amenities
5.0%
Walkable amenities
Transit Mixed-use Traditional office park
No Some Yes
Near major highway exit
Within 10 miles of major airport
High-tech subsector:Software
Q2 2014 % of total supply availableAverage asking rent ($ psf)High-tech employees
Anchor tenant: Exact Target
JLL | United States | High-technology Office Outlook | 2014

Los Angeles| Suburban
Los Angeles’ high-tech industry is concentrated on the West side of the city, with the beach communities of Santa Monica, Venice and Playa Vista the choice location for the sector. These areas offer a strong amenity base and an attractive lifestyle which remains in-line with the wants and needs of high-tech tenants.
In recent years, high-tech has firmly secured itself as a leading growth industry in the market, translating into increases in headcount and positive demand for office square footage. It is no coincidence that these high-tech heavy micro-markets are some of the tightest in the metro area. As the appetite for creative space grows, emphasis on space utilization and innovative design has emerged. Many firms are now using the office environment as a mechanism to recruit and retain talent.
The positive outlook of the industry has been further bolstered by an increase in M&A activity. Thus far in 2014, Los Angeles has seen roughly nine large scale buyouts, in which traditional high-tech firms like Apple and media firms like Disney have acquired smaller, locally based companies viewed either as competition or complementary industries.
Moving forward, the high-tech sector stands to grow further as high-tech giants from Silicon Valley look to tap into the entertainment talent of Los Angeles and new-media/content-creation demand grows. This projected growth coupled with the current razor-thin vacancy rates in tech-dominated micro-markets have prompted developers to push forward with plans to build which had previously stalled in the proposal phase.
Top High-tech submarkets
Santa MonicaMarina Del Rey/
Culver CityWest LA/
Olympic Corridor
30
Contracting
Stabilizing
Growing late stage
Growing early stage
Devon ParrySenior Research Analyst
44.7market score
2401 Colorado Avenue| Santa MonicaTenant: Edmunds.comSize: 132,000 s.f.New lease
12312 W Olympic | Olympic CorridorTenant: Riot GamesSize: 77,000 s.f.New lease
8680 Hayden Place | Culver CityTenant: Haute LookSize: 59,200 s.f.Relocation
Top
leas
e tra
nsac
tions
Market scorecardJobs
98,311+0.5%
Annual growth
Venture Capital Cost Office Supply
$392M4.1%
of U.S. high-tech total
$44.164.5%Annual growth
14.6%350k s.f.
Under construction
High-techEverything else
High-tech employment concentration
40%
2%7%0%
29%
6%
10%6%
Computer/Electronic ProductManufacturingElectrical EquipmentManufacturingE-Retailers
Online Auctions
Computer Systems Design &Related ServicesData Processing, Hosting &Related ServicesOther Information Services
Software Publishers
Features and amenities
2.8%
Walkable amenities
Transit Mixed-use Traditional office park
No Some Yes
Near major highway exit
Within 10 miles of major airport
High-tech subsector:Media/Entertainment
Q2 2014 % of total supply availableAverage asking rent ($ psf)High-tech employees
Anchor tenant:Google
JLL | United States | High-technology Office Outlook | 2014

Minneapolis – St. Paul | Urban & Suburban
High-tech companies are attracted to Minneapolis-St. Paul because of its highly educated population, exceptional quality of life, innovative spirit, work ethic and high concentration of Fortune 500 companies. While high-tech occupiers have historically been spread out across the Twin Cities in both urban and suburban settings, an increasing number are gravitating to the burgeoning North Loop neighborhood on the outskirts of the Minneapolis CBD, home to a deepening pool of young talent, unique office space, an abundance of amenities and excellent access to transit.
Uptown could also soon become a new hot spot for high-tech companies. Code42 Software Inc., a fast-growing high-tech company, is working on a deal to lease 175,000 square feet of office space at the planned MoZaic East. This move would likely spur an increase in demand for office space by high-tech users in Uptown, an amenity-rich district of Minneapolis popular among millennials, but not a significant high-tech or office market historically.
A number of local high-tech companies are experiencing substantial growth but the lack of sizeable options in developing high-tech districts such as North Loop, Uptown and Northeast Minneapolis presents challenges. Growing high-tech companies desire space that works well for today and offers flexibility within a building to scale quickly. Potential conversion and development opportunities do exist in these areas, but fast-growing high-tech companies oftentimes need “ready to go” space now rather than later.
Top High-tech submarkets
Minneapolis CBD Southwest West
31
Contracting
Stabilizing
Growing late stage
Growing early stage
Abel BalwierzSenior Research Analyst
36.0market score
380 St. Peter St. | St. Paul CBDTenant: InforSize: 142,000 p.s.f.Renewal and rightsizing
510 Marquette | Minneapolis CBDTenant: RedBrick HealthSize: 46,000 p.s.f.Relocation and expansion
300 First Avenue N | Minneapolis CBDTenant: OptiMine SoftwareSize: 16,000 p.s.f.Relocation and expansion
Top
leas
e tra
nsac
tions
Market scorecardJobs
74,904+0.6%
Annual growth
Venture Capital Cost Office Supply
$19M0.2%
of U.S. high-tech total
$24.320.8%Annual growth
17.2%0 m.s.f.
Under construction
High-techEverything else
High-tech employment concentration
46%
2%0%0%
35%
8%
2% 7%Computer/ElectronicProduct ManufacturingElectrical EquipmentManufacturingE-Retailers
Online Auctions
Computer Systems Design& Related ServicesData Processing, Hosting &Related ServicesOther Information Services
Software Publishers
Features and amenities
5.3%
Walkable amenities
Transit Mixed-use Traditional office park
No Some Yes
Near major highway exit
Within 10 miles of major airport
High-tech subsector:Software
Q2 2014 % of total supply availableAverage asking rent ($ psf)High-tech employees
Anchor tenant:None
JLL | United States | High-technology Office Outlook | 2014

New Jersey | Suburban
The high-tech industry remains an integral driver of growth for the New Jersey economy and the commercial real estate market. More than 20.0 percent of the office leases completed during the first half of 2014 involved high-tech companies. This represented the second largest share of demand after life-sciences companies, which accounted for one-quarter of transactions. Proximity to New York, a transportation system that includes several stations along Amtrak’s Northeast Corridor rail line and access to Newark Liberty International Airport have helped Garden State high-tech companies reach the global marketplace. The skilled workforce sought by today’s companies is continually replenished by a pipeline of graduates from the state’s colleges and universities. Collaborative partnerships between educational institutions and the high-tech industry will help foster continued expansion in the years ahead.
New Jersey’s use of economic incentives tools is creating opportunities for high-tech companies to remain here or consider relocating their operations to the state. After being awarded a $3.2 million Grow New Jersey grant, Marathon Data Systems leased 22,000 square feet for its new headquarters at 3600 Route 66 in Neptune rather than moving to Boston. Mass transit-centric submarkets also remain on the radar screen of high-tech companies. Competitive rents for Class A space in proximity to New York and economic incentives encouraged Forbes Media and Thomson Reuters to expand in the Hudson Waterfront. In New Brunswick, a 1.5 million-square-foot mixed-use project containing office/R&D, retail and residential components is planned for a site adjacent to the train station and near Rutgers University.
Top High-tech submarkets
Hudson Waterfront Metropark Princeton
32
Contracting
Stabilizing
Growing late stage
Growing early stage
Stephen JencoVice President, Research
36.0market score
499 Washington Boulevard| Hudson WaterfrontTenant: Forbes MediaSize: 92,720 s.f.New lease
300 Kimball Dr | ParsippanyTenant: FiservSize: 78,470 s.f.New lease
3600 Rt 66 | MonmouthTenant: Marathon Data SystemsSize: 22,000 s.f.New lease
Top
leas
e tra
nsac
tions
Market scorecardJobs
32,699+4.0%
Annual growth
Venture Capital Cost Office Supply
$6.5M0.1%
of U.S. high-tech total
$25.222.6%Annual growth
25.0%1.7 m.s.f.
Under construction
High-techEverything else
High-tech employment concentration
3%2% 2%0%
60%
8%
5%
20%
Computer/ElectronicProduct ManufacturingElectrical EquipmentManufacturingE-Retailers
Online Auctions
Computer Systems Design& Related ServicesData Processing, Hosting &Related ServicesOther Information Services
Software Publishers
Features and amenities
5.0%
Walkable amenities
Transit Mixed-use Traditional office park
No Some Yes
Near major highway exit
Within 10 miles of major airport
High-tech subsector:Business & Consumer
Products/Svcs.
Q2 2014 % of total supply availableAverage asking rent ($ psf)High-tech employees
Anchor tenant:None
JLL | United States | High-technology Office Outlook | 2014

New York | Urban
New York City has flourished as a hotbed for high-tech start-ups and established international high-tech firms in recent years. With considerable support from the state and local government, the city has built a reputation as a high-tech incubator with world-class offerings. New York provides direct access to capital as a global financial leader, in addition to a deep talent pool, both crucial in start-up culture. In Midtown South, the preferred high-tech hub, tenants are attracted to vibrant workspaces, state-of-the-art amenities and a strong public transportation system that easily extends to all corners of the city. A live-work-play environment, supported by a rich cultural and arts scene—has also contributed to the location’s allure.
The high-tech sector is increasingly proving to be a key economic driver for the city, generating substantial job growth, rising wages, and surges in office leasing activity. By mid-year 2014, high-tech tenants had committed to more than 2.6 million square feet of Manhattan office space, second only to financial services, historically the leader in office use.
Tech’s wild success, has come at a cost to tenants. Overall asking rents in Midtown South are at a record high, and the number of available large blocks has been halved since the beginning of 2013. Consequently, some tenants are unable to find space to suit their needs or are being priced out. However, this has created a unique opportunity for the more affordable outer boroughs of New York, especially in Brooklyn’s high-tech Triangle, an emerging, robust high-tech community already home to more than 500 creative firms..
Top High-tech submarkets
Greenwich Village Chelsea SoHo
33
Contracting
Stabilizing
Growing late stage
Growing early stage
Tiffany RamsayResearch Analyst
58.7market score
11 Madison Avenue | Gramercy ParkTenant: SonySize: 506,476 s.f.New lease
117 Adams/55 Prospect Street | DumboTenant: EtsySize: 198,500 s.f.New lease
11 Madison Avenue | Gramercy ParkTenant: YelpSize: 152,232 s.f.New lease
Top
leas
e tra
nsac
tions
Market scorecardJobs
90,4948.4%Annual growth
Venture Capital Cost Office Supply
$882M9.2%
of U.S. high-tech total
$64.576.4%Annual growth
10.6%5.4 m.s.f.
Under construction
High-techEverything else
High-tech employment concentration
1%8%
0%
59%
5%
25%
2%Computer/ElectronicProduct ManufacturingE-Retailers
Online Auctions
Computer Systems Design& Related ServicesData Processing, Hosting &Related ServicesOther Information Services
Software Publishers
Features and amenities
4%
Walkable amenities
Transit Mixed-use Traditional office park
No Some Yes
Near major highway exit
Within 10 miles of major airport
High-tech subsector:Digital media
Q2 2014 % of total supply availableAverage asking rent ($ psf)High-tech employees
Anchor tenant:Google
JLL | United States | High-technology Office Outlook | 2014
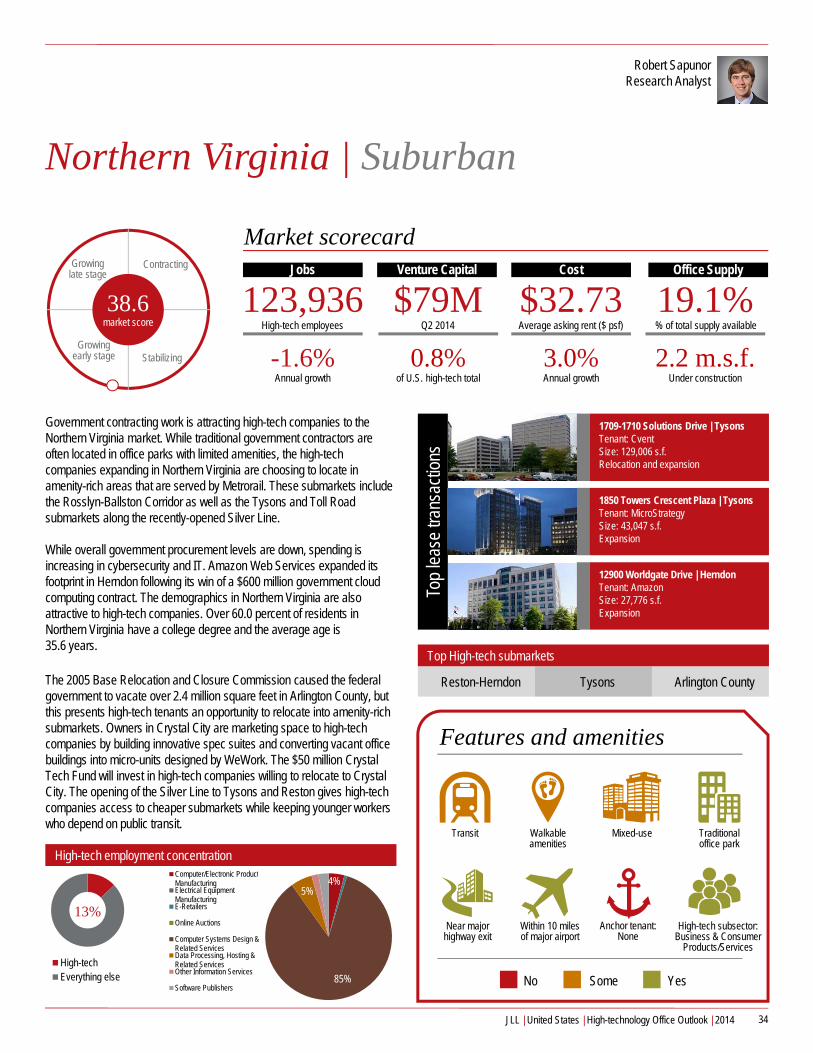
Northern Virginia | Suburban
Government contracting work is attracting high-tech companies to the Northern Virginia market. While traditional government contractors are often located in office parks with limited amenities, the high-tech companies expanding in Northern Virginia are choosing to locate in amenity-rich areas that are served by Metrorail. These submarkets include the Rosslyn-Ballston Corridor as well as the Tysons and Toll Road submarkets along the recently-opened Silver Line.
While overall government procurement levels are down, spending is increasing in cybersecurity and IT. Amazon Web Services expanded its footprint in Herndon following its win of a $600 million government cloud computing contract. The demographics in Northern Virginia are also attractive to high-tech companies. Over 60.0 percent of residents in Northern Virginia have a college degree and the average age is 35.6 years.
The 2005 Base Relocation and Closure Commission caused the federal government to vacate over 2.4 million square feet in Arlington County, but this presents high-tech tenants an opportunity to relocate into amenity-rich submarkets. Owners in Crystal City are marketing space to high-tech companies by building innovative spec suites and converting vacant office buildings into micro-units designed by WeWork. The $50 million Crystal Tech Fund will invest in high-tech companies willing to relocate to Crystal City. The opening of the Silver Line to Tysons and Reston gives high-tech companies access to cheaper submarkets while keeping younger workers who depend on public transit.
Top High-tech submarkets
Reston-Herndon Tysons Arlington County
34
Contracting
Stabilizing
Growing late stage
Growing early stage
Robert SapunorResearch Analyst
38.6market score
1709-1710 Solutions Drive | TysonsTenant: CventSize: 129,006 s.f.Relocation and expansion
1850 Towers Crescent Plaza | TysonsTenant: MicroStrategy Size: 43,047 s.f.Expansion
12900 Worldgate Drive | HerndonTenant: Amazon Size: 27,776 s.f.Expansion
Top
leas
e tra
nsac
tions
Market scorecardJobs
123,936-1.6%Annual growth
Venture Capital Cost Office Supply
$79M0.8%
of U.S. high-tech total
$32.733.0%Annual growth
19.1%2.2 m.s.f.
Under construction
High-techEverything else
High-tech employment concentration
4% 0%0%
85%
5%2%3%
Computer/Electronic ProductManufacturingElectrical EquipmentManufacturingE-Retailers
Online Auctions
Computer Systems Design &Related ServicesData Processing, Hosting &Related ServicesOther Information Services
Software Publishers
Features and amenities
13%
Walkable amenities
Transit Mixed-use Traditional office park
No Some Yes
Near major highway exit
Within 10 miles of major airport
High-tech subsector:Business & Consumer
Products/Services
Q2 2014 % of total supply availableAverage asking rent ($ psf)High-tech employees
Anchor tenant:None
JLL | United States | High-technology Office Outlook | 2014

Oakland-East Bay | Urban & Suburban
With close proximity to two of the strongest high-tech markets, the Oakland-East Bay has the advantage of access to the top high-tech labor pool, offers lower rental rates for office space, and high quality of life and livability for employees. In addition, it is home to three national labs and a world-class university, UC Berkeley. High-tech tenants within the urban and suburban market are primarily in the software, cloud computing, IT services, and green and clean high-tech subsectors. Oakland is the urban high-tech cluster for the market while Berkeley and the East Bay are the suburban clusters. Within the East Bay, high-tech tenants are drawn to the Tri-Valley region, San Ramon, Dublin, and Pleasanton.
The Tri-Valley is dominated by large corporate users in these submarkets, such as: GE Global Software HQ, Veeva Systems and Workday, all of which are software and cloud computing companies. With access to public transportation, the live-play-work environment for employees, affordable housing, and great weather, local companies are able to attract top talent. Over the past year, the trend to revitalize office parks with more retail, housing, and on-site amenities began in the Tri-Valley to attract more high-tech giants to the region.
Oakland draws high-tech tenants that are being priced out of San Francisco and want a cheaper cost of doing business, access to public transportation, and an urban atmosphere. The history of high-tech in Oakland is not long with only two notable high-tech giants, Pandora Media Inc. and Ask.com. Due to its short history, Oakland is positioning itself as the “New Brooklyn” for start-ups and creates the sense of entrepreneurial community with the rise of incubator space.
Top High-tech submarkets
Oakland-CBD Tri-Valley Berkeley
35
Contracting
Stabilizing
Growing late stage
Growing early stage
Hailey HarringtonResearch Analyst
57.0market score
4420 Rosewood Drive | Pleasanton-NTenant: Ellie MaeSize: 105,000 s.f.Relocation and expansion
555 12th Street | Oakland-CBDTenant: Ask.comSize: 24,000 s.f.Renewal
1999 Harrison Street | Oakland-CBDTenant: Self Aware Games Size: 21,000 s.f.New lease
Top
leas
e tra
nsac
tions
Market scorecardJobs
48,223+3.9%
Annual growth
Venture Capital Cost Office Supply
$194M2.0%
of U.S. high-tech total
$27.367.5%Annual growth
15.3%0 s.f.
Under construction
High-techEverything else
High-tech employment concentration
37%
1%3% 0%
49%
1%3% 6%Computer/ElectronicProduct ManufacturingElectrical EquipmentManufacturingE-Retailers
Online Auctions
Computer Systems Design& Related ServicesData Processing, Hosting &Related ServicesOther Information Services
Software Publishers
Features and amenities
6%
Walkable amenities
Transit Mixed-use Traditional office park
No Some Yes
Near major highway exit
Within 10 miles of major airport
High-tech subsector:Electronics/instruments
Q2 2014 % of total supply availableAverage asking rent ($ psf)High-tech employees
Anchor tenant:None
JLL | United States | High-technology Office Outlook | 2014

Orange County | Suburban
The high-tech market in Orange County has traditionally been characterized by a dominance of computer hardware manufacturers (i.e. semiconductor, memory chip, and hard drive producers). This is balanced today by a growing cadre of newer, modern high-tech companies like Google, Amazon, and Blizzard Entertainment, who have recently grown their presence in Orange County. What these firms have in common is the desire to tap into the market’s skilled labor force and entrepreneurial talent. If this trend continues, Orange County could emerge as a new hot spot for high-tech firms, much like San Diego.
With this highly-skilled and youthful labor force, Orange County is seen by more high-tech companies as a place to recruit top talent. The most recent example of this trend is Google’s deal to move its Irvine location into a new build-to-suit facility. The new building is anticipated to be a tool to help recruit talent from the University of California, Irvine and other local universities. Amazon also expanded its software development operations in South County. Overall, the active lifestyle, quality of life, and proximity to the Los Angeles and San Diego markets are appealing factors to high-tech companies in Orange County.
With a growing demand for “creative” space being leased at a significant premium over traditional office space, someof the biggest challenges that the Orange County market faces are the steadily increasing rental rates and diminishing availability of office space options. As rates continue to rise and availabilities dwindle, some of the price sensitive high-tech firms may look to other markets, leaving Orange County behind.
Top High-tech submarkets
Irvine Newport Beach Irvine Spectrum
36
Contracting
Stabilizing
Growing late stage
Growing early stage
Ryan PiresResearch Analyst
31.1market score
19510 Jamboree Road | Airport AreaTenant: GoogleSize: 80,000 s.f.Build-to-suit
100 Avenida La Plata | South CountyTenant: DealerSocketSize: 44,000 s.f.New lease
9 Pasteur | Airport AreaTenant: Backbone EntertainmentSize: 22,000 s.f.New lease
Top
leas
e tra
nsac
tions
Market scorecardJobs
63,070+0.0%
Annual growth
Venture Capital Cost Office Supply
$57M0.6%
of U.S. high-tech total
$23.875.2%Annual growth
18.3%643,541 s.f.
Under construction
High-techEverything else
High-tech employment concentration
52%
3%
29%
3% 3% 8%Computer/ElectronicProduct ManufacturingElectrical EquipmentManufacturingE-Retailers
Online Auctions
Computer Systems Design& Related ServicesData Processing, Hosting &Related ServicesOther Information Services
Software Publishers
Features and amenities
4.8%
Walkable amenities
Transit Mixed-use Traditional office park
No Some Yes
Near major highway exit
Within 10 miles of major airport
High-tech subsector:Software
Q2 2014 % of total supply availableAverage asking rent ($ psf)High-tech employees
Anchor tenant:None
JLL | United States | High-technology Office Outlook | 2014
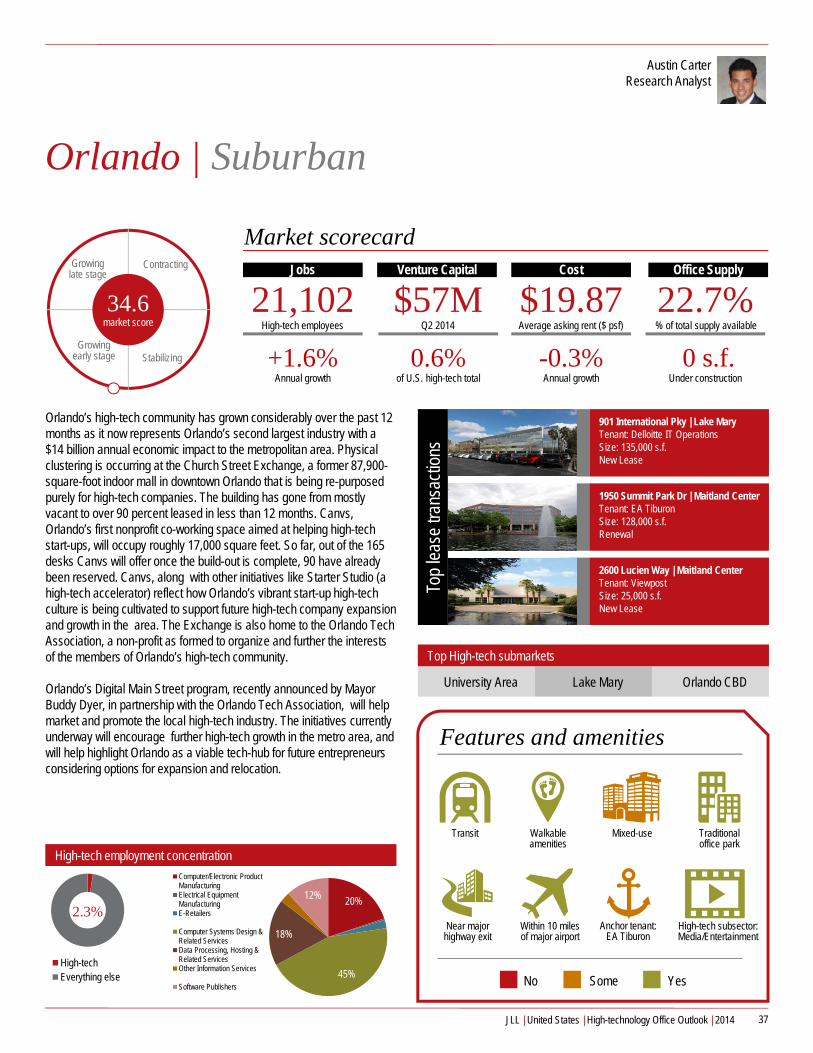
Orlando | Suburban
Orlando’s high-tech community has grown considerably over the past 12 months as it now represents Orlando’s second largest industry with a $14 billion annual economic impact to the metropolitan area. Physical clustering is occurring at the Church Street Exchange, a former 87,900-square-foot indoor mall in downtown Orlando that is being re-purposed purely for high-tech companies. The building has gone from mostly vacant to over 90 percent leased in less than 12 months. Canvs, Orlando’s first nonprofit co-working space aimed at helping high-tech start-ups, will occupy roughly 17,000 square feet. So far, out of the 165 desks Canvs will offer once the build-out is complete, 90 have already been reserved. Canvs, along with other initiatives like Starter Studio (a high-tech accelerator) reflect how Orlando’s vibrant start-up high-tech culture is being cultivated to support future high-tech company expansion and growth in the area. The Exchange is also home to the Orlando Tech Association, a non-profit as formed to organize and further the interests of the members of Orlando’s high-tech community.
Orlando’s Digital Main Street program, recently announced by Mayor Buddy Dyer, in partnership with the Orlando Tech Association, will help market and promote the local high-tech industry. The initiatives currently underway will encourage further high-tech growth in the metro area, and will help highlight Orlando as a viable tech-hub for future entrepreneurs considering options for expansion and relocation.
Top High-tech submarkets
University Area Lake Mary Orlando CBD
37
Contracting
Stabilizing
Growing late stage
Growing early stage
Austin CarterResearch Analyst
34.6market score
901 International Pky | Lake MaryTenant: Delloitte IT Operations Size: 135,000 s.f.New Lease
1950 Summit Park Dr | Maitland CenterTenant: EA TiburonSize: 128,000 s.f.Renewal
2600 Lucien Way | Maitland CenterTenant: ViewpostSize: 25,000 s.f.New Lease
Top
leas
e tra
nsac
tions
Market scorecardJobs
21,102+1.6%
Annual growth
Venture Capital Cost Office Supply
$57M0.6%
of U.S. high-tech total
$19.87-0.3%Annual growth
22.7%0 s.f.
Under construction
High-techEverything else
High-tech employment concentration
20% 2%
45%
18%
3%12%
Computer/Electronic ProductManufacturingElectrical EquipmentManufacturingE-Retailers
Computer Systems Design &Related ServicesData Processing, Hosting &Related ServicesOther Information Services
Software Publishers
Features and amenities
2.3%
Walkable amenities
Transit Mixed-use Traditional office park
No Some Yes
Near major highway exit
Within 10 miles of major airport
High-tech subsector:Media/Entertainment
Q2 2014 % of total supply availableAverage asking rent ($ psf)High-tech employees
Anchor tenant:EA Tiburon
JLL | United States | High-technology Office Outlook | 2014

Philadelphia | Urban & Suburban
The high-tech industry will soon be changing Philadelphia’s skyline and economic future as media conglomerate Comcast Corporation announced a joint venture to build the $1.2 billion Comcast Innovation and Technology Center. The mixed-used project will create a world-class media, high-tech and innovation center housing Comcast’s growing workforce of technologists, engineers and software architects. Comcast will lease 75 percent of the rentable office space (957,000 square feet) for 20 years. The remaining office space is dedicated to highly flexible, loft-like studios and spaces for research and development of start-up high-tech companies. The construction will create $2.75 billion in economic activity and will create 20,000 temporary jobs from the project’s start in summer 2014 until completion in the fall of 2017. Upon completion, the project will create 2,800 permanent jobs, and annual tax revenue of $21.5 million for the city and another $30.7 million for the state.. Led by schools like University of Pennsylvania’s School of Engineering and Applied Science and Drexel’s College of Engineering, high-tech companies are attracted to Philadelphia young talent and venture capital that want to remain in the city. The creation of the Innovation and Technology Center will drive job growth for the next generation of Philadelphia’s top talent in media, high-tech and commerce.
The private and public funds that have facilitated positive momentum have also created new obstacle for Philadelphia as successful start-up high-tech companies leave the area for more capital and more established high-tech markets. In the future, Philadelphia will need to find new ways to better retain and develop start-up high-tech companies.
Top High-tech submarkets
Philadelphia CBD Route 202 CorridorMt. Laurel / Marlton /
Moorestown
38
Contracting
Stabilizing
Growing late stage
Growing early stage
Geoff WrightSenior Research Analyst
47.6market score
Comcast Innovation and high-tech Center | Philadelphia CBDTenant: Comcast Corporation Size: 1,500,000 s.f.Built-to-Suit, mixed-use project
8000 Lincoln Drive | Mt. Laurel / Marlton / MoorestownTenant: Computer Science Corporation Size: 36,830 s.f.Renewal
CrossPoint at Valley Forge | Route 202 CorridorTenant: ABC Corporation Size: 100,000 s.f.Renewal and expansion
Top
leas
e tra
nsac
tions
Market scorecardJobs
35,435+1.0%
Annual growth
Venture Capital Cost Office Supply
$22M0.2%
of U.S. high-tech total
$25.084.2%Annual growth
15.6%3.8 m.s.f.
Under construction
High-techEverything else
High-tech employment concentration
20%
1% 1%
62%
9%
2% 5%Computer/Electronic ProductManufacturingElectrical EquipmentManufacturingE-Retailers
Computer Systems Design &Related ServicesData Processing, Hosting &Related ServicesOther Information Services
Software Publishers
Features and amenities
5.5%
Walkable amenities
Transit Mixed-use Traditional office park
No Some Yes
Near major highway exit
Within 10 miles of major airport
High-tech subsector:Media/Entertainment
Q2 2014 % of total supply availableAverage asking rent ($ psf)High-tech employees
Anchor tenant:Comcast
JLL | United States | High-technology Office Outlook | 2014

Phoenix | Suburban
Phoenix is an emerging technology market with a healthy mix of both large and small technology companies focused primarily in the Southeast Valley. A youthful, educated workforce has helped attract well-established manufacturing firms to the Valley like Intel, Honeywell, ON Semiconductor, and recently, Apple. With local business incentives to grow, companies like GoDaddy, JDA Software, Infusionsoft, and LifeLock are also taking advantage of the Phoenix area. Workshops, grants, and other resources are offered by local municipal governments and state universities in support of entrepreneurial tech companies as Phoenix positions itself as an affordable alternative to other markets.
Many public and private entities have been working hard to provide start-ups with the right environment and resources for success. One of the most successful examples in Phoenix, Arizona State University’s SkySong project is designed to help companies grow by providing business services and programs such as new technologies, capital networks, business education, and a skilled workforce. As the project continues to grow, more technology-oriented occupiers will join the many companies that currently reside in SkySong.
Smaller companies and start-ups are recruiting their talent primarily from regional sources like Arizona State University, the University of Arizona, and other local colleges. Companies such as Silicon Valley Bank and Insight Enterprises have announced their recent plans to expand and will be creating hundreds of new jobs.
Top High-tech submarkets
Tempe Chandler South Scottsdale
39
Contracting
Stabilizing
Growing late stage
Growing early stage
Kiana CoxResearch Analyst
40.2market score
4301 N Scottsdale Rd | South ScottsdaleTenant: WeeblySize: 25,057 s.f.New lease
7410 S Roosevelt St | TempeTenant: Consumer Cellular Size: 86,000 s.f.Expansion
6811 E Mayo Blvd| Scottsdale AirparkTenant: AxwaySize: 46,400 s.f.Renewal
Top
leas
e tra
nsac
tions
Market scorecardJobs
68,082+4.4%
Annual growth
Venture Capital Cost Office Supply
$43M0.5%
of U.S. high-tech total
$21.113.2%Annual growth
26%2.3 m.s.f.
Under construction
High-techEverything else
High-tech employment concentration
48%
1%6%0%
29%
11%
3% 2%Computer/Electronic ProductManufacturingElectrical EquipmentManufacturingE-Retailers
Online Auctions
Computer Systems Design &Related ServicesData Processing, Hosting &Related ServicesOther Information Services
Software Publishers
Features and amenities
4.5%
Walkable amenities
Transit Mixed-use Traditional office park
No Some Yes
Near major highway exit
Within 10 miles of major airport
High-tech subsector:Semiconductor
Q2 2014 % of total supply availableAverage asking rent ($ psf)High-tech employees
Anchor tenant:Intel
Matt KolanoResearch Analyst
JLL | United States | High-technology Office Outlook | 2014
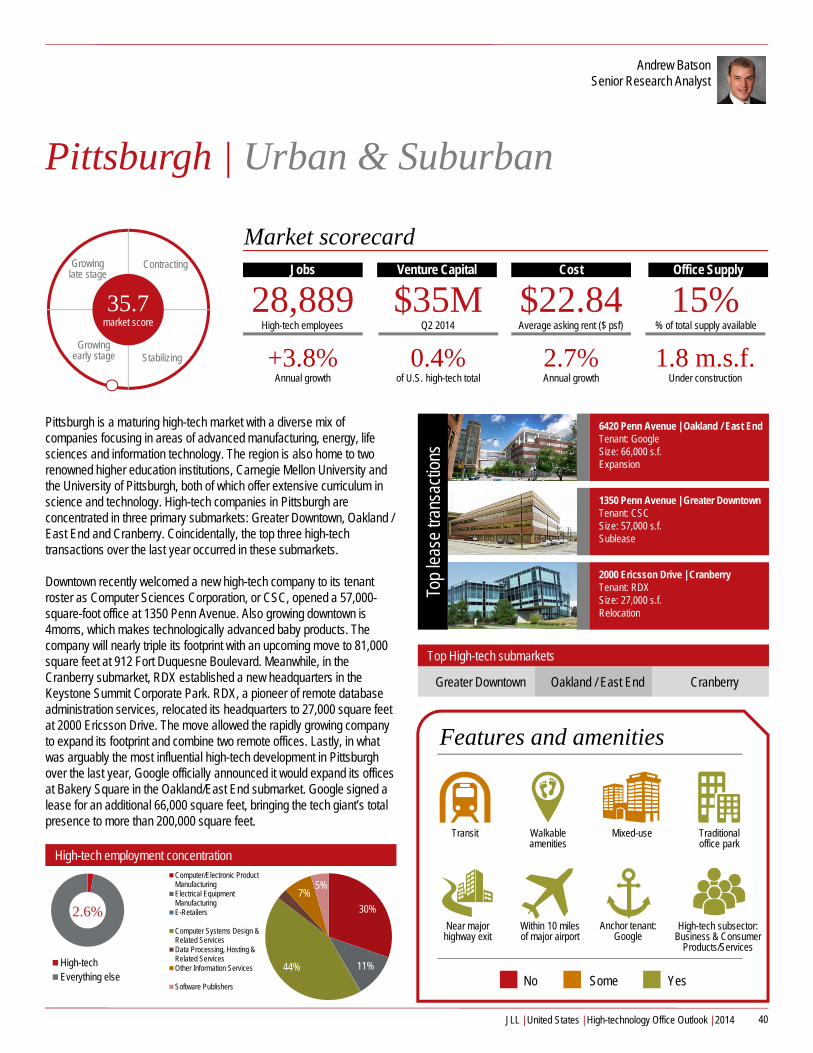
Pittsburgh | Urban & Suburban
Pittsburgh is a maturing high-tech market with a diverse mix of companies focusing in areas of advanced manufacturing, energy, life sciences and information technology. The region is also home to two renowned higher education institutions, Carnegie Mellon University and the University of Pittsburgh, both of which offer extensive curriculum in science and technology. High-tech companies in Pittsburgh are concentrated in three primary submarkets: Greater Downtown, Oakland / East End and Cranberry. Coincidentally, the top three high-tech transactions over the last year occurred in these submarkets.
Downtown recently welcomed a new high-tech company to its tenant roster as Computer Sciences Corporation, or CSC, opened a 57,000-square-foot office at 1350 Penn Avenue. Also growing downtown is 4moms, which makes technologically advanced baby products. The company will nearly triple its footprint with an upcoming move to 81,000 square feet at 912 Fort Duquesne Boulevard. Meanwhile, in the Cranberry submarket, RDX established a new headquarters in the Keystone Summit Corporate Park. RDX, a pioneer of remote database administration services, relocated its headquarters to 27,000 square feet at 2000 Ericsson Drive. The move allowed the rapidly growing company to expand its footprint and combine two remote offices. Lastly, in what was arguably the most influential high-tech development in Pittsburgh over the last year, Google officially announced it would expand its offices at Bakery Square in the Oakland/East End submarket. Google signed a lease for an additional 66,000 square feet, bringing the tech giant’s total presence to more than 200,000 square feet.
Top High-tech submarkets
Greater Downtown Oakland / East End Cranberry
40
Contracting
Stabilizing
Growing late stage
Growing early stage
Andrew BatsonSenior Research Analyst
35.7market score
6420 Penn Avenue | Oakland / East EndTenant: GoogleSize: 66,000 s.f.Expansion
1350 Penn Avenue | Greater DowntownTenant: CSCSize: 57,000 s.f.Sublease
2000 Ericsson Drive | CranberryTenant: RDXSize: 27,000 s.f.Relocation
Top
leas
e tra
nsac
tions
Market scorecardJobs
28,889+3.8%
Annual growth
Venture Capital Cost Office Supply
$35M0.4%
of U.S. high-tech total
$22.842.7%Annual growth
15%1.8 m.s.f.
Under construction
High-techEverything else
High-tech employment concentration
30%
11%44%
3%7%
5%Computer/Electronic ProductManufacturingElectrical EquipmentManufacturingE-Retailers
Computer Systems Design &Related ServicesData Processing, Hosting &Related ServicesOther Information Services
Software Publishers
Features and amenities
2.6%
Walkable amenities
Transit Mixed-use Traditional office park
No Some Yes
Near major highway exit
Within 10 miles of major airport
High-tech subsector:Business & Consumer
Products/Services
Q2 2014 % of total supply availableAverage asking rent ($ psf)High-tech employees
Anchor tenant:Google
JLL | United States | High-technology Office Outlook | 2014

Portland | Urban & Suburban
The high-tech market in Portland is dominated by two major forces: quickly expanding small to mid-size high-tech service firms who are clustering in the central city, and electronics manufacturing firms, generally located in the Sunset Corridor; the latter is led by Intel, the region's largest employer. With more than 17,500 employees in the Portland region, representing their largest U.S. presence in any state, Intel’s commitment to Oregon is significant and recently underscored by their $6 billion+ investment in two new research labs in the area.
Driven by the area’s growing high-tech talent pool, competitive high-tech wages, reasonable cost of living and low cost of doing business, Portland has seen a sharp increase in leasing activity from high-tech service firms. Local expansions have come in many forms including organic growth from Portland companies, acquisition-hires, firms seeking to establish a Portland beachhead, and those expanding their local footprint. Strong demand from high-tech firms has had a significant impact on the Portland office market as occupiers jockey for the best creative spaces with the right amenity set, while landlords improve their offerings to appeal to high-tech firms focused on talent retention and recruitment. Rental rates have escalated rapidly in the CBD, with Class A rates up over eight percent in the past year, while opportunities for medium to large blocks of space are limited. The Close In Eastside has emerged as a more economic option for smaller start-up and entrepreneurial firms as residential and retail development activity has taken off in the area. Securing space for growth will be a challenge for high-tech firms in the near term, but development and redevelopment activity has ramped up significantly and options will be delivering to the market in the next 24 months.
Top High-tech submarkets
CBD Sunset Corridor Close In Eastside
41
Contracting
Stabilizing
Growing late stage
Growing early stage
Patricia RaichtVice President, Research
53.8market score
US Bancorp Tower | CBDTenant: New RelicSize: 82,229 s.f.Expansion and extension
Rock Creek Center | Sunset CorridorTenant: Fiserv SolutionsSize: 77,226 s.f.Renewal
Block 300 | CBD Tenant: Puppet LabsSize: 74,784 s.f.Relocation and expansion
Top
leas
e tra
nsac
tions
Market scorecardJobs
58,861+3.6%
Annual growth
Venture Capital Cost Office Supply
$53M0.6%
of U.S. high-tech total
$21.874.8%Annual growth
13.5%650k s.f.
Under construction
High-techEverything else
High-tech employment concentration
60%
1%3%
19%
5%1%
11%
Computer/Electronic ProductManufacturingElectrical EquipmentManufacturingE-Retailers
Computer Systems Design &Related ServicesData Processing, Hosting &Related ServicesOther Information Services
Software Publishers
Features and amenities
6.6%
Walkable amenities
Transit Mixed-use Traditional office park
No Some Yes
Near major highway exit
Within 10 miles of major airport
High-tech subsector:Semiconductor
Q2 2014 % of total supply availableAverage asking rent ($ psf)High-tech employees
Anchor tenant:Intel
JLL | United States | High-technology Office Outlook | 2014

Raleigh-Durham | Suburban
Considered to be one of the major innovation hubs in the U.S., Raleigh-Durham continues to attract high-tech firms. The availability of affordable vacant land, lower real estate prices and a huge pool of talent from the three major universities (UNC Chapel Hill, Duke University and NCSU) makes this region attractive to big and start-up high-tech employers.
The RTP / RDU submarket is home to firms like IBM, Cisco, NetApp and Lenovo. Earlier this year, The Research Triangle Foundation, a non-profit organization responsible for building the Research Triangle Park (RTP), announced its acquisition of approximately 100 acres for $17 million. The Foundation plans to create a mixed-use development, called the Park Center that will aim at making the area flexible to respond quickly to the ever-changing office needs.
Lenovo signed one of the largest leases in the Triangle’s history totaling 450,000 square feet at the former Sony Ericsson campus in the RTP. Meanwhile, the Triangle's CBDs are the new hub for a burgeoning population of high-tech entrepreneurs and start-ups. In the past year, American Underground, an entrepreneurial co-working space for start-ups, has doubled its office footprint in Downtown Durham, expanding to Downtown Raleigh and was named a “Google for entrepreneurs high-tech hub.”
Going forward, as high-tech firms hire more millennials in the Triangle, expect the office landscape to change as landlords work toward modernizing their facilities to accommodate this new tech-savvy workforce.
Top High-tech submarkets
RTP / RDU Cary West Raleigh
42
Contracting
Stabilizing
Growing late stage
Growing early stage
Mehtab RandhawaResearch Manager
40.7market score
7001 Development Drive | RTP / RDUTenant: Lenovo Size: 450,000 s.f.Relocation and expansion
901 Main Campus Drive | West RaleighTenant: ABB Size: 94,000 s.f.Relocation and expansion
3020 Carrington Mill Blvd | RTP / RDUTenant: SciQuestSize: 78,565 s.f.Relocation and expansion
Top
leas
e tra
nsac
tions
Market scorecardJobs
52,147+2.8%
Annual growth
Venture Capital Cost Office Supply
$9.2M0.1%
of U.S. high-tech total
$20.406.0%Annual growth
17.7%1.3 m.s.f.
Under construction
High-techEverything else
High-tech employment concentration
40%
4%1%
35%
3%2% 15%
Computer/ElectronicProduct ManufacturingElectrical EquipmentManufacturingE-Retailers
Computer Systems Design& Related ServicesData Processing, Hosting &Related ServicesOther Information Services
Software Publishers
Features and amenities
8.0%
Walkable amenities
Transit Mixed-use Traditional office park
No Some Yes
Near major highway exit
Within 10 miles of major airport
Q2 2014 % of total supply availableAverage asking rent ($ psf)High-tech employees
High-tech subsector:Computer/Peripherals
Anchor tenant:IBM
JLL | United States | High-technology Office Outlook | 2014
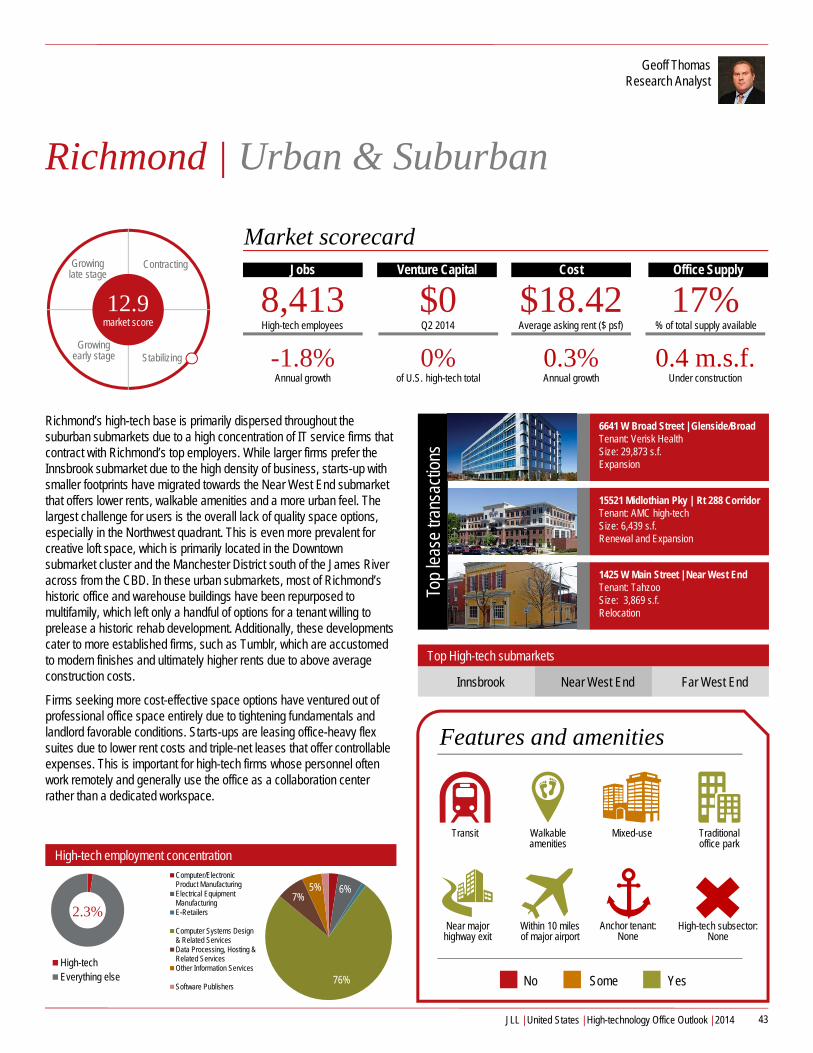
Richmond | Urban & Suburban
Richmond’s high-tech base is primarily dispersed throughout the suburban submarkets due to a high concentration of IT service firms that contract with Richmond’s top employers. While larger firms prefer the Innsbrook submarket due to the high density of business, starts-up with smaller footprints have migrated towards the Near West End submarket that offers lower rents, walkable amenities and a more urban feel. The largest challenge for users is the overall lack of quality space options, especially in the Northwest quadrant. This is even more prevalent for creative loft space, which is primarily located in the Downtown submarket cluster and the Manchester District south of the James River across from the CBD. In these urban submarkets, most of Richmond’s historic office and warehouse buildings have been repurposed to multifamily, which left only a handful of options for a tenant willing to prelease a historic rehab development. Additionally, these developments cater to more established firms, such as Tumblr, which are accustomed to modern finishes and ultimately higher rents due to above average construction costs.
Firms seeking more cost-effective space options have ventured out of professional office space entirely due to tightening fundamentals and landlord favorable conditions. Starts-ups are leasing office-heavy flex suites due to lower rent costs and triple-net leases that offer controllable expenses. This is important for high-tech firms whose personnel often work remotely and generally use the office as a collaboration center rather than a dedicated workspace.
Top High-tech submarkets
Innsbrook Near West End Far West End
43
Contracting
Stabilizing
Growing late stage
Growing early stage
Geoff ThomasResearch Analyst
12.9market score
6641 W Broad Street | Glenside/BroadTenant: Verisk HealthSize: 29,873 s.f.Expansion
15521 Midlothian Pky | Rt 288 CorridorTenant: AMC high-techSize: 6,439 s.f.Renewal and Expansion
1425 W Main Street | Near West EndTenant: TahzooSize: 3,869 s.f.Relocation
Top
leas
e tra
nsac
tions
Market scorecardJobs
8,413-1.8%Annual growth
Venture Capital Cost Office Supply
$00%
of U.S. high-tech total
$18.420.3%Annual growth
17%0.4 m.s.f.
Under construction
High-techEverything else
High-tech employment concentration
3%6%
1%
76%
7%5%2%
Computer/ElectronicProduct ManufacturingElectrical EquipmentManufacturingE-Retailers
Computer Systems Design& Related ServicesData Processing, Hosting &Related ServicesOther Information Services
Software Publishers
Features and amenities
2.3%
Walkable amenities
Transit Mixed-use Traditional office park
No Some Yes
Near major highway exit
Within 10 miles of major airport
High-tech subsector:None
Q2 2014 % of total supply availableAverage asking rent ($ psf)High-tech employees
Anchor tenant:None
JLL | United States | High-technology Office Outlook | 2014

Salt Lake City | Urban & Suburban
High-tech firms are clustered all along the Wasatch Front mountain range. The area has been dubbed “Silicon Slopes” as the Wasatch Front houses nearly 4,300 high-tech companies. In the past few years, many high-tech tenants have gravitated to Lehi, Utah. This is the center point between the two most populated counties in Utah, Salt Lake County and Utah County. Tenants such as Adobe, Xactware and Microsoft are calling the area home. Much of today’s demand has also been centered in the Downtown Salt Lake City submarket. With the completion of Mass Transit and the City Creek indoor/outdoor mall, downtown Salt Lake City has seen a lot of high-tech firms expanding and relocating.
Salt Lake City’s high-tech sector has been in growth mode the past few years. The city has seen a steady flow of new start-ups, existing expansions and out of state relocations. One of the biggest opportunities for the Salt Lake City high-tech market is the rising real estate prices in Silicon Valley. High-tech companies are looking for markets with lower costs. Thumbtack and Reddit both recently opened expansion offices in Salt Lake City rather than growing in Silicon Valley.
Landlord flexibility remains one the biggest challenges facing start-ups in Salt Lake City. Most owners desire long-term leases and creditworthy tenants, often a challenge for high growth high-tech start ups.
Top High-tech submarkets
South Valley CBD/P Utah County
44
Contracting
Stabilizing
Growing late stage
Growing early stage
Jenny TaumoepeauAssociate
39.6market score
View 72 | Central ValleyTenant: Overstock.comSize: 260,000 s.f.Built-to-suit
Draper Pointe | South ValleyTenant: Storage CraftSize: 75,000 s.f.New lease
Riverpark | South ValleyTenant: MPISize: 40,000 s.f.New lease
Top
leas
e tra
nsac
tions
Market scorecardJobs
29,659+0.8%
Annual growth
Venture Capital Cost Office Supply
$115M1.2%
of U.S. high-tech total
$19.181.00%
Annual growth
11%1 m.s.f.Under construction
High-techEverything else
High-tech employment concentration
29%
0%8%
35%
15%
3%10%
Computer/Electronic ProductManufacturingElectrical EquipmentManufacturingE-Retailers
Computer Systems Design &Related ServicesData Processing, Hosting &Related ServicesOther Information Services
Software Publishers
Features and amenities
5.7%
Walkable amenities
Transit Mixed-use Traditional office park
No Some Yes
Near major highway exit
Within 10 miles of major airport
High-tech subsector:Software
Q2 2014 % of total supply availableAverage asking rent ($ psf)High-tech employees
Anchor tenant:Adobe
JLL | United States | High-technology Office Outlook | 2014
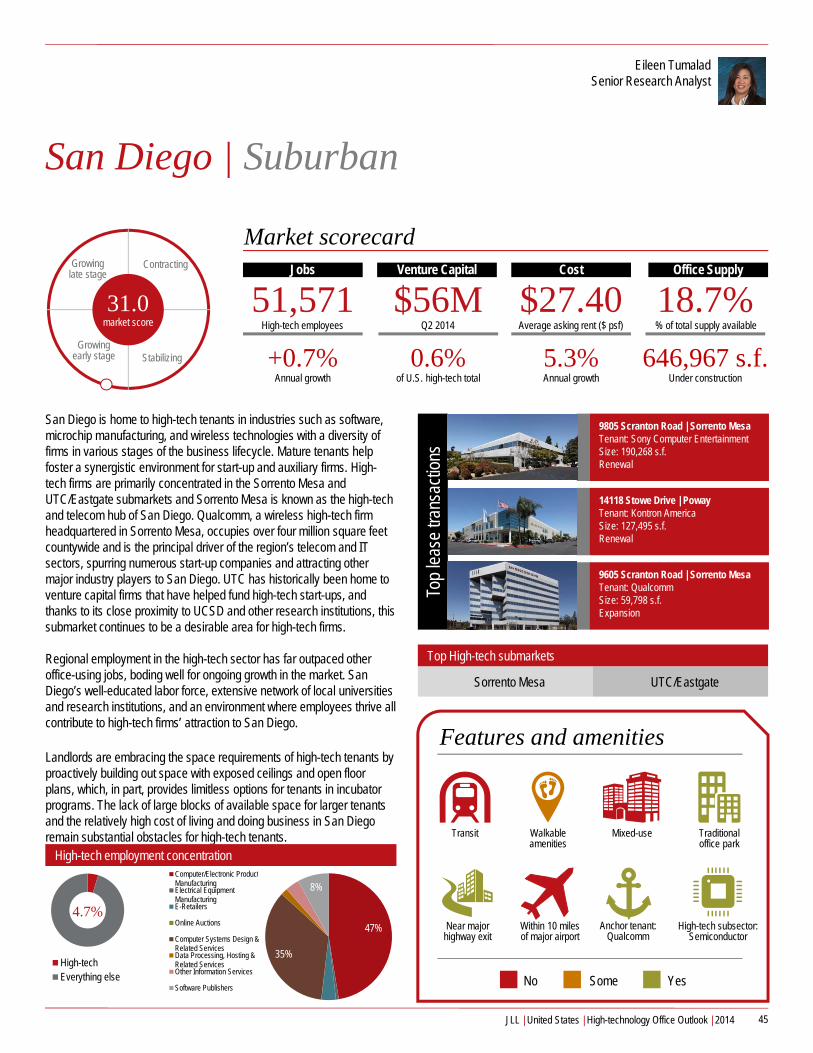
San Diego | Suburban
San Diego is home to high-tech tenants in industries such as software, microchip manufacturing, and wireless technologies with a diversity of firms in various stages of the business lifecycle. Mature tenants help foster a synergistic environment for start-up and auxiliary firms. High-tech firms are primarily concentrated in the Sorrento Mesa and UTC/Eastgate submarkets and Sorrento Mesa is known as the high-tech and telecom hub of San Diego. Qualcomm, a wireless high-tech firm headquartered in Sorrento Mesa, occupies over four million square feet countywide and is the principal driver of the region’s telecom and IT sectors, spurring numerous start-up companies and attracting other major industry players to San Diego. UTC has historically been home to venture capital firms that have helped fund high-tech start-ups, and thanks to its close proximity to UCSD and other research institutions, this submarket continues to be a desirable area for high-tech firms.
Regional employment in the high-tech sector has far outpaced other office-using jobs, boding well for ongoing growth in the market. San Diego’s well-educated labor force, extensive network of local universities and research institutions, and an environment where employees thrive all contribute to high-tech firms’ attraction to San Diego.
Landlords are embracing the space requirements of high-tech tenants by proactively building out space with exposed ceilings and open floor plans, which, in part, provides limitless options for tenants in incubator programs. The lack of large blocks of available space for larger tenants and the relatively high cost of living and doing business in San Diego remain substantial obstacles for high-tech tenants.
Top High-tech submarkets
Sorrento Mesa UTC/Eastgate
45
Contracting
Stabilizing
Growing late stage
Growing early stage
Eileen TumaladSenior Research Analyst
31.0market score
9805 Scranton Road | Sorrento MesaTenant: Sony Computer Entertainment Size: 190,268 s.f.Renewal
14118 Stowe Drive | PowayTenant: Kontron America Size: 127,495 s.f.Renewal
9605 Scranton Road | Sorrento MesaTenant: Qualcomm Size: 59,798 s.f.Expansion
Top
leas
e tra
nsac
tions
Market scorecardJobs
51,571+0.7%
Annual growth
Venture Capital Cost Office Supply
$56M0.6%
of U.S. high-tech total
$27.405.3%Annual growth
18.7%646,967 s.f.
Under construction
High-techEverything else
High-tech employment concentration
47%
1%4%0%
35%
2% 3% 8%Computer/Electronic ProductManufacturingElectrical EquipmentManufacturingE-Retailers
Online Auctions
Computer Systems Design &Related ServicesData Processing, Hosting &Related ServicesOther Information Services
Software Publishers
Features and amenities
4.7%
Walkable amenities
Transit Mixed-use Traditional office park
No Some Yes
Near major highway exit
Within 10 miles of major airport
High-tech subsector:Semiconductor
Q2 2014 % of total supply availableAverage asking rent ($ psf)High-tech employees
Anchor tenant:Qualcomm
JLL | United States | High-technology Office Outlook | 2014

San Francisco | Urban
The high-tech industry has reshaped the face of the office market in San Francisco. Robust job growth within the sector over several years has sparked an incredible amount of demand. Out of the 7.5 million square feet of office demand today, high-tech accounts for more than one-third. In the second quarter alone, the high-tech sector was responsible for nearly 90.0 percent of all net absorption gains citywide and leasing activity shot up 40.0 percent year-over-year as a direct result of the insatiable demand of high-tech tenants. Consistent demand within the sector has supported several development projects comprising more than 3.6 million square feet of construction, 65.0 percent of which is pre-leased entirely by high-tech tenants.
San Francisco has been effective in attracting a wide-range of high-tech companies from around the world, primarily due to the highly-educated workforce and dense knowledge economy. With several top-tier universities nearby in addition to clusters of high-tech companies, the access to human capital is much greater than most other office markets in the country. The ease of access to public transportation and walkability of the urban core and an abundance of nearby amenities further adds to the allure of setting up shop here.
However, such a strong tech-focused market comes at a price. Rental rates now exceed $60.00 per square foot and availability remains limited. Despite the sticker shock, there are still affordable options in fringe submarkets as well as several incubator and accelerator spaces that promise to support fledgling high-tech companies looking to grow.
Top High-tech submarkets
South Financial South of Market Mid-Market
46
Contracting
Stabilizing
Growing late stage
Growing early stage
Amber SchiadaVice President, Research
84.6market score
415 Mission Street | South FinancialTenant: Salesforce.comSize: 713,727 s.f.New / Expansion
222 Second Street | South FinancialTenant: LinkedIn Size: 450,209 s.f.New / Expansion
1 Market Plaza | South FinancialTenant: GoogleSize: 270,706 s.f.New / Expansion
Top
leas
e tra
nsac
tions
Market scorecardJobs
49,368+18.1%
Annual growth
Venture Capital Cost Office Supply
$3.2B34.1%
of U.S. high-tech total
$60.0910.0%
Annual growth
10.9%3.6 m.s.f.
Under construction
High-techEverything else
High-tech employment concentration
3%4%
67%
4%
17%
5%Computer/ElectronicProduct ManufacturingE-Retailers
Online Auctions
Computer Systems Design& Related ServicesData Processing, Hosting &Related ServicesOther Information Services
Software Publishers
Features and amenities
9.5%
Walkable amenities
Transit Mixed-use Traditional office park
No Some Yes
Near major highway exit
Within 10 miles of major airport
High-tech subsector:Software
Q2 2014 % of total supply availableAverage asking rent ($ psf)High-tech employees
Anchor tenant:Salesforce.com
JLL | United States | High-technology Office Outlook | 2014
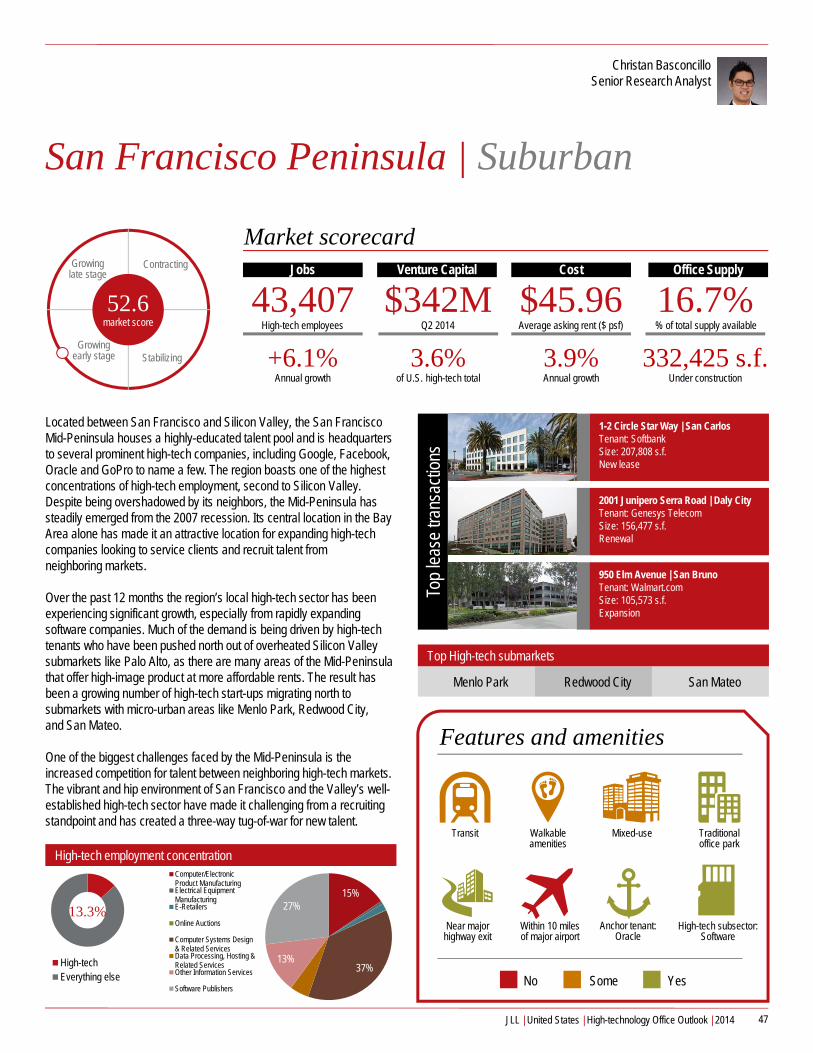
San Francisco Peninsula | Suburban
Located between San Francisco and Silicon Valley, the San Francisco Mid-Peninsula houses a highly-educated talent pool and is headquarters to several prominent high-tech companies, including Google, Facebook, Oracle and GoPro to name a few. The region boasts one of the highest concentrations of high-tech employment, second to Silicon Valley. Despite being overshadowed by its neighbors, the Mid-Peninsula has steadily emerged from the 2007 recession. Its central location in the Bay Area alone has made it an attractive location for expanding high-tech companies looking to service clients and recruit talent from neighboring markets.
Over the past 12 months the region’s local high-tech sector has been experiencing significant growth, especially from rapidly expanding software companies. Much of the demand is being driven by high-tech tenants who have been pushed north out of overheated Silicon Valley submarkets like Palo Alto, as there are many areas of the Mid-Peninsula that offer high-image product at more affordable rents. The result has been a growing number of high-tech start-ups migrating north to submarkets with micro-urban areas like Menlo Park, Redwood City, and San Mateo.
One of the biggest challenges faced by the Mid-Peninsula is the increased competition for talent between neighboring high-tech markets. The vibrant and hip environment of San Francisco and the Valley’s well-established high-tech sector have made it challenging from a recruiting standpoint and has created a three-way tug-of-war for new talent.
Top High-tech submarkets
Menlo Park Redwood City San Mateo
47
Contracting
Stabilizing
Growing late stage
Growing early stage
Christan BasconcilloSenior Research Analyst
52.6market score
1-2 Circle Star Way | San CarlosTenant: SoftbankSize: 207,808 s.f.New lease
2001 Junipero Serra Road | Daly CityTenant: Genesys TelecomSize: 156,477 s.f.Renewal
950 Elm Avenue | San BrunoTenant: Walmart.comSize: 105,573 s.f.Expansion
Top
leas
e tra
nsac
tions
Market scorecardJobs
43,407+6.1%
Annual growth
Venture Capital Cost Office Supply
$342M3.6%
of U.S. high-tech total
$45.963.9%Annual growth
16.7%332,425 s.f.
Under construction
High-techEverything else
High-tech employment concentration
15% 1% 2%
0%
37%
5%
13%
27%
Computer/ElectronicProduct ManufacturingElectrical EquipmentManufacturingE-Retailers
Online Auctions
Computer Systems Design& Related ServicesData Processing, Hosting &Related ServicesOther Information Services
Software Publishers
Features and amenities
13.3%
Walkable amenities
Transit Mixed-use Traditional office park
No Some Yes
Near major highway exit
Within 10 miles of major airport
High-tech subsector:Software
Q2 2014 % of total supply availableAverage asking rent ($ psf)High-tech employees
Anchor tenant:Oracle
JLL | United States | High-technology Office Outlook | 2014

Seattle-Bellevue | Urban & Suburban
Seattle is a desired location for high-tech companies for several reasons, including access to quality real estate in close proximity to where high-tech workers want to live, a flourishing start-up scene which is bringing significant venture capital to the region, an emerging position as “Cloud City,” and proximity to major blue chip firms, such as Amazon and Microsoft. However, the most significant reason has to be the abundance of young, highly educated workers. In a recent survey by NerdWallet, Seattle was ranked as the second best place for millennials to live. Furthermore, NerdWallet ranked the Seattle area as the second best place for STEM graduates. These strong demographics have led technology to be the most significant driver of employment growth and office demand in the Puget Sound region with the sector currently accounting for more than 40 percent of leasing activity. Competition for tenants is intense while the demand for creative office space is intensifying. Tenants want a rich amenity set and there is a new emphasis on incorporating a millennial-friendly retail mix in buildings. The amenities must also include an updated lobby, athletic facility, conference center, bike storage with lockers and showers, deck or other outdoor spaces, and a strong component of sustainability.
High-tech tenants have a propensity to locate in creative urban atmospheres, and one of the major challenges in Seattle is creating the inventory to satisfy demand. In the Seattle CBD, many owners have actively begun addressing this issue by spending significant capital improving their building lobbies and amenities, to turn seemingly outdated product into hip, tech-friendly space. Developers are addressing the pent up demand in the Bellevue CBD, by racing to break ground on previously delayed projects.
Top High-tech submarkets
Lake Union Seattle CBD Bellevue CBD
48
Contracting
Stabilizing
Growing late stage
Growing early stage
Alex MuirResearch Analyst
71.4market score
1915 Terry Avenue | Lake UnionTenant: Amazon Size: 274,358 s.f.Expansion
2201 6th Avenue | Belltown/DennyTenant: Amazon Size: 208,476 s.f.Expansion
635 Elliott Avenue W | Queen AnneTenant: Amazon Size: 187,434 s.f.Expansion
Top
leas
e tra
nsac
tions
Market scorecardJobs
120,539+7.6%
Annual growth
Venture Capital Cost Office Supply
$266M2.7%
of U.S. high-tech total
$31.172.9%Annual growth
15.9%1.7 m.s.f.
Under construction
High-techEverything else
High-tech employment concentration
7%
14%
26%
3%7%
43%
Computer/ElectronicProduct ManufacturingElectrical EquipmentManufacturingE-Retailers
Computer Systems Design& Related ServicesData Processing, Hosting &Related ServicesOther Information Services
Software Publishers
Features and amenities
11.6%
Walkable amenities
Transit Mixed-use Traditional office park
No Some Yes
Near major highway exit
Within 10 miles of major airport
High-tech subsectors:Software
Computer/Peripherals
Q2 2014 % of total supply availableAverage asking rent ($ psf)High-tech employees
Anchor tenants:Amazon Microsoft
JLL | United States | High-technology Office Outlook | 2014
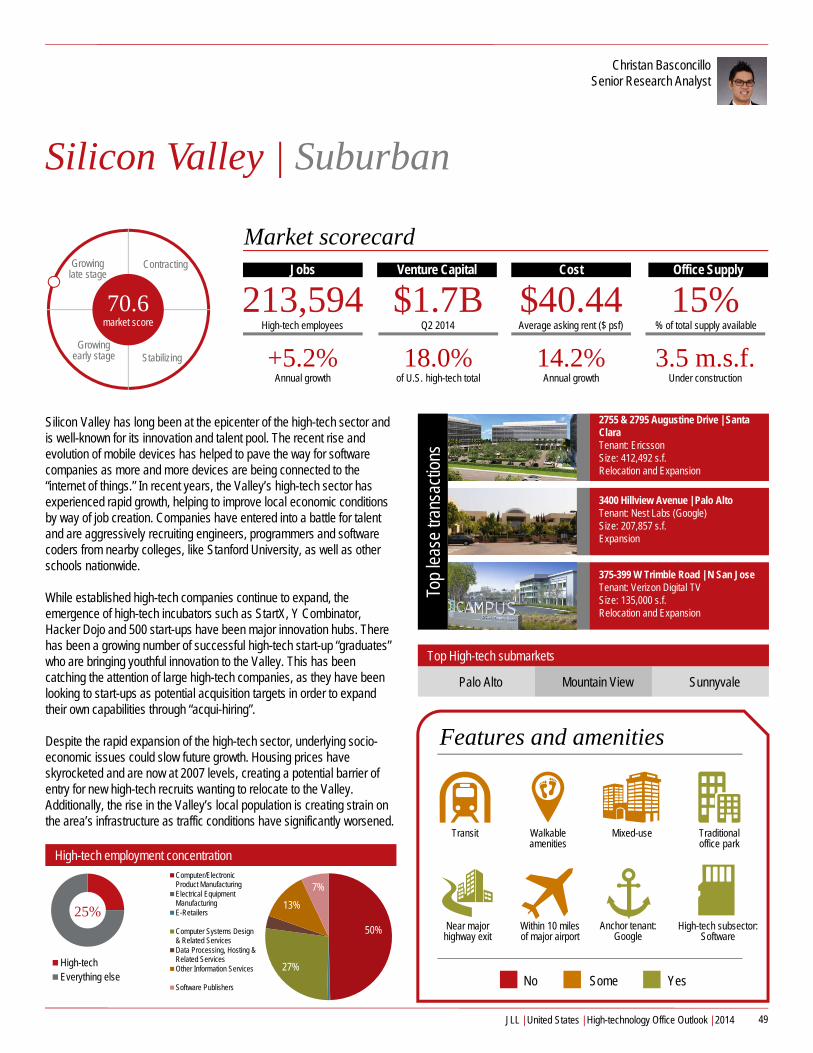
Silicon Valley | Suburban
Silicon Valley has long been at the epicenter of the high-tech sector and is well-known for its innovation and talent pool. The recent rise and evolution of mobile devices has helped to pave the way for software companies as more and more devices are being connected to the “internet of things.” In recent years, the Valley’s high-tech sector has experienced rapid growth, helping to improve local economic conditions by way of job creation. Companies have entered into a battle for talent and are aggressively recruiting engineers, programmers and software coders from nearby colleges, like Stanford University, as well as other schools nationwide.
While established high-tech companies continue to expand, the emergence of high-tech incubators such as StartX, Y Combinator, Hacker Dojo and 500 start-ups have been major innovation hubs. There has been a growing number of successful high-tech start-up “graduates” who are bringing youthful innovation to the Valley. This has been catching the attention of large high-tech companies, as they have been looking to start-ups as potential acquisition targets in order to expand their own capabilities through “acqui-hiring”.
Despite the rapid expansion of the high-tech sector, underlying socio-economic issues could slow future growth. Housing prices have skyrocketed and are now at 2007 levels, creating a potential barrier of entry for new high-tech recruits wanting to relocate to the Valley. Additionally, the rise in the Valley’s local population is creating strain on the area’s infrastructure as traffic conditions have significantly worsened.
Top High-tech submarkets
Palo Alto Mountain View Sunnyvale
49
Contracting
Stabilizing
Growing late stage
Growing early stage
Christan BasconcilloSenior Research Analyst
70.6market score
2755 & 2795 Augustine Drive | Santa ClaraTenant: EricssonSize: 412,492 s.f.Relocation and Expansion
3400 Hillview Avenue | Palo AltoTenant: Nest Labs (Google)Size: 207,857 s.f.Expansion
375-399 W Trimble Road | N San JoseTenant: Verizon Digital TVSize: 135,000 s.f.Relocation and Expansion
Top
leas
e tra
nsac
tions
Market scorecardJobs
213,594+5.2%
Annual growth
Venture Capital Cost Office Supply
$1.7B18.0%
of U.S. high-tech total
$40.4414.2%
Annual growth
15%3.5 m.s.f.
Under construction
High-techEverything else
High-tech employment concentration
50%
0%0%
27%
3%13%
7%Computer/ElectronicProduct ManufacturingElectrical EquipmentManufacturingE-Retailers
Computer Systems Design& Related ServicesData Processing, Hosting &Related ServicesOther Information Services
Software Publishers
Features and amenities
25%
Walkable amenities
Transit Mixed-use Traditional office park
No Some Yes
Near major highway exit
Within 10 miles of major airport
High-tech subsector:Software
Q2 2014 % of total supply availableAverage asking rent ($ psf)High-tech employees
Anchor tenant:Google
JLL | United States | High-technology Office Outlook | 2014

South Florida | Urban & Suburban
This year recorded one of the strongest impetuses of Miami and the region’s potential as an emerging urban high-tech hub. Two noted events in 2014 served as validation for the growing start-up sector, which both focused on this market’s position of servicing and capturing international business from Latin America. Earlier this year, the Technology Foundation of the Americas hosted eMerge Americas, a large-scale high-tech conference focused on trends driving growth in Latin America, whose online population is rapidly growing faster than any other region in the world, according to comScore, Inc. In addition, the second annual Start-Up City: Miami, an event intended as a “gathering of leading entrepreneurs and high-tech” expects to explore models of urban high-tech taking root in Miami and across the world. There is certainly buzz forming around Miami as an international high-tech hub, particularly considering Microsoft will locate its first U.S.-based Innovation Center at the incubator Venture Hive in Downtown; however, the impacts on the traditional office market in South Florida have yet to materialize.
While notable companies, such as Apple, Yahoo, Microsoft and Citrix Systems have a sizable presence in the market, companies are not relocating to core office product in traditionally tracked markets. Rather, incubators such as the FAU Research Park in Boca Raton and LAB Miami, located in the burgeoning Wynwood District on the outskirts of Downtown Miami, are home to converted warehouses that cater to the creative space needs of the sector. However, as the industry gains a foothold in South Florida, expect more established high-tech companies to begin locating operations in traditional office space, especially those focused on gaining access to Latin American markets.
Top High-tech submarkets
Boca Raton Western Broward Midtown/Wynwood
50
Contracting
Stabilizing
Growing late stage
Growing early stage
Marc MillerResearch Analyst
29.9market score
200 E. Las Olas Blvd. | Downtown FTLTenant: Prolexic high-techSize: 33,000 s.f.Relocation
Causeway Square | Northeast MiamiTenant: SunGardSize: 18,000 s.f.Expansion
Corp. Ctr. @ the Gardens | N. Palm BeachTenant: BeQuick SoftwareSize: 12,500 s.f.Relocation
Top
leas
e tra
nsac
tions
Market scorecardJobs
46,656+3.4%
Annual growth
Venture Capital Cost Office Supply
$2.7M0.03%
of U.S. high-tech total
$29.522.0%Annual growth
15.3%
128,580 s.f.Under construction
High-techEverything else
High-tech employment concentration
20%2%
8%
0%
39%
10%
15%
6%Computer/ElectronicProduct ManufacturingElectrical EquipmentManufacturingE-Retailers
Online Auctions
Computer Systems Design& Related ServicesData Processing, Hosting &Related ServicesOther Information Services
Software Publishers
Features and amenities
2.4%
Walkable amenities
Transit Mixed-use Traditional office park
No Some Yes
Near major highway exit
Within 10 miles of major airport
High-tech subsector:Electronics/instruments
Q2 2014 % of total supply availableAverage asking rent ($ psf)High-tech employees
Anchor tenant:Citrix Systems
JLL | United States | High-technology Office Outlook | 2014

Suburban Maryland | Suburban
There is a lack of organic growth in the high-tech sector of Suburban Maryland and continued federal government uncertainty has left many of these businesses with an undefined path. Most companies are tied to the government contracting world that is alive but not well in Metro DC. There is a lack of action in the federal sector, as the government has done little in the way of making decisions or deciding on a budget, which creates a domino effect to the high-tech sector and creates an overall stagnant environment.
The attraction of the Suburban Maryland market is its proximity to the federal government. The changes in the market start in the heart of Washington, DC and flow to the arteries of outlying submarkets into Suburban Maryland. Convenient access into the District is available through the Red Line Metro, MARC train and major highways, such as I-495.
Uncertainty centered around the government’s fiscal situation could continue to hinder organic growth across the region. Shorter term, given continued political and economic uncertainty, weak demand in the Suburban Maryland market will likely persist throughout 2014. Government’s inaction had trickle-down effects on contractors and associated business. Until there is more political clarity, and both public and private sector tenants have a better understanding of what the future may bring, persisting low levels of tenant demand will likely keep the market static.
Top High-tech submarkets
I-270 Corridor Bethesda CBD Rockville Pike
51
Contracting
Stabilizing
Growing late stage
Growing early stage
Sara HinesSenior Research Analyst
26.5market score
2277 Research Boulevard | I-270 CorridorTenant: CNSISize: 117,685 s.f.Relocation and expansion
1301 McCormick Drive | Prince George's CountyTenant: CSCSize: 45,636 s.f.Relocation and contraction
7700 Old Georgetown Road| Bethesda-CBDTenant: Brivo SystemsSize: 16,166 s.f.Relocation
Top
leas
e tra
nsac
tions
Market scorecardJobs
39,501-0.7%Annual growth
Venture Capital Cost Office Supply
$15M0.2%
of U.S. high-tech total
$26.34-1.0%Annual growth
18.7%0.5 m.s.f.
Under construction
High-techEverything else
High-tech employment concentration
15% 1%
0%
70%
6%
2% 6%Computer/Electronic ProductManufacturingE-Retailers
Online Auctions
Computer Systems Design &Related ServicesData Processing, Hosting &Related ServicesOther Information Services
Software Publishers
Features and amenities
6.0%
Walkable amenities
Transit Mixed-use Traditional office park
No Some Yes
Near major highway exit
Within 10 miles of major airport
High-tech subsector:IT Services
Q2 2014 % of total supply availableAverage asking rent ($ psf)High-tech employees
Anchor tenant:None
JLL | United States | High-technology Office Outlook | 2014

Washington, DC | Urban
As the Washington, DC economy continues to diversify, demand from the high-tech sector has increased. In the District, high-tech is segmented into two main subsectors: consumer high-tech companies and lobbying / government relations.
The emergence of consumer high-tech companies has provided an avenue for growth, helping offset soft demand in the traditional segments of the tenant base. With one of the most highly-educated workforces in the nation, a growing young population and a local government which is taking initiative to fund start-up high-tech companies, Washington, DC has seen an increasing number of consumer high-tech companies pop up throughout the District. These companies have emerged in the shape of a barbell with a concentration located on or near Dupont Circle to the west and Shaw to the east.
The high-tech sector has also experienced growth as a result of an increase in lobbying efforts among mature high-tech companies. The market has seen robust demand from companies such as Google, Twitter, eBay and Amazon. The lobbying presence of high-tech companies will likely continue to grow as concerns over privacy, net neutrality and other matters mount.
The supply of unique, creative office space is limited in Washington, DC given the lack of atypical buildings that are suitable for conversion to office. As a result, landlords have started to consider renovating space in traditional office buildings to create unique environments that would help attract growing high-tech tenants.
Top High-tech submarkets
Dupont Circle Shaw Gallery Place
52
Contracting
Stabilizing
Growing late stage
Growing early stage
Carl CaputoResearch Analyst
43.5market score
601 New Jersey Ave NW | Capitol HillTenant: AmazonSize: 21,132 s.f.New lease
Wonder Bread Factory | UptownTenant: iStrategyLabsSize: 16,721 s.f.Relocation and expansion
1250 Eye St NW | East EndTenant: eBaySize: 10,594 s.f.Relocation and expansion
Top
leas
e tra
nsac
tions
Market scorecardJobs
23,349-1.7%Annual growth
Venture Capital Cost Office Supply
$69M0.7%
of U.S. high-tech total
$49.22- 0.2%
Annual growth
12.6%1.7 m.s.f.
Under construction
High-techEverything else
High-tech employment concentration
0% 0%
83%
2% 13%2%Computer/Electronic
Product Manufacturing
E-Retailers
Computer Systems Design& Related Services
Data Processing, Hosting& Related Services
Other Information Services
Software Publishers
Features and amenities
5%
Walkable amenities
Transit Mixed-use Traditional office park
No Some Yes
Near major highway exit
Within 10 miles of major airport
High-tech subsector:Business & Consumer
Products/Svcs.
Q2 2014 % of total supply availableAverage asking rent ($ psf)High-tech employees
Anchor tenant:None
JLL | United States | High-technology Office Outlook | 2014

53
For more information, please contact:
Julia GeorgulesVice President, Director of [email protected] +1 415 354 6908
Amber SchiadaVice President, Director of [email protected] +1 415 395 4924
Christan BasconcilloSenior Research [email protected] +1 650 815 2213
Phil RyanResearch [email protected] +1 202 719 6295
Lauren PicarielloSenior Vice President, Director of Industry [email protected] +1 617 531 4208
Chirag ModiHead of Markets [email protected] +1 248 231 0533
JLL | United States | High-technology Office Outlook | 2014
Contacts

54
As high-tech companies grow, their ability to remain nimble and flexible with the changing consumer landscape will be important, but perhaps just as important will be their ability to develop nimble and flexible real estate strategies to grow and prosper.
JLL | United States | High-technology Office Outlook | 2014

About JLLJLL (NYSE:JLL) is a professional services and investment management firm offering specialized real estate services to clients seeking increased value by owning, occupying and investing in real estate. With annual revenue of $4.0 billion, JLL operates in 70 countries from more than 1,000 locations worldwide. On behalf of its clients, the firm provides management and real estate outsourcing services to a property portfolio of 3.0 billion square feet. Its investment management business, LaSalle Investment Management, has $47.6 billion of real estate assets under management. For further information, visit www.jll.com.
About JLL ResearchJLL’s research team delivers intelligence, analysis and insight through market-leading reports and services that illuminate today’s commercial real estate dynamics and identify tomorrow’s challenges and opportunities. Our more than 400 global research professionals track and analyze economic and property trends and forecast future conditions in over 60 countries, producing unrivalled local and global perspectives. Our research and expertise, fueled by real-time information and innovative thinking around the world, creates a competitive advantage for our clients and drives successful strategies and optimal real estate decisions.
This publication is the sole property of Jones Lang LaSalle IP, Inc. and must not be copied, reproduced or transmitted in any form or by any means, either in whole or in part, without prior written consent of Jones Lang LaSalle IP, Inc.
COPYRIGHT © JONES LANG LASALLE IP, INC. 2014