Embed Size (px)
Citation preview

1
High ThroughputProteomics
2
High throughput means ...
• Continuous “real-time” searchingof data
• Human scrutiny of results is notpractical
High throughput doesn’t necessarily mean large scale. We wouldcharacterise high throughput by two conditions:
First, that the data flow is continuous and must be searched atthe same rate as it is produced … you can’t allow a backlog tobuild up because the backlog will never be cleared.
Second, the data rate is such that it is not practical for everyresult to be verified by a human operator … you have to trust thesearch software.
Even a single instrument could meet these conditions. Forexample, an LC-MS/MS system doing a a separation every 30minutes, each of which generates a couple of hundred MS/MSspectra, would be classed as high throughput and require thesame fundamental approach as a very large scale project.

3
High throughput requires ...
• Probability based scoringSo that standard statistical tests can beapplied
• Fast, threaded codeFor parallel execution on multipleprocessors
• AutomationOf data flow from instrument to searchengine to results database
In order to implement a high throughput system, we require:
A scoring scheme which allows simple rule-based decision making.If a human being is not going to study the search results, then themechanism for deciding whether an identification is safe or nothas to be kept as simple as possible. Our approach is to use strictprobability based scoring, so that standard statistical confidencetests can be applied.
Systematic protein identification will involve searching largedatabases, such as a comprehensive non-redundant proteindatabase or dbEST or a complete genome. It also means complexsearches, involving multiple variable (that is, non-quantitative)modifications, relaxed enzyme specificity or maybe no enzymespecificity at all. In general, such large searches cannot beperformed in real-time using a single processor. It becomesessential to parallelise the process by using multiple processors.
Finally, the flow of data from instrument to search engine toresults database has to be automated. Even if human operatorsare willing to perform endless and tedious data transferoperations manually, their error rate would not be acceptable.
So the three requirements are: scoring, speed and automation.

4
Probability based scoringenables standard statisticaltests to be applied to results
Mascot score is -10Log10(P)
In a database of 500,000 entries, a 1 ina 1,000 chance of getting a falsepositive match is a probability of
P = 1 / (1,000 x 500,000)
Equivalent to a Mascot score of 87
In Mascot, we calculate the probability that the observed match isa random event. The real match, which is not a random event,then has a very low probability.
The calculated probabilities are converted into scores by takinglogs, so that a good match has a high score.
Assigning a significance threshold or confidence level to a matchis then very simple. Assume we are running a fully automatedsystem and prefer to repeat an experiment rather than get a falsepositive. We might choose a significance threshold of 1 in 1,000.That is, we are only interested in results which have less than a 1in 1,000 chance of being random events.
If the database being searched has 500,000 protein entries, a 1 in1,000 chance of finding a match is simply 1 over 1,000 times500,000. Which converts into a Mascot score of 87.
So, we can have a simple rule in software which looks for matcheswith scores greater than 87.
5
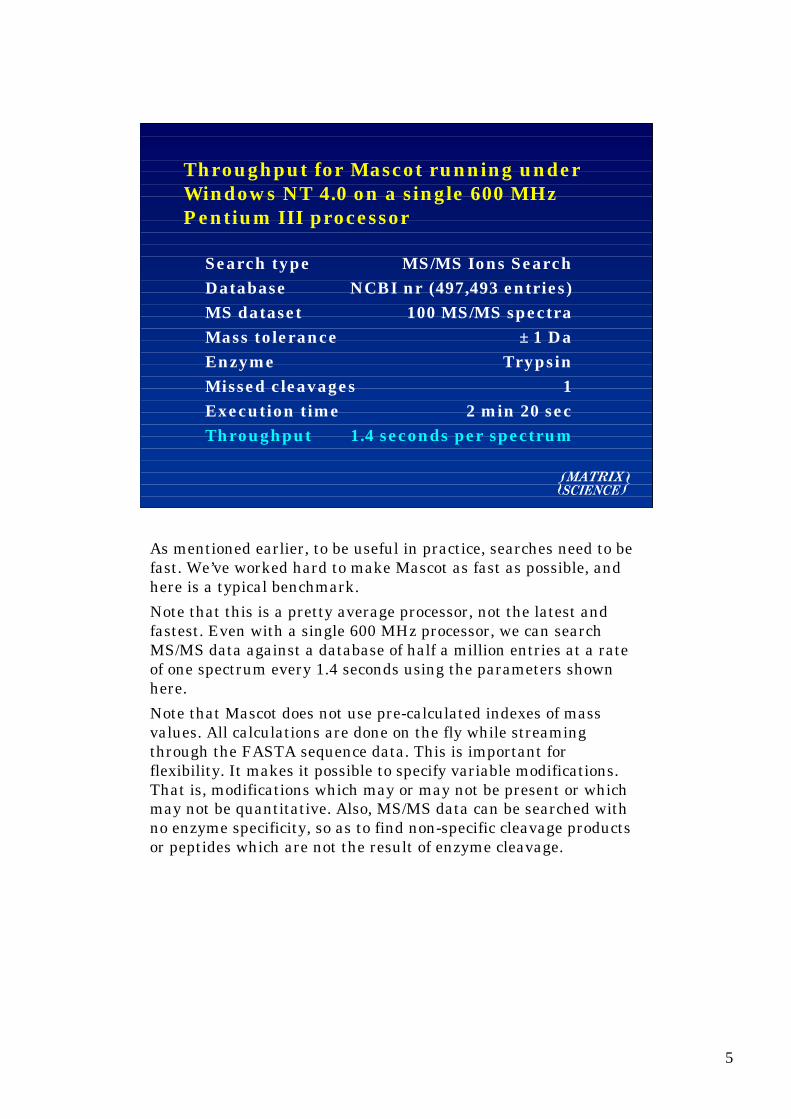
Throughput for Mascot running underWindows NT 4.0 on a single 600 MHzPentium III processor
Search type MS/MS Ions SearchDatabase NCBI nr (497,493 entries)MS dataset 100 MS/MS spectraMass tolerance ± 1 DaEnzyme TrypsinMissed cleavages 1Execution time 2 min 20 secThroughput 1.4 seconds per spectrum
As mentioned earlier, to be useful in practice, searches need to befast. We’ve worked hard to make Mascot as fast as possible, andhere is a typical benchmark.
Note that this is a pretty average processor, not the latest andfastest. Even with a single 600 MHz processor, we can searchMS/MS data against a database of half a million entries at a rateof one spectrum every 1.4 seconds using the parameters shownhere.
Note that Mascot does not use pre-calculated indexes of massvalues. All calculations are done on the fly while streamingthrough the FASTA sequence data. This is important forflexibility. It makes it possible to specify variable modifications.That is, modifications which may or may not be present or whichmay not be quantitative. Also, MS/MS data can be searched withno enzyme specificity, so as to find non-specific cleavage productsor peptides which are not the result of enzyme cleavage.

6
Worst case conditions
• Wide peptide mass tolerance• Large number of variable modifications• No enzyme specificity• Large database
While this benchmark represents a fairly typical example, it is farfrom a worst case. Worst case search times are a result of pushingthese four factors:
The search space is roughly proportional to the peptide masstolerance.
Each additional variable or non-quantitative modification cancause a geometric increase in search time.
No enzyme specificity requires orders of magnitude more peptidesto be tested than (say) trypsin.
Finally, and most obviously, the size of the database.

7
Mascot master
Mascot node 1
100Base-T Hub
Mascot node 2
Mascot node 3
TCP/IP
TCP/IP
TCP/IP
TCP/IP
"External"Intranet
TCP/IP
Mascot ClusterTopology
So, to do comprehensive searches of large databases in real-time,it becomes essential to farm out the problem to a large number ofprocessors. This can, of course, be done on a large, multi-processorserver.
But, there is increasing interest in using clusters of standardsystems, such as Alphas or PC’s.
Support for execution on networked clusters is part of thestandard Mascot package. Many people choose to assemble theirown cluster.

8
Such clusters can be very large. At GeneProt, in Switzerland,Mascot is being run on more than one thousand Compaq Alphaprocessors, so as to perform exhaustive searches in real time ondata flowing from 50 high performance mass spectrometers.

9
Mascot Cluster• 19” rack mount chassis containing up to 5
dual processor nodes
On a slightly more modest scale, we can supply a complete turn-key system based on a 19” rackmount chassis containing up to 5dual processor nodes. The nodes are hot-swappable and thechassis contains redundant power supplies feeding a commonpower distribution bus.
10
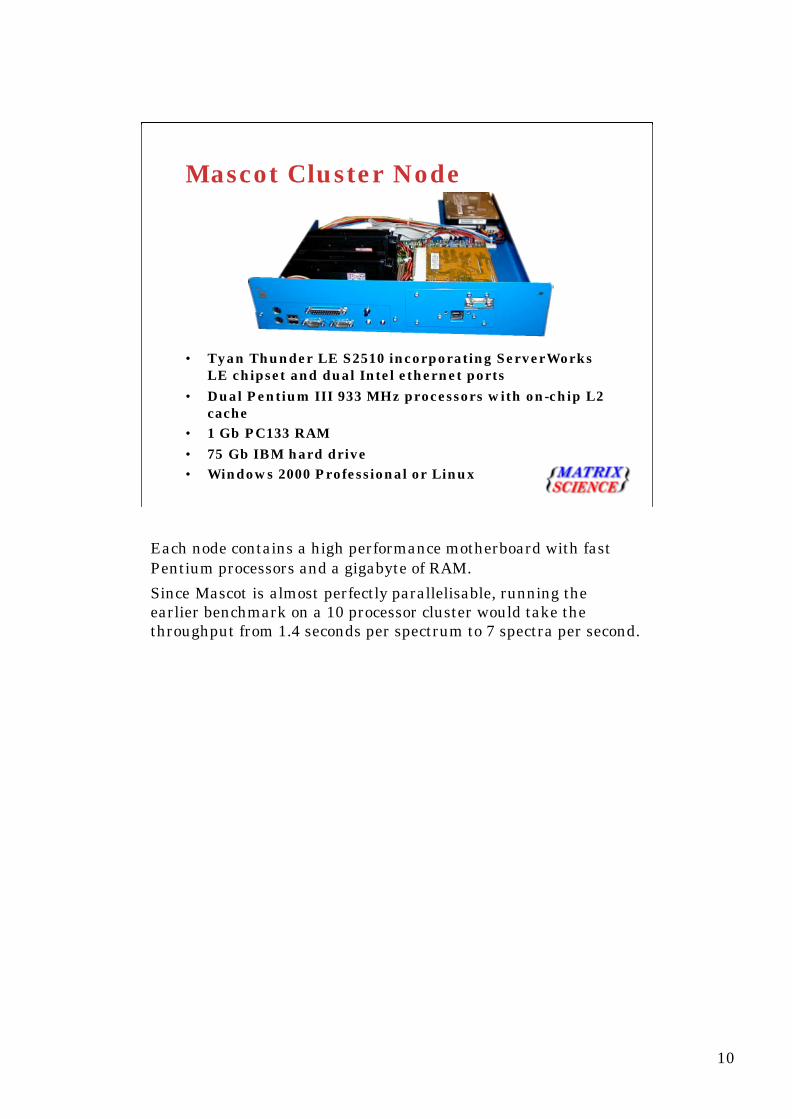
• Tyan Thunder LE S2510 incorporating ServerWorksLE chipset and dual Intel ethernet ports
• Dual Pentium III 933 MHz processors with on-chip L2cache
• 1 Gb PC133 RAM• 75 Gb IBM hard drive• Windows 2000 Professional or Linux
Mascot Cluster Node
Each node contains a high performance motherboard with fastPentium processors and a gigabyte of RAM.
Since Mascot is almost perfectly parallelisable, running theearlier benchmark on a 10 processor cluster would take thethroughput from 1.4 seconds per spectrum to 7 spectra per second.

11
Cluster advantages
• Very low hardware cost (Intel)• Extensible• Resilient• Distributed RAM• Parallel access to memory and disk
The primary attraction of a cluster has to be the low hardwarecost. Using PC’s. the cost is around an order of magnitude lowerthan a multiprocessor server of equivalent throughput. (e.g. $35kversus $350k for 10 CPU’s)
Another attraction is versatility. It is very difficult to predictexactly how much processing power will be needed for a particularproject. With a cluster, you can start conservatively and just addboxes as needed. If you buy a multi-processor server with amaximum capacity of 8 CPU’s, and then find you need 12, theconsequences can be costly and disruptive.
A cluster is resilient because a node can fail without bringingdown the whole system. If Mascot detects that a node has stoppedresponding, it will reconfigure itself, either without the node orwith a replacement node, and continue operation. Meanwhile, thefaulty node can be repaired.
One of the limitations of standard PC’s is that they usually onlyhave 4 slots for RAM, and DIMM bigger than 256 Mb are veryexpensive. So, 1 Gb RAM per PC is often a practical upper limit.With a cluster, we can have 1 Gb per system.
Compared with supercomputers, standard PC’s have relativelyslow bandwidth to disk and memory. By spreading the load acrossmany parallel systems, this bottleneck is alleviated.

12
A Mascot cluster is like a Beowulf cluster. One node acts as themaster and distributes the executables and databases to all of theslave nodes. Similarly, each search is divided up by the masterand distributed to the slaves. At the end of the search, the mastercollates the results back into a single file.
There are tools to allow a system administrator to monitor thestatus of each of the nodes from a web browser. This table, forexample, shows at a glance if one of the nodes is running low onresources or failing to respond.

13
This is an example.
14
Automation
Input side automation:•Search creation & submission•Data dependent repeat searching•Data dependent instrument control
The final, crucial requirement for high throughput work isautomation.
Automation can be divided into two. Input side or front-endautomation covers getting the searches into Mascot. Output sideautomation covers doing something with the results.
On the input side, we need to have mechanisms for creatingsearches by assembling mass spectrometry data and searchparameters, then submitting the searches to Mascot.
Second, we need to be able to chain searches together so as toimplement complex search strategies.
Third, in an ideal world we will have closed loop feedback to theinstrument, so that we can use the search results to make bestuse of available instrument time. For example, curtailingacquisition once a goal has been achieved, or repeating anacquisition if the result is unclear.

15
LIMS
Peak List
1234 345 1235 123 1236 54
MascotInputFile
MascotSearchEngine
MascotSearchResults
Data reduction
Search parameters
MS Data
Parse results into database
300 800 1300 1800
Mass Spectrometer
Res
ult d
epen
dent
inst
ruct
ions
This diagram illustrates the data flow for high throughput proteinidentification.
Starting at the top, the raw data from the mass spectrometermust be reduced to high quality peak lists. That is, pairs of massand intensity values rather than profile data. At present, wedepend on the instrument control data system to perform thistask. This data reduction is often the weak link in the chain…real-time peak detection, de-isotoping, and de-charging is nothandled well by all data systems.
The peak lists must then be combined in some fashion with anumber of search parameters. For example, which database is tobe searched?, what enzyme was used for digestion?, etc.
We provide an automation client, called Mascot Daemon. Daemoncan implement the front end automation without any customprogramming by using predefined sets of parameters.
A more logical source for the search parameters is the LIMSwhich manages sample tracking. There is a mechanism to achievethis with Mascot Daemon, but it requires some programming onthe LIMS side. Likewise, parsing of result files into the LIMS anddata dependent instrument control require some customprogramming at present.

16
Mascot Daemon
1. Batch taskA batch of data files to be searchedimmediately or at a defined time
2. Real-time monitor taskNew files on a defined path are searchedas they are created
3. Follow-up taskAccepts data files from another task. Forexample, to repeat a search against adifferent database
Mascot Daemon runs on any Win32 platform and supports threekinds of tasks.
The follow-up task is very powerful because it allows searches tobe chained together to implement complex decision paths. Forexample, as batch of data files might be screened against acontaminants database containing entries for keratins, BSA,trypsin, etc. Those data files which fail to find a match can thenbe automatically searched against a non-redundant proteindatabase. Spectra which are still unmatched can then be searchedagainst a large EST database, etc., etc.

17
The parameter editor allows sets of search parameters to bedefined and saved to disk, so that they can be used over and overagain. The search parameters define how the data will besearched.

18
The Task Editor tab is used to define each task. A task defineswhat data will be searched and and when the search will takeplace.
Here we have a simple batch task. A set of data files has beencreated, a parameter set has been chosen, and the task will runall the searches as a batch at a predefined time.

19
When you search Mascot using the web browser forms, you’relimited to uploading one file of peak lists at a time. Daemon notonly allows you to create batches of searches, it also provides somedata import filters.
For example, we can open up a MassLynx sample list and fish outthe data file names.

20
We can use tags in title field of the Mascot search which getsubstituted at run time by fields from the MassLynx sample list.For example, “HEK digest band 1”, or any text from any of thecolumns, could appear at the top of the Mascot search report.

21
We also have an import filter which uses the lcq_dta.exe utilityfrom ThermoFinnigan to convert Xcalibur .RAW files to .DTAfiles.
And, recently, we’ve added an import filter for Sciex Analyst.WIFF files.
Both the Xcalibur and the Analyst import filters depend onlibraries supplied with the data systems. Daemon must berunning on a system which has the relevant software installed totake advantage of these features.

22
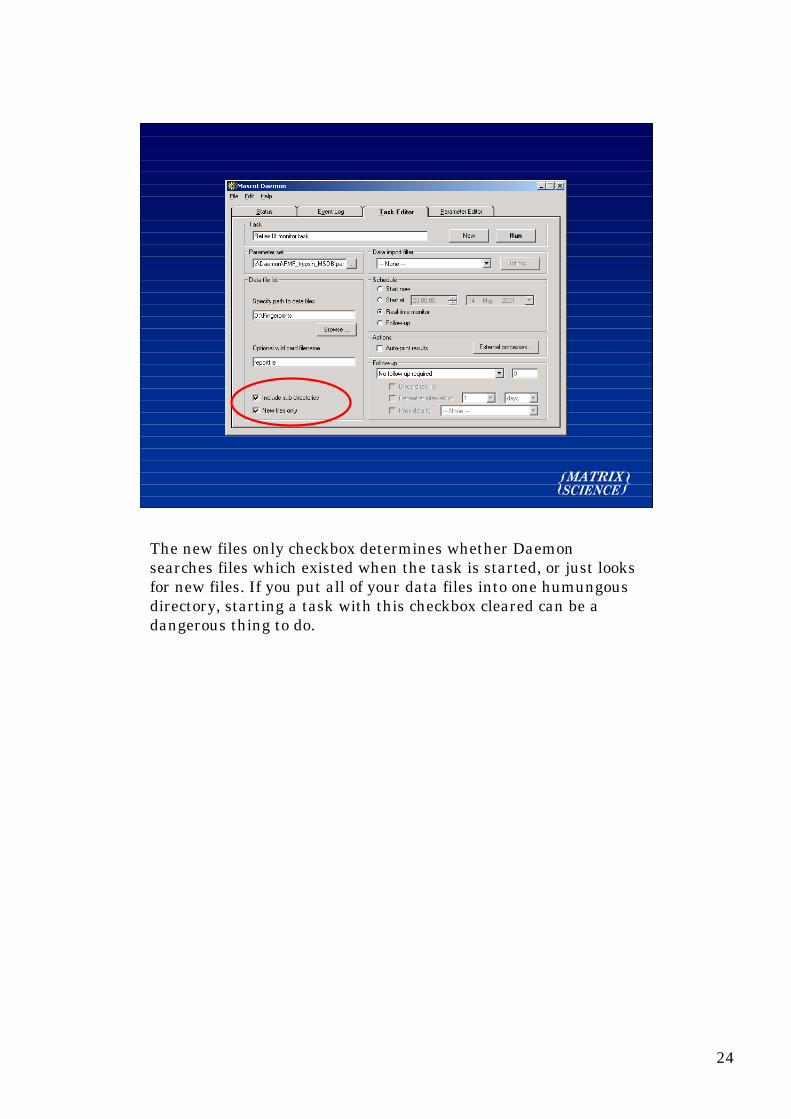
Batch searches are a great timesaver. But, the most commonlyused task for true automation is the real-time monitor task,sometimes described as a sniffer.
A real-time monitor task watches a particular path, that is adirectory, and looks for new files which match a wild card pattern.In this example, we are looking in the directory d:\fingerprints,and all its subdirectories, for any file called reportfile.

23
This could be used to watch for Bruker XMASS data files, whereeach sample generates a new subdirectory structure. Other datasystems put the peak lists into a common directory with differentfilenames, so we would use a wildcard filename like *.PKL
24
The new files only checkbox determines whether Daemonsearches files which existed when the task is started, or just looksfor new files. If you put all of your data files into one humungousdirectory, starting a task with this checkbox cleared can be adangerous thing to do.
25
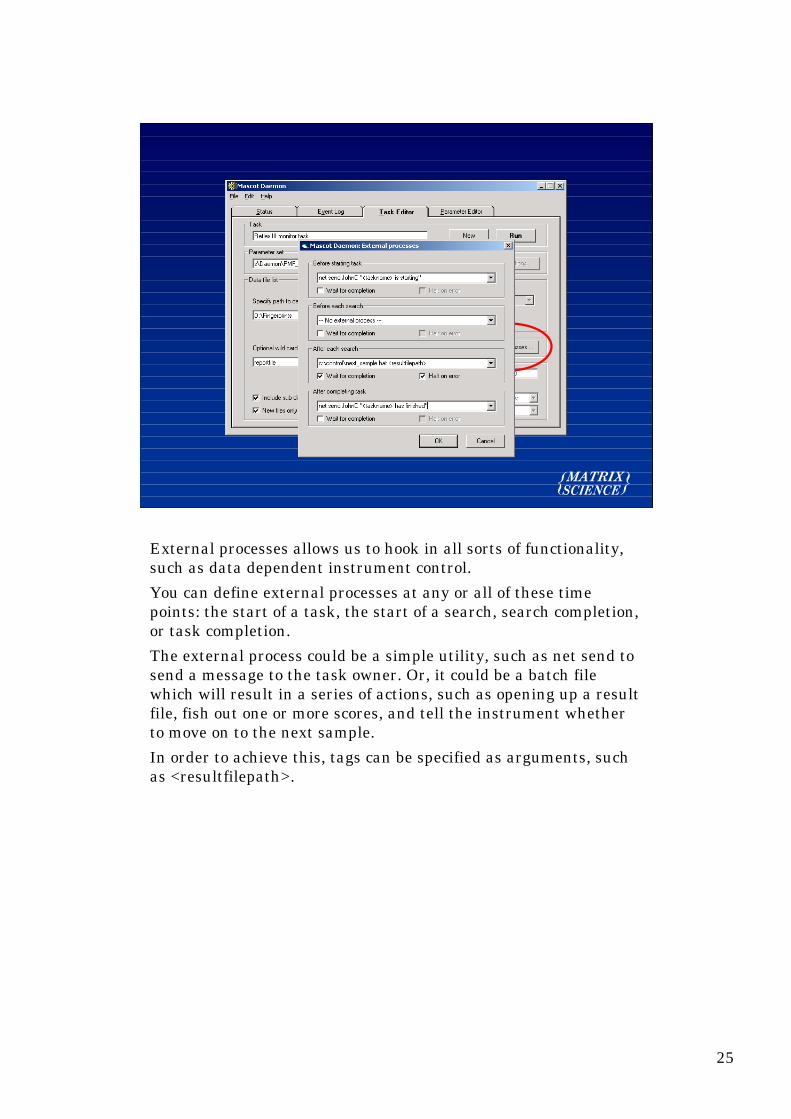
External processes allows us to hook in all sorts of functionality,such as data dependent instrument control.
You can define external processes at any or all of these timepoints: the start of a task, the start of a search, search completion,or task completion.
The external process could be a simple utility, such as net send tosend a message to the task owner. Or, it could be a batch filewhich will result in a series of actions, such as opening up a resultfile, fish out one or more scores, and tell the instrument whetherto move on to the next sample.
In order to achieve this, tags can be specified as arguments, suchas <resultfilepath>.

26
Swiss-Prot, trypticspecificity, Met-Ox
MSDB, trypticspecificity, Met-Ox
MSDB, no enzymespecificity, lots of PT-
modifications
dbEST, no enzymespecificity, lots of PT-
modifications
Short searchmany queries
long searchfew queries
Maximum throughput cannot be achieved by searching everydatafile against the biggest database with the widest possiblerange of modifications and no enzyme specificity. This would takeforever.
For efficiency, we want to identify as many spectra as possibleusing fast, simple searches against a small, high-quality databasesuch as Swiss-prot.
Spectra which cannot be identified easily, can then be searchedagainst progressively larger databases, using progressively moreexhaustive search parameters.

27
The way we achieve this in Daemon is with a follow-up task. Thisis a task which doesn’t have a predefined list of data files. It runscontinuously, waiting to receive data files passed from othertasks.
The clever trick is that a follow-up task can pass data to anotherfollow-up task. This allows us to create chains of tasks toimplement complex search strategies.
The thing which is conceptually difficult about follow-up tasks isthat you have to define the chain starting from the end.
This is obvious if you think about it. The task we are going to passthe data to has to exist so that it can be identified in the precedingtask.
So, to implement the task chain we saw in the earlier slide, westart by defining the stage 4 task, the wide open dbEST search.

28
We press run, and it appears on the status tree, waiting forsomething to happen.

29
We then define the stage 3 task, a wide open nr search. Noticethat we have set-up a follow-up chain. If the probability that thematch is random is greater than 1 in 100, that is, the match is nota good one, then pass the data to the stage 4 task.
For a peptide mass fingerprint, this score threshold applies to theprotein score for each complete search. For an MS/MS search, thescore threshold applies independently to the peptide score for eachMS/MS spectrum. Each task sieves out the spectra which can bematched and passes the ones which can’t be matched on to thenext task.

30
And then the stage 2 task, a fast nr search, which passes itsfailures to stage 3.

31
Finally, we get to the start of the chain, stage 1. This is the fastSwiss-prot search. We are showing this as a real-time monitortask, but it could equally well be a batch task.

32
When we finally press run, the whole chain swings into action,and data files will be passed along the chain until we get a match.
Although this may have sounded complicated, it really isn’t.
Also, please realise that you don’t have to set the chain up everytime. Once a chain is set up, an unlimited number of real-timemonitor or batch searches can feed into it. We could have 10 moretasks here, maybe one for each instrument in a lab, all feedinginto the same task chain by specifying that unmatched data filesshould be passed to the stage 2 search.

33
If you lose track of all the different tasks, it is now possible toview or print a report showing details for all the tasks on the tree.This was a widely requested feature, and is new in version 1.7

34
Of course, the task master in a fully automated laboratory shouldreally be the LIMS.
Underlying Daemon is a database containing three tables. Onecontaining all the task information, one listing all the data files itknows about, and one listing all the result files.
By default, these tables live in a Microsoft Access database calledTaskDB.mdb.
However, they can live in any ODBC compliant database engine,such as Oracle or SQL Server. So, if you have an Oracle basedLIMS, the Daemon tables can be inside the LIMS. Instead ofusing the Daemon user interface, the LIMS can manipulate thefields in the tables directly. Daemon then becomes a specialisedagent, executing searches at the direction of the LIMS.

35
Automation
Input side automation:•Search creation & submission•Data dependent repeat searching•Data dependent instrument control
Output side automation:•Transferring results to external database
Let us focus on output side automation.
That is, doing something with the results other than just printingthem out.

36
LIMS
Peak List
1234 345 1235 123 1236 54
MascotInputFile
MascotSearchEngine
MascotSearchResults
Data reduction
Search parameters
MS Data
Parse results into database
300 800 1300 1800
Mass Spectrometer
Res
ult d
epen
dent
inst
ruct
ions
Now, we are focusing on these two connections.
This can be more difficult than input side automation, becauseeveryone has different requirements. What do we mean by resultsand what do we mean by LIMS?

37
An example of a sophisticated proteomics oriented LIMS would bethe WorksBase package from Bio-Rad. At Matrix Science, we areworking with Bio-Rad to ensure that Mascot is fully integratedinto WorksBase.
38
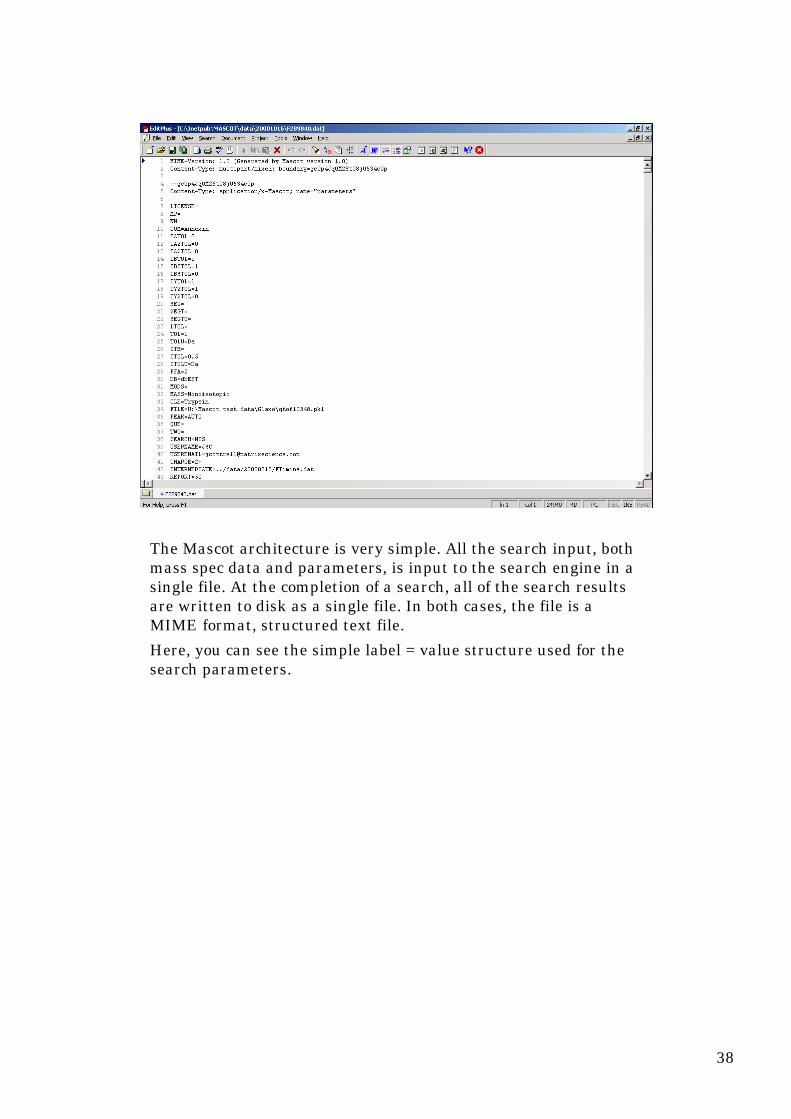
The Mascot architecture is very simple. All the search input, bothmass spec data and parameters, is input to the search engine in asingle file. At the completion of a search, all of the search resultsare written to disk as a single file. In both cases, the file is aMIME format, structured text file.
Here, you can see the simple label = value structure used for thesearch parameters.

39
Here is part of the block which contains the peptide match results.It looks a little busy, but this kind of thing is dead easy to parseinto a database. The tricky bit is deciding what information youwant to extract.

41
LIMS
Peak List
1234 345 1235 123 1236 54
MascotInputFile
MascotSearchEngine
MascotSearchResults
Data reduction
Search parameters
MS Data
Parse results into database
300 800 1300 1800
Mass Spectrometer
Res
ult d
epen
dent
inst
ruct
ions
Daemon orinstrumentdata system
MascotDaemon
Host Daemontables in
LIMS
Scripts or macrosto parse Mascot
result files
Daemonexecutingexternal
processes
Returning to our block diagram to summarise: We havemechanisms in place to implement a fully automated proteinidentification pipeline. Either on a small scale, with oneinstrument, or on a large scale, with many.
The core is the Mascot server.
Generating peak lists currently relies on the instrument datasystem, but this will change in the not too distant future.
Mascot Daemon does a pretty good job of automating searchsubmission.
We can even integrate Daemon with a LIMS by hosting its tablesin the LIMS database.
The facility to execute external processes provides a crudemechanism for data dependent instrument control, but willgenerally involve scripting or programming by the user anddepends on the instrument control software having theappropriate hooks in place.
Finally, parsing of result information into a LIMS or projectdatabase can be easy or can be difficult. It all depends on thequestions you are asking.

42
http://www.matrixscience.com