Embed Size (px)
Citation preview
1
High Toughness High Hardness Iron Based PTAW Weld Materials
D.J. Branagan∗, M.C. Marshall, and B.E. Meacham Institute of Nanomaterials Research and Development,
The NanoSteel Company, 505 Lindsay Boulevard,
Idaho Falls, Idaho, 83402
ABSTRACT New iron based alloys were developed for industrial hardfacing via plasma transferred arc-welding (PTAW). The alloys were designed with low critical cooling rates for metallic glass formation so that high undercooling could be obtained prior to the initiation of nucleation. The result was that conventional dendritic solidification could be avoided resulting in the refinement of metallurgical grain/ phase sizes through a coupled lath eutectoid growth mode. High hardness up to Rc 66 was developed from the fine structure consisting of a high volume fraction of borocarbides phases. Using a Palmqvist method, high toughness up to 74.7 MPam1/2 was measured which could adequately be described through a Crack Bridging Model. The effective distribution of borocarbides phases with ductile iron in a coupled lath morphology appears to be especially potent for crack bridging and is believed enabling to achieve combinations of high toughness along with high hardness. Thus, this new class of PTAW hardfacing alloys is expected to be useful for applications requiring high abrasion resistance and high impact. Keywords: hardfacing, weld overlay, toughness, solid state transformation
∗Corresponding Author: Daniel Branagan, PhD, Institute of Nanomaterials Research and Development, Tel: (208) 552-5226, Fax: (208) 552-2923, e-mail: [email protected].
2
INTRODUCTION Improving the wear resistance of surfaces on existing industrial parts, devices, and machines by providing a hard protective surface layer is the basis for hardfacing. This approach of applying advanced protective metallurgically bonded thick coatings, results in the development of relatively low cost high performance material systems since often a relatively low cost substrate can be used with an advanced hardfacing coating. Plasma transferred arc (PTAW) is a hardfacing technique which is a high energy welding process where inert argon gas is used for the arc plasma supply, for powder transport, and for shielding of the molten material. PTAW welds generally produce a high quality deposit offering precision weld deposits with minimal dilution (typically less than 10%) or deformation of the base material. Often PTAW welding is combined with robotic control to weld complex shapes with narrow tolerances. The advantages of hardfacing are many, including the ability to rebuild and restore worn out parts with significant cost savings. Recently, with the price of raw materials rising dramatically, there is an even bigger incentive to rebuild worn parts rather than buying new. In the hardfacing world, often a balance is struck between hardness, wear resistance and toughness. Often, especially in applications with impact, while high wear resistance may also be desired, it is not possible due to the loss of toughness and lower hardness unless abrasion resistant materials are specified. In this paper, the development of advanced iron based hardfacing alloys are shown with a focus on developing alloys which are good for high abrasion applications and yet have the unique ability to exhibit high toughness.
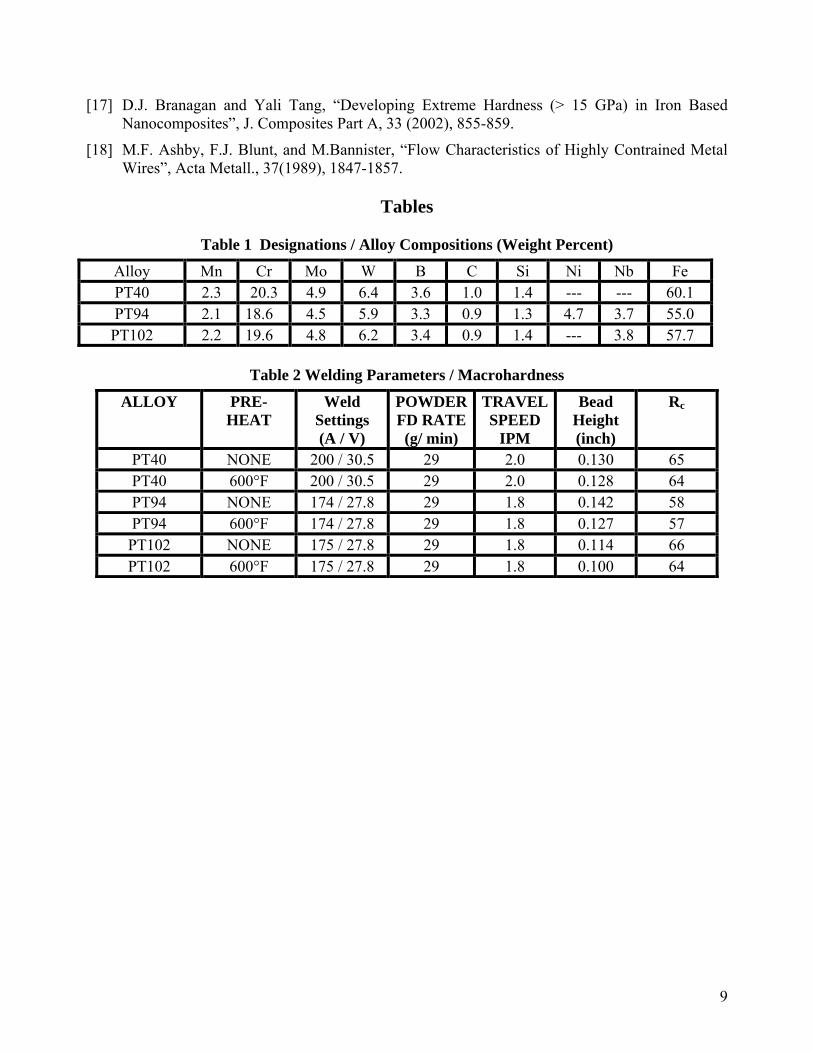
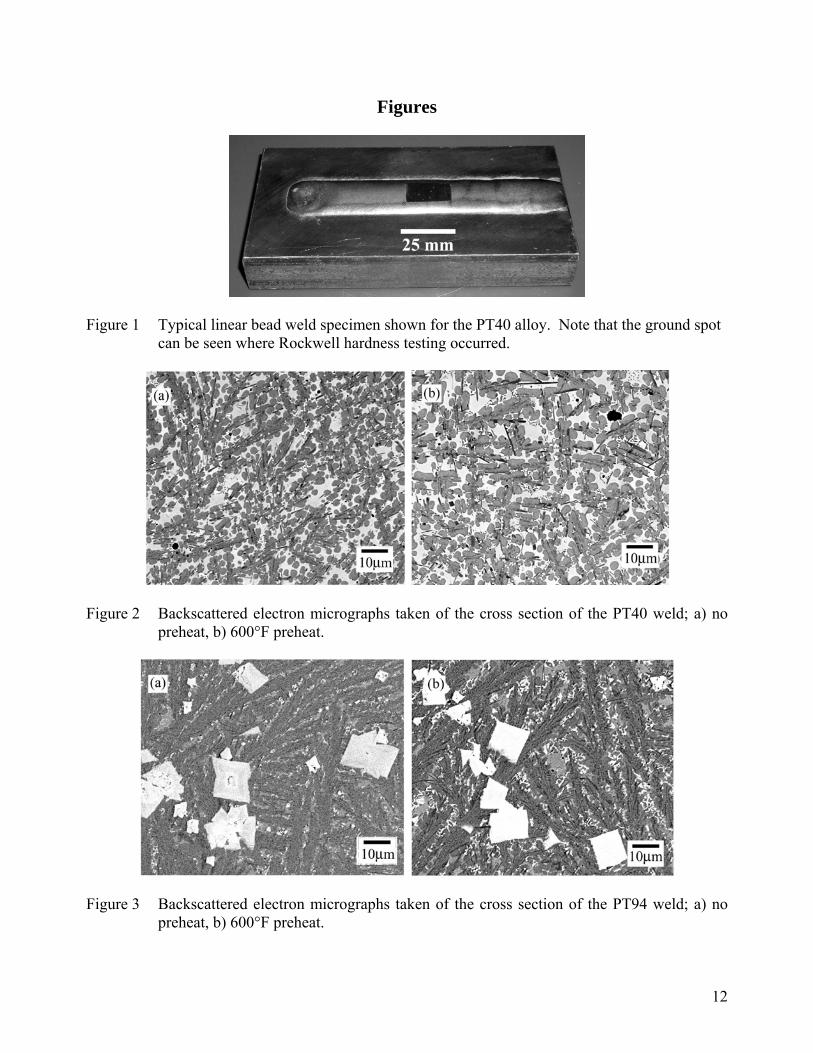
EXPERIMENTAL PROCEDURE Three proprietary alloy compositions, PT40, PT94, and PT102 were developed for PTAW hardfacing and their approximate compositions are shown in Table 1. The alloys were designed to have high glass forming ability (< 5000 K/s) allowing high undercooling before solidification and the development of fine microstructures. Proprietary solidification studies revealed that the alloys readily formed glasses at sufficient rates of cooling and exhibited the following relative glass forming ability; PT102 > PT94 > PT40. The compositions were alloyed using commercial purity ferroadditive feedstock and atomized into powder using a laboratory scale inert gas atomization system with a close coupled annular atomization nozzle with argon as the atomizing gas. The as-atomized powder was sieved using a Rotap sieving system to yield feedstock powders in the +75 to -150 µm range. PTAW weld trials were done using a Stellite Coatings Starweld PTAW system with a Model 600 torch with an integrated side-beam travel carriage. All welding was in the automatic mode using transverse oscillation with argon as the shielding gas. The weld beads were formed with a nominal width of ¾ in. and a height of 9/64 in. at the crown. In Table 2, the welding parameters for each sample, bead height and Rockwell hardness results are shown for the linear bead hardness test PTAW specimens. Differences in bead head can be attributed to the differences in melt properties (i.e. fluidity and melting point) of the alloys resulting in differences in the ability to wet-out or spread on the surface during welding. Single pass hardfacing welds were done onto 6” by 3” by 1” plates of A36 steel with and without a 600°F preheat. A typical linear hardfacing weld is shown in Figure 1. Hardness measurements using Rockwell were made on the ground external surface of the linear crack specimens and Vickers hardness measurements were taken on the cross section of the welds. Additionally, nine hour X-ray scans were done using filtered Cu Kα radiation and incorporating silicon as a standard on a PANalytical (formerly Phillips) X’Pert MPD x-ray diffractometer and Rietveldt refinement was done with a Siroquant software package. SEM studies were done using a
3
Hitachi S-3000N electron microscope. The Vickers microhardness was measured according to the protocols of ASTM E384-99 standard test method using a 100 g load and macrohardness measurements through Rockwell C. The fracture toughness was measured by the Palmqvist Method [1-7], which is a common practice for ceramic and ceramic-metal composites but not generally applied to weld hardfacing alloys. Detailed experimental proof of the techniques validity and applicability to weld hardfacing alloys has been recently published [8]. This technique is based on applying a known load to a Vickers diamond pyramid indenter that results in an impacted indentation into the surface of a specimen. The applied load must be greater than a critical threshold load [5,6] in order to cause cracks in the surface at or near the corners of the indentation. Typically, cracks are nucleated and propagated by unloading the residual stresses generated by the indentation process [7]. As would be expected, when the indentation load is increased the total length of cracking also increases. The regime for which this method is applicable is characterized by the range of loading where there is a linear relationship between the total crack length and the load [4]. The sample preparation process consisted of cutting a weld section that was about 1” in length, removing excess substrate material then mounting the sample in a metallographic epoxy. Both sides were exposed and one side was sanded with a fine grit paper while the opposite side was polished with alumina powder slurries of finer size in stages. The indentations were done on the polished side. The crack length reported is the total segmented length of the actual crack including curves and wiggles beginning from the indentation edge to the crack tip, which represents the maximum amount of crack length and conservatively represent the toughness.
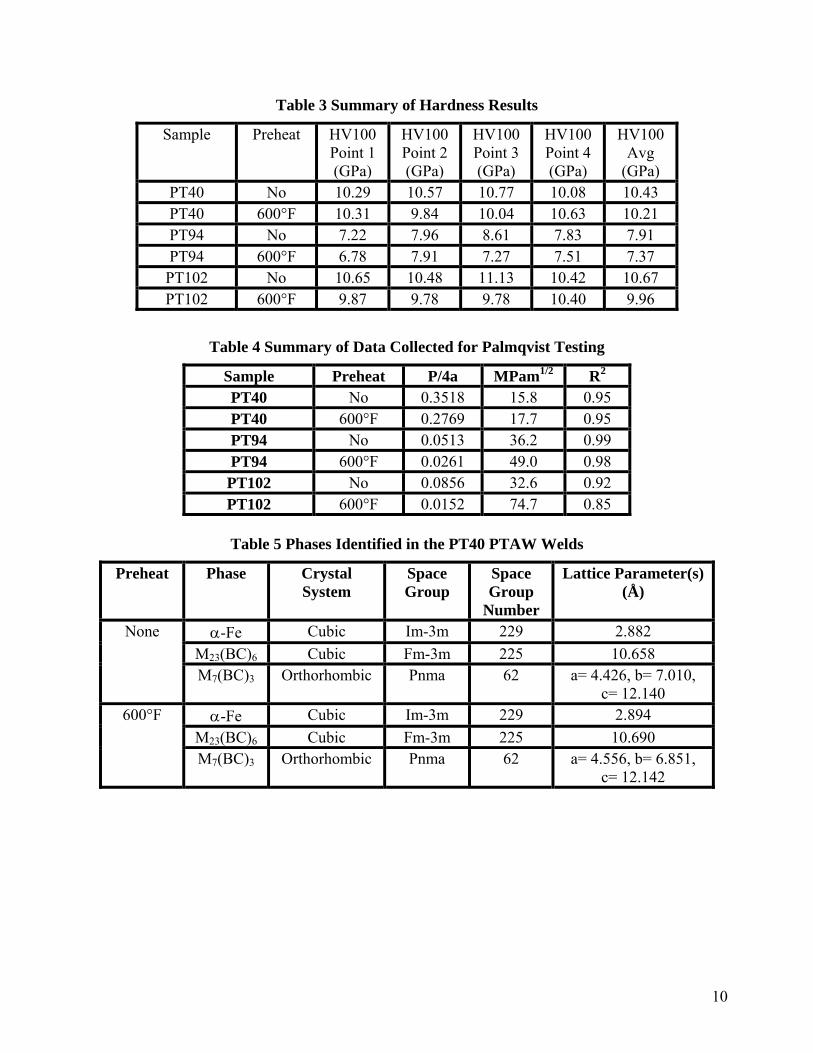
RESULTS Hardness Measurements For each weld sample, Rockwell C hardness was measured on the centerline of the linear welds and Vickers microhardness measurements were made across the cross section of the weld specimens. Each Vickers indentation was taken outside of the expected dilution zone with point 1 near the free surface and successive points taken in the weld toward the substrate (see Table 3). For all alloys, it was found that the 600°F preheat resulted in hardness levels which were from Rc 1 to 2 points or HV100 0.2 to 0.6 GPa lower than the sample welded without a preheat. Within experimental error, the hardness of the welds above the dilution layer (≈10%) was found to be pretty uniform with only small variations found. The PT94 welds were the softest of the three alloys with similar hardness levels in the mid Rc 64 to 66 range for the PT40 and the PT102 alloys. Fracture Toughness Measurements For each weld sample, a range of indentation loads were made based on the loads where cracks formed and where the cracks behaved within the Palmqvist regime. As described in the experimental procedure, the total crack length as a function of load was measured and the fracture toughness was computed using Shetty’s equation [9], which is;
( ) aPHK IC 4tan213
132 ⎟
⎟
⎠
⎞
⎜⎜
⎝
⎛
−=
ψππν, (4)
4
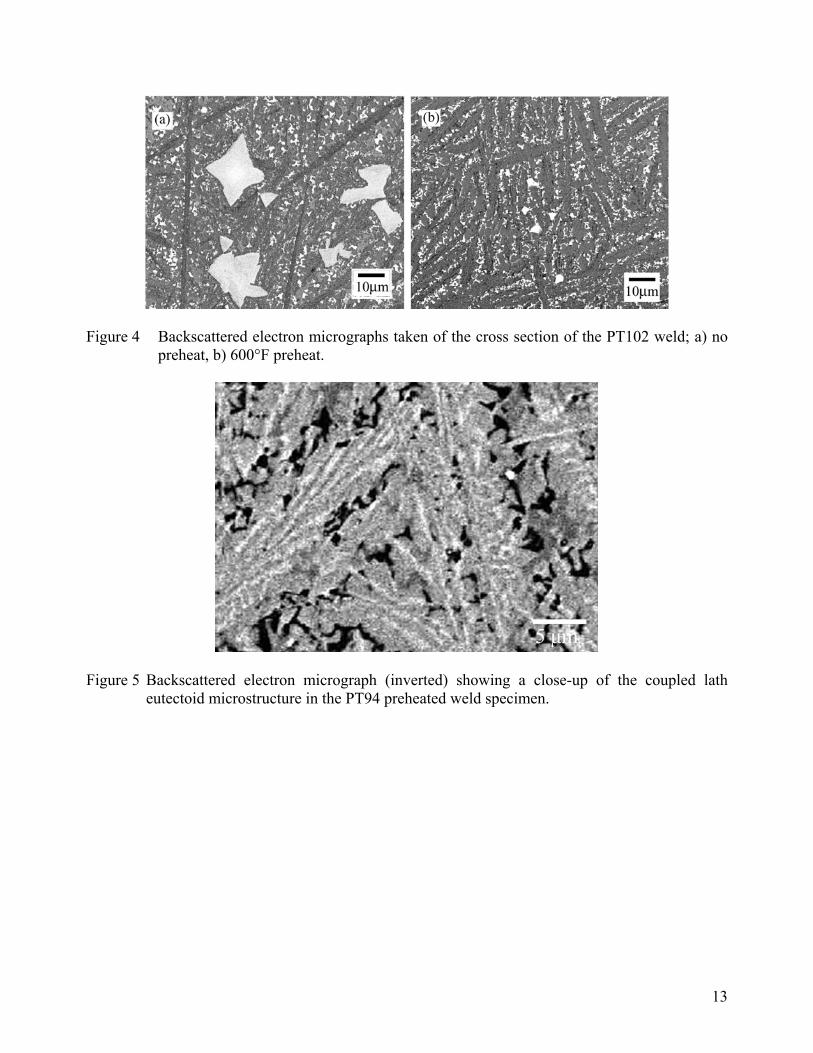
where ν is Poisson’s ratio (0.29 was used for these iron based alloys), ψ is the half-angle of the indenter (68° for the diamond indenter used), H is the hardness (the average HV100 number), P is the load and 4a is the total linear crack length. The quantity (P/4a) is defined as W, the crack resistance parameter, which is the inverse of the slope of the linear relation between crack length and load. After plotting the results, a linear least squares fit was computed in order to determine the slope and the corresponding R2 value to show the error in the linear fit. For each sample, a summary of the data taken and the computed fracture toughness is shown in Table 4. From the fracture toughness measurements, two trends are evident. First it is clear that higher toughness was achieved in the alloys welded with a preheat compared to those welded with no preheat. Secondly, the toughness varied widely in the three different alloys and the increase in toughness is consistent with the known increase in glass forming ability of the alloys. The fracture toughness of 74.7 MPam1/2 measured for the PT102 alloy welded with a preheat represents a very high value, especially in-lieu of its high hardness at Rc equal to 64. Microstructure SEM Analysis For the iron based hardfacing alloys developed, the microstructures are found to be extremely complex and a result of solidification of multicomponent compositions containing 8 to 10 alloying constituents. For each alloy and welding condition, DTA scans were performed from room temperature to the melting point. In these samples, no glass was found to be present, indicating that either solidification occurred outside the critical cooling regime for metallic glass formation, or crystallization occurred insitu due to the high temperature nature of the weld process. The microstructures of the PTAW welds of the PT40, PT94, and PT102 alloys welded with no preheat and with a 600°F preheat in shown in Figures 2, 3, and 4, respectively. In the PT40 alloy, very little difference in microstructure is found with respect to welding condition. In the PT94 and PT102 alloys welded with no preheat, large ≈10 µm cubic shaped precipitates are formed. Based on their size and cubic shape, it is clear that these are primary precipitates which formed first at high temperature in the liquid melt. When welded with the weld preheat, the primary carbides were not found anywhere in the cross section of the PT102 alloy and were generally reduced in volume fraction in the PT94 alloy. It is unclear why the preheat affects the formation of the primary precipitates but is probably related to the cooling conditions through specific elevated temperature regions where these primary phases form. While describing the evolution of these weld microstructures is complex, generally the PT40 sample matrix structure can be considered dendritic. The dendrites, which are believed to be α-Fe, can be seen in the PT40 sample which exhibits a spherically shape due to dendrite breakup during the weld process. In the PT94 and PT102 alloys, a much different matrix structure is found which can be classified as a coupled lath eutectoid microstructure. A close-up of the coupled lath eutectoid microconstituent is shown in Figure 5. The growth mechanism appears to be complex but would be analogous to the formation of lower bainite in conventional steels but obviously with different phases (see X-ray studies below) incorporated and thus different orientation relationships between the laths. Evidence exists in both the PT94 and PT102 weld samples, that primary dendrite formation may not have been entirely avoided as the there does exist a small volume fraction of
5
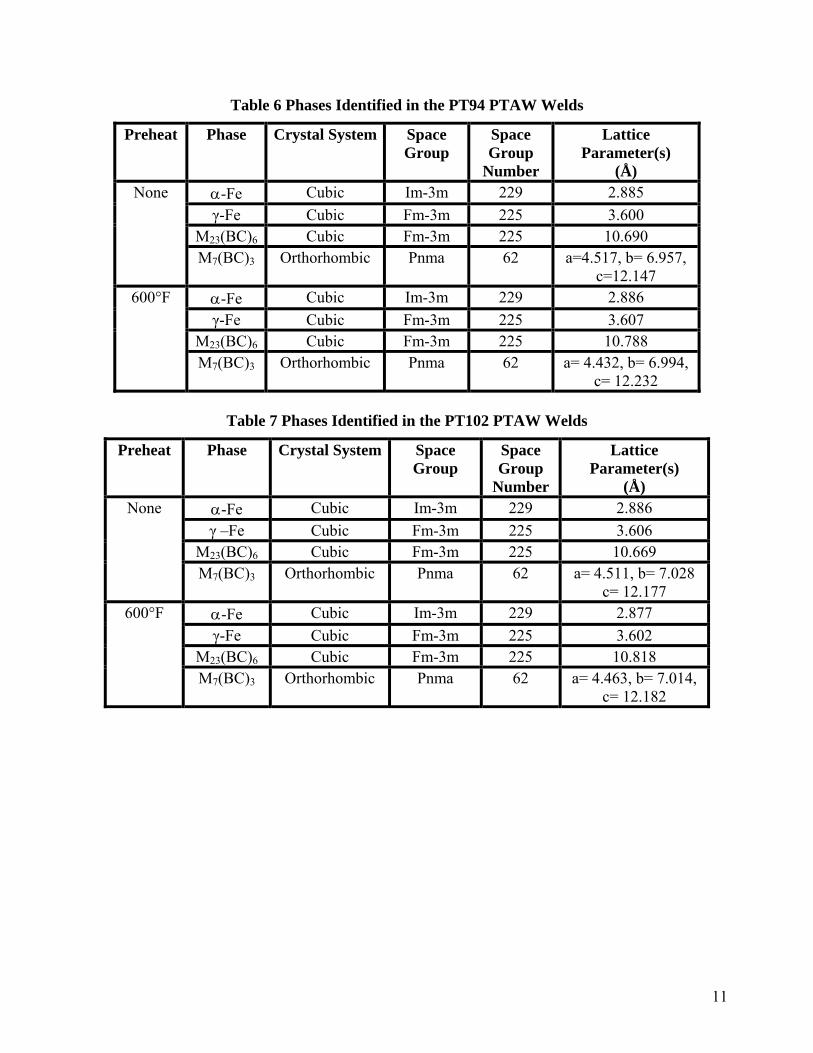
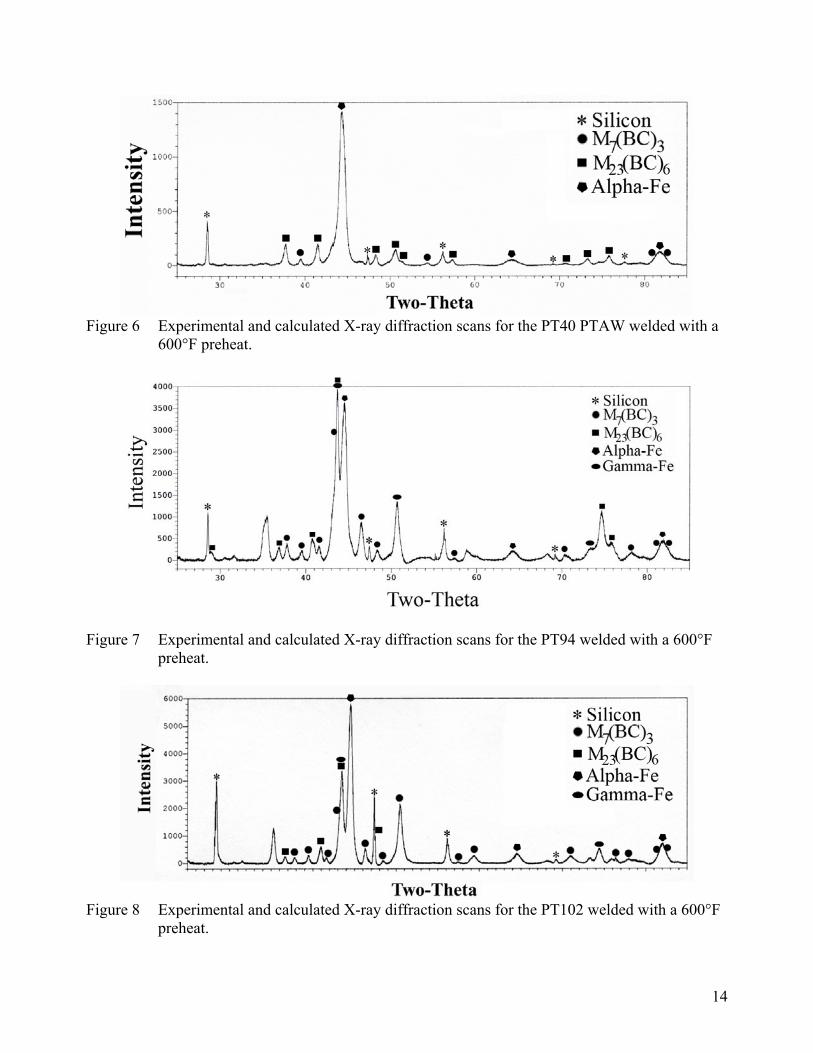
spherical phase (light grey) found in the microstructure. However, it is clear that the bulk of the microstructure transformed into a coupled lath eutectoid microconstituent with the remaining liquid and the last to solidify being enriched in transition metals (i.e. the white in the backscattered micrographs). X-Ray Diffraction To identify the phases in the all of welds, X-ray diffraction was used followed by Rietveldt refinement of the experimental patterns. The experimental and Rietveldt refined patterns are shown in Figures 6, 7, and 8 for the PT40, PT94, and PT102 PTAW alloys welded with a 600°F preheat respectively. The phases identified, their structure, and lattice parameters are shown in Tables 5, 6, and 7 for the no preheat and 600°F preheat PT40, PT94, and PT102 alloys respectively. Several interesting results are noted from the X-ray data. As expected, the body centered cubic α-Fe is found in all phases but also face centered cubic γ-iron is found in both the PT94 and PT102 PTAW samples. The presence of the γ-iron is perhaps not surprising for the PT94 alloy since the nickel added is known to be an austenite phase stabilizer. However, in the PT102 alloy, the niobium addition present in the PT102 alloy is not known as an austenite stabilizer. However, manganese and to a lesser extent silicon, tungsten, molybdenum, and chromium are known to stabilize the FCC form of iron. Thus, the stochastic nonequilibrium solidification found in the welds result in regions where elemental concentrations are such that austenite is stabilized. It is hypothesized that the spherical phases found in the PT94 and PT102 samples are representative of stable austenite dendrites which did not transform to ferrite upon cooling. In all of the samples, the carbide type phase exhibits either the M7C3 or the M23C6 structural prototype. Note that from previous studies [10-12] on this general class of compounds and also limited EDS analysis on these samples, it is clear that these carbide phases contains a considerable amount of boron. Thus, both of these phases can also be considered, perhaps more properly, as borocarbides phases. While the same borocarbides phases form in each of these alloys when PTAW welded, the lattice parameters change significantly as function of alloy and welding conditions which shows that the distribution of alloying elements contained within these phases is changing significantly.
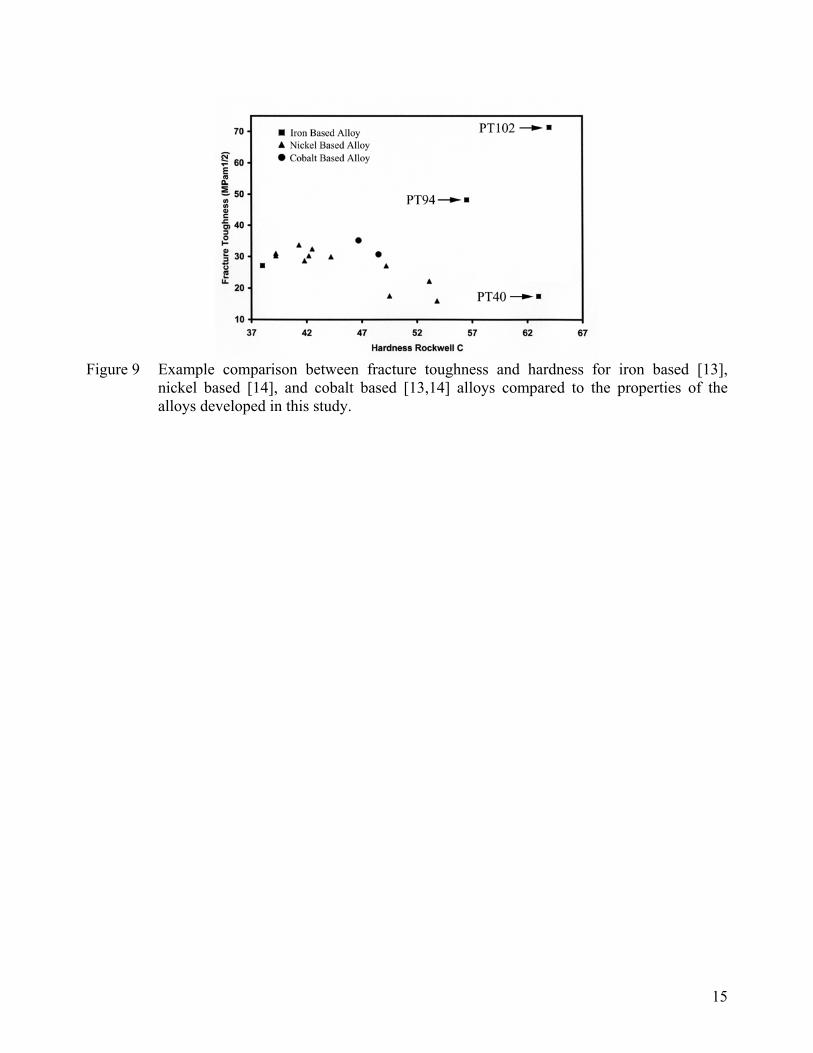
DISCUSSION The results of the property studies showed that the PTAW welds were developed with extraordinary combinations of hardness and toughness. In general, finding published toughness data for PTAW weld materials is difficult to find but there was extensive work done on a number of PTAW materials using notched compact tension specimens [13-14]. A comparison between fracture toughness and hardness for these published values of iron based, nickel based and cobalt based alloys compared to the properties of the alloys developed in this paper are shown in Figure 9. As shown, the PTAW alloys developed in this study are found to exhibit very high damage tolerance with superior combinations of hardness (i.e. abrasion resistance) and toughness. The reasons for these observed properties will be explored in the subsequent sections. Microstructural Development As shown by the DTA studies, none of these alloys showed any metallic glass content in the residual welds. The fact that glass is not present is not surprising since the PTAW welding process is a high temperature process and any glass that does form might be expected to crystallize. But this does bring up the question on the role of using glass forming alloys for PTAW welding since a
6
metallic glass was not ultimately present in the welds. The answer can be related to the achievement of the very fine micron / submicron (0.5 - 2 microns) lath eutectoid microconstituent. In the PT40 samples, a dendritic growth mechanism was observed which resulted in successive liquid enrichment of transition metals and the formation of interconnected regions of borocarbides phases which were several microns (2 to 10) in size. These borocarbide phases were clearly the last liquid to solidify and formed after the α-Fe dendrites. In the PT94 and PT102 alloys, while there was evidence that primary dendrite formation in the liquid was not entirely avoided, the bulk of the microstructure can be considered a coupled lath eutectoid. It is believed that the temperature regime and growth methodology of dendritic and coupled lath eutectoid structures is intrinsically different. If nucleation begins with small amount of undercooling, iron dendrites will form at high temperatures. However, if nucleation can be avoided by high undercoolings, then these proeutectic type iron phases can be avoided. It is believed that the suppression of nucleation to much lower temperatures was enabled by the increasing glass forming ability of the PT94 and PT104 alloys systems. In this case, the liquid / solid interface moves into a supercooled liquid regime, probably at low temperatures, which allowed the heat of fusion to be totally absorbed without any further barrier for continued solidification [15]. The growth mode apparently occurred through a coupled lath eutectoid mechanism by a solid solid state mechanism analogous to lower bainite formation in conventional steels. Note that the formation range of lower bainite in conventional steels, is generally found to be between 200°C and 600°C, depending on composition, and this temperature range gives a rough bound of the formation of the lath eutectoid [16]. Thus, the solid solid state transformation resulted in a refinement of the size of the borocarbides which formed from several microns in size in the PT40 alloy to less than 0.5 micron in size in the PT94 and PT102 alloys. Hardness In all samples, high macro and microhardness was obtained with Rc 57 to 66 and HV100 7.2 to 11.1 GPa respectively. This is generally significantly higher than what has been generated in other PTAW weld materials without incorporation of external hard phases such as WC. However, the development of high hardness is not surprising considering the microstructural studies showed that the microstructure contains high fractions of complex M7(BC)3 M23(BC)6 borocarbide phases typically around 60 to 70%. Note that the hardness in iron based glass forming alloys is influenced by a number of factors including the reduction in microstructural scale, the specific phases that form, and the supersaturation of the transition metal elements in the phases [17]. Toughness In hardfacing alloys, weld deposits are generally found to exhibit low tensile elongation since they generally contain high volume fractions of hard wear resistant phases such as carbides, borides, and silicides. However, significant fracture toughness can be developed in hardfacing alloys from a mechanism called Crack Bridging [13,14,18]. Crack Bridging can describe accurately the hardfacing toughness if the microstructure which is formed is the right scale (i.e. micron scale), is made up of high fractions of brittle phases, and the plastic zone size in front of a crack tip is insignificant. In Crack Bridging, the brittle matrix can be toughened through the incorporation of ductile phases which stretch, neck, and plastically deform in the presence of a propagating crack tip. Crack bridging toughening (∆Kcb) has been quantified in hardfacing materials according to the following relation; ∆Kcb=Ed[χVf(σ0/Ed)a0]1/2 where Ed is the modulus of the ductile phase, χ is the
7
work of rupture for the ductile phase, σ0 is the yield strength of the ductile phase, a0 is the radius of the ductile phase, and Vf is the volume fraction of ductile phase [14]. Note that in commercial alloys, coarse carbide particles are often physically mixed with the matrix powders which results in additional wetting issues between the carbide / matrix interface, which is an additional complicating issue which leads to low toughness. These wetting and debonding issues are not found in the PTAW alloys developed in this work since no carbides were added directly and all phases formed from either primary solidification in the liquid melt or from secondary precipitation during solidification from various types of transformations. The toughness measured in the welded microstructures can be generally described in the context of the Crack Bridging Model. As Table 4 indicates, it was found that the toughness increased in the preheated weld samples compared to the weld samples with no preheat. The smallest change measured was for the PT40 alloy which only increased insignificantly (1.9 MPam1/2) with weld preheat. This is consistent with the microstructure of the PT40 weld samples since they appeared to change little as a function of weld preheat. The main reason for the increases in toughness with weld preheat in the PT94 and PT102 samples appear to be the reduction / elimination of primary borocarbides in the microstructure. These large generally cubic shaped borocarbides can act as sites for crack nucleation and subsequent growth. When welding with a preheat, the formation of primary borocarbides is found to be reduced in the PT94 alloy and eliminated in the PT102 alloy. A significant increase in toughness was found for the PT94 and PT102 alloys compared to the PT40 alloy. One factor may be that both γ-Fe and α-Fe phases appear in the PT94 and PT102 alloys compared to only α-Fe in the PT40 alloy. Consistent with studies on a wide variety of cubic metals, due to the large number of closest packed slip systems, the fcc γ-Fe phase is expected to be more ductile and more effective at stopping crack propagation than the bcc α-Fe phase which is expected to exhibit higher strength and increase the work of rupture. However, the main factor allowing the development of very high toughness appears to be the change in microstructure arising from a dendritic growth mode in the PT40 alloy to a coupled lath eutectoid growth mode in the PT94 and PT102 alloys. Note that while the M23(BC)6 and M7(BC)3 borocarbide phases are found in all weld samples, the size of the borocarbides phases changes significantly with continuous networks of 2 to 10 µm borocarbides phases in the PT40 alloy but ∼0.5 µm isolated platelets in the PT94 and PT102 alloys. Furthermore, besides a general reduction in grain / phase size, the development of the lath eutectoid microstructure results in a uniform distribution of borocarbide platelets surrounded by micron sized ductile iron laths, which from the Palmqvist studies, appear to be especially potent for crack bridging. The overall reduction in average phase size would additionally contribute to the strengthening of the ductile phase and increasing the work of rupture during crack bridging since the strength will increase according to the conventional Hall-Petch relationship (σy ≈ kd1/2). Note that more detailed studies on the mechanism of crack bridging would need to be done using notched compact tension specimens [13,14]. This type of approach would reveal directly the dendrite necking during crack propagations and the associated crack pathway.
CONCLUSIONS In traditional PTAW alloys, high hardness / wear resistance is usually obtained from incorporating ceramic particles into a suitable binder to an amount necessary to wet and hold the ceramic phases sufficiently. In this paper, it was shown that PTAW alloys can be developed via a nontraditional route through designing alloys from the ground up, starting with uniform melts, and then changing
8
the nature of nucleation and growth to form high volume fractions of borocarbides phases insitu during solidification. High hardness is obtained from the refinement of the microstructural scale and from the presence of the high volume fraction (60 to 70%) of hard borocarbide phases, which are additionally supersaturated in key transition metal elements which can increase hardness of these phases significantly [11]. The coupled lath eutectoid growth mode found in PT94 and PT102 alloys is indicative that high undercooling was achieved prior to solidification resulting in the avoidance of primary dendrite formation and resulting rapid growth into a supercooled liquid. The unique coupled lath eutectoid structure appears to be key to obtaining high toughness. For PTAW hardfacing alloys, this new growth mode and microstructure may represent a breakthrough in the hardfacing regime allowing high hardness to be obtained while simultaneously developing very high toughness.
ACKNOWLEDGMENT This research was supported through Dr. Leo Christodoulou, Defense Science Office of the Defense Advanced Research Projects Agency (DARPA). This document has been approved for Public Release, Distribution Unlimited.
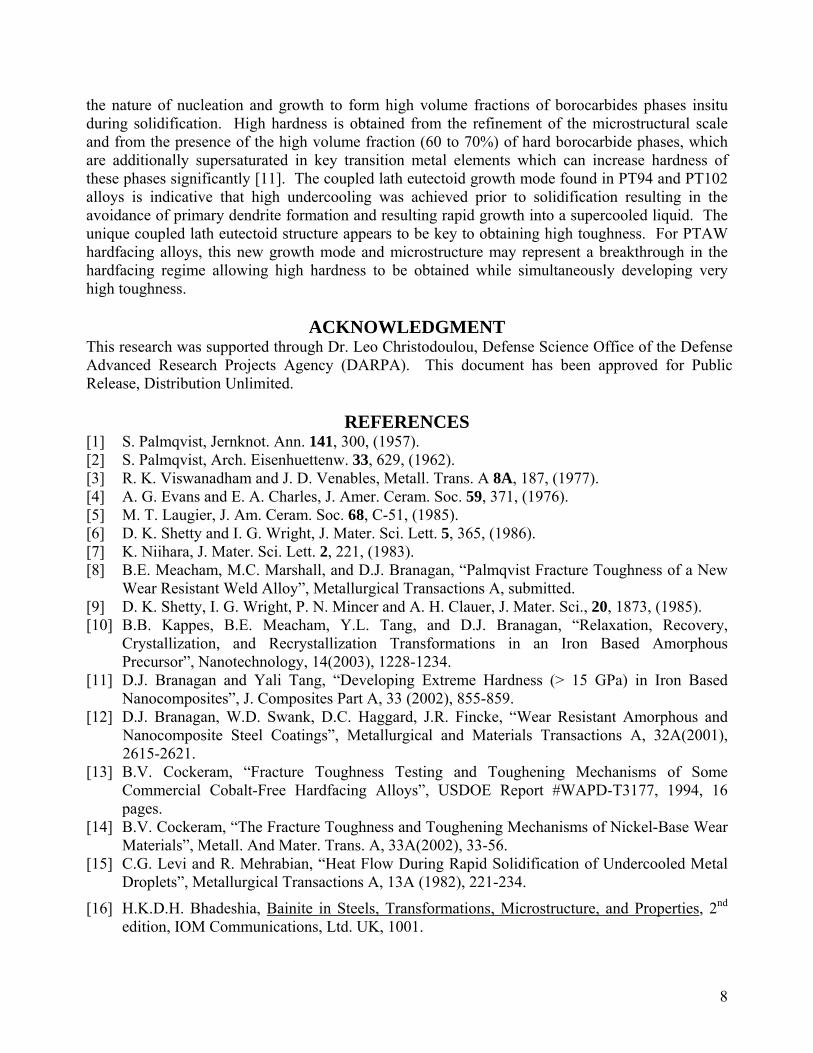
REFERENCES [1] S. Palmqvist, Jernknot. Ann. 141, 300, (1957). [2] S. Palmqvist, Arch. Eisenhuettenw. 33, 629, (1962). [3] R. K. Viswanadham and J. D. Venables, Metall. Trans. A 8A, 187, (1977). [4] A. G. Evans and E. A. Charles, J. Amer. Ceram. Soc. 59, 371, (1976). [5] M. T. Laugier, J. Am. Ceram. Soc. 68, C-51, (1985). [6] D. K. Shetty and I. G. Wright, J. Mater. Sci. Lett. 5, 365, (1986). [7] K. Niihara, J. Mater. Sci. Lett. 2, 221, (1983). [8] B.E. Meacham, M.C. Marshall, and D.J. Branagan, “Palmqvist Fracture Toughness of a New
Wear Resistant Weld Alloy”, Metallurgical Transactions A, submitted. [9] D. K. Shetty, I. G. Wright, P. N. Mincer and A. H. Clauer, J. Mater. Sci., 20, 1873, (1985). [10] B.B. Kappes, B.E. Meacham, Y.L. Tang, and D.J. Branagan, “Relaxation, Recovery,
Crystallization, and Recrystallization Transformations in an Iron Based Amorphous Precursor”, Nanotechnology, 14(2003), 1228-1234.
[11] D.J. Branagan and Yali Tang, “Developing Extreme Hardness (> 15 GPa) in Iron Based Nanocomposites”, J. Composites Part A, 33 (2002), 855-859.
[12] D.J. Branagan, W.D. Swank, D.C. Haggard, J.R. Fincke, “Wear Resistant Amorphous and Nanocomposite Steel Coatings”, Metallurgical and Materials Transactions A, 32A(2001), 2615-2621.
[13] B.V. Cockeram, “Fracture Toughness Testing and Toughening Mechanisms of Some Commercial Cobalt-Free Hardfacing Alloys”, USDOE Report #WAPD-T3177, 1994, 16 pages.
[14] B.V. Cockeram, “The Fracture Toughness and Toughening Mechanisms of Nickel-Base Wear Materials”, Metall. And Mater. Trans. A, 33A(2002), 33-56.
[15] C.G. Levi and R. Mehrabian, “Heat Flow During Rapid Solidification of Undercooled Metal Droplets”, Metallurgical Transactions A, 13A (1982), 221-234.
[16] H.K.D.H. Bhadeshia, Bainite in Steels, Transformations, Microstructure, and Properties, 2nd edition, IOM Communications, Ltd. UK, 1001.
9
[17] D.J. Branagan and Yali Tang, “Developing Extreme Hardness (> 15 GPa) in Iron Based Nanocomposites”, J. Composites Part A, 33 (2002), 855-859.
[18] M.F. Ashby, F.J. Blunt, and M.Bannister, “Flow Characteristics of Highly Contrained Metal Wires”, Acta Metall., 37(1989), 1847-1857.
Tables
Table 1 Designations / Alloy Compositions (Weight Percent)
Alloy Mn Cr Mo W B C Si Ni Nb Fe PT40 2.3 20.3 4.9 6.4 3.6 1.0 1.4 --- --- 60.1 PT94 2.1 18.6 4.5 5.9 3.3 0.9 1.3 4.7 3.7 55.0 PT102 2.2 19.6 4.8 6.2 3.4 0.9 1.4 --- 3.8 57.7
Table 2 Welding Parameters / Macrohardness
ALLOY PRE-HEAT
Weld Settings (A / V)
POWDER FD RATE (g/ min)
TRAVEL SPEED
IPM
Bead Height (inch)
Rc
PT40 NONE 200 / 30.5 29 2.0 0.130 65 PT40 600°F 200 / 30.5 29 2.0 0.128 64 PT94 NONE 174 / 27.8 29 1.8 0.142 58 PT94 600°F 174 / 27.8 29 1.8 0.127 57 PT102 NONE 175 / 27.8 29 1.8 0.114 66 PT102 600°F 175 / 27.8 29 1.8 0.100 64
10
Table 3 Summary of Hardness Results
Sample Preheat HV100 Point 1 (GPa)
HV100 Point 2 (GPa)
HV100 Point 3 (GPa)
HV100 Point 4 (GPa)
HV100 Avg
(GPa) PT40 No 10.29 10.57 10.77 10.08 10.43 PT40 600°F 10.31 9.84 10.04 10.63 10.21 PT94 No 7.22 7.96 8.61 7.83 7.91 PT94 600°F 6.78 7.91 7.27 7.51 7.37 PT102 No 10.65 10.48 11.13 10.42 10.67 PT102 600°F 9.87 9.78 9.78 10.40 9.96
Table 4 Summary of Data Collected for Palmqvist Testing
Sample Preheat P/4a MPam1/2 R2 PT40 No 0.3518 15.8 0.95 PT40 600°F 0.2769 17.7 0.95 PT94 No 0.0513 36.2 0.99 PT94 600°F 0.0261 49.0 0.98 PT102 No 0.0856 32.6 0.92 PT102 600°F 0.0152 74.7 0.85
Table 5 Phases Identified in the PT40 PTAW Welds
Preheat Phase Crystal System
Space Group
Space Group
Number
Lattice Parameter(s)(Å)
α-Fe Cubic Im-3m 229 2.882 M23(BC)6 Cubic Fm-3m 225 10.658
None
M7(BC)3 Orthorhombic Pnma 62 a= 4.426, b= 7.010, c= 12.140
α-Fe Cubic Im-3m 229 2.894 M23(BC)6 Cubic Fm-3m 225 10.690
600°F
M7(BC)3 Orthorhombic Pnma 62 a= 4.556, b= 6.851, c= 12.142
11
Table 6 Phases Identified in the PT94 PTAW Welds
Preheat Phase Crystal System Space Group
Space Group
Number
Lattice Parameter(s)
(Å) α-Fe Cubic Im-3m 229 2.885 γ-Fe Cubic Fm-3m 225 3.600
M23(BC)6 Cubic Fm-3m 225 10.690
None
M7(BC)3 Orthorhombic Pnma 62 a=4.517, b= 6.957, c=12.147
α-Fe Cubic Im-3m 229 2.886 γ-Fe Cubic Fm-3m 225 3.607
M23(BC)6 Cubic Fm-3m 225 10.788
600°F
M7(BC)3 Orthorhombic Pnma 62 a= 4.432, b= 6.994, c= 12.232
Table 7 Phases Identified in the PT102 PTAW Welds
Preheat Phase Crystal System Space Group
Space Group
Number
Lattice Parameter(s)
(Å) α-Fe Cubic Im-3m 229 2.886 γ –Fe Cubic Fm-3m 225 3.606
M23(BC)6 Cubic Fm-3m 225 10.669
None
M7(BC)3 Orthorhombic Pnma 62 a= 4.511, b= 7.028 c= 12.177
α-Fe Cubic Im-3m 229 2.877 γ-Fe Cubic Fm-3m 225 3.602
M23(BC)6 Cubic Fm-3m 225 10.818
600°F
M7(BC)3 Orthorhombic Pnma 62 a= 4.463, b= 7.014, c= 12.182
12
Figures
Figure 1 Typical linear bead weld specimen shown for the PT40 alloy. Note that the ground spot
can be seen where Rockwell hardness testing occurred.
Figure 2 Backscattered electron micrographs taken of the cross section of the PT40 weld; a) no
preheat, b) 600°F preheat.
Figure 3 Backscattered electron micrographs taken of the cross section of the PT94 weld; a) no
preheat, b) 600°F preheat.
13
Figure 4 Backscattered electron micrographs taken of the cross section of the PT102 weld; a) no
preheat, b) 600°F preheat.
Figure 5 Backscattered electron micrograph (inverted) showing a close-up of the coupled lath eutectoid microstructure in the PT94 preheated weld specimen.
14
Figure 6 Experimental and calculated X-ray diffraction scans for the PT40 PTAW welded with a
600°F preheat.
Figure 7 Experimental and calculated X-ray diffraction scans for the PT94 welded with a 600°F
preheat.
Figure 8 Experimental and calculated X-ray diffraction scans for the PT102 welded with a 600°F
preheat.
15
Figure 9 Example comparison between fracture toughness and hardness for iron based [13],
nickel based [14], and cobalt based [13,14] alloys compared to the properties of the alloys developed in this study.