Embed Size (px)
Citation preview
High Voltage Laboratory
High Voltage Technique Experiments
Asst. Prof. Dr. Suna BOLAT , Narges SABETI
3/30/2015
Eastern Mediterranean University, Department of Electrical and Electronics Engineering Gazimağusa, North Cyprus
1
TABLE OF CONTENT
INTRODUCTION .................................................................................................................................3
1 Safety Regulations For High Voltage Laboratories .........................................................................3
2 Fencing ........................................................................................................................................3
3 Safety-Locking .............................................................................................................................3
4 Earthing .......................................................................................................................................3
5 Circuit and High-Voltage Construction Kit .....................................................................................4
6 Fundamental Rule ........................................................................................................................5
7 Mode Of Action In The Case Of An Electrical Accident ...................................................................5
1 Electrolytic Tank Experiment (Mapping electric fields) ..................................................................6
1.1 General Information ........................................................................................................................ 6
1.2 Graphical Method............................................................................................................................ 6
1.3 Analogy between static electric field and stationary current field ................................................. 7
1.4 Electrolytic Tank .............................................................................................................................. 8
1.5 Experimental setup and principles .................................................................................................. 8
2 Measurement of High Voltage .................................................................................................... 11
2.1 Measurement with sphere gaps.................................................................................................... 11
2.2 Factors effecting measurement with sphere gaps ........................................................................ 12
2.3 Experiment .................................................................................................................................... 14
3 Observing Electrical Discharges .................................................................................................. 16
3.1 General information ...................................................................................................................... 16
3.2 Experiment .................................................................................................................................... 17
3.3 Questions ....................................................................................................................................... 18
4 Impulse Voltages and Impulse Voltage Generator ....................................................................... 19
4.1 Impulse Voltages ........................................................................................................................... 19
2
4.2 Characteristics of Impulse Voltage ................................................................................................ 19
4.3 Single Stage Impulse voltage generator ........................................................................................ 20
4.4 Experiment .................................................................................................................................... 20
4.5 Questions ....................................................................................................................................... 21
5 Insulating Oils for Transformers ................................................................................................. 22
5.1 Electrical properties of liquid insulators........................................................................................ 22
5.2 Aim of the experiment .................................................................................................................. 24
5.3 Preparation of the oil sample ........................................................................................................ 24
5.4 Experiment .................................................................................................................................... 24
5.5 Questions ....................................................................................................................................... 24
3
INTRODUCTION
1 Safety Regulations For High Voltage Laboratories
Any voltage greater than 250 V against earth is said to be a high voltage. High voltage experiments could become particularly hazardous for the participants if the safety precautions are not adequate. Therefore the appropriate safety regulations should be taken in order to prevent risk to persons as far as possible. Everyone working in the laboratory, worker, researchers, students should be observant and careful.
The equipment for fencing, earthing and shielding research laboratories for high voltages is intended to prevent risk to persons, installations and apparatus. At the same time undisturbed measurement of rapidly varying phenomena should be ensured and undesirable mutual interference between the experimental setup and the environment avoided.
2 Fencing
The actual danger zone of the high-voltage circuit must be protected from unintentional entry by walls or metallic fences. Simple barrier-chains or the identification of the danger zone solely by warning signs can be considered sufficient only where their observation can be constantly supervised. Entrances to the danger zone should be provided with locks which effect automatic switch-off.
Visible metallic connection with earth must be established before the high-voltage elements are touched. In the case of smaller experimental setups, such as a practical, this can be done before entering the setup with the help of insulated rods introduced through the fencing mesh, and which establish the ground connection inside. In larger setups placing the earthing rod should be the first action after entering the danger zone, or automatic earthing switches should be provided. Complete earthing is especially important when the circuit contains capacitors charged by direct voltage.
When setting up the fences for voltages up to 1 MV the following minimum clearances to the components at highvoltage should not be reduced:
for alternating and direct voltages 50 cm for every 100 kV
for impulse voltages 20 cm for every 100 kV
The fences should be reliably connected with one another conductively, earthed and provided with warning boards inscribed: "High-voltage! Caution! Highly dangerous!" It is forbidden to introduce conductive objects through the fence whilst the setup is in use.
3 Safety-Locking
In high-voltage setups each door must be provided with safety switches; these allow the door to be
opened only when all the main leads to the test setup are interrupted.
Instead of direct interruption, the safety switches may also operate the no-voltage relay of a power circuit breaker, which, on opening the door, interrupts all the main leads to the setup. These power circuit breakers may only be switched on again when the door is closed. For direct supply from a high-voltage network (e.g. 10 kV city network), the main leads must be interrupted visibly before entry to the setup by an additional open isolating switch. The switched condition of a setup must be indicated by a red lamp "Setup switched on" and by a green lamp "Setup switched off".
4 Earthing
Apart from the obvious measures to guarantee reliable earth connections for steady working conditions,
one must remember that rapid voltage and current variations can occur during high-voltage
experiments as a result of breakdown processes. In consequence, transient currents appear in the earth
4
connections and these can cause potential differences of the same order of magnitude as the applied
test voltages.
A high-voltage setup may be entered only when all the parts which can assume high-voltage in the
contact zone are earthed. Earthing may only be effected by a conductor earthed inside the fence. Fixing
the earthing leads onto the parts to be earthed should be done with the aid of insulating rods.
5 Circuit and High-Voltage Construction Kit
The setup is supplied from ready wired desks to the high-voltage transformers and arranged at an easily identifiable position outside the fence. Measuring cable, control cable, supply cable, must be laid inside the setup in earthed sleeving. All components of the setup must be either rigidly fixed or suspended so that they cannot topple during operation or be pulled down by the leads.
For all setups intended for research purposes, a circuit diagram shall be fixed outside the fence in a clearly visible position.
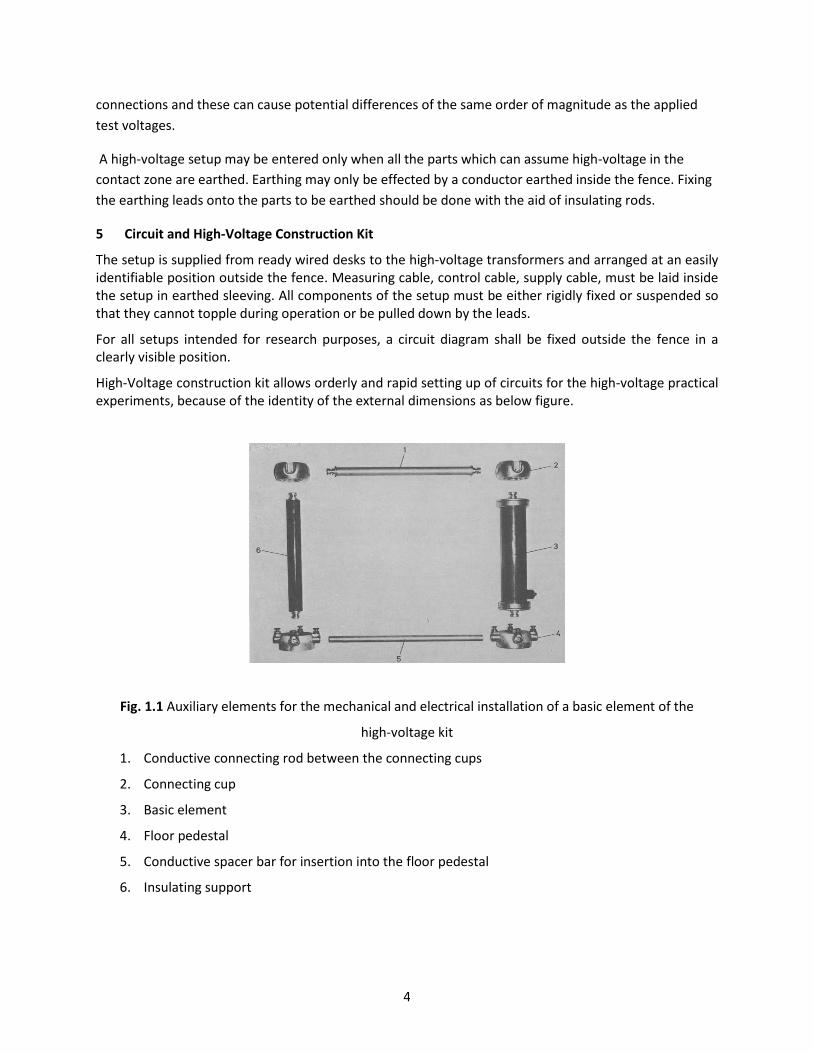
High-Voltage construction kit allows orderly and rapid setting up of circuits for the high-voltage practical experiments, because of the identity of the external dimensions as below figure.
Fig. 1.1 Auxiliary elements for the mechanical and electrical installation of a basic element of the
high-voltage kit
1. Conductive connecting rod between the connecting cups
2. Connecting cup
3. Basic element
4. Floor pedestal
5. Conductive spacer bar for insertion into the floor pedestal
6. Insulating support
5
6 Fundamental Rule
Everyone carrying out experiments in the laboratory is personally responsible for the setup placed at his disposal and for the experiments performed with it. A test setup may be put into operation only after the circuit has been checked and permission to begin work given by an authorized person. For experiments during working hours one should try, in the interest of personal safety, to make sure that a second person is present in the room.
Before entering a high-voltage setup everyone must convince himself by personal observation that all the conductors which can assume high potential and lie in the contact zone are earthed, and that all the main leads are interrupted.
In experiments with oil and other easily inflammable materials, special care is necessary owing to the danger of explosion and fire. In each room where work is carried out with these materials, suitable fire extinguishers must be to hand, ready for use.
7 Mode Of Action In The Case Of An Electrical Accident
1. Switch off the setup on all poles. So long as this has not been done, the victim of the accident should not be touched under any circumstances.
2. If the victim is unconscious, notify the life-saving service at once: Telephone ... : Immediate attempts to restore respiration by artificial respiration, mouth-to-mouth respiration or chest massage! These measures must be continued, if necessary, up to the beginning of an operation. (Only 6 to 8 minutes time before direct heart massage!)
3. Even during accidents with no unconsciousness, it is recommended that the victim lie quietly and a doctor's advice be sought.
6
Experiment No.1
1 ELECTROLYTIC TANK EXPERIMENT (MAPPING ELECTRIC FIELDS)
1.1 General Information
In order to obtain a cost-effective insulation system, it is very important to have electric field distribution of the medium. Electric strength of an insulating material determines the value of the field strength which is just permissible under given conditions such as voltage type, stress duration, temperature or electrode curvature. In the case electric field intensity exceeds a critical value, electric strength of an insulating medium is. For this reason the determination of the prevailing maximum field strength is of great practical significance.
A stationary test charge, q0 experiences an electric force, F in the vicinity of an electric field, E. E and F are vectorial quantities and the relationship between them is given by
E = F q0
q0 is assumed to be positive and very small. E and F are always in the same direction. Electric field lines are imaginary lines used to visualize electric fields. The lines always leave positive charges and enter negative charges. They are closer together where the field is stronger and they never cross. The lines indicated the direction of the force acting on a test charge placed at that point. If a positive test charge is released in an electric field it will move away from the positive side of the field toward the negative side. The field will do work on the charge as it moves from point A to point B according to
Since the electric force is a conservative force, there will also be a change in potential energy,
ΔU = -W
The change in potential energy per unit charge is a scalar quantity called the electric potential, V. Electric potential is always measured between two points. In any field there exists a set of points between which there is no potential difference. A set of such points will make up an equipotential surface. This surface is always perpendicular to the electric field. In other words, when F and ds are perpendicular, θ equals π/2 and cosθ equals zero. No work is done moving a charge along such a surface. Electric potential, or voltage, is easily measured. This phenomenon can be used to map an electric field.
In symmetrical electrode configurations, field distribution can be analyzed using mathematical methods. However, in the case there is no definite symmetry, graphical or experimental methods are preferred.
1.2 Graphical Method
The path of the electric field lines is determined by the direction of the electric field strength E. They are orthogonal to the equipotential lines at any point and hence perpendicular to metal electrode surfaces. Under the condition that no surface charges exist (in the boundary area between two dielectrics, the normal components of the field strengths are inversely proportional to the dielectric constants of the insulating materials. On the other hand, the tangential component of the electric field strength is continuous along the boundary.
7
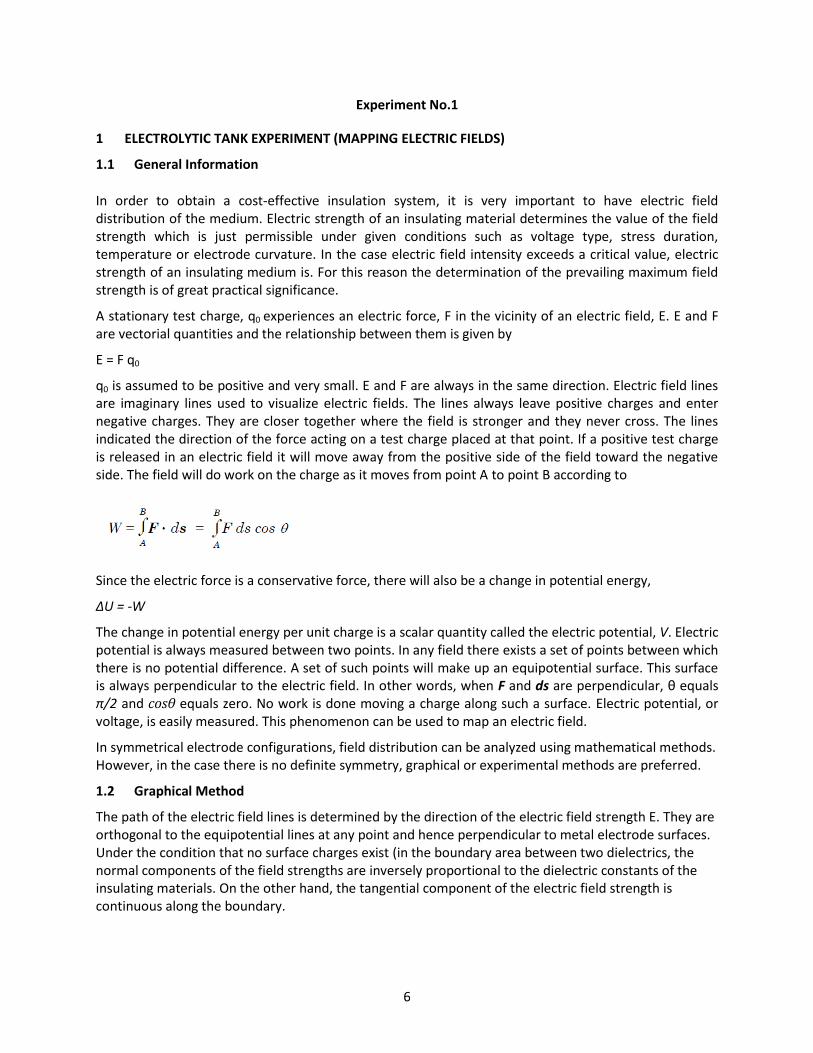
For the case of two-dimensional fields, the field plot can often be obtained graphically with sufficient accuracy. The method is based upon the principle that the equipotential lines and the field lines are estimated first and then the field plot is corrected step-by- step by applying the fundamental electrostatic field laws. Those areas enclosed by adjacent field lines have the same electric flux Δ𝑄 = 𝑏 𝑙 휀𝑟 휀0 𝐸, where 𝑙 is the extension of the configuration perpendicular to the plane of the paper and 휀𝑟 휀0 = 휀 the dielectric constant of the dielectric medium.
If the constant potential difference between two neighboring equipotential lines is substituted for E, ∆∅ = 𝐸 𝑎, the following condition results:
휀𝑟
𝑏
𝑎= 𝑘
The constant k can be chosen arbitrarily. In the example shown, it is assumed that b/a = 1. Let the spacing between two neighboring equipotential lines be a1 at any point, then the electric field strength at that point is given by:
𝐸1 =∆∅
𝑎1
If m is the number of equipotential lines drawn (not counting the electrode surfaces), the total applied voltage is
𝑈 = (𝑚 + 1)∆∅
If the number of field lines drawn between the electrodes is n, the total electric flux is given by:
Δ𝑄 = 𝑏 𝑙 휀𝑟 휀0 𝐸,
and the capacitance becomes:
𝐶 =𝑄
𝑈=
𝑛
𝑚 + 1휀0 𝑘 𝑙
1.3 Analogy between static electric field and stationary current field
In this experiment, the analogy between static electric field and stationary current field is used.
Static electric field Stationary current field
= 휀 𝐽 = 𝜅
𝑄 = ∮ 𝑑𝑠 𝐼 = ∮ 𝑑𝑠
𝐶 =𝑄
𝑈 𝐺 =
1
𝑅=
𝐼
𝑈
If the environment between electrodes is isotropic, self-conductivity and dielectric coefficient are constant, therefore current density, J (in stationary current field); and electric field, E and electric flux density, D (in static electric field) will be in the same direction. Thus, current density and electric field
8
lines overlap. This means, in an electrode system, if a conducting material is placed instead of dielectric between electrodes, equipotential lines will remain the same. For that reason, by electrolytic tank method, equipotential lines are determined after that current density lines i.e. electric field lines can be determined by using electric field lines and equipotential lines are orthogonal (always perpendicular).
1.4 Electrolytic Tank
This method has been widely used for decades. Equipotential boundaries are represented in the tank by specially formed sheets of metal. For example, a single dielectric problem such as a three-core cable may be represented using a flat tank different permittivities are represented by electrolytes of different conductivities separated by special partitions. Otherwise, the tank base can be specially shaped. The conductance of the entire model is a scaled model of the capacitance of the system being represented, care being taken to minimize the errors.
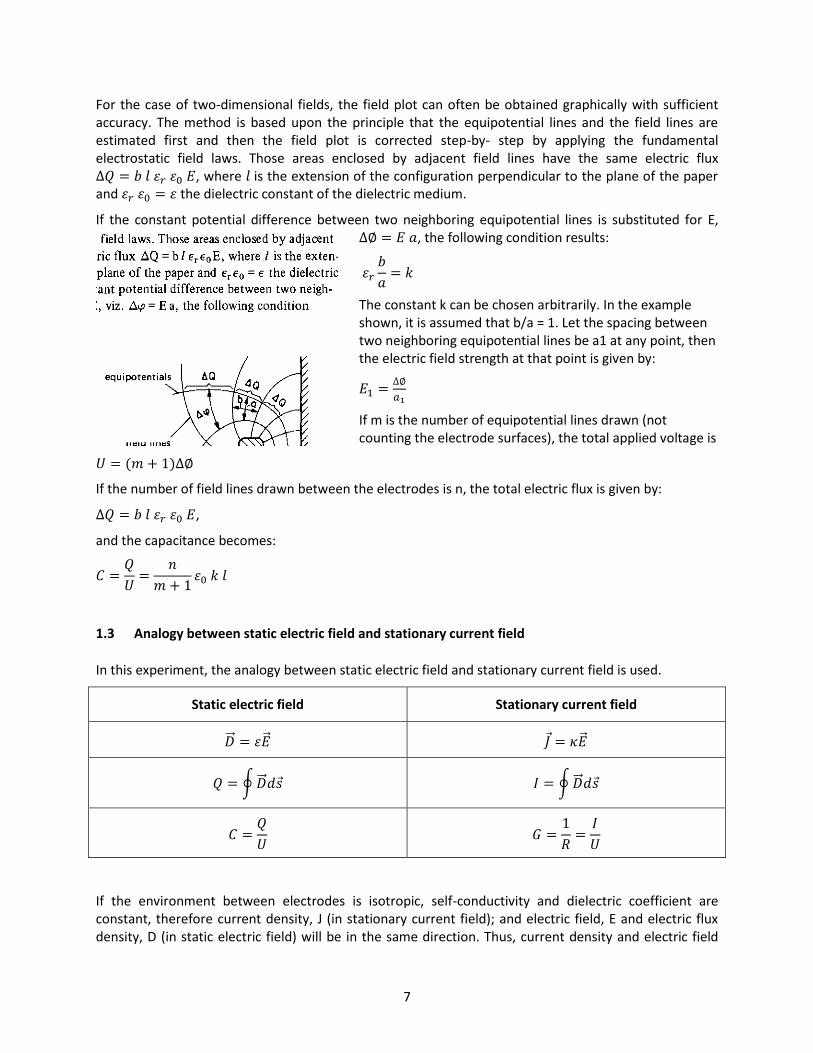
1.5 Experimental setup and principles
Principle: static electric field has an analogy with current field.
To voltage source
Current lines Flux lines analogy
U
R1
A
R2
~ A A
Model
electrodes
Ammeter
Probe
Model
electrodes
Electrolitic
liquid (?)
9
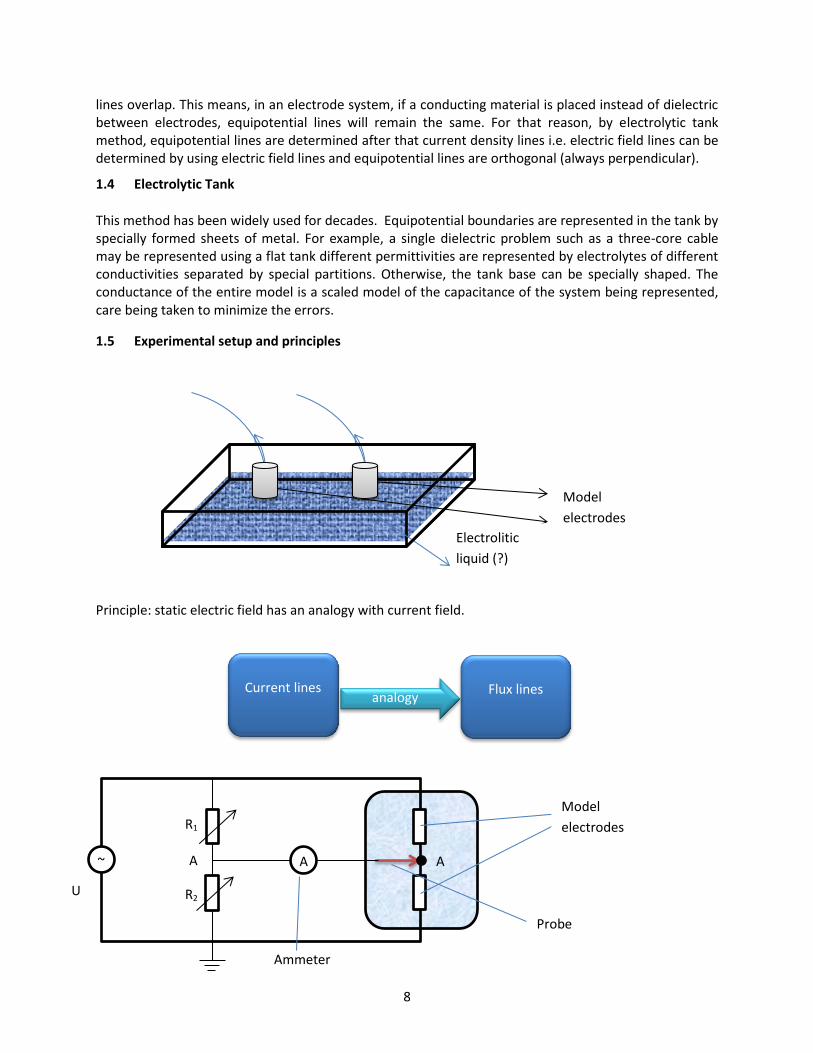
Bridge measurement
Electric field and equipotential lines with two different electrodes configuration
R3
𝐼 =𝑉𝐴 − 𝑉𝐵
𝑟𝐴
rA
R1
A
R4 R2
VA VB
R1
A
R2
U
𝑉𝐴 = 𝑉𝐴 → 𝐼 = 0
In case of balance:
Current through
ampermeter
𝐼 =𝑈
𝑅1 + 𝑅2
𝑈2 = 𝐼𝑅2 =𝑅2
𝑅1 + 𝑅2𝑈 = 𝑈𝐴
10
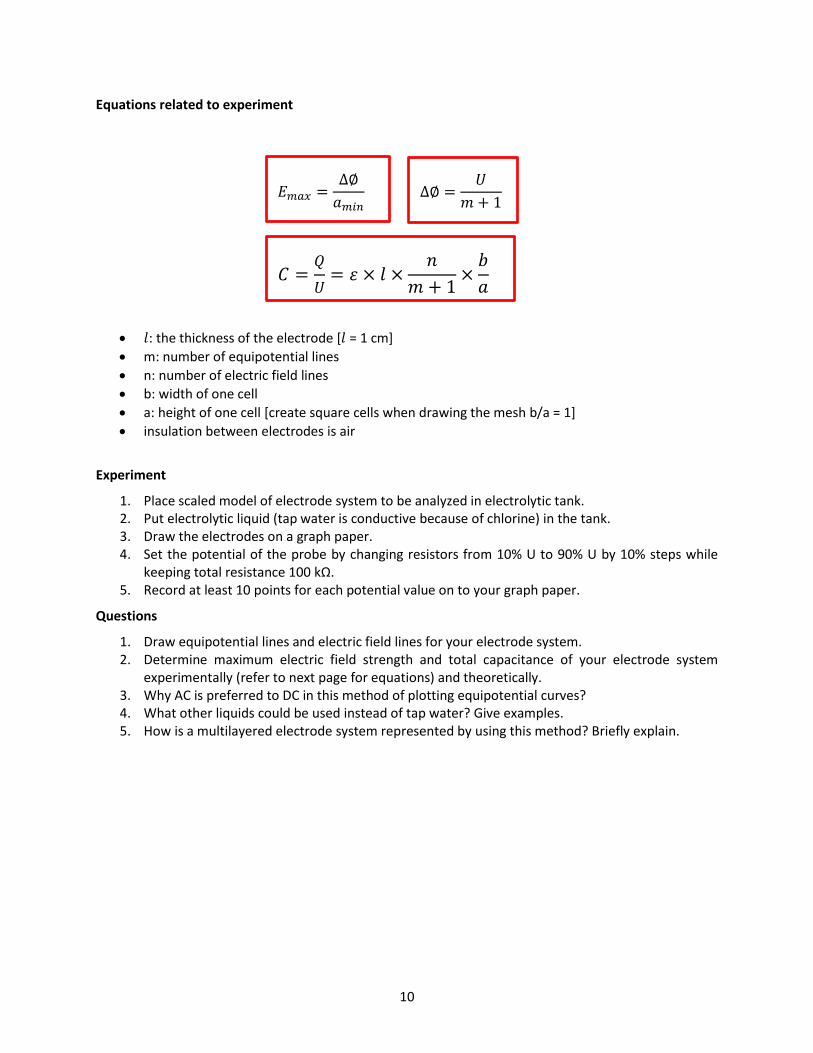
Equations related to experiment
𝑙: the thickness of the electrode [𝑙 = 1 cm]
m: number of equipotential lines
n: number of electric field lines
b: width of one cell
a: height of one cell [create square cells when drawing the mesh b/a = 1]
insulation between electrodes is air
Experiment
1. Place scaled model of electrode system to be analyzed in electrolytic tank. 2. Put electrolytic liquid (tap water is conductive because of chlorine) in the tank. 3. Draw the electrodes on a graph paper. 4. Set the potential of the probe by changing resistors from 10% U to 90% U by 10% steps while
keeping total resistance 100 kΩ. 5. Record at least 10 points for each potential value on to your graph paper.
Questions
1. Draw equipotential lines and electric field lines for your electrode system. 2. Determine maximum electric field strength and total capacitance of your electrode system
experimentally (refer to next page for equations) and theoretically. 3. Why AC is preferred to DC in this method of plotting equipotential curves? 4. What other liquids could be used instead of tap water? Give examples. 5. How is a multilayered electrode system represented by using this method? Briefly explain.
∆∅ =𝑈
𝑚 + 1
𝐸𝑚𝑎𝑥 =∆∅
𝑎𝑚𝑖𝑛
𝐶 =𝑄
𝑈= 휀 × 𝑙 ×
𝑛
𝑚 + 1×
𝑏
𝑎
11
Experiment No. 2
2 MEASUREMENT OF HIGH VOLTAGE
High voltage can be measured in a variety of ways such as capacitive voltage divider, electrostatic instruments and by using breakdown voltage of a sphere gap. Direct measurement of high voltage is possible up to about 200 kV and several forms of voltmeters have been devised which can be connected directly across the test circuit. The spark over of sphere gaps and other gaps also are used especially in the calibration of meters in high voltage measurements.
Direct measurement of High Voltages
Electrostatic voltmeters.
Sphere gaps.
2.1 Measurement with sphere gaps
The sphere gap method of measuring high voltage is one of the most reliable methods and it is used as the standard method for calibration purposes.
In fact this method is used due to below reasons:
Structure is easy.
Accuracy is high enough.
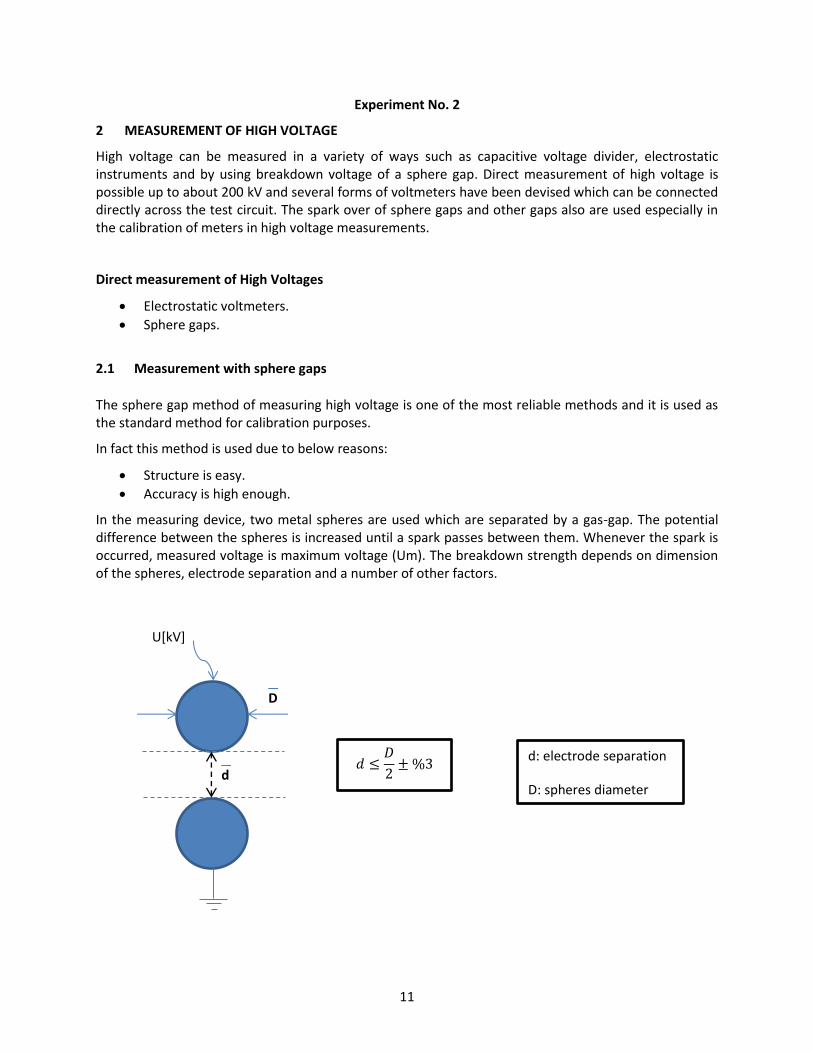
In the measuring device, two metal spheres are used which are separated by a gas-gap. The potential difference between the spheres is increased until a spark passes between them. Whenever the spark is occurred, measured voltage is maximum voltage (Um). The breakdown strength depends on dimension of the spheres, electrode separation and a number of other factors.
D
d
U[kV]
𝑑 ≤𝐷
2± %3
d: electrode separation
D: spheres diameter
12
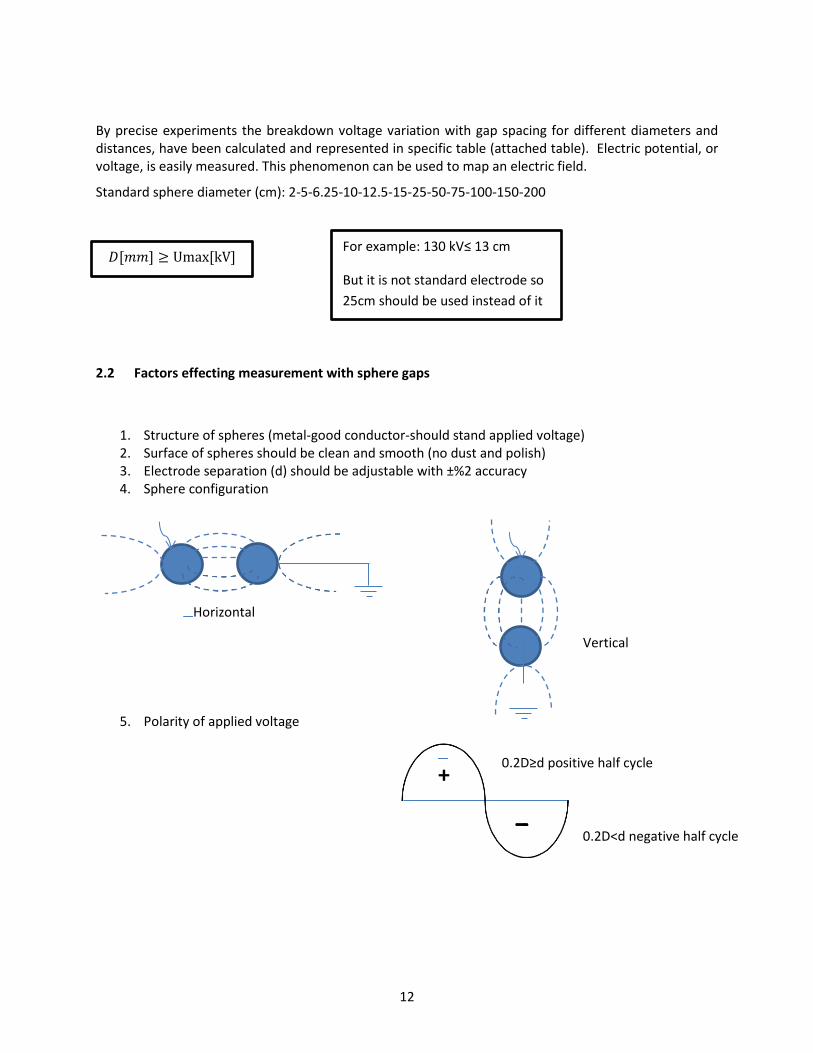
By precise experiments the breakdown voltage variation with gap spacing for different diameters and distances, have been calculated and represented in specific table (attached table). Electric potential, or voltage, is easily measured. This phenomenon can be used to map an electric field.
Standard sphere diameter (cm): 2-5-6.25-10-12.5-15-25-50-75-100-150-200
2.2 Factors effecting measurement with sphere gaps
1. Structure of spheres (metal-good conductor-should stand applied voltage) 2. Surface of spheres should be clean and smooth (no dust and polish) 3. Electrode separation (d) should be adjustable with ±%2 accuracy 4. Sphere configuration
5. Polarity of applied voltage
𝐷[𝑚𝑚] ≥ Umax[kV]
For example: 130 kV≤ 13 cm
But it is not standard electrode so
25cm should be used instead of it
Horizontal
Vertical
0.2D≥d positive half cycle
0.2D˂d negative half cycle
+
-
13
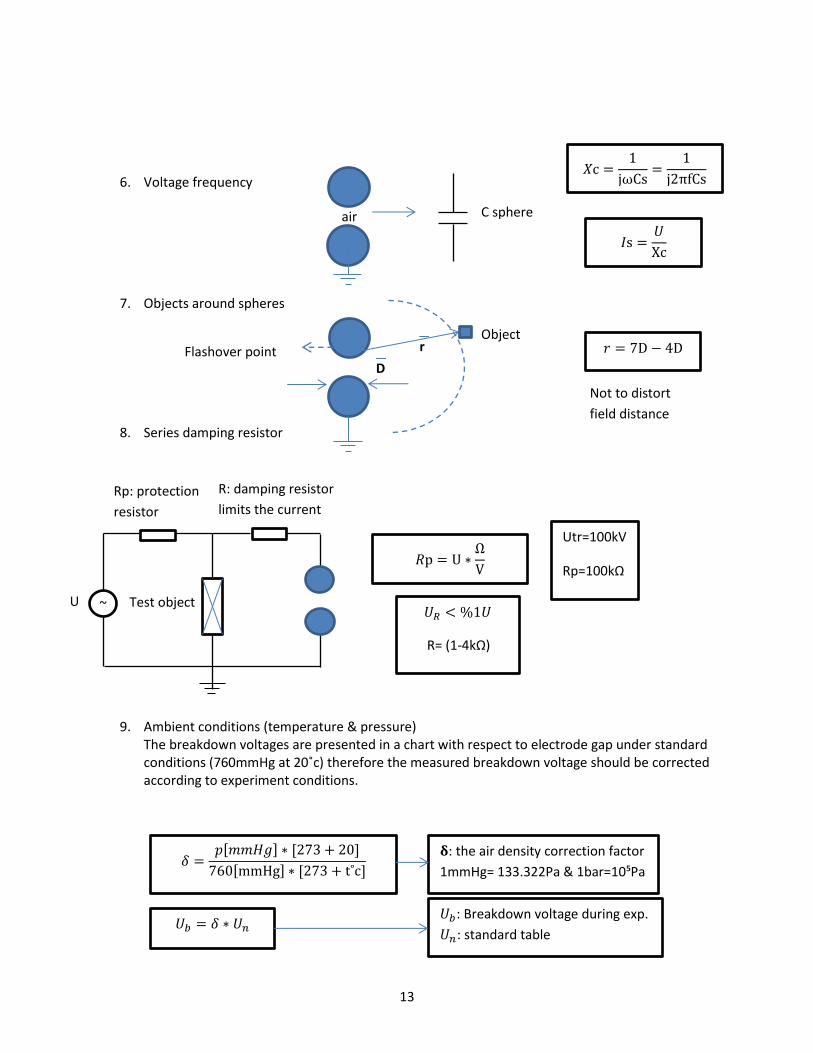
6. Voltage frequency
7. Objects around spheres
8. Series damping resistor
9. Ambient conditions (temperature & pressure) The breakdown voltages are presented in a chart with respect to electrode gap under standard conditions (760mmHg at 20˚c) therefore the measured breakdown voltage should be corrected according to experiment conditions.
U Test object
air
𝑋c =1
jωCs=
1
j2πfCs
𝐼s =𝑈
Xc
C sphere
D
r Object
Flashover point 𝑟 = 7D − 4D
Not to distort
field distance
Rp: protection
resistor
R: damping resistor
limits the current
𝑅p = U ∗
Ω
V
Utr=100kV
Rp=100kΩ
𝑈𝑅 < %1𝑈
R= (1-4kΩ)
𝛿 =𝑝[𝑚𝑚𝐻𝑔] ∗ [273 + 20]
760[mmHg] ∗ [273 + t˚c]
𝛅: the air density correction factor
1mmHg= 133.322Pa & 1bar=10⁵Pa
𝑈𝑏 = 𝛿 ∗ 𝑈𝑛
𝑈𝑏: Breakdown voltage during exp.
𝑈𝑛: standard table
~
14
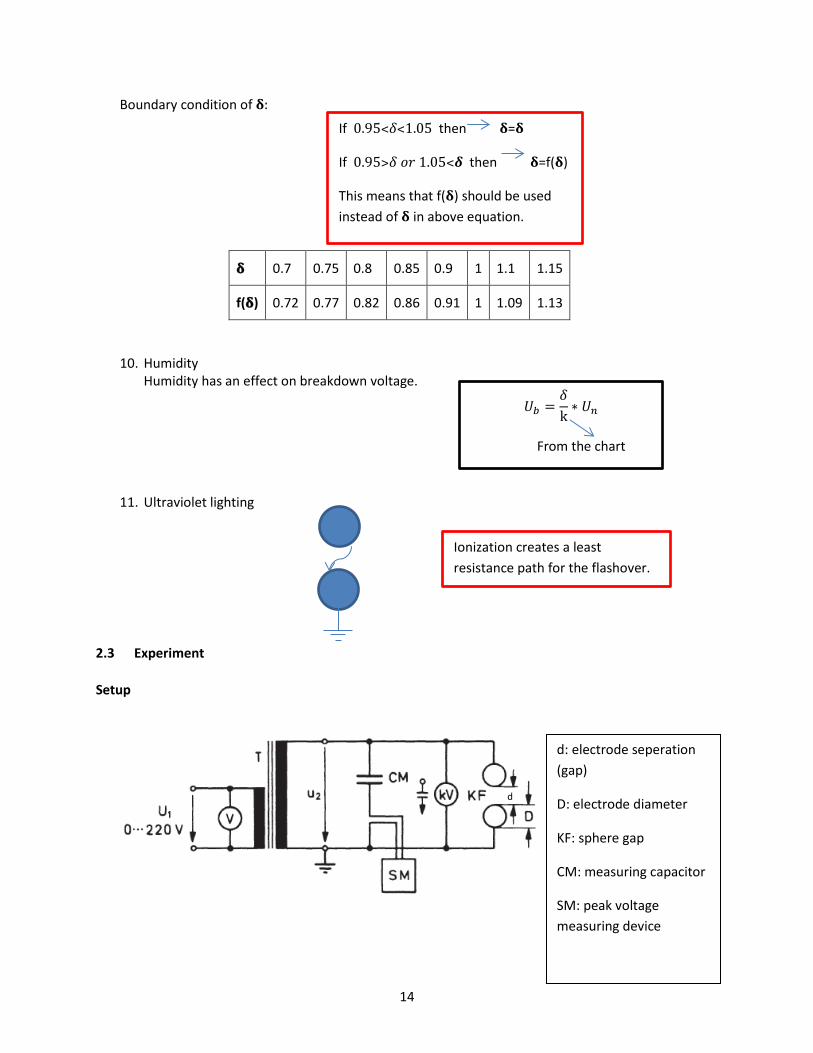
Boundary condition of 𝛅:
𝛅 0.7 0.75 0.8 0.85 0.9 1 1.1 1.15
f(𝛅) 0.72 0.77 0.82 0.86 0.91 1 1.09 1.13
10. Humidity Humidity has an effect on breakdown voltage.
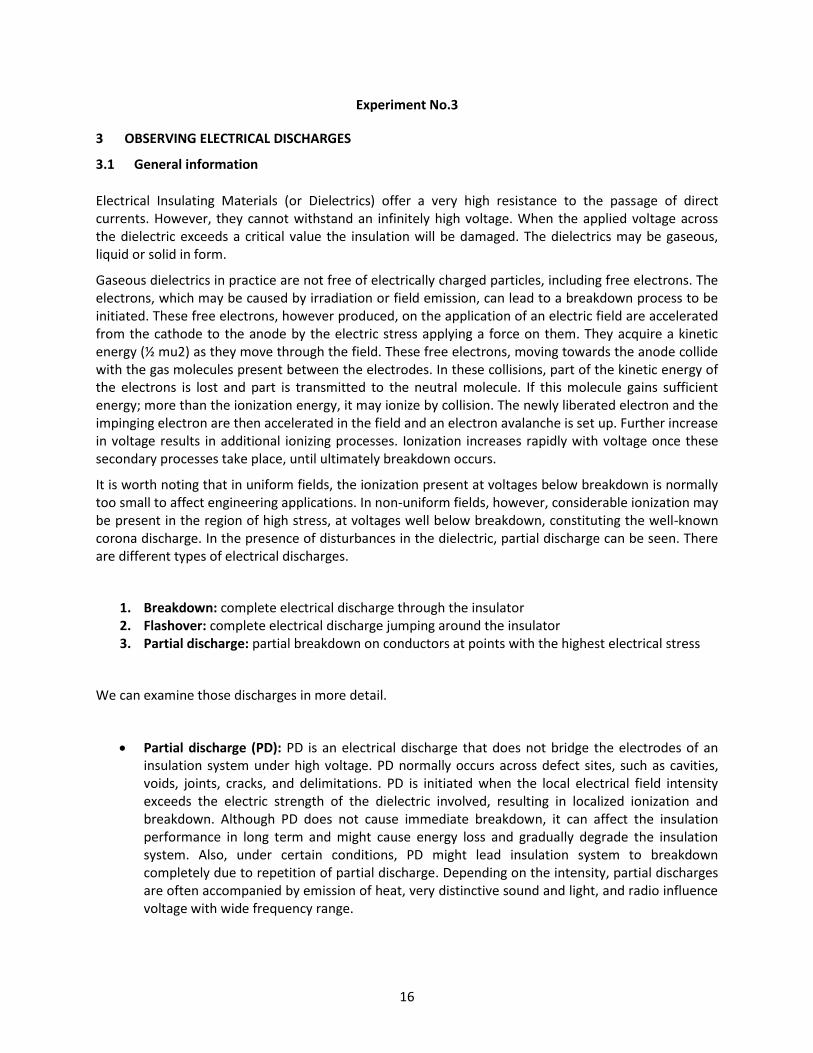
11. Ultraviolet lighting
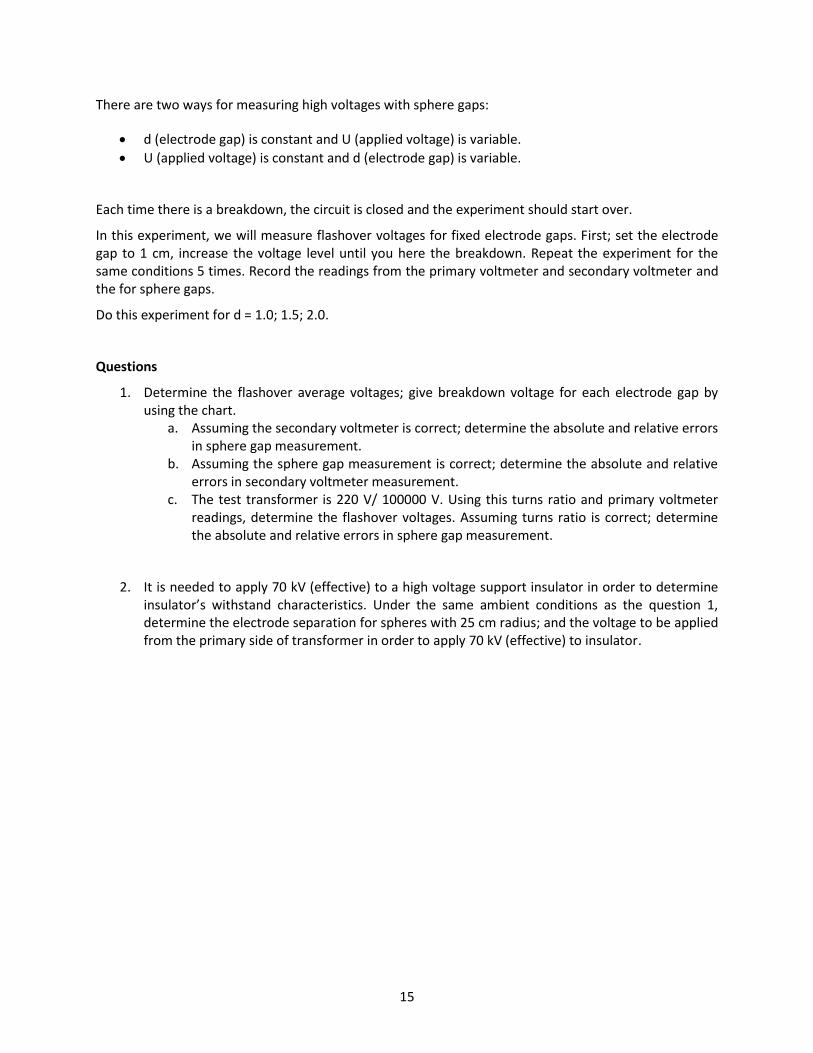
2.3 Experiment
Setup
If 0.95˂𝛿˂1.05 then 𝛅=𝛅
If 0.95˃𝛿 𝑜𝑟 1.05˂𝜹 then 𝛅=f(𝛅)
This means that f(𝛅) should be used
instead of 𝛅 in above equation.
𝑈𝑏 =𝛿
k∗ 𝑈𝑛
From the chart
Ionization creates a least
resistance path for the flashover.
d
d: electrode seperation
(gap)
D: electrode diameter
KF: sphere gap
CM: measuring capacitor
SM: peak voltage
measuring device
15
There are two ways for measuring high voltages with sphere gaps:
d (electrode gap) is constant and U (applied voltage) is variable.
U (applied voltage) is constant and d (electrode gap) is variable.
Each time there is a breakdown, the circuit is closed and the experiment should start over.
In this experiment, we will measure flashover voltages for fixed electrode gaps. First; set the electrode gap to 1 cm, increase the voltage level until you here the breakdown. Repeat the experiment for the same conditions 5 times. Record the readings from the primary voltmeter and secondary voltmeter and the for sphere gaps.
Do this experiment for d = 1.0; 1.5; 2.0.
Questions
1. Determine the flashover average voltages; give breakdown voltage for each electrode gap by using the chart.
a. Assuming the secondary voltmeter is correct; determine the absolute and relative errors in sphere gap measurement.
b. Assuming the sphere gap measurement is correct; determine the absolute and relative errors in secondary voltmeter measurement.
c. The test transformer is 220 V/ 100000 V. Using this turns ratio and primary voltmeter readings, determine the flashover voltages. Assuming turns ratio is correct; determine the absolute and relative errors in sphere gap measurement.
2. It is needed to apply 70 kV (effective) to a high voltage support insulator in order to determine insulator’s withstand characteristics. Under the same ambient conditions as the question 1, determine the electrode separation for spheres with 25 cm radius; and the voltage to be applied from the primary side of transformer in order to apply 70 kV (effective) to insulator.
16
Experiment No.3
3 OBSERVING ELECTRICAL DISCHARGES
3.1 General information
Electrical Insulating Materials (or Dielectrics) offer a very high resistance to the passage of direct currents. However, they cannot withstand an infinitely high voltage. When the applied voltage across the dielectric exceeds a critical value the insulation will be damaged. The dielectrics may be gaseous, liquid or solid in form.
Gaseous dielectrics in practice are not free of electrically charged particles, including free electrons. The electrons, which may be caused by irradiation or field emission, can lead to a breakdown process to be initiated. These free electrons, however produced, on the application of an electric field are accelerated from the cathode to the anode by the electric stress applying a force on them. They acquire a kinetic energy (½ mu2) as they move through the field. These free electrons, moving towards the anode collide with the gas molecules present between the electrodes. In these collisions, part of the kinetic energy of the electrons is lost and part is transmitted to the neutral molecule. If this molecule gains sufficient energy; more than the ionization energy, it may ionize by collision. The newly liberated electron and the impinging electron are then accelerated in the field and an electron avalanche is set up. Further increase in voltage results in additional ionizing processes. Ionization increases rapidly with voltage once these secondary processes take place, until ultimately breakdown occurs.
It is worth noting that in uniform fields, the ionization present at voltages below breakdown is normally too small to affect engineering applications. In non-uniform fields, however, considerable ionization may be present in the region of high stress, at voltages well below breakdown, constituting the well-known corona discharge. In the presence of disturbances in the dielectric, partial discharge can be seen. There are different types of electrical discharges.
1. Breakdown: complete electrical discharge through the insulator 2. Flashover: complete electrical discharge jumping around the insulator 3. Partial discharge: partial breakdown on conductors at points with the highest electrical stress
We can examine those discharges in more detail.
Partial discharge (PD): PD is an electrical discharge that does not bridge the electrodes of an insulation system under high voltage. PD normally occurs across defect sites, such as cavities, voids, joints, cracks, and delimitations. PD is initiated when the local electrical field intensity exceeds the electric strength of the dielectric involved, resulting in localized ionization and breakdown. Although PD does not cause immediate breakdown, it can affect the insulation performance in long term and might cause energy loss and gradually degrade the insulation system. Also, under certain conditions, PD might lead insulation system to breakdown completely due to repetition of partial discharge. Depending on the intensity, partial discharges are often accompanied by emission of heat, very distinctive sound and light, and radio influence voltage with wide frequency range.
17
Corona discharge in air: when the electric field across the conductor exceeds the ionization level, molecules in the air is ionized producing the discharge sound and the ozone smell, and sometimes the blue-purple light can be seen during the night.
Internal discharge in voids or cavities within dielectric: In solid or liquid insulation systems, PDs usually start within gas-filled voids due to lower dielectric constant of the void compared to surrounding dielectric in the presence of electric stress. For better understanding of above-mentioned event, the modelling of PD is essential. A lot of research has been carried out on modelling of partial discharge in voids within dielectric insulation system but the most famous PD model is called ‘abc’ model that introduced three capacitance model
Treeing channel: Treeing is an electrical pre-breakdown phenomenon in solid insulation. It is a damaging process due to partial discharges and progresses through the stressed dielectric insulation, in a path resembling the branches of a tree. Treeing of solid high-voltage cable insulation is a common breakdown mechanism and source of electrical faults in underground power cables.
Surface discharge at interfaces: surface discharges occur on dielectric material interface of solid insulators surface. Surface discharge can be seen on cables (mainly overhead line strings), bushings and on insulator surface between high voltage terminals and ground. The conductive layer can be formed on insulator surface due to increasing hydrophobicity loss in the presence of pollution under long term humidity. The rate of surface discharge can grow to generate a flashover.
3.2 Experiment
By using different configurations, we will observe different types of discharges under AC and DC voltage.
I. Arrange the construction kit to generate AC voltage.
Surface discharge
Set the needle-plane electrode system with a solid insulator to get a non-uniform field.
1. Increase a voltage until you can hear a discharge then record the voltage level. 2. Increase voltage until you can see a discharge again record the voltage. 3. Finally, increase voltage until you see breakdown, record the breakdown voltage. 4. Change the insulator. 5. Repeat all steps for the new insulator.
Partial discharge 1. First set rod-plane electrode system in the vessel. 2. Increase a voltage until you can hear a discharge if it is possible; then record the voltage
level. 3. Increase voltage until you can see a discharge again record the voltage. 4. Interrupt the circuit in case of a breakdown.
Breakdown 1. First set plane-plane electrode system in the vessel. 2. Increase a voltage until you can hear a discharge if it is possible; then record the voltage
level. 3. Finally, increase voltage until you see breakdown, record the breakdown voltage.

18
II. Arrange the construction kit to generate DC voltage. Repeat all the experiments.
3.3 Questions
1. Write a report about this experiment with all recorded voltage levels and experimental set-up. 2. Explain ‘abc’ modelling of partial discharge briefly. 3. Which methods are used for PD detection? Explain each method briefly.
19
Experiment No.4
4 IMPULSE VOLTAGES AND IMPULSE VOLTAGE GENERATOR
Impulse voltages are required in high voltage tests to simulate the stresses due to external and internal over-voltages, and also for fundamental investigations of the breakdown mechanisms. They are usually generated by discharging high voltage capacitors through switching gaps onto a network of resistors and capacitors. The peak value of impulse voltages can be determined by measuring gaps, or can be measured by electronic circuits combined with voltage dividers. The most important measuring device for impulse voltages is the cathode-ray oscilloscope, which allows the complete time characteristic of the voltage. Occasionally analog digital converter equipment may be used instead of the oscilloscope.
4.1 Impulse Voltages
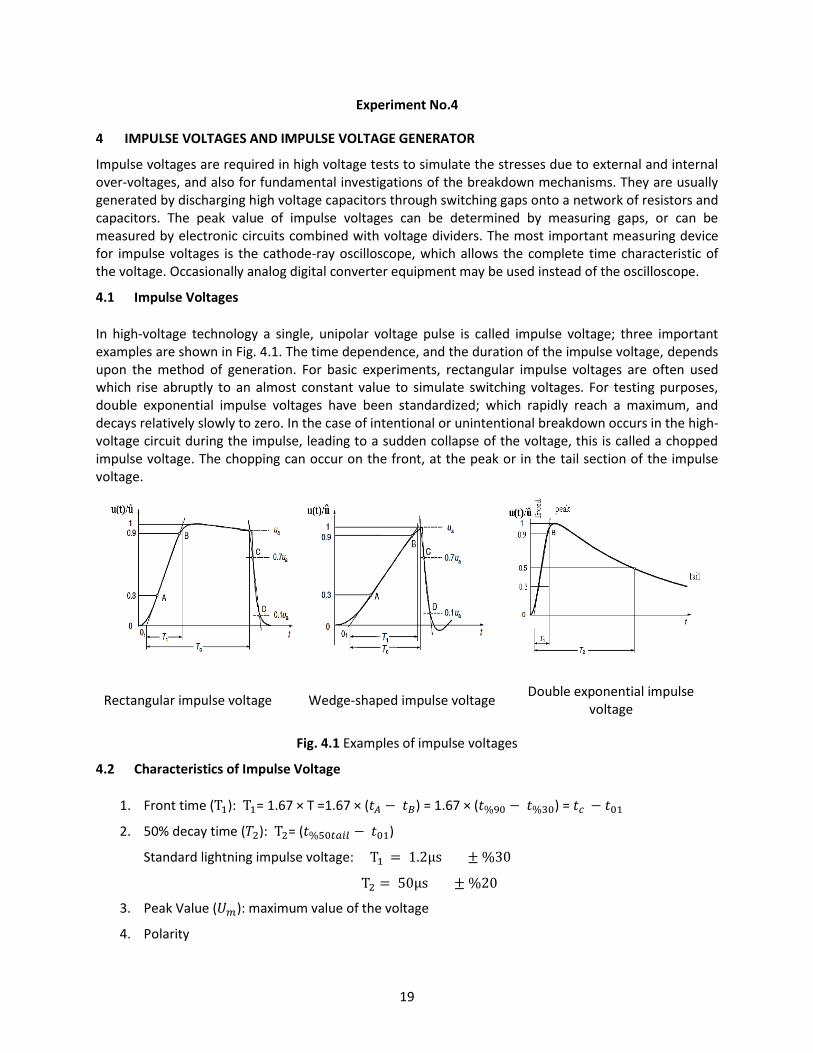
In high-voltage technology a single, unipolar voltage pulse is called impulse voltage; three important examples are shown in Fig. 4.1. The time dependence, and the duration of the impulse voltage, depends upon the method of generation. For basic experiments, rectangular impulse voltages are often used which rise abruptly to an almost constant value to simulate switching voltages. For testing purposes, double exponential impulse voltages have been standardized; which rapidly reach a maximum, and decays relatively slowly to zero. In the case of intentional or unintentional breakdown occurs in the high-voltage circuit during the impulse, leading to a sudden collapse of the voltage, this is called a chopped impulse voltage. The chopping can occur on the front, at the peak or in the tail section of the impulse voltage.
Rectangular impulse voltage Wedge-shaped impulse voltage Double exponential impulse
voltage
Fig. 4.1 Examples of impulse voltages
4.2 Characteristics of Impulse Voltage
1. Front time (T1): T1= 1.67 × T =1.67 × (𝑡𝐴 − 𝑡𝐵) = 1.67 × (𝑡%90 − 𝑡%30) = 𝑡𝑐 − 𝑡01
2. 50% decay time (𝑇2): T2= (𝑡%50𝑡𝑎𝑖𝑙 − 𝑡01)
Standard lightning impulse voltage: T1 = 1.2μs ± %30
T2 = 50μs ± %20
3. Peak Value (𝑈𝑚): maximum value of the voltage
4. Polarity
20
4.3 Single Stage Impulse voltage generator
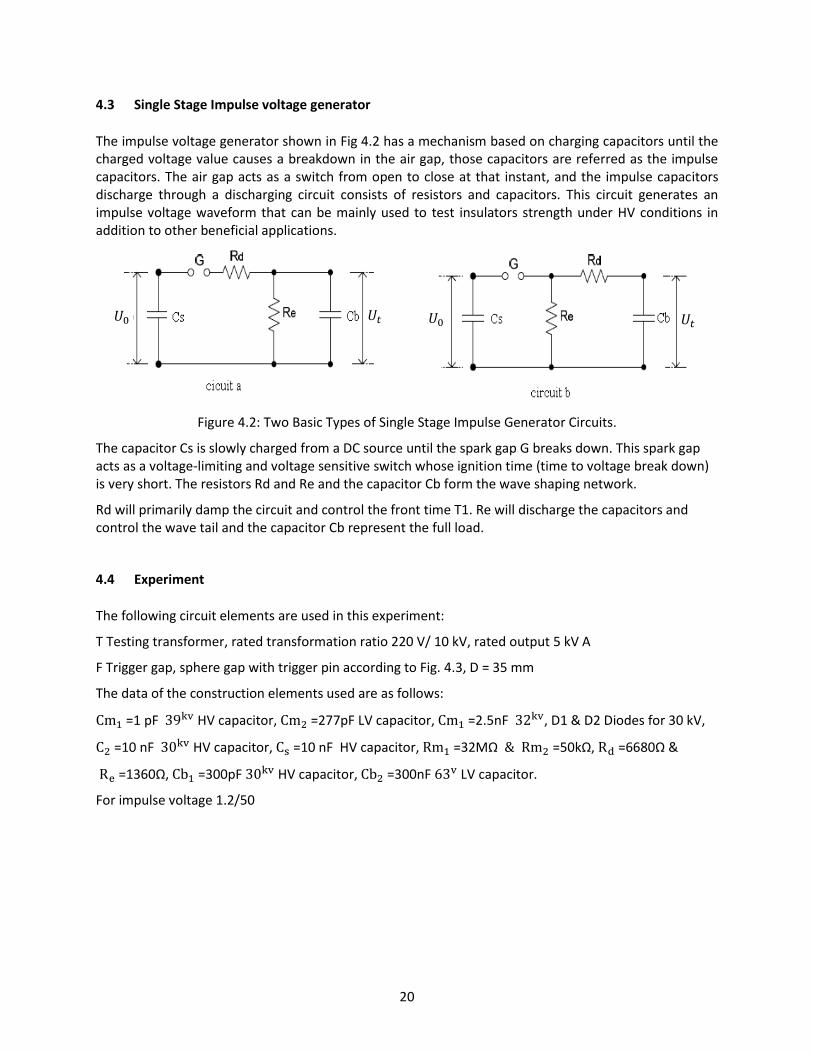
The impulse voltage generator shown in Fig 4.2 has a mechanism based on charging capacitors until the charged voltage value causes a breakdown in the air gap, those capacitors are referred as the impulse capacitors. The air gap acts as a switch from open to close at that instant, and the impulse capacitors discharge through a discharging circuit consists of resistors and capacitors. This circuit generates an impulse voltage waveform that can be mainly used to test insulators strength under HV conditions in addition to other beneficial applications.
Figure 4.2: Two Basic Types of Single Stage Impulse Generator Circuits.
The capacitor Cs is slowly charged from a DC source until the spark gap G breaks down. This spark gap acts as a voltage-limiting and voltage sensitive switch whose ignition time (time to voltage break down) is very short. The resistors Rd and Re and the capacitor Cb form the wave shaping network.
Rd will primarily damp the circuit and control the front time T1. Re will discharge the capacitors and control the wave tail and the capacitor Cb represent the full load.
4.4 Experiment
The following circuit elements are used in this experiment:
T Testing transformer, rated transformation ratio 220 V/ 10 kV, rated output 5 kV A
F Trigger gap, sphere gap with trigger pin according to Fig. 4.3, D = 35 mm
The data of the construction elements used are as follows:
Cm1 =1 pF 39kv HV capacitor, Cm2 =277pF LV capacitor, Cm1 =2.5nF 32kv, D1 & D2 Diodes for 30 kV,
C2 =10 nF 30kv HV capacitor, Cs =10 nF HV capacitor, Rm1 =32MΩ & Rm2 =50kΩ, Rd =6680Ω &
Re =1360Ω, Cb1 =300pF 30kv HV capacitor, Cb2 =300nF 63v LV capacitor.
For impulse voltage 1.2/50
𝑈0 𝑈𝑡 𝑈0 𝑈𝑡
21
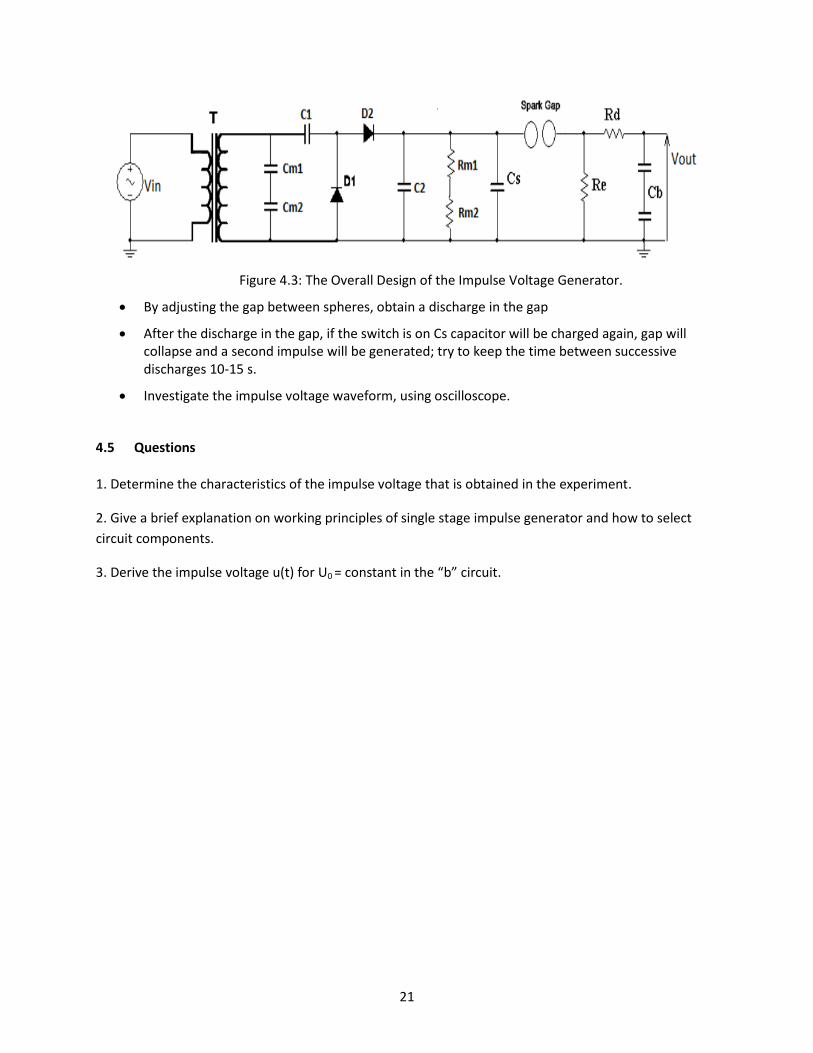
Figure 4.3: The Overall Design of the Impulse Voltage Generator.
By adjusting the gap between spheres, obtain a discharge in the gap
After the discharge in the gap, if the switch is on Cs capacitor will be charged again, gap will collapse and a second impulse will be generated; try to keep the time between successive discharges 10-15 s.
Investigate the impulse voltage waveform, using oscilloscope.
4.5 Questions
1. Determine the characteristics of the impulse voltage that is obtained in the experiment.
2. Give a brief explanation on working principles of single stage impulse generator and how to select
circuit components.
3. Derive the impulse voltage u(t) for U0 = constant in the “b” circuit.
22
Experiment No.5
5 INSULATING OILS FOR TRANSFORMERS
A liquid dielectric is a dielectric material in liquid state. Its main purpose is to prevent or rapidly quench electric discharges. A good liquid dielectric should have high dielectric strength, high thermal stability and chemical inertness against the construction materials used, non-flammability and low toxicity, good heat transfer properties, and low cost. It is obtained by refining petroleum, clear, light yellow liquid having a density lower than water. Some examples of dielectric liquids are mineral oil, resonated oil, chlorinated mineral oil, fluorinated mineral oil and silicon oil.
Where to use liquid insulators
Dielectric liquids are used as electrical insulators in high voltage applications:
1. Transformers (conductor, shield insulation and insulation between windings, cooling).
2. Capacitors (easier to fix and repair).
3. High voltage cables (has a conductor shaped like a cylinder, oil is inside the pipe).
4. HV switchgears (insulation, cooling and arc interruption).
Its function is to provide electrical insulation, suppress corona and arcing, and to serve as a coolant.
Why to use liquid insulators
Dielectric liquids are used due to:
1. High electric strength (E=Q/ԑS).
2. They transmit heat by convection.
3. They protect the solid surface against air and humidity.
4. Since they don’t have a high dielectric coefficient, they decrease electric stress on solid materials.
5. They can take the shape of the container.
5.1 Electrical properties of liquid insulators
Dielectric loss at alternating voltages is due to ionic conduction and polarization losses. Liquid insulator has some electrical properties as below:
1. Dielectric coefficient.
2. Tan 𝛅.
3. Breakdown voltage.
4. Breakdown strength (it is important for us).
All of the chemical and physical experiments on insulating oil do not give an opinion about usability of the oil. Determining the breakdown strength is a legitimate way for oils in order to decide whether it can be used as an insulator in high voltage.
23
Power transformers for high voltages contain large quantities of insulating oil for insulation and cooling. Good dielectric properties of the insulating oil are therefore an important prerequisite for perfect insulation of these transformers. Since the breakdown strength of an insulating oil depends appreciably upon its composition, preparation and ageing conditions, its determination is an important part of the high-voltage testing of trans- formers.
In VDE 0370 "Specifications for oils in transformers, instrument transformers and switchgear", a minimum quality is prescribed for new and used oils under exactly specified testing procedures. The complete testing program covers the following properties, among others: purity, density, viscosity, breakdown voltage, dielectric dissipation factor and specific volume resistivity.
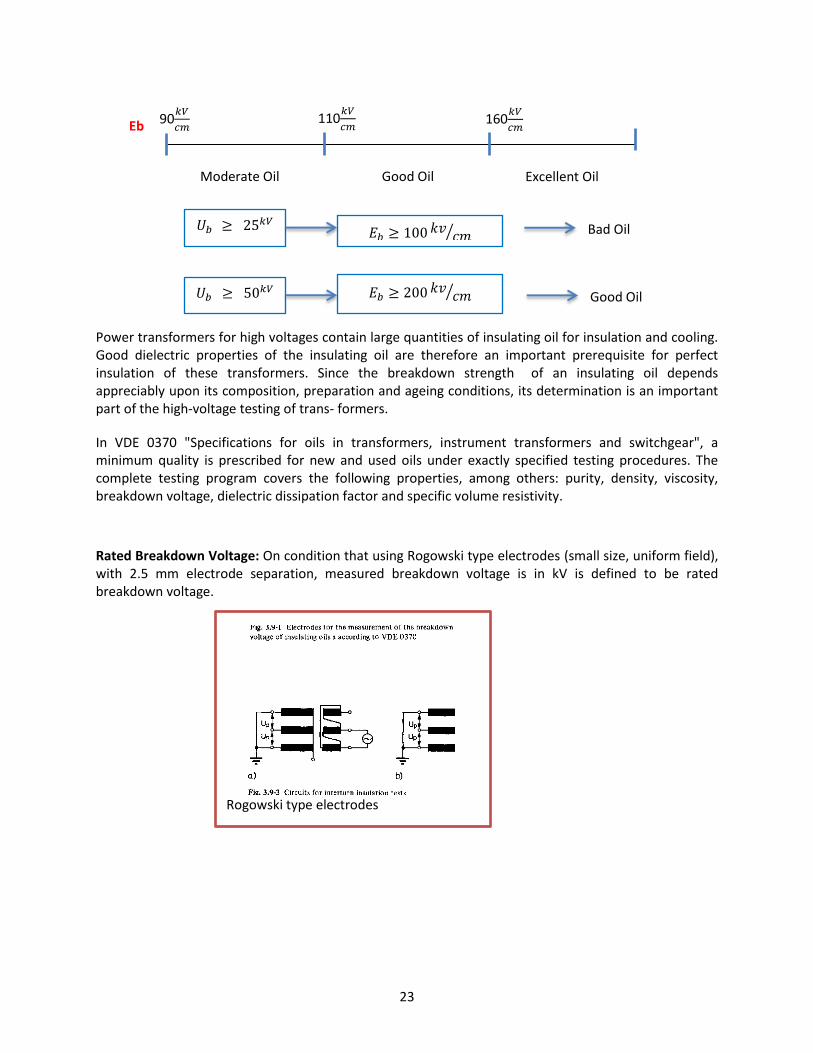
Rated Breakdown Voltage: On condition that using Rogowski type electrodes (small size, uniform field), with 2.5 mm electrode separation, measured breakdown voltage is in kV is defined to be rated breakdown voltage.
90𝑘𝑉
𝑐𝑚 110
𝑘𝑉
𝑐𝑚 160
𝑘𝑉
𝑐𝑚
Moderate Oil Good Oil Excellent Oil
Eb
𝑈𝑏 ≥ 50𝑘𝑉 𝐸𝑏 ≥ 200𝑘𝑣𝑐𝑚⁄ Good Oil
𝑈𝑏 ≥ 25𝑘𝑉 𝐸𝑏 ≥ 100𝑘𝑣
𝑐𝑚⁄ Bad Oil
Rogowski type electrodes
24
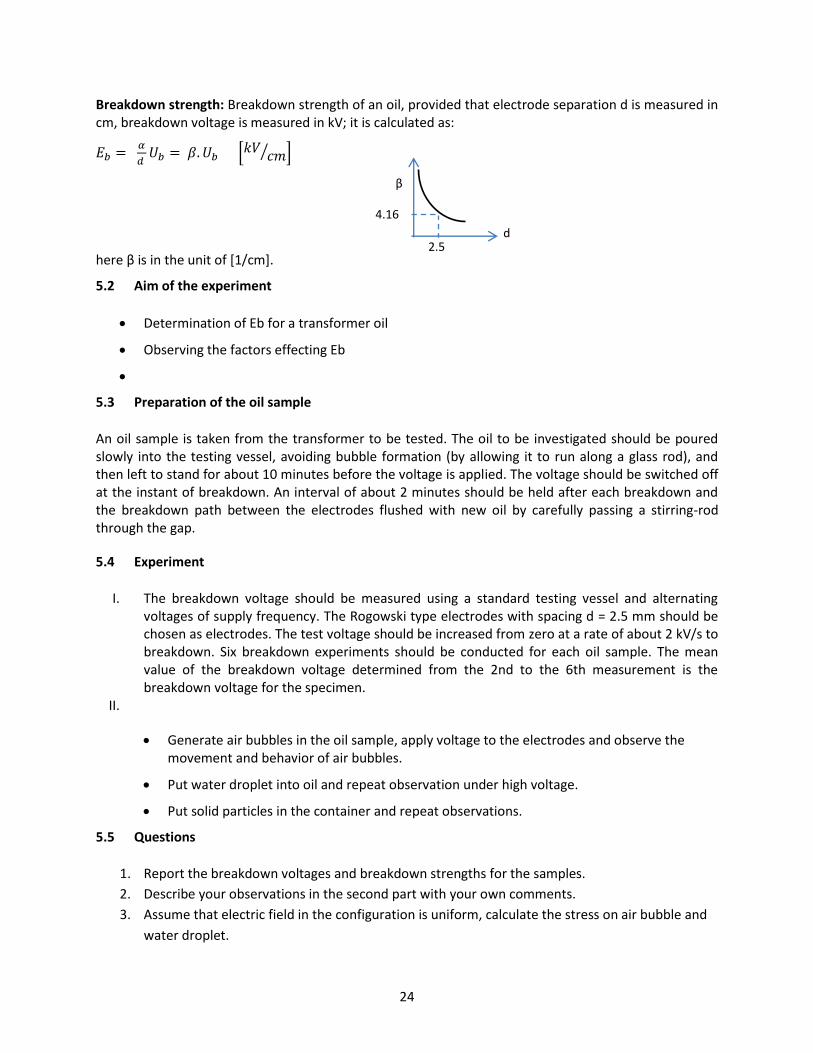
Breakdown strength: Breakdown strength of an oil, provided that electrode separation d is measured in cm, breakdown voltage is measured in kV; it is calculated as:
𝐸𝑏 = 𝛼
𝑑 𝑈𝑏 = 𝛽. 𝑈𝑏 [
𝑘𝑉𝑐𝑚⁄ ]
here β is in the unit of [1/cm].
5.2 Aim of the experiment
Determination of Eb for a transformer oil
Observing the factors effecting Eb
5.3 Preparation of the oil sample
An oil sample is taken from the transformer to be tested. The oil to be investigated should be poured slowly into the testing vessel, avoiding bubble formation (by allowing it to run along a glass rod), and then left to stand for about 10 minutes before the voltage is applied. The voltage should be switched off at the instant of breakdown. An interval of about 2 minutes should be held after each breakdown and the breakdown path between the electrodes flushed with new oil by carefully passing a stirring-rod through the gap.
5.4 Experiment
I. The breakdown voltage should be measured using a standard testing vessel and alternating voltages of supply frequency. The Rogowski type electrodes with spacing d = 2.5 mm should be chosen as electrodes. The test voltage should be increased from zero at a rate of about 2 kV/s to breakdown. Six breakdown experiments should be conducted for each oil sample. The mean value of the breakdown voltage determined from the 2nd to the 6th measurement is the breakdown voltage for the specimen.
II.
Generate air bubbles in the oil sample, apply voltage to the electrodes and observe the movement and behavior of air bubbles.
Put water droplet into oil and repeat observation under high voltage.
Put solid particles in the container and repeat observations.
5.5 Questions
1. Report the breakdown voltages and breakdown strengths for the samples.
2. Describe your observations in the second part with your own comments.
3. Assume that electric field in the configuration is uniform, calculate the stress on air bubble and
water droplet.
4.16
2.5
β
d


![HIGH VOLTAGE Breakdown phenomenafaraday.ee.emu.edu.tr/eeng451/HIGHVOLTAGE - L12 - breakdown_To… · Breakdown voltage by streamer theory d: electrode gap [cm] (electrode seperation)](https://img.pdfslide.net/doc/110x75/5f077b6b7e708231d41d3322/high-voltage-breakdown-l12-breakdownto-breakdown-voltage-by-streamer-theory.jpg)